


Compiled by | WuBlockchain
Original Link:
https://x.com/agintender/status/2088240935276876180?s=20
Disclaimer: This article is republished content. Readers may follow the original link for more information. If the author has any concerns regarding the form of republication, please contact us, and we will make revisions according to the author’s requests. This republication is for informational purposes only. It does not constitute investment advice or represent the views or position of WuBlockchain.
Lu Xun once said, “Do not try to be better. Just be different.” If the ultimate goal is to gain pricing power over the underlying asset, there is no need to challenge Nasdaq head-on where it is strongest. Instead, move the battlefield to what we do best: perps, 24/7 trading, leverage, onchain inventory, and decentralized market makers, both grassroots and institutional.
Use perps to seize the high ground of price discovery, and use bStocks to absorb inventory and correct mispricing — ultimately gaining pricing power.
When the Chicago Board of Trade (CBOT) was founded in 1848, it had yet to become the massive futures market it would later be. Chicago was emerging as the distribution hub for grain across the American Midwest, with railroads and canals bringing boatload after boatload and railcar after railcar of wheat and corn into the city.
The problem was that wheat was not a stock. Even when it was all called wheat, crops from different farms and different harvest years were not necessarily the same product. If buyers did not even know exactly what they were purchasing, it was difficult for the market to establish a unified price. One of the first things CBOT did was turn this disorder into tradable standards. After receiving authorization from the State of Illinois in 1859, CBOT was able to establish grain grades and appoint inspectors to assess quality. By 1865, margin requirements and delivery rules had also begun to be institutionalized.
This may sound less like financial innovation and more like warehouse management, but that warehouse transformed the structure of the market.
Once grain entered large grain elevators, buyers no longer needed to ask which farm a particular sack of wheat had come from. The market began trading according to standardized grades, such as a specific standard grade of wheat. In its historical review of this period, the Federal Reserve noted that grading and standardized warehousing allowed buyers to know what they were purchasing, reduced transaction costs, and created the conditions necessary for a liquid market.
Only then did futures arrive.
Farmers could sell their future harvests in advance, grain merchants could purchase future supplies, and speculators could bet on future prices without having to take thousands of bushels of wheat home. CBOT gradually evolved from early forward and “to-arrive” contracts into standardized futures. By the second half of the 19th century, Chicago grain futures had begun to perform the functions of price discovery, risk management, and transparent price quotation.
There is one easily overlooked point here.
Futures ultimately grew the fastest and attracted the largest trading volumes, but what kept them from becoming a form of gambling detached from physical goods was the grain warehouse behind them.
Background
Over one weekend in August 2026, perpetual futures on NVDA, TSLA, SNDK, and SKHY generated approximately $461 million in combined trading volume on Binance. On Sunday, all four perps traded above their previous cash-market closes. Yet when the U.S. cash market opened on Monday, all four stocks opened lower. SNDK alone recorded approximately $338 million in perp volume that weekend. Its Friday cash close was $1,212.21, it traded at $1,223.98 on Sunday, and its Monday cash open fell to $1,203.41.
The same SNDK contract gave a different answer during the U.S. Independence Day long weekend one month earlier. The cash market closed at $1,745, but SNDK traded as high as $1,841.88 on Binance on Sunday before opening at $1,828.68 in the cash market on Monday. When the cash market reopened, the stock posted a gap of approximately 4.8%. Binance’s weekend price had anticipated most of the move, although it overshot the eventual opening price.
The same product anticipated a major Monday gap on one occasion, then got the direction wrong on another after generating hundreds of millions of dollars in volume. This pushes the question surrounding 24/7 stock trading beyond extended trading hours and into market structure: trading volume is not pricing power.
If Binance merely wanted to let users trade stocks on Saturdays, extending trading hours would be enough. But when Direct Stock, TradFi Perps, and bStocks are viewed together, a different structure emerges. After the cash market closes, perps absorb directional trading, leverage, and high-frequency activity. bStocks provide stock inventory that can be held, transferred, collateralized, and hedged. Onchain protocols bring in capital from outside centralized exchanges. When the traditional stock market reopens, the question is whether the prices formed by this 24/7 market will be accepted by the U.S. equity market.
This article is not about whether bStocks are simply another form of tokenized stock. It addresses a different question: if Binance wants to establish the first price after traditional stock markets close, why should perps power the engine, and why should bStocks become the inventory and correction layers?
I. Binance Is Not Competing for Two Extra Trading Days, but for the Price After the Stock Market Closes
The stock market has a temporal gap. After New York closes at 4:00 p.m. on Friday, companies continue to release news, macroeconomic policy continues to shift, supply chains continue to evolve, and wars and politics do not wait for Nasdaq to reopen. Capital continues to reprice these stocks, but those views cannot yet enter the official order books of the U.S. cash equity market.
The issue, therefore, is not a lack of information. It is where market participants can express that information through positions once it emerges. If a market can absorb equity risk while the NYSE, Nasdaq, KRX, and HKEX are closed, it has an opportunity to conduct price discovery before the underlying cash market reopens.
Binance’s three products naturally assume three distinct roles. Direct Stock handles actual securities, corporate actions, and connectivity with traditional markets. bStocks turn stocks into assets that can be held, converted, bridged across chains, and used as collateral. TradFi Perps provide long and short exposure, leverage, and continuous trading.

If the goal is to become a primary source of price discovery, perps, rather than bStocks, are the instruments best suited to lead the charge. The reason is straightforward: the first step in price discovery is allowing market views to enter the market, and expressing those views through derivatives is less costly than doing so through spot assets.
II. Why Are Perps Better Suited to Price Discovery?
Take NVDA as an example. During a sample period from July 17 to July 22, NVDAB Spot recorded approximately $4.21 million in notional trading volume, while NVDAUSDT Perp generated approximately $418 million over the same period, a difference of roughly 99 times. Looking only at the weekend, Perp volume was approximately 37 times that of bStocks on July 18 and approximately 68 times higher on July 19.
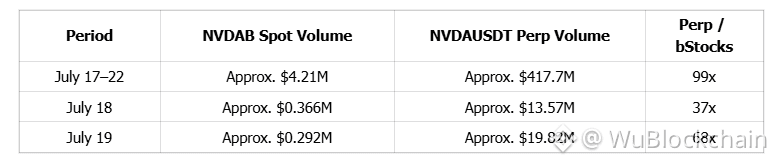
This comparison is between two products within Binance, not between Binance Perps and NVDA shares traded on Nasdaq. Trading volume in the U.S. cash equity market remains higher than that of Binance stock perps. The purpose of this comparison is to identify where new directional orders are more likely to flow after the cash market closes.
Once purchased, spot assets can be held for months. Perp positions, by contrast, are continually opened, closed, reversed, and adjusted for leverage. Traders also execute basis trades and collect funding payments, while market makers continuously rebalance their hedges. The same dollar of capital can therefore generate multiple rounds of gross turnover in the perp market. The difference is even greater for short selling. If negative NVDA news emerges on a Saturday, a trader without NVDAB inventory must first arrange a borrow before shorting the spot asset. With perps, the trader only needs to sell to express a directional view.
The first post-close price path can therefore be written as Information → Perp → Candidate Price. The role of perps is to generate a candidate price, not to guarantee that the candidate price is correct. This distinction is precisely what gives bStocks their purpose.
III. Research Methodology: Comparing 25 Market Close-to-Reopen Cycles
To observe how this initial price is formed, we collected and organized trading data for NVDAUSDT, TSLAUSDT, SNDKUSDT, SPCXUSDT, and SKHYUSDT. There were 25 observations for which the next U.S. Cash Open could be fully matched: six each for NVDA, TSLA, SNDK, and SPCX, and one for SKHY.
Each observation begins at the previous Cash Close and passes through Pure Weekend, Sunday Price, Monday Premarket, and Opening Auction before reaching the next Cash Open. The Sunday price at 19:59 ET is used to observe the market before regular U.S. equity premarket trading begins. Premarket trading resumes after 04:00 ET on Monday, Opening Auction information begins entering the market after 09:25 ET, and the official cash-market open serves as the final validation point.
The dataset addresses four questions:
1. The price analysis measures how far weekend quotes are from the next Cash Open.
2. The liquidity analysis measures the size of actual orders that displayed prices can absorb.
3. The volume analysis measures how much value changes hands in the market.
4. The trade-frequency analysis examines whether this volume reflects independent investor views or a high-turnover market driven by algorithmic trading, market making, and high-frequency trading.
A market displaying a price does not mean that price is executable. Trading volume does not mean that trades reflect independent judgment. Liquidity does not necessarily mean that a market possesses price-discovery power.
IV. Price Analysis: Error Narrows from 181.9 bp to 11.3 bp
Here, “error” refers to the absolute distance between the Binance Perp price at a given point in time and the next Cash Open, expressed uniformly in basis points (bp).
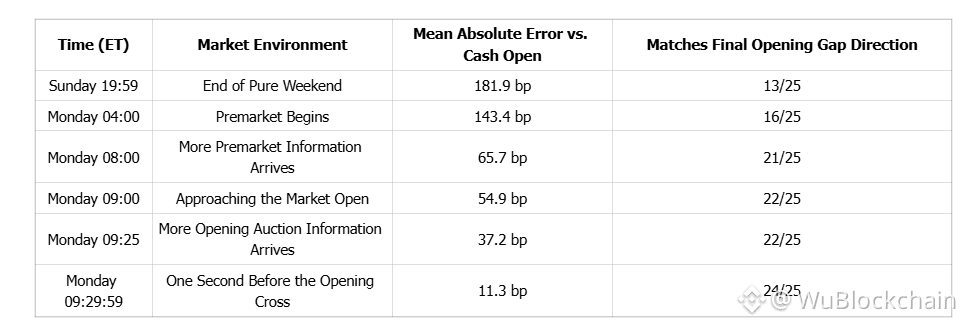
The Sunday result was 13 out of 25, or 52%. Of the 25 observations, 13 matched the eventual direction and 12 did not. This is not meaningfully distinguishable from a random 50/50 directional guess, so the dataset does not demonstrate that Binance provides consistent Weekend Price Discovery.
The 11.3 bp error at 09:29:59 also cannot simply be interpreted as evidence of Binance’s ability to “predict Monday’s open.” By that time, the U.S. premarket had already been trading for several hours, and information from the Opening Auction had also entered the market. If the perp price still deviated significantly from premarket stock quotes, the gap itself would create a trading opportunity.
The convergence from 181.9 bp to 11.3 bp therefore shows that Binance Perps gradually approach the next Cash Open as traditional markets come back online. It does not prove that Binance leads the cash market. Answering that question would require a lead-lag analysis comparing Binance Perps, bStocks, and the last, bid, and ask quotes in the U.S. premarket at the same second.
If the premarket moves from 100 to 105 first and the perp reaches 105 afterward, the perp is following. If the perp reaches 105 first and the premarket subsequently converges toward it, only then does the move provide evidence of price discovery and price leadership.
V. The Pre-Open Spread Does Not Move in a Straight Line: SNDK Was Just 2 bp Away at 09:25, but Diverged Again Five Minutes Later
During the 2026 Independence Day long weekend from July 3 to July 5, the NVDA, TSLA, and SNDK perps followed different paths from Sunday through the final second before the Opening Cross.
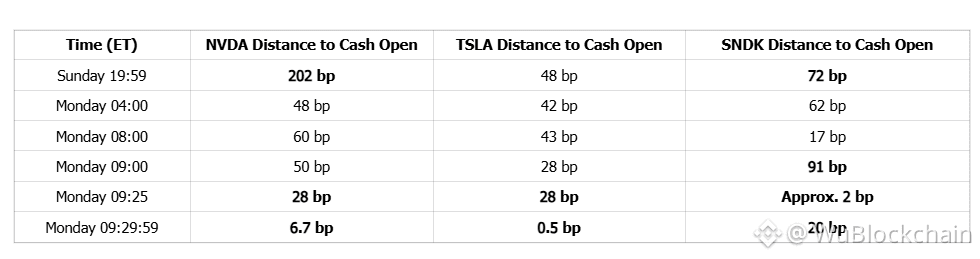
Viewed this way, NVDA followed more of an error-correction process. It traded at $198.35 on Sunday, while the eventual Cash Open was $194.42, a difference of approximately 202 bp. The price returned to $194.97 by 09:25 and reached $194.55 at 09:29:59, narrowing the error to 6.7 bp.
TSLA had the direction right from Sunday. Its Cash Close was $393.45, its Sunday price was $399.40, and its Cash Open was $397.50. The market priced in the upward direction in advance, but the Sunday move overshot the eventual Opening Gap.
SNDK’s path illustrates the issue even more clearly. At 09:25, the perp traded at $1,828.97, while the eventual Cash Open was $1,828.68, a difference of less than 2 bp. By 09:29:59, however, the perp had fallen to $1,825, widening the error to approximately 20 bp.
This shows that pre-open prices do not move in a straight line toward the final opening price. Premarket trading, NOII, market-maker inventories, and orders placed during the final minutes can all change the price. Determining which market possesses pricing power requires examining the entire lead-lag path, rather than comparing only two snapshots from Sunday and Monday at 09:29:59.
VI. Perps Are Not Necessarily Closer to the Next Open Than bStocks
Another low-frequency sample uses the UTC end-of-day prices of NVDAB, TSLAB, MUB, and COINB to compare their handoff into the next U.S. Cash Open. Perp data are included for instruments where they are available.
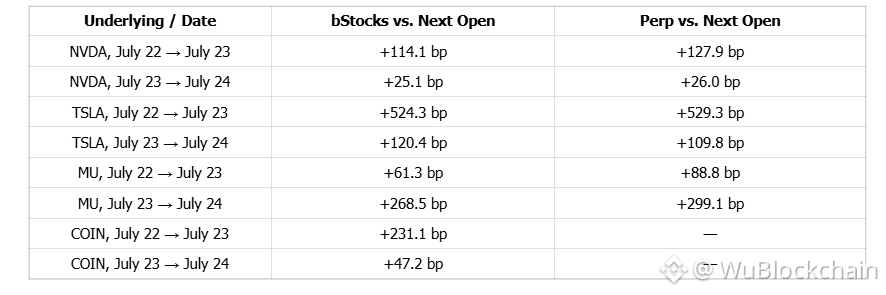
The median handoff error across the eight bStocks observations was approximately 117.2 bp, compared with approximately 118.9 bp across the six comparable Perp observations.
NVDA from July 23 to July 24 provides a useful example. NVDAB traded at $207.97, the Perp traded at $207.99, and the next Cash Open was $207.45. Both were approximately 25–26 bp above the opening price. The value of bStocks here was not that they produced a price closer to the underlying equity market than the Perp. Rather, they preserved the stock price formed while the cash market was closed as a form of spot-like inventory that could be held, transferred, converted, and financed.
Perps move the price. bStocks turn the price into an asset.
VII. A Stock-by-Stock Breakdown: NVDA as Error Correction, TSLA as Overshoot, SNDK as a Stress Test, and SPCX as a Product Experiment
Across the NVDA sample, the Sunday price had a mean absolute error of approximately 113 bp relative to the next Cash Open, with the direction matching in 3 of 6 observations. For TSLA, the Sunday MAE was approximately 81 bp, with the direction matching in 4 of 6 observations. SPCX recorded an MAE of approximately 149 bp and matched the direction in 3 of 6 observations, while SNDK reached approximately 351 bp and matched the direction in 3 of 6 observations. By 09:29:59, their descriptive mean absolute errors had fallen to approximately 11.8 bp, 8.6 bp, 9.4 bp, and 16.0 bp, respectively.

NVDA is better suited for observing how pricing errors are corrected. In the Independence Day observation, the Sunday price was $198.35, while the Cash Open was $194.42, a deviation of 202 bp. The price then steadily converged toward the $194 level.
TSLA is a useful example of Overshoot. Its Cash Close was $393.45, its Sunday price was $399.40, and its Cash Open was $397.50. The direction was right, but the magnitude was too large.
SNDK displays both regimes within the same stock. During the Independence Day long weekend, it priced in most of the +4.8% Opening Gap in advance. On another weekend in August, however, its Friday Cash Close was $1,212.21, its Sunday price was $1,223.98, and its Monday Cash Open fell to $1,203.41. This time, the direction was wrong.
SPCX occupies a different position. Its Sunday MAE was approximately 148.8 bp, with the direction matching in 3 of 6 observations. However, the stock progressed from a Pre-IPO Perp to a publicly traded stock, a TradFi Perp, and SPCXB. Within Binance, the same underlying risk underwent a product migration in which the derivative price came first and the cash equity followed later. This makes SPCX better suited for observing how a 24/7 pricing system connects with a cash market that emerges afterward.
Prices formed while the cash market is closed should therefore not be classified simply as “right” or “wrong.” They can be further divided into Direction Discovery, Magnitude Discovery, and Correction Dependency. These categories are discussed later.
VIII. SPCX: A Perp-to-Equity Pricing Experiment from Pre-IPO Perp to Public Stock
SPCX differs structurally from NVDA, TSLA, and SNDK. When Binance Futures launched its Pre-IPO Perpetual product in May 2026, SPCXUSDT was the first contract, allowing traders to take positions on SpaceX’s prospective public-market valuation. After SpaceX went public, SPCXUSDT was converted into a standard TradFi Perp, while SPCX Direct Stock and SPCXB were also added. In other words, the stock first had a derivative price, followed by a public cash market against which that price could be validated, and finally bStocks that could be held and moved onchain.
This created a rare experimental setting. For NVDA and TSLA, Binance added a 24/7 risk layer outside an already mature market. SPCX, by contrast, underwent a migration from Pre-IPO Perp → Public Stock → TradFi Perp → bStocks. Only after the cash equity emerged did the continuously traded derivative price gain a fixed Monday Cash Open against which it could be repeatedly validated.
The SPCXUSDT data for six complete weekends are shown below:
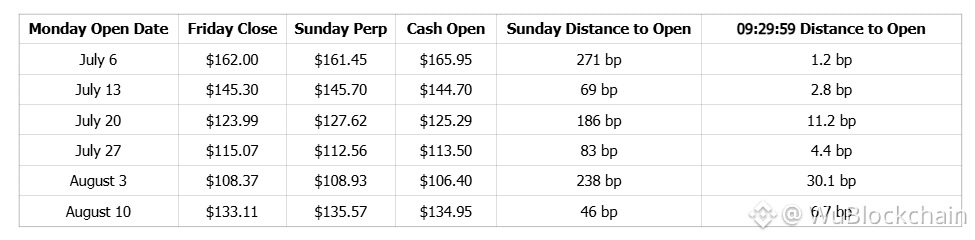
Across the six observations, the Sunday Price matched the eventual direction in 3 of 6 cases. Its mean absolute error relative to the next Cash Open was approximately 148.8 bp, with a median of approximately 134.4 bp. By Monday at 04:00 ET, the mean error had fallen to 114.1 bp. It declined further to 102.0 bp at 08:00, 53.8 bp at 09:00, 29.3 bp at 09:25, and 9.4 bp at 09:29:59. After 08:00, all six observations matched the direction of the eventual Opening Gap. By then, however, the premarket had already returned. The curve therefore demonstrates price handoff and convergence, not that Binance completed price discovery on its own.
SPCX also provides a concentrated view of Overshoot. Across the three weekends when the Sunday Price got the direction right and the Opening Gap exceeded 50 bp, the Sunday Move was approximately 2.79 times the eventual gap on July 20, 1.60 times on July 27, and 1.34 times on August 10. This suggests that Overshoot may have little to do with how recently the product was launched. Even after listing, the market can still overshoot.
The August 10 path illustrates the issue more clearly. The Friday Close was $133.11, the Sunday Price had already reached $135.57, and the Monday Cash Open was $134.95. The Sunday Price was only approximately 46 bp above the eventual Open. At 08:00 on Monday, however, SPCXUSDT briefly surged to $138.80, widening the distance from the eventual Cash Open to approximately 285 bp. By 09:29:59, it had returned to $134.86, leaving a gap of only approximately 6.7 bp. A price can converge, move away again after the premarket returns, and then converge once more.
SPCX also does not trade like a quiet spot market. Across six weekends, SPCXUSDT generated approximately $1.546 billion in total volume, about 10 times the comparable NVDA figure. Its underlying fills totaled approximately 3.58 million, averaging 3.45 fills per second. Its scale sits between SNDK and NVDA, making it look more like an always-on, programmatic risk engine. For bStocks, the implication is direct: the faster the Perp turns over, the greater the need for market makers to use an inventory leg such as SPCXB or SPCX to absorb delta whenever customer order flow carries a net directional imbalance.
SPCX is therefore not proof that Binance has already secured weekend pricing power. It is better understood as a miniature version of the entire product stack: the Perp generates a candidate price, SPCXB preserves that price as an asset, the Stock provides an outlet into the cash market, and borrow availability and cross-market arbitrage determine whether a mispriced quote can be attacked from both directions. It shows what Binance’s infrastructure might need to look like if it intends to compete for pricing power while traditional markets are closed.
IX. Weekend Volume Analysis
Across the six weekends in the sample, NVDAUSDT generated approximately $154 million in cumulative trading volume, TSLAUSDT approximately $107 million, SPCXUSDT approximately $1.546 billion, and SNDKUSDT approximately $2.922 billion.
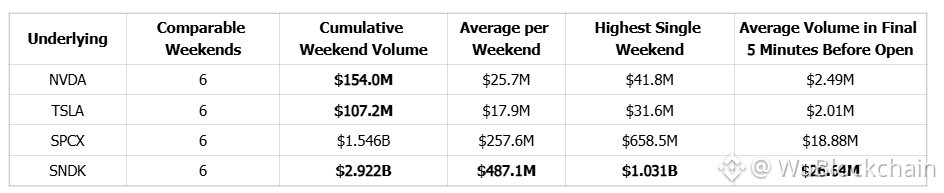
The table shows a clear hierarchy in trading volume. Across six weekends, SNDK generated $2.922 billion, SPCX $1.546 billion, NVDA $154 million, and TSLA $107 million. SPCX volume was approximately 10 times that of NVDA and 14 times that of TSLA, but only about half that of SNDK. This ranking does not have a linear relationship with company market capitalization or traditional stock-market recognition. Gross volume therefore cannot be interpreted directly as organic investor demand.
Another data point is also worth noting. During the final five minutes before the open, SNDK still generated an average of approximately $26.64 million in volume across the six observations, compared with approximately $18.88 million for SPCX, $2.49 million for NVDA, and $2.01 million for TSLA. As the Opening Cross approached, the Perp market did not simply stop and wait for the outcome. It continued to reprice.
The central questions behind volume are who generated these trades, how frequently they occurred, and how large each trade was.
X. Trade-Frequency Analysis: SNDK at 7.3 Fills per Second and SPCX at 3.45
Once SNDK’s $2.922 billion and SPCX’s $1.546 billion in volume are broken down into individual trades, the shape of the market changes.
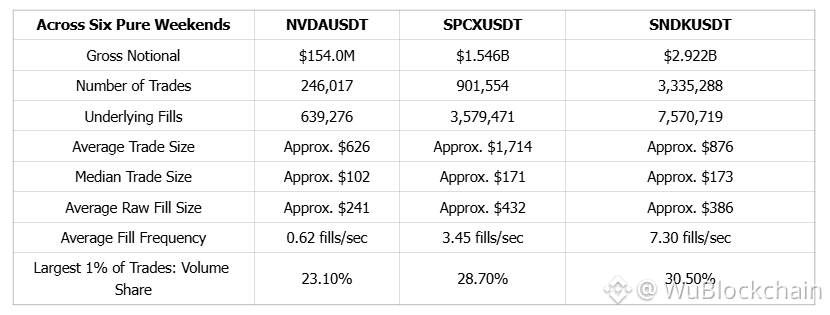
Across the six weekends, SNDK recorded approximately 7.57 million fills, averaging about 7.3 fills per second. SPCX recorded approximately 3.58 million fills, averaging 3.45 fills per second, while NVDA recorded approximately 640,000 fills, averaging 0.62 fills per second. The primary difference among the three stocks lies in trading frequency.
Interestingly, the difference in trade size is much smaller than the difference in trading frequency. SNDK’s average raw fill was approximately $386, compared with approximately $432 for SPCX and $241 for NVDA. SPCX’s median trade size was approximately $171, also close to SNDK’s $173. The large turnover in SNDK and SPCX was not generated by a small number of exceptionally large trades, but by a much denser flow of transactions.
Because we do not have access to account-level information, we do not know how many independent participants, institutions, or market makers generated these fills. Based on the scale and frequency of trading, however, this article leans toward the view that billions of dollars in volume do not represent an equivalent amount of independent investment conviction. In other words, the volume should not be interpreted simply as institutions placing directional bets.
We believe that both SNDK and SPCX have developed into high-velocity equity derivatives markets, with SNDK operating at an even higher speed.
SNDK analysis: https://substack.com/@agintender/note/c-311284509?utm_source=notes-share-action&r=8gs9xi
The 24-hour distribution of SPCX volume provides another layer of information. Between 00:00 and 06:00 ET, the market still generated approximately 20.8% of weekend gross notional and 20.9% of raw fills, averaging about 2.9 fills per second during these overnight hours. Across the six weekends, the taker buy/sell notional imbalance was approximately -1.16%, indicating a broadly balanced two-way market. This pattern more closely resembles an around-the-clock market jointly produced by market making, algorithmic trading, and cross-market arbitrage.
XI. Trade Size Also Suggests That Perps and bStocks May Serve Two Different Types of Order Flow
SNDK Perp had an average raw fill of approximately $386, compared with approximately $432 for SPCX and $241 for NVDA. The median aggTrade sizes for SPCX and SNDK were approximately $171 and $173, respectively. A Binance Research report stated that approximately 93% of bStocks transactions were fractional trades, with a median trade size of only $18.81, while approximately 80% of tokenized-stock trading came from users in emerging markets. (https://www.binance.com/en/research/analysis/opportunity-only-tokenized-stocks-unlock)
It is important to note that this article and Binance Research use different data definitions. We therefore cannot simply divide $386 by $18.81 and conclude that the average Perp user position is 20 times the size of the average bStocks user position. Viewed together, however, the datasets suggest a division of labor between the products. bStocks are better suited to small spot transactions, long-term inventory, retail users across time zones, and onchain participants. Perps are more likely to concentrate leverage, basis trading, market making, HFT, and high-turnover capital.
One market creates holdable stock inventory, while the other allows the same risk to change hands at high speed. Only when market makers and arbitrageurs connect the two can a broader pricing network emerge. At present, these two products are not yet fully integrated, leaving room for further development.
XII. The Greater the Perp Volume, the More Important the Inventory Role of bStocks Becomes
If Perp volume can be dozens of times greater than bStocks volume, why does Binance still need bStocks? The answer lies on market makers’ books.
Customer and market-maker Perp positions mirror one another. When customers are net long, market makers are short Perps and must purchase positive-delta bStocks or Stock. When customers are net short, market makers are long Perps and must sell their bStocks inventory or borrow bStocks and sell them.
Perps address trading speed. bStocks determine where the risk sits on the balance sheet. If net customer order flow continues in one direction, market makers accumulate delta. That risk cannot circulate within the Perp market forever. An inventory leg must ultimately absorb it.
High Perp volume is therefore not evidence that bStocks have failed. On the contrary, it is one of the reasons bStocks need to exist. The faster derivatives turn over, the greater the demand for inventory, financing, and securities borrowing. Retail users may barely notice this function, but it is essential for market makers.
XIII. bStocks Are Not an Immediate Price Anchor: 1:1 Backing Is More Like a Terminal Constraint
At this point, it may be tempting to describe bStocks as the spot anchor for Perps and compare the relationship with that between USDT and the U.S. dollar. However, the mechanism differs across market conditions, and that is not how it works during stock-market weekends.
Converting NVDAB into NVDA Stock on a Saturday does not mean that Nasdaq has an active cash market at the same moment where the other leg of the arbitrage can be completed. What the trader receives is inventory that can ultimately reconnect with real shares, not an immediately executable cash-arbitrage trade.
The 1:1 backing therefore functions more like a terminal constraint. The market knows that bStocks can ultimately reconnect with real shares and that the cash market will reopen. Prices may deviate while the cash market is closed, but once the divergence exceeds funding costs, inventory costs, event risk, and execution frictions, traders gain an incentive to wait for traditional markets to reopen and then close the spread.
The role of bStocks is not to tell Perps what the “correct price” should be. It is to pair the candidate price generated by Perps with inventory that can be held, hedged, and arbitraged.
This is why it is more accurate to describe bStocks as the Inventory Layer and Correction Layer.
XIV. Once bStocks Move Onchain, the Priority Is Putting Inventory to Work
If NVDAB can only remain in a Binance Spot account, it is merely a layer of spot inventory within a centralized exchange. Once bStocks move onchain, they can enter DEX, lending, collateral, and margin systems, changing the market structure.
PancakeSwap has launched bStocks pools including TSLAB, NVDAB, MUB, and SNDKB. Lista supports selected bStocks as collateral for borrowing stablecoins, while Aster allows eligible bStocks to enter Multi-Assets Mode.
Youcanshortit.com allows users to lend out bStocks for leveraged shorting. Pundi X Basket allows users to freely customize their own portfolios and index ETFs, which other retail investors can then copy.
These products do not solve the same problem, but they point in the same direction: enabling NVDAB, SNDKB, and SPCXB to be traded, collateralized, financed, used for market making, and hedged, rather than simply sitting idle in wallets.
It is important to distinguish between expanding utility and adding liquidity. When an NVDAB token is locked in a lending protocol as collateral, its utility increases, but it does not necessarily add new bids or offers to the market. It begins to increase the market’s usable inventory only when market makers, arbitrageurs, or short sellers can borrow it and deploy it on a CEX or DEX, or use it to hedge Perp exposure.
The ideal onchain cycle is therefore not simply Binance → Wallet → DEX, but bStocks → DEX / Lending / Credit Pool → Market Maker → Perp Hedge → CEX → Stock Conversion. Inventory begins to turn over only when the same bStocks can be reused across different accounts.
For bStocks, TVL is not the most important metric. A more meaningful question is how many times a unit of stock inventory can be used. If $1 million in NVDAB is simply locked in a protocol, it remains $1 million in static assets. It begins to function as market infrastructure only when part of that inventory can be borrowed by market makers to provide quotes, hedged with Perps, and returned to the inventory pool after trades are completed.
Binance’s own research has also reported that 2,806 users engaged in arbitrage-like trading across bStocks, Perps, and Equity, involving approximately $216 million. About 58.5% of bStocks users also used Perps and/or Equity. This suggests that grassroots quantitative traders have always existed, and the next step should be activating them as seed users for bStocks.
Once bStocks move onchain, one possible path is to use NVDAB as collateral to borrow stablecoins, which can then be transferred back to a CEX to trade NVDAUSDT Perps. Another path is to deposit NVDAB into a DEX liquidity pool and use NVDAUSDT Perps to hedge the LP position’s equity delta.
In this way, bStocks connect CEX Perps, CEX Spot, real Stock, DEXs, lending protocols, and stablecoins within a single risk network.
This is also what distinguishes bStocks from ordinary “stock tokens.”
XV. What This System Lacks Is Not More Tickers, but Borrow
Using NVDAB as collateral to borrow USDT is financing. Borrowing NVDAB and then selling it is stock borrow. Both involve borrowing, but they play different roles in price discovery.
If the Perp is expensive and bStocks are cheap, arbitrageurs can go Long bStocks + Short Perp. This trade is relatively easy to execute. Buying the cheaper spot asset and selling the more expensive derivative compresses the Perp premium.
If bStocks are expensive and Perps are cheap, the trade should be reversed: Short bStocks + Long Perp. The problem is that this trade cannot be executed without borrowable inventory. When an asset trades at a discount, anyone with cash can buy it. When it is overvalued, however, not everyone has inventory available to sell.
The maturity of bStocks should therefore not be measured solely by the number of listings. Borrow Depth, Borrow Rates, available inventory, and the stability of borrow during event-driven weekends determine whether the market has the ability to correct mispricing in both directions.
Without borrow, bStocks remain only an asset layer and cannot realize their intended advantages on the platform.
Once borrow is in place, bStocks begin to resemble a securities inventory market.
Market-making demand drives Borrow → Borrow demand pushes rates higher → Higher rates attract more deposits → bStocks volume and demand increase → The cycle repeats.
XVI. Deepening bStocks Liquidity on a CEX Still Depends on Borrow Ecosystem Integration
Returning to Binance CEX, the liquidity bottleneck for bStocks becomes clearer. When customers sell large amounts of NVDAB, market makers can buy NVDAB and hedge by shorting NVDAUSDT. On the Bid Side, the primary resource consumed is cash. When customers buy large amounts of NVDAB, however, market makers must continuously sell the stock to them. Once their inventory is depleted, market makers without access to Borrow can only reduce Ask Size, raise their offers, or withdraw from the market.
The bStocks spot order book therefore has an inherent inventory constraint. Without Borrow, market makers can quote only against the amount of stock they already hold. With Borrow, inventory changes from a hard limit into a priced resource. Market makers can borrow NVDAB and sell it to customers while going Long Perp or hedging with Stock. As demand for stock borrowing increases, the Borrow Rate rises, creating an incentive for holders to deposit more bStocks into the inventory pool.
Borrow also solves the Reverse Basis problem discussed earlier. When the Perp is expensive and bStocks are cheap, anyone with sufficient capital can execute Long bStocks + Short Perp. When bStocks are expensive and the Perp is cheap, the required trade is Short bStocks + Long Perp. If no inventory is available to borrow, this arbitrage channel cannot function.
Borrow, of course, does not operate in isolation. Deep CEX liquidity also requires Stock ↔ bStocks Conversion to replenish inventory, Portfolio Margin to reduce the capital required for bStocks-Perp hedges, and a Market Maker Program to turn that inventory into Bids and Asks. Maker Rebates can encourage market makers and protocols such as Pundi X Basket to operate trading bots, but Borrow determines whether those bots have inventory to trade.
In summary:
Perps generate orders. bStocks provide stock inventory. Borrow puts that inventory into circulation.
If Borrow develops successfully, bStocks can move one step beyond being “tradable stock tokens” and become securities inventory that can support market making, financing, and two-way arbitrage.
Compared with Wall Street, crypto’s greatest weapon is decentralization. Borrow can mobilize institutional and grassroots decentralized market makers to participate in the weekend price-discovery contest.
XVII. The Endgame Is Not bStocks vs. Perps, but Four Markets Working Together
If Borrow, Conversion, and onchain depth all mature, the same NVIDIA exposure could simultaneously trade at four different prices.
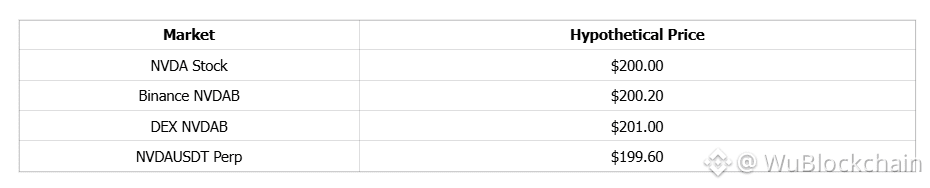
At that point, a cross-venue trader’s first concern would not be NVIDIA’s EPS next year, but which market is expensive and which is cheap.
If DEX NVDAB trades at $201 while the Perp trades at $199.60, a trader can sell the expensive leg and buy the cheap one. If the trader has no bStocks inventory, they can Borrow it. If they lack cash, they can post other assets as Collateral. If they do not want exposure to NVIDIA’s overall direction, they can neutralize the delta with the other leg. Once the cash market reopens, the trader can rebalance inventory according to the Basis among Stock, bStocks, and Perps.
At that point, bStocks are no longer a standalone trading product. They become an asset format that allows risk to migrate across Stock ⇄ CEX Spot ⇄ DEX ⇄ Perp ⇄ Credit.
Prices would no longer be dictated by any single exchange, nor mechanically produced by liquidity. They would emerge as arbitrageurs across different markets repeatedly deploy their balance sheets to compress spreads.
XVIII. Future Assessments of bStocks Maturity Should Not Focus Only on Volume, Liquidity, and the Number of Listings
Measuring bStocks only by AUM, 24-hour Volume, and the number of listed tickers would completely understate their role in market structure. It would be like taking something built to transcend the existing market stack and using it merely to run errands.
Volume and liquidity are only part of the picture. Gross Volume can also be inflated by algorithmic turnover and high-frequency trading.
If Binance wants to establish bStocks as the Inventory Layer for a weekend stock market, Borrow Depth, executable spot depth, Conversion Capacity, and the stability of the Perp-bStocks Basis may matter more than listing hundreds of additional tickers or adding depth to any single spot market.
A best bid and ask of $1 million is not fundamentally different from a best bid and ask of $10 million. If depth alone is the objective, why not trade on Nasdaq? More valuable than depth is determining which price is “correct.”
Why? Because liquidity at an “incorrect” price is ultimately fuel for arbitrage.
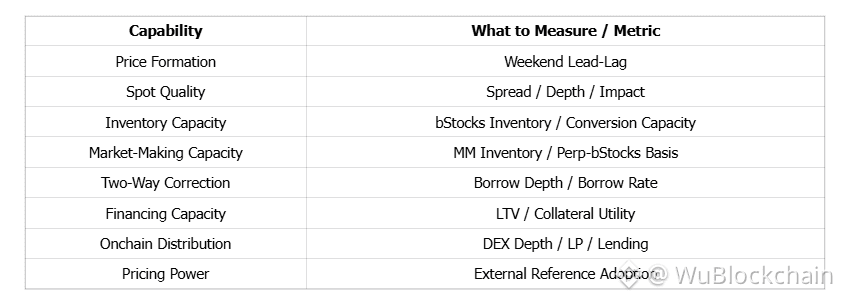
This article organizes the relevant capabilities and their corresponding metrics as follows:
Conclusion: Perps Compete for Pricing Power; bStocks Determine Whether That Price Can Become the Market Price
When price, volume, trading frequency, order-book, and underlying stock data are considered together, bStocks emerge as something far more significant than so-called “tokenized stocks.”
Perps will become the new darling of the derivatives market. Beyond factors such as volume, regulation, taxation, and operations, Wall Street will eventually understand what OI > Shares means. OI is money, and it is money that does not dilute control, require external disclosure, or face the same tax constraints.
If Binance wants to compete for pricing power after traditional stock markets close, Perps will lead the charge. In one NVDA sample, Perp volume was 99 times that of bStocks. SNDK generated $2.922 billion across six Pure Weekends, SPCX generated $1.546 billion, and SKHYNIX generated more than $2.4 billion across six UTC weekend windows. These figures show that some equity-risk trading is migrating to 24/7 derivatives markets when traditional stock exchanges are closed.
The same dataset also shows that Volume and Price Discovery are not equivalent. SNDK could generate hundreds of millions of dollars in a single weekend and still get the direction wrong. Four stocks could produce $461 million in combined volume and all point in the wrong direction. After SPCX was added, the Sunday direction matched the eventual opening direction in only 13 of 25 U.S. market close-to-reopen observations, or 52%. SNDK’s $2.922 billion translated into approximately 7.3 fills per second, while SPCX’s $1.546 billion translated into approximately 3.45 fills per second. These high-turnover figures cannot be interpreted directly as an equivalent amount of independent investment conviction.
Perps solve the problem of keeping prices live while traditional markets are closed. For those prices to gain credibility, however, the market must also answer another question: who corrects them when they are wrong?
bStocks are the answer. They can serve as the inventory leg for market makers hedging Perps, the spot leg for Basis traders, a core holding for long-term investors, Collateral for lending protocols, an equity asset for DEX LPs, and a tool for managing cross-session Inventory through Stock Conversion. If Borrow is fully developed, bStocks can also become securities inventory available to short sellers, allowing arbitrageurs to attack the overvalued side of the market.
The relationship between Perps and bStocks should therefore be understood as follows:
Perps produce the first draft of the price. bStocks turn that first draft into an asset that can be held, financed, transferred, and challenged by the market.
One day, if major NVIDIA news breaks on a Saturday, NVDAUSDT may move first, followed by a repricing of NVDAB. The Perp-bStocks Basis may widen, Borrow Rates may change, DEX LP positions may begin to rebalance, market makers may adjust inventory, and arbitrageurs may compress the spread. The U.S. premarket will then reopen, followed by the 09:30 Opening Cross. At that point, the question worth asking will no longer be whether Binance guessed the weekend move correctly, but:
Whose price converges toward whose?
If Binance continues to chase the traditional market after the premarket opens, it is a 24/7 stock exchange. If, after the cash market reopens, it begins converging toward a price repeatedly traded over the preceding dozens of hours across Perps, bStocks, DEXs, lending protocols, and inventory markets, and if external OTC desks, risk systems, and market-data platforms also begin referencing that price, then Binance will have gained more than a few additional trading hours. It will have gained:
Pricing power in the stock market.
That is the foundation for reaching three billion users.
Postscript
For more information about market-making and arbitrage strategies for bStocks on Binance, please visit my Substack.(https://agintender.substack.com/p/bstocks-b-nasdaq-perp?r=8gs9xi&utm_campaign=post&utm_medium=web) I will share my practical trading experience there, along with the current shortcomings, structural weaknesses, and trading opportunities in bStocks.
Finally, this article is dedicated to the elders who accompanied me through my childhood.
Death itself is not difficult to face. What is difficult is figuring out how those who remain should carry on.
May flowers bloom along your path. Farewell, and rest in peace.
Follow us
Twitter: https://twitter.com/WuBlockchain
Telegram: https://t.me/wublockchainenglish