Solana (SOL) Analysis — September 14, 2026
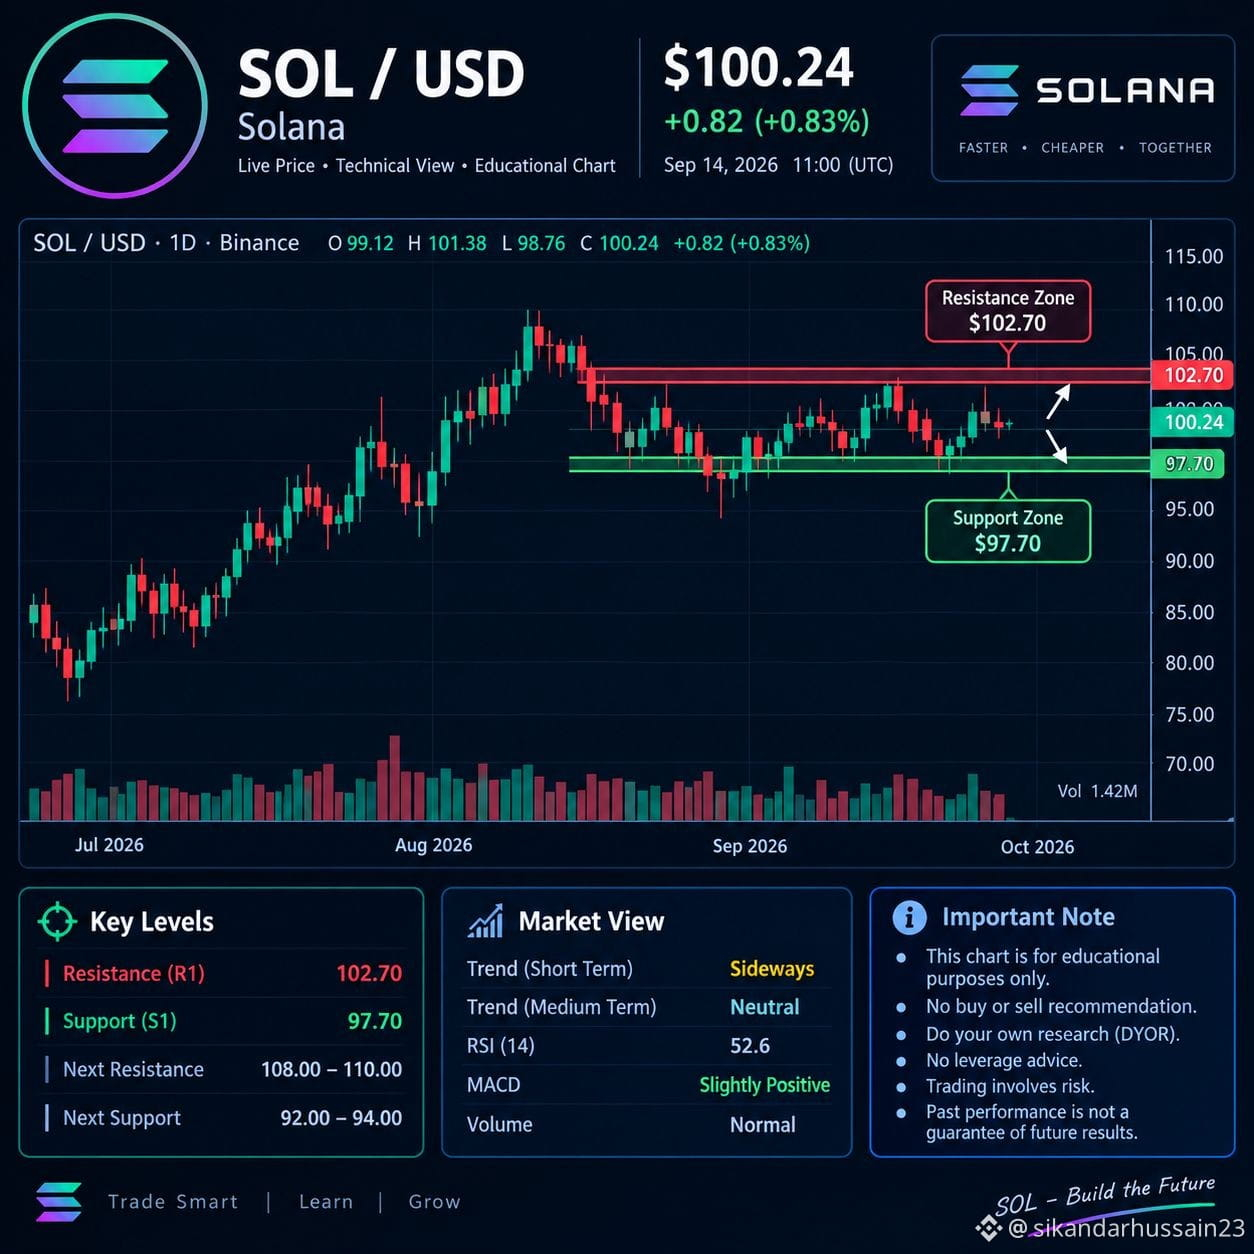
$GOOGL.US #SOL is trading around $101. Recent $NVDAB
technical data shows a mixed-to-bearish short-term picture, while the longer-term structure has some positive signs.
Resistance: $102.7 — a daily close above this area would improve the bullish setup.
Support: around $97.7, with $98–$100 acting as an important nearby zone.
Bullish scenario: If SOL breaks and holds above $103, the next upside area could be around $105–$110.
Bearish scenario: A clear break below $97–$98 could signal another move lower.
Momentum: Indicators are mixed; MACD is bearish while some oscillators are near oversold territory.
Fundamentals: Solana continues to see institutional/ecosystem activity, including tokenized assets and infrastructure development.
Overall: 🟡 Neutral / cautious until SOL decisively breaks either $103 resistance or $97 support.
This is market analysis, not a recommendation to buy or sell.
$GOOGL.US #SOL is trading around $101. Recent $NVDAB
technical data shows a mixed-to-bearish short-term picture, while the longer-term structure has some positive signs.
Resistance: $102.7 — a daily close above this area would improve the bullish setup.
Support: around $97.7, with $98–$100 acting as an important nearby zone.
Bullish scenario: If SOL breaks and holds above $103, the next upside area could be around $105–$110.
Bearish scenario: A clear break below $97–$98 could signal another move lower.
Momentum: Indicators are mixed; MACD is bearish while some oscillators are near oversold territory.
Fundamentals: Solana continues to see institutional/ecosystem activity, including tokenized assets and infrastructure development.
Overall: 🟡 Neutral / cautious until SOL decisively breaks either $103 resistance or $97 support.
This is market analysis, not a recommendation to buy or sell.