
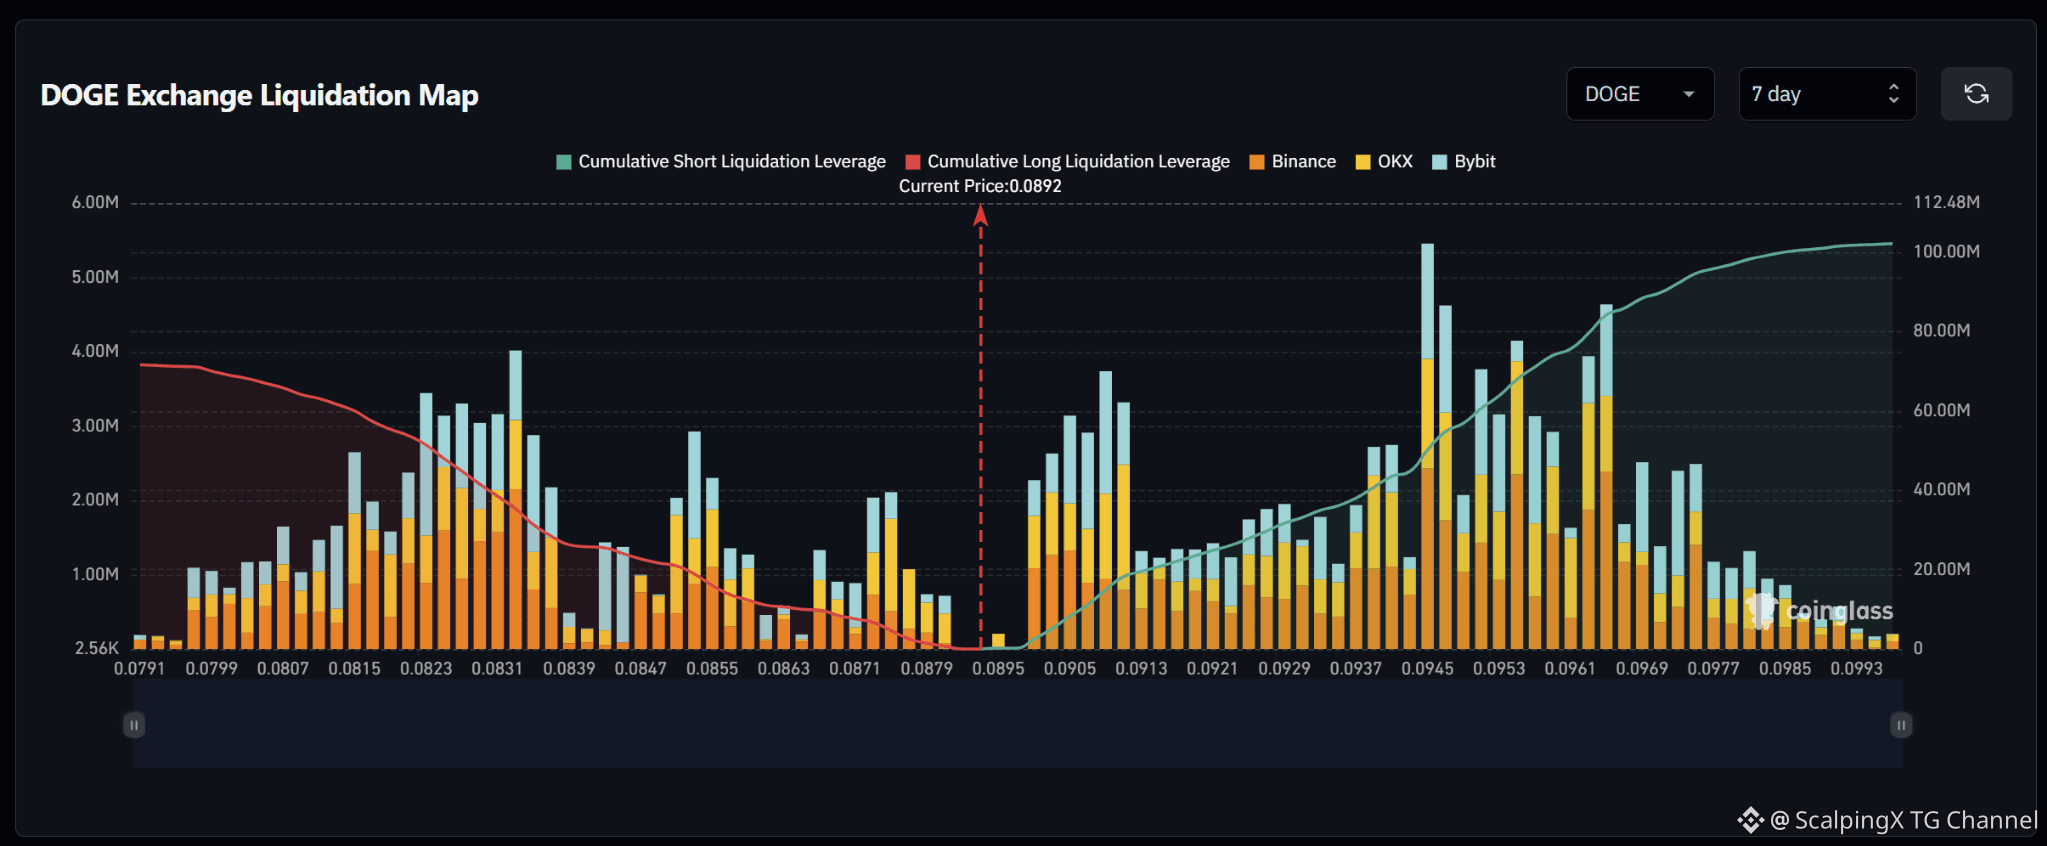
$DOGE – Liquidation Map (7 Days) – Current Price 0.0892 🔎 The 7-day liquidation map shows roughly $100 million in short liquidations above the current price, exceeding approximately $70–75 million in long liquidations below. The liquidity structure therefore leans fairly clearly to the upside, with a large amount of cumulative liquidity building from around 0.0905 onward. 📉 Below the market, nearby long-liquidation liquidity is concentrated around 0.0879–0.0871 before becoming denser across 0.0863–0.0855. Larger clusters sit deeper around 0.0839–0.0823, particularly across 0.0831–0.0823. Losing 0.0879 would increase the probability of a sweep toward 0.0871–0.0863. 📈 Above the market, short-liquidation liquidity begins building sharply around 0.0905–0.0913 and continues accumulating through 0.0921–0.0937. The strongest nearby cluster sits around 0.0945, while 0.0953–0.0961 also contains several large liquidation bars. A break above 0.0905 would bring 0.0913–0.0929 into focus. 🧭 The broader setup favors the upside because short-liquidation exposure above is roughly 1.4 times larger. Breaking 0.0905 would increase the probability of a sweep toward 0.0913–0.0929, while losing 0.0879 would shift attention toward 0.0871–0.0863. #LiquidationMap

Publicación
Aviso legal: Incluye opiniones de terceros. No es asesoramiento. Binance Ai puede utilizarse sin garantía. Consultar Términos y condiciones.