
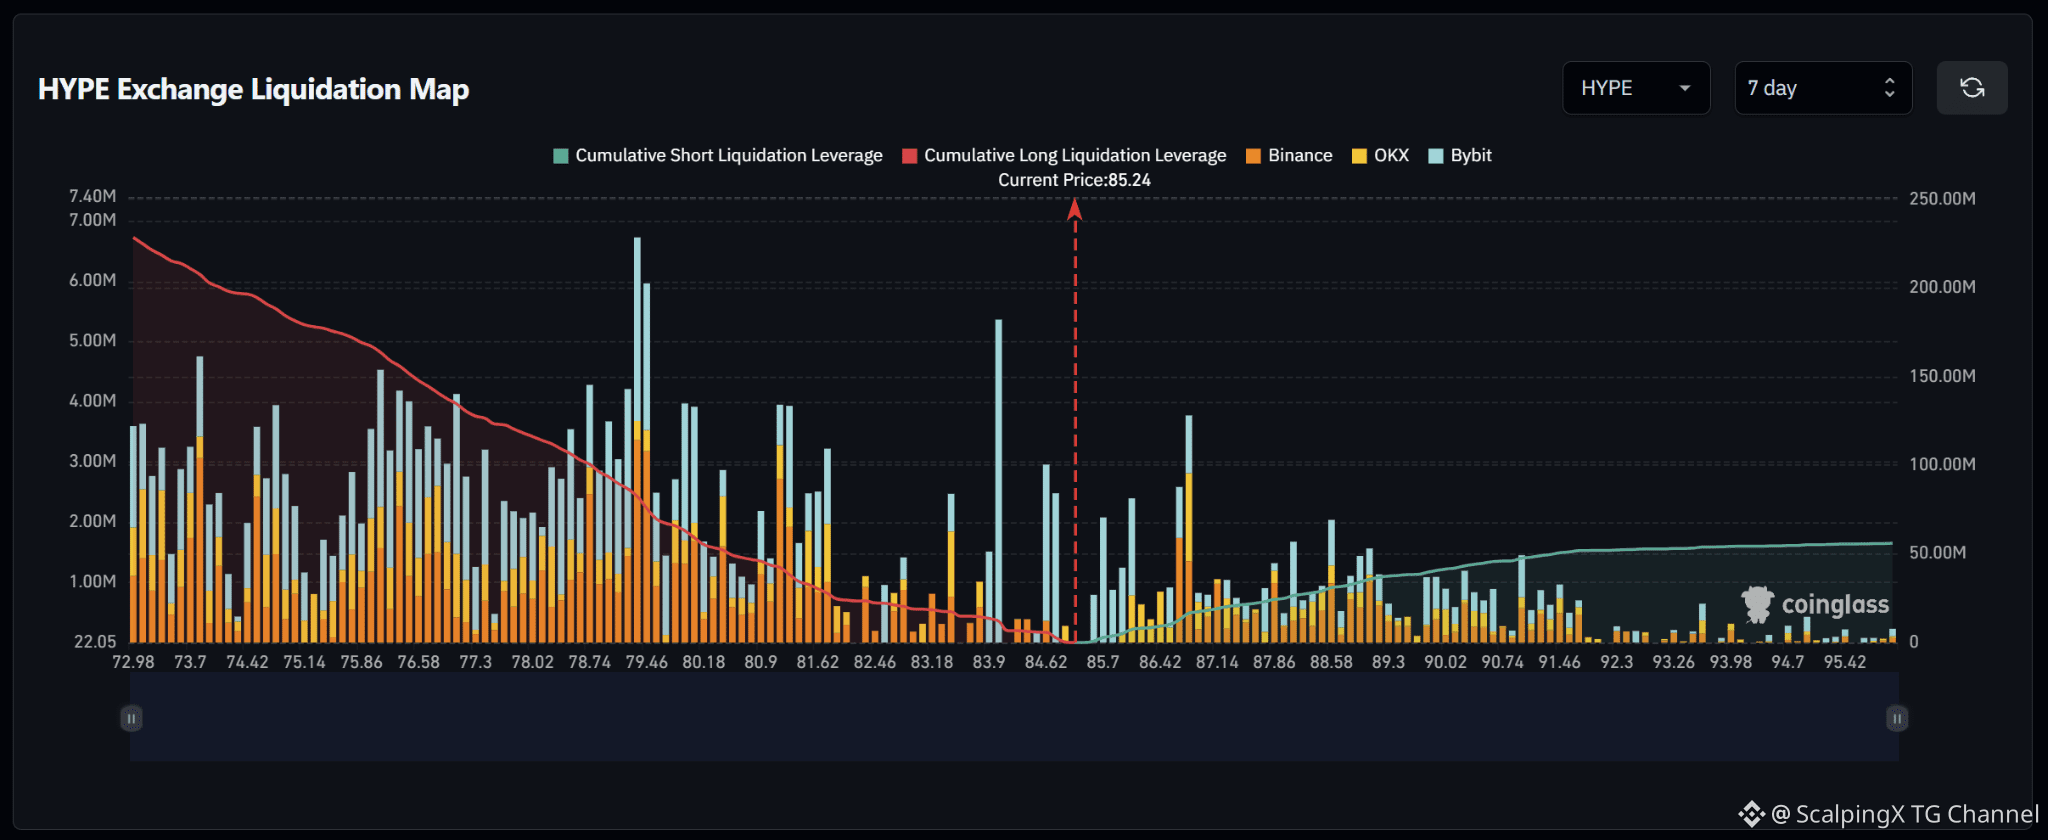
$HYPE – Liquidation Map (7 Days) – Current Price 85.24 🔎 The 7-day liquidation map shows roughly $220–230 million in long liquidations below the current price, far exceeding approximately $50 million in short liquidations above. The liquidity structure therefore strongly favors the downside, with roughly 4–5 times more cumulative liquidity sitting below the market. 📉 Below the market, nearby long-liquidation liquidity is concentrated around 84.62–83.90, with the 83.90 area standing out as a major liquidation cluster. Further downside liquidity remains dense across 81.62–80.90, while the largest cluster below sits around 79.46. Losing 84.62 would increase the probability of a sweep toward 83.90–83.18. 📈 Above the market, short-liquidation liquidity begins building around 85.70 and becomes denser across 86.42–87.14. The strongest nearby upside cluster sits around 87.14, while additional liquidity remains across 87.86–89.30 but at a much smaller scale than below. A break above 85.70 would bring 86.42–87.14 into focus. 🧭 The broader setup strongly favors the downside because long-liquidation exposure below is roughly 4–5 times larger. Losing 84.62 would strengthen the probability of a sweep toward 83.90–83.18, while breaking above 85.70 would shift attention toward a short-liquidation sweep across 86.42–87.14. #LiquidationMap

Publicación
Aviso legal: Incluye opiniones de terceros. No es asesoramiento. Binance Ai puede utilizarse sin garantía. Consultar Términos y condiciones.