
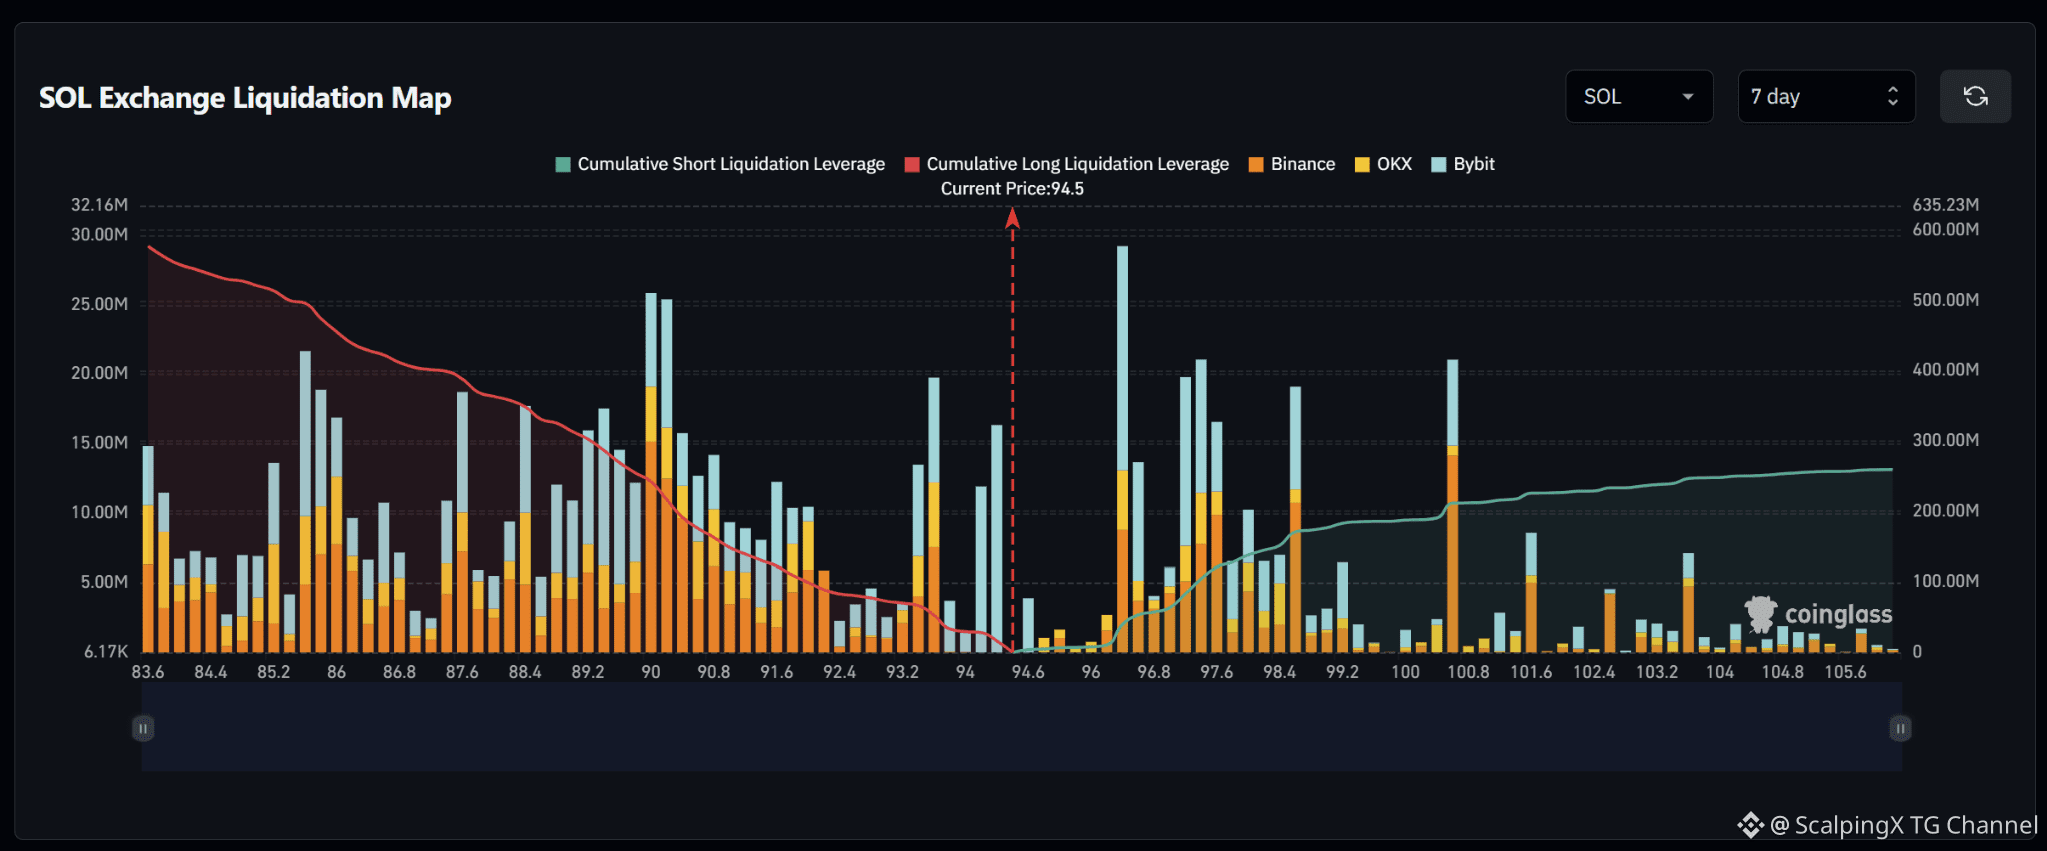
$SOL – Liquidation Map (7 Days) – Current Price 94.5 🔎 The 7-day liquidation map shows roughly $560–580 million in long liquidations below the current price, significantly exceeding approximately $250 million in short liquidations above. The liquidity structure therefore leans to the downside, although several large short-liquidation clusters remain relatively close above the market. 📉 Below the market, nearby long-liquidation liquidity is concentrated around 94.0–93.2 before increasing across 92.4–91.6. Larger clusters sit deeper around 90.8–89.2 and 88.4–87.6, with the area near 90.0 standing out. Losing 94.0 would increase the probability of a sweep toward 93.2–92.4. 📈 Above the market, short-liquidation liquidity begins building around 96.0 and becomes much denser across 96.4–98.4. The strongest nearby cluster sits around 96.4, while 97.2–97.6 and 98.4 also carry substantial liquidity. Another notable cluster appears further out near 100.8. A break above 96.0 would bring 96.4–97.6 into focus. 🧭 The broader setup favors the downside because long-liquidation exposure below is roughly twice as large. Losing 94.0 would strengthen the probability of a sweep toward 93.2–92.4, while breaking above 96.0 would shift attention toward a short-liquidation sweep across 96.4–97.6. #LiquidationMap

Publicación
Aviso legal: Incluye opiniones de terceros. No es asesoramiento. Binance Ai puede utilizarse sin garantía. Consultar Términos y condiciones.