
1H Technical Outlook | August 16, 2026
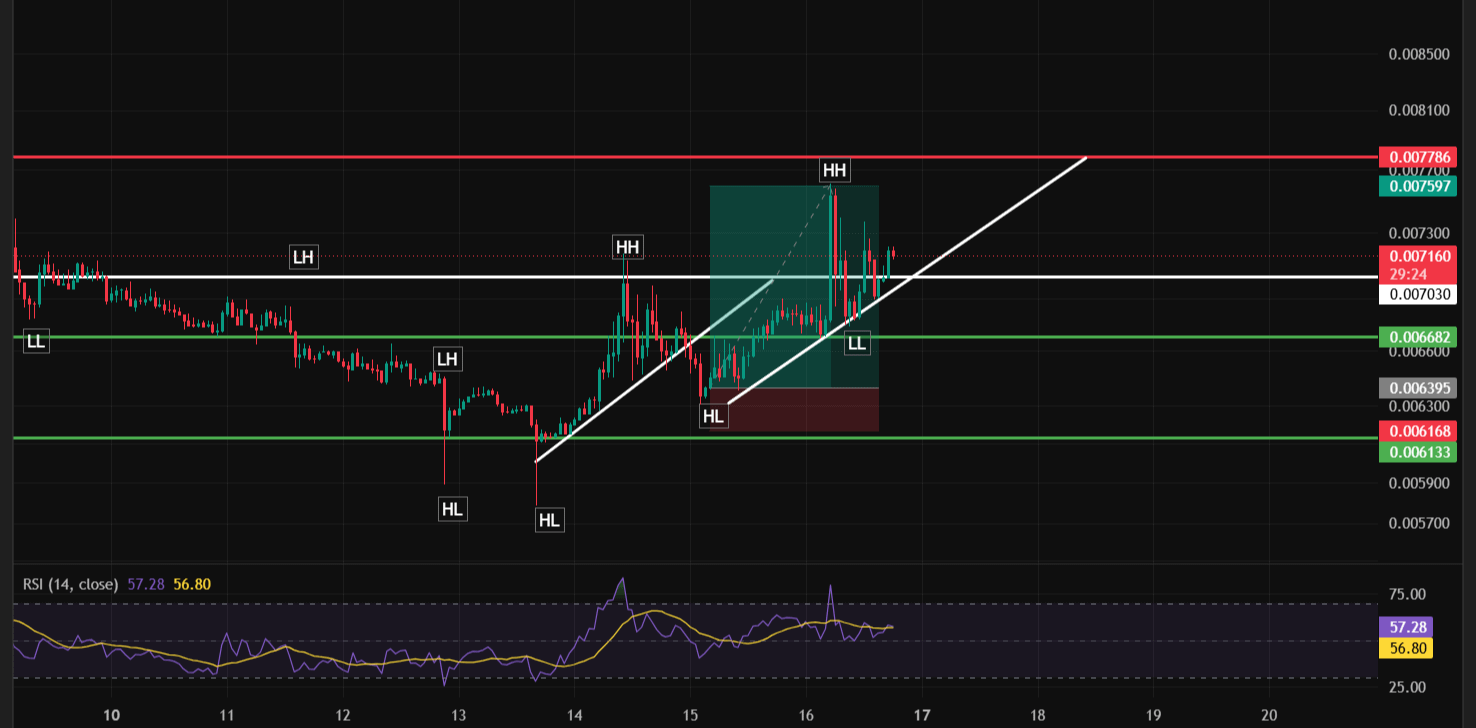
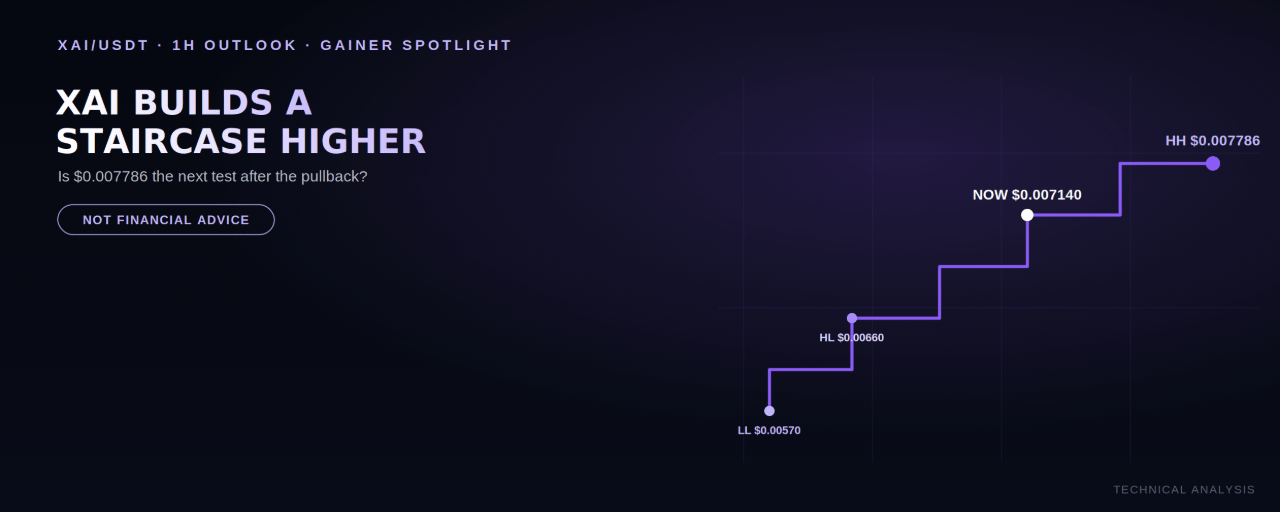
XAI/USDT has quietly turned a mid-August slide into a constructive recovery. After a Lower Low near $0.00570, price has built a clean staircase of Higher Lows and Higher Highs, now trading at $0.007140 (-0.64% today) just under a recent high of $0.007786.
This article is for educational and informational purposes only. It is not financial advice. XAI is a low-priced, volatile asset. Confirm support holds before assuming continuation.
What Happened: A Genuine Staircase Higher
From the Lower Low near $0.00570 on August 13, XAI has printed three straight Higher Lows — $0.00590, $0.00640, and $0.00660 — each one accompanying a Higher High: $0.00700, then $0.007597, then a spike to $0.007786. A steep rising trendline connects the Higher Lows, and price is currently consolidating just below the most recent high.
Momentum Check
The RSI (14) is at 56.62, just below its moving average of 56.75 — essentially neutral after cooling from a stronger reading earlier in the rally. That's consistent with a pause rather than a breakdown, though it's worth watching whether RSI turns back up or continues to soften from here.
The Zone That Matters: $0.006682 – $0.007140
Current price is sitting in this zone, which includes the most recent Higher Low and a Fair Value Gap from the latest rally leg. Holding here keeps the staircase structure intact.
Resistance Levels to Watch
$0.007786 — the recent high; reclaiming this would signal the staircase pattern is continuing
Beyond this, there's limited resistance history — price would be moving into relatively open territory
Support Levels to Watch
$0.006682 — the most recent Higher Low, the level to watch first
$0.006395 — a deeper reference level
$0.006168 – $0.006133 — a stronger support zone further down
$0.00570 — the origin Lower Low; losing this would undo the entire recovery structure
Potential Trade Setups (Illustrative Only — Not Financial Advice)
🟢 Setup 1 — Buy the Higher Low retest
Entry zone: $0.006682 – $0.007140
Invalidation / Stop-loss: Below $0.006395
Target 1: $0.007786 (retest of the high)
Target 2: Open-ended above the high
🔴 Setup 2 — Fade a rejection at the high
Trigger: Rejection candle near $0.007786
Entry zone: Top of the rejection
Invalidation / Stop-loss: Above $0.0080
Target 1: $0.006682
Target 2: $0.006395
🟢 Setup 3 — Breakout continuation
Trigger: A strong 1H close above $0.007786
Entry zone: $0.00780 – $0.00800 on confirmation
Invalidation / Stop-loss: Below $0.006682
Target: Open-ended
⚠️ Structure break (bearish invalidation)
A confirmed close below $0.00570 would break the entire staircase structure and undo this recovery.
Bottom Line
XAI has built a genuinely constructive staircase of Higher Highs and Higher Lows since mid-August, and the current pullback is landing at a reasonable support level with neutral-to-improving momentum. The $0.006682–$0.007140 zone is the level to watch: hold it, and a push back toward $0.007786 and beyond fits the pattern; lose $0.00570, and this recovery structure would need to be reassessed entirely.
Disclaimer: This content is for informational and educational purposes only and does not constitute financial, investment, or trading advice. Cryptocurrency trading, especially in low-priced and recently volatile assets, involves significant risk, including the potential loss of principal. Past performance and chart patterns are not indicative of future results. Always conduct your own research and consult a licensed financial advisor before making trading decisions.
@Binance Earn Official @Binance Earn Official #SpaceXSharesRiseTo$140 #SECReviewsSix3xLeveragedCommodityETFs #USToPressNationsToPickUSOrChinaAICoalition #Binance #ChartSniper