MAX
📈 BNB Price Trend Overview
🔹 Current Market Condition
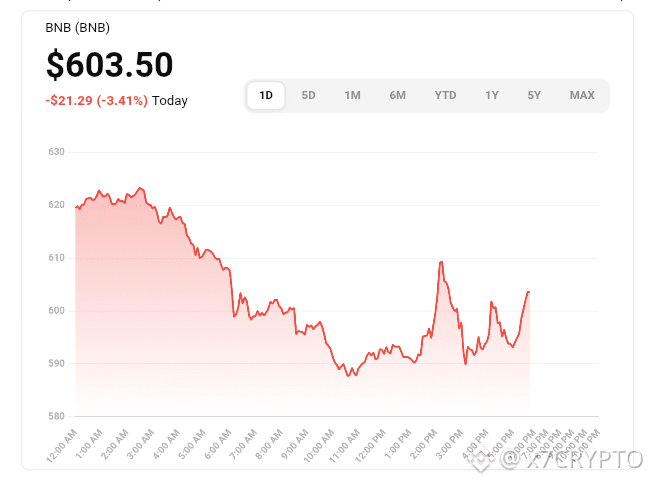
BNB’s price has been sliding from higher levels, facing pressure from broader crypto sell-offs and weaker volume. Recent prices are significantly below earlier resistance zones seen in late 2025.
Technical indicators in multiple sources show near-term bearish tendencies with oversold conditions on short-term momentum indicators (e.g., RSI in the oversold region).
📊 Trend Phases
Long-term Macro Trend – Still structurally bullish in larger timeframes due to strong ecosystem usage, token utility, and past ATHs.
Medium-term – Price has been consolidating or correcting; significant support levels are being tested.
Short-term – Current downtrend with evidence of oversold momentum, but lacking strong reversal confirmation.
🔎 Key Technical Levels (2026)
📍 Resistance Levels
Level Significance
~$682–$690 Immediate resistance zone (short-term rally barrier)
~$715–$720 Moderate seller zone seen in recent TA
~$770 Higher resistance in corrective rallies
📍 Support Levels
Level Significance
~$630–$640 Immediate support and short-term consolidation zone
~$600–$620 Strong structural support (psychological and Fibonacci retracement zone)
~$570–$580 Secondary support if downside accelerates
🧠 Momentum & Indicators
RSI is reported in oversold territory in short timeframes, suggesting potential near-term bounce but not a confirmed reversal.
Bearish momentum from MACD and EMA signals indicates that sellers remain in control until significant resistance is reclaimed.
🧾 Simple ASCII Trend Diagram
Resistance
770 ──────────┐ ╭────
720 ──────╮ │ │
690 ───╮ │ │ │
Price │ │ │ ╭─│──── Trend high
│ │ │ │ │
650 ──────╯ │ │ │ ╰──── Current price zone
630 ─────────┤ │ ╭─│───────── Support
610 ─────────┤ │ │ │
590 ─────────╯ │ │ ╰──────── Lower support
570 ─────────────╯ │
550 ──────────────────╯
Time ➝
Interpretation:
BNB has fallen from higher resistance zones (~$770–$690) after losing momentum.
Price is hanging around key support (~$630–$600); a break below could see lower zones tested.
Reclaiming resistance zones, especially above ~$715, increases the chance of reversal.
📌 What to Watch Next
🟢 Bullish Signals
Break above ~$715-$720 with increased volume → potential trend reversal.
RSI climbing toward neutral/overbought range signaling strengthening momentum.
🔴 Bearish Signals
Drop below $600 support, signaling continuation of the downtrend.
MACD remains bearish with lower highs/lows.