

ScalpingX
14.5k Publicaciones

ScalpingX
Denunciar
Bloquear usuario
A short-term trader who embraces high-risk, high-reward strategies with an unconventional mindset.
44 Siguiendo
1.7K+ Seguidores
10.3K+ Me gusta
Publicaciones
Todo
Citas
·
--
Alcista
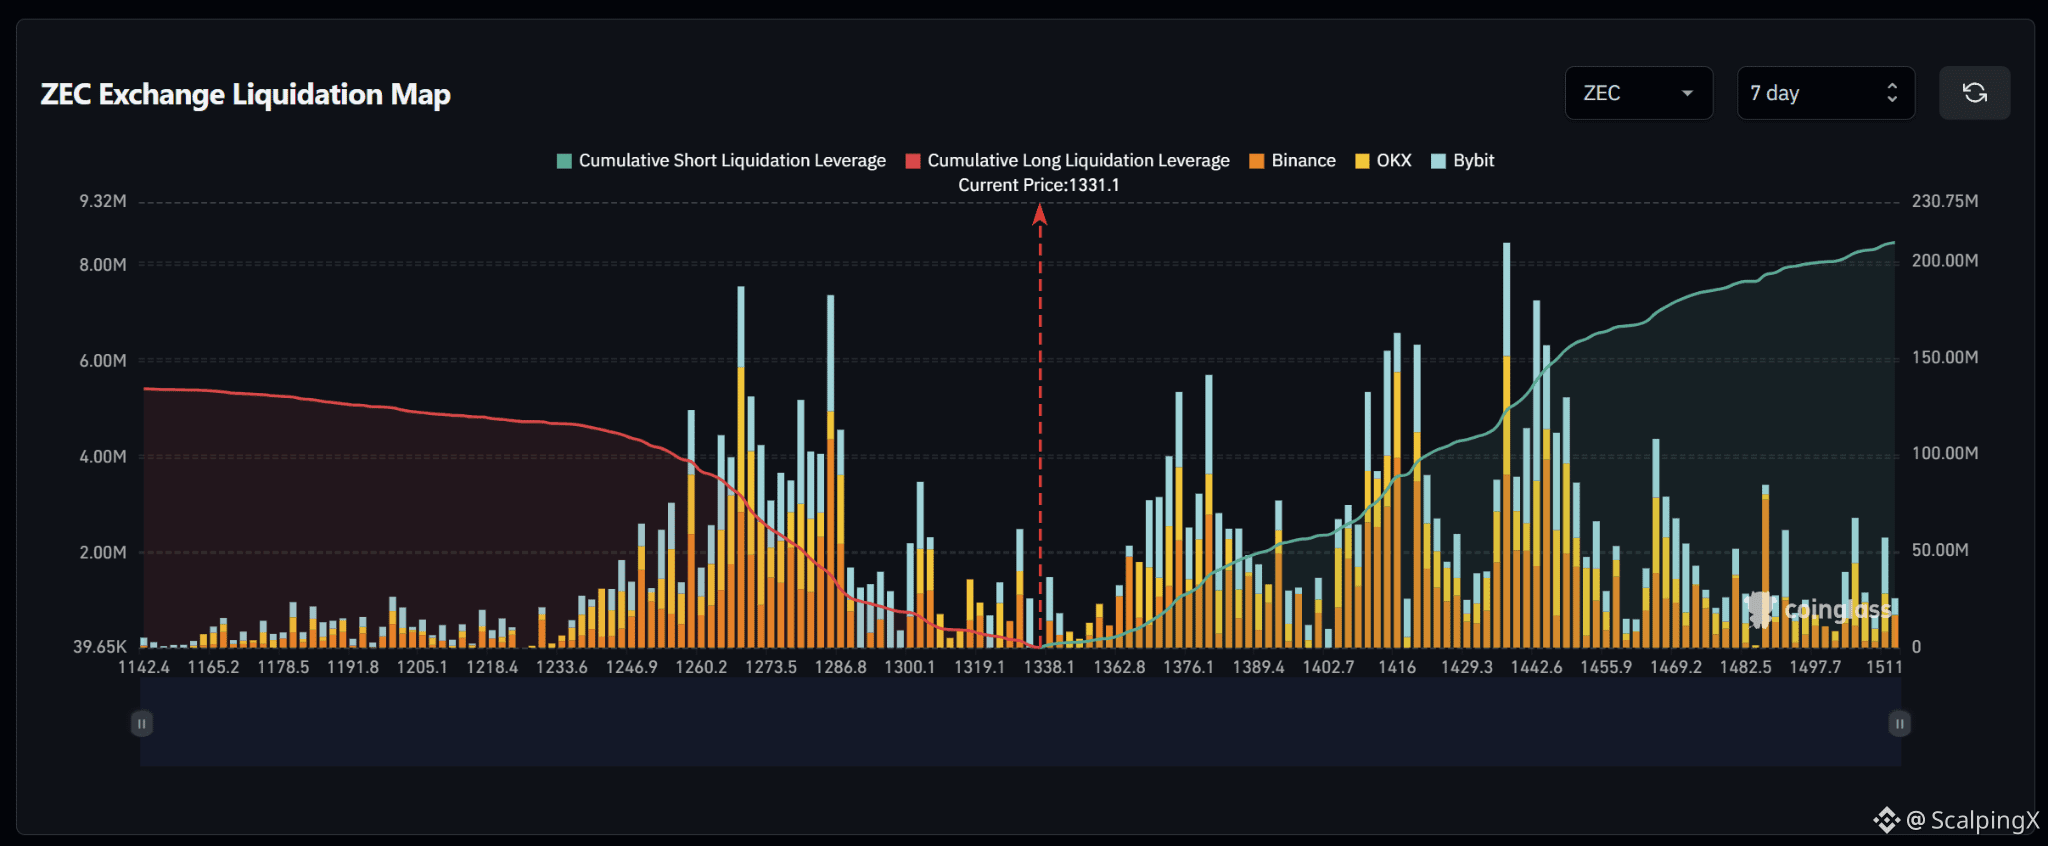
$ZEC – Mapa de liquidaciones (7 días) – Precio actual: 1,331.1
🔎 El mapa de liquidaciones de 7 días muestra aproximadamente entre 205 y 210 millones de USD en liquidaciones de posiciones cortas por encima del precio actual, superando claramente los aproximadamente 130–135 millones de USD en liquidaciones de posiciones largas por debajo. Por lo tanto, la estructura de liquidez muestra una inclinación bastante clara al alza, con alrededor de 1.5 veces más liquidez acumulada por encima del mercado.
📉 Por debajo del mercado, la liquidez de liquidaciones de posiciones largas se concentra fuertemente entre 1,250 y 1,290. El grupo más importante se sitúa alrededor de 1,265–1,288, con varias barras cercanas a los 4–7.5 millones de USD, mientras que entre 1,245 y 1,260 también hay varios grupos de entre 2 y 5 millones de USD. Si se pierde el nivel de 1,319–1,300, la atención se desplazaría hacia 1,288–1,265 y luego hacia 1,250–1,235.
📈 Por encima del mercado, la liquidez de liquidaciones de posiciones cortas se distribuye principalmente desde 1,360 hacia arriba. Un grupo destacado se sitúa alrededor de 1,370–1,390, con varias barras cercanas a los 3–5.5 millones de USD, mientras que entre 1,408 y 1,423 se forma otro grupo de alrededor de 5–6.5 millones de USD. La mayor concentración aparece alrededor de 1,435–1,450, donde la barra más grande alcanza aproximadamente los 8.5 millones de USD.
🧭 El panorama general favorece al alza, ya que la exposición a liquidaciones de posiciones cortas por encima es claramente mayor. Una ruptura por encima de 1,338–1,363 dejaría expuestos los niveles de 1,370–1,390, seguidos por 1,408–1,423 y la importante zona de liquidez de 1,435–1,450. En cambio, si se pierde 1,319–1,300, aumentaría la probabilidad de un barrido hacia 1,288–1,265.
#LiquidationMap
$ZEC – Mapa de liquidaciones (7 días) – Precio actual: 1,331.1
🔎 El mapa de liquidaciones de 7 días muestra aproximadamente entre 205 y 210 millones de USD en liquidaciones de posiciones cortas por encima del precio actual, superando claramente los aproximadamente 130–135 millones de USD en liquidaciones de posiciones largas por debajo. Por lo tanto, la estructura de liquidez muestra una inclinación bastante clara al alza, con alrededor de 1.5 veces más liquidez acumulada por encima del mercado.
📉 Por debajo del mercado, la liquidez de liquidaciones de posiciones largas se concentra fuertemente entre 1,250 y 1,290. El grupo más importante se sitúa alrededor de 1,265–1,288, con varias barras cercanas a los 4–7.5 millones de USD, mientras que entre 1,245 y 1,260 también hay varios grupos de entre 2 y 5 millones de USD. Si se pierde el nivel de 1,319–1,300, la atención se desplazaría hacia 1,288–1,265 y luego hacia 1,250–1,235.
📈 Por encima del mercado, la liquidez de liquidaciones de posiciones cortas se distribuye principalmente desde 1,360 hacia arriba. Un grupo destacado se sitúa alrededor de 1,370–1,390, con varias barras cercanas a los 3–5.5 millones de USD, mientras que entre 1,408 y 1,423 se forma otro grupo de alrededor de 5–6.5 millones de USD. La mayor concentración aparece alrededor de 1,435–1,450, donde la barra más grande alcanza aproximadamente los 8.5 millones de USD.
🧭 El panorama general favorece al alza, ya que la exposición a liquidaciones de posiciones cortas por encima es claramente mayor. Una ruptura por encima de 1,338–1,363 dejaría expuestos los niveles de 1,370–1,390, seguidos por 1,408–1,423 y la importante zona de liquidez de 1,435–1,450. En cambio, si se pierde 1,319–1,300, aumentaría la probabilidad de un barrido hacia 1,288–1,265.
#LiquidationMap
🔎 El mapa de liquidaciones de 7 días muestra aproximadamente entre 205 y 210 millones de USD en liquidaciones de posiciones cortas por encima del precio actual, superando claramente los aproximadamente 130–135 millones de USD en liquidaciones de posiciones largas por debajo. Por lo tanto, la estructura de liquidez muestra una inclinación bastante clara al alza, con alrededor de 1.5 veces más liquidez acumulada por encima del mercado.
📉 Por debajo del mercado, la liquidez de liquidaciones de posiciones largas se concentra fuertemente entre 1,250 y 1,290. El grupo más importante se sitúa alrededor de 1,265–1,288, con varias barras cercanas a los 4–7.5 millones de USD, mientras que entre 1,245 y 1,260 también hay varios grupos de entre 2 y 5 millones de USD. Si se pierde el nivel de 1,319–1,300, la atención se desplazaría hacia 1,288–1,265 y luego hacia 1,250–1,235.
📈 Por encima del mercado, la liquidez de liquidaciones de posiciones cortas se distribuye principalmente desde 1,360 hacia arriba. Un grupo destacado se sitúa alrededor de 1,370–1,390, con varias barras cercanas a los 3–5.5 millones de USD, mientras que entre 1,408 y 1,423 se forma otro grupo de alrededor de 5–6.5 millones de USD. La mayor concentración aparece alrededor de 1,435–1,450, donde la barra más grande alcanza aproximadamente los 8.5 millones de USD.
🧭 El panorama general favorece al alza, ya que la exposición a liquidaciones de posiciones cortas por encima es claramente mayor. Una ruptura por encima de 1,338–1,363 dejaría expuestos los niveles de 1,370–1,390, seguidos por 1,408–1,423 y la importante zona de liquidez de 1,435–1,450. En cambio, si se pierde 1,319–1,300, aumentaría la probabilidad de un barrido hacia 1,288–1,265.
#LiquidationMap
13
·
--
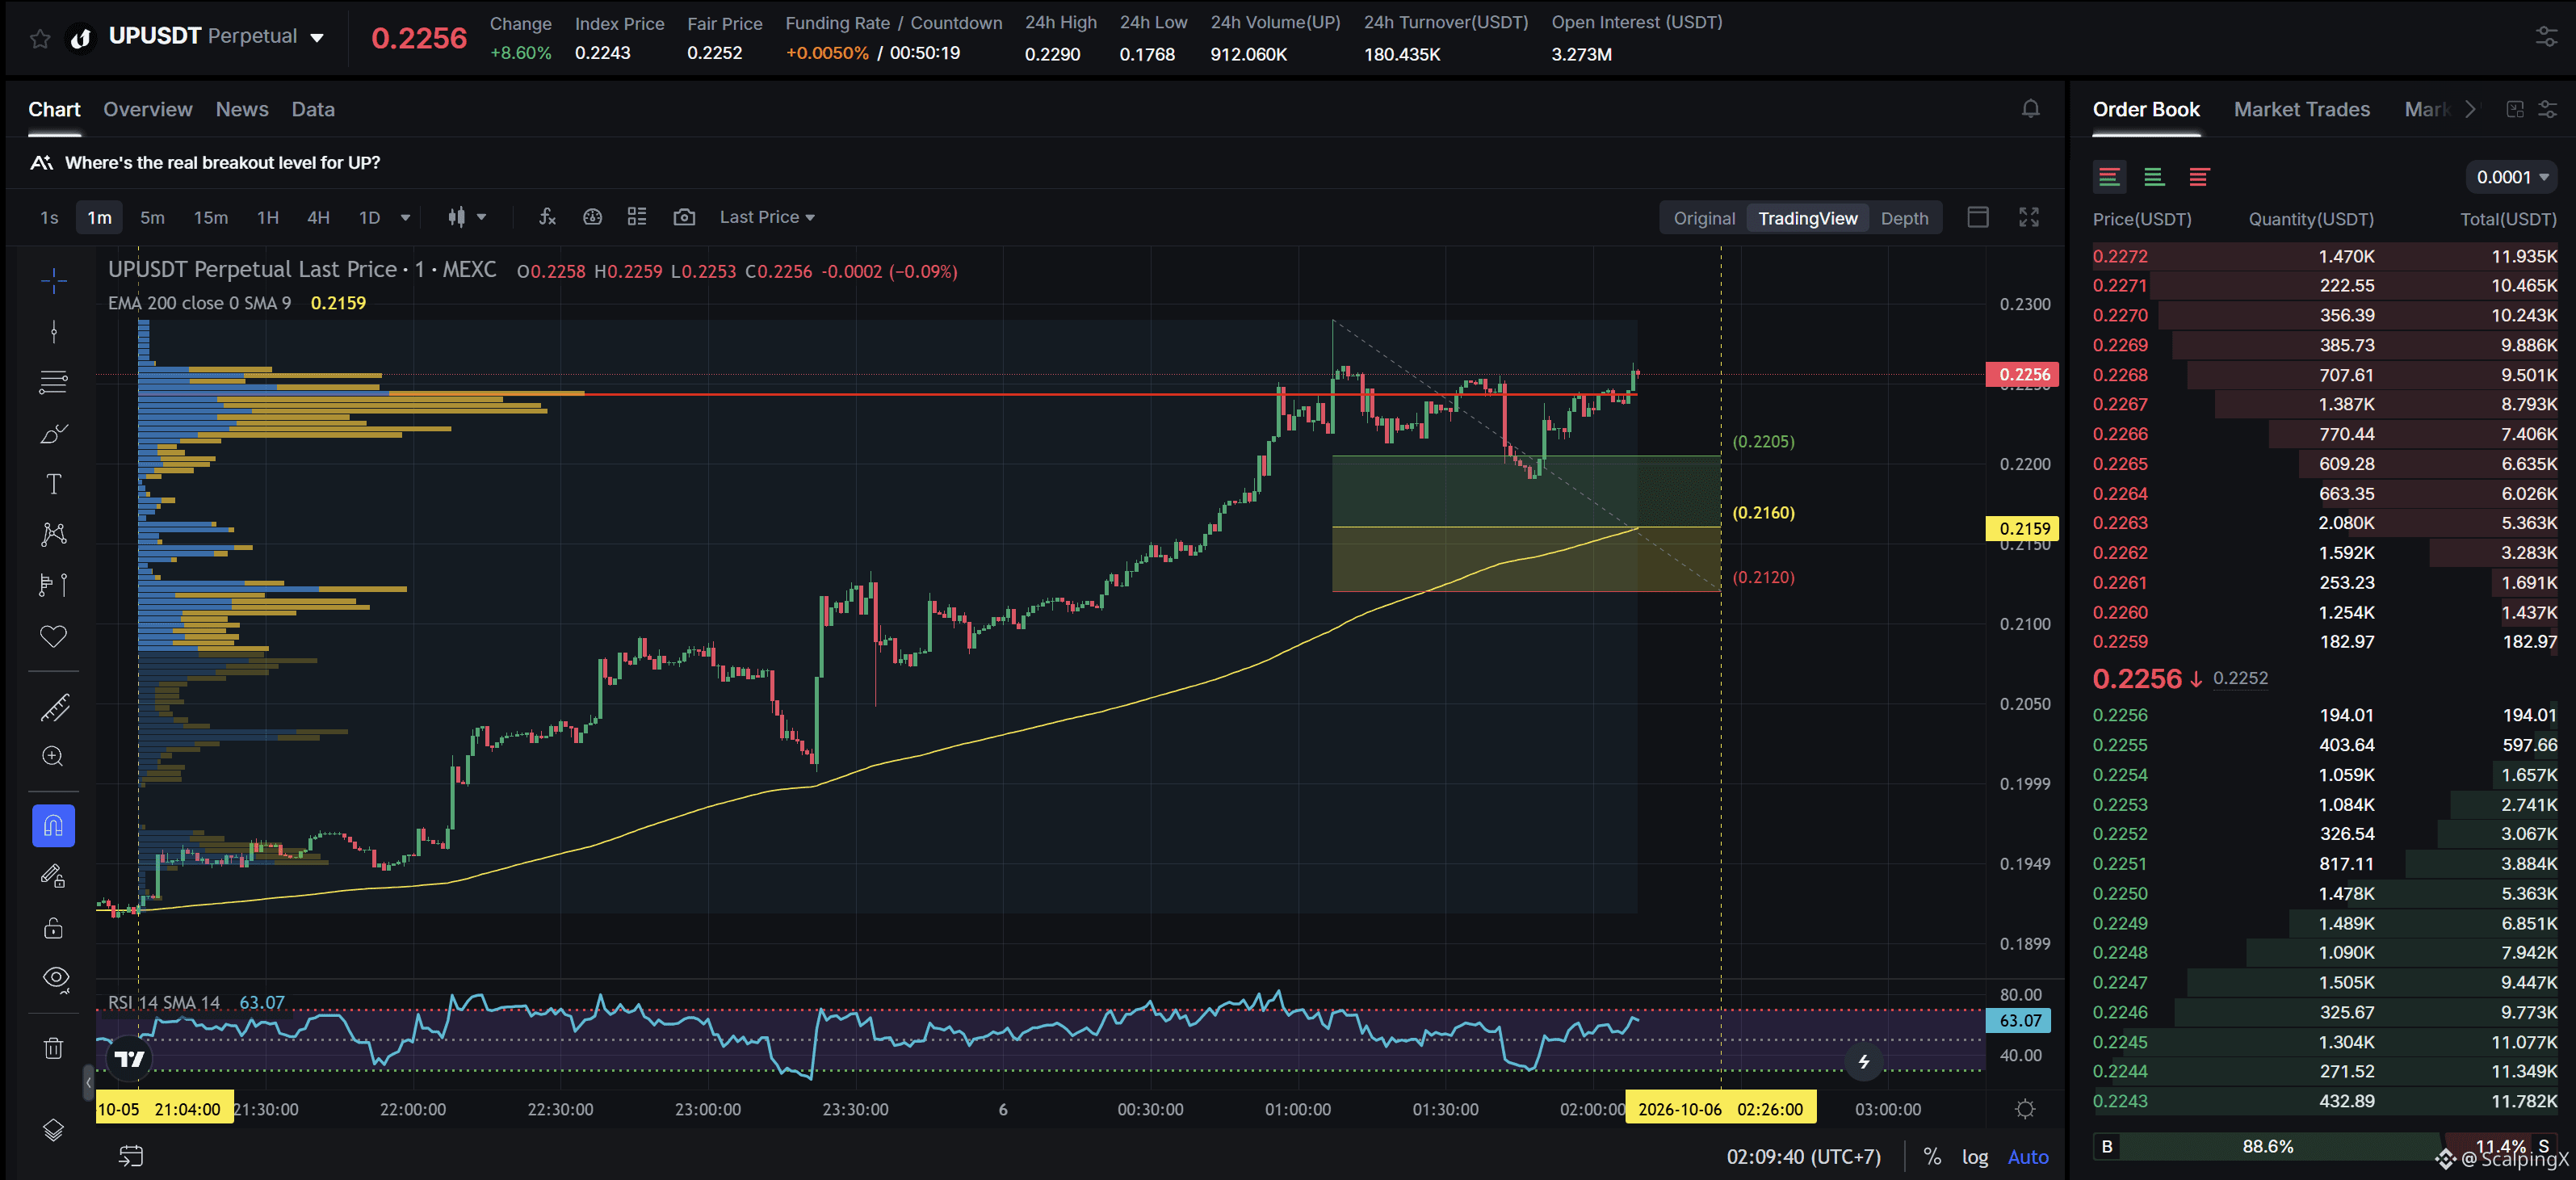
$UP - Cap. de mercado 32.76M$ - Sentimiento de 24 h: neutral
SC02 M1 - Orden larga pendiente. La entrada se encuentra dentro de HVN y no está afectada por ninguna zona débil; la zona de soporte actual tiene una anchura aproximada del 1.84%. La tendencia alcista ha durado 5 horas y 6 minutos, con un aumento máximo del precio registrado del 19.27%. Si el precio pierde esta zona de soporte, es muy probable que la tendencia se revierta a la baja.
$UP - Cap. de mercado 32.76M$ - Sentimiento de 24 h: neutral
SC02 M1 - Orden larga pendiente. La entrada se encuentra dentro de HVN y no está afectada por ninguna zona débil; la zona de soporte actual tiene una anchura aproximada del 1.84%. La tendencia alcista ha durado 5 horas y 6 minutos, con un aumento máximo del precio registrado del 19.27%. Si el precio pierde esta zona de soporte, es muy probable que la tendencia se revierta a la baja.
SC02 M1 - Orden larga pendiente. La entrada se encuentra dentro de HVN y no está afectada por ninguna zona débil; la zona de soporte actual tiene una anchura aproximada del 1.84%. La tendencia alcista ha durado 5 horas y 6 minutos, con un aumento máximo del precio registrado del 19.27%. Si el precio pierde esta zona de soporte, es muy probable que la tendencia se revierta a la baja.
19
·
--
Alcista
Ver traducción
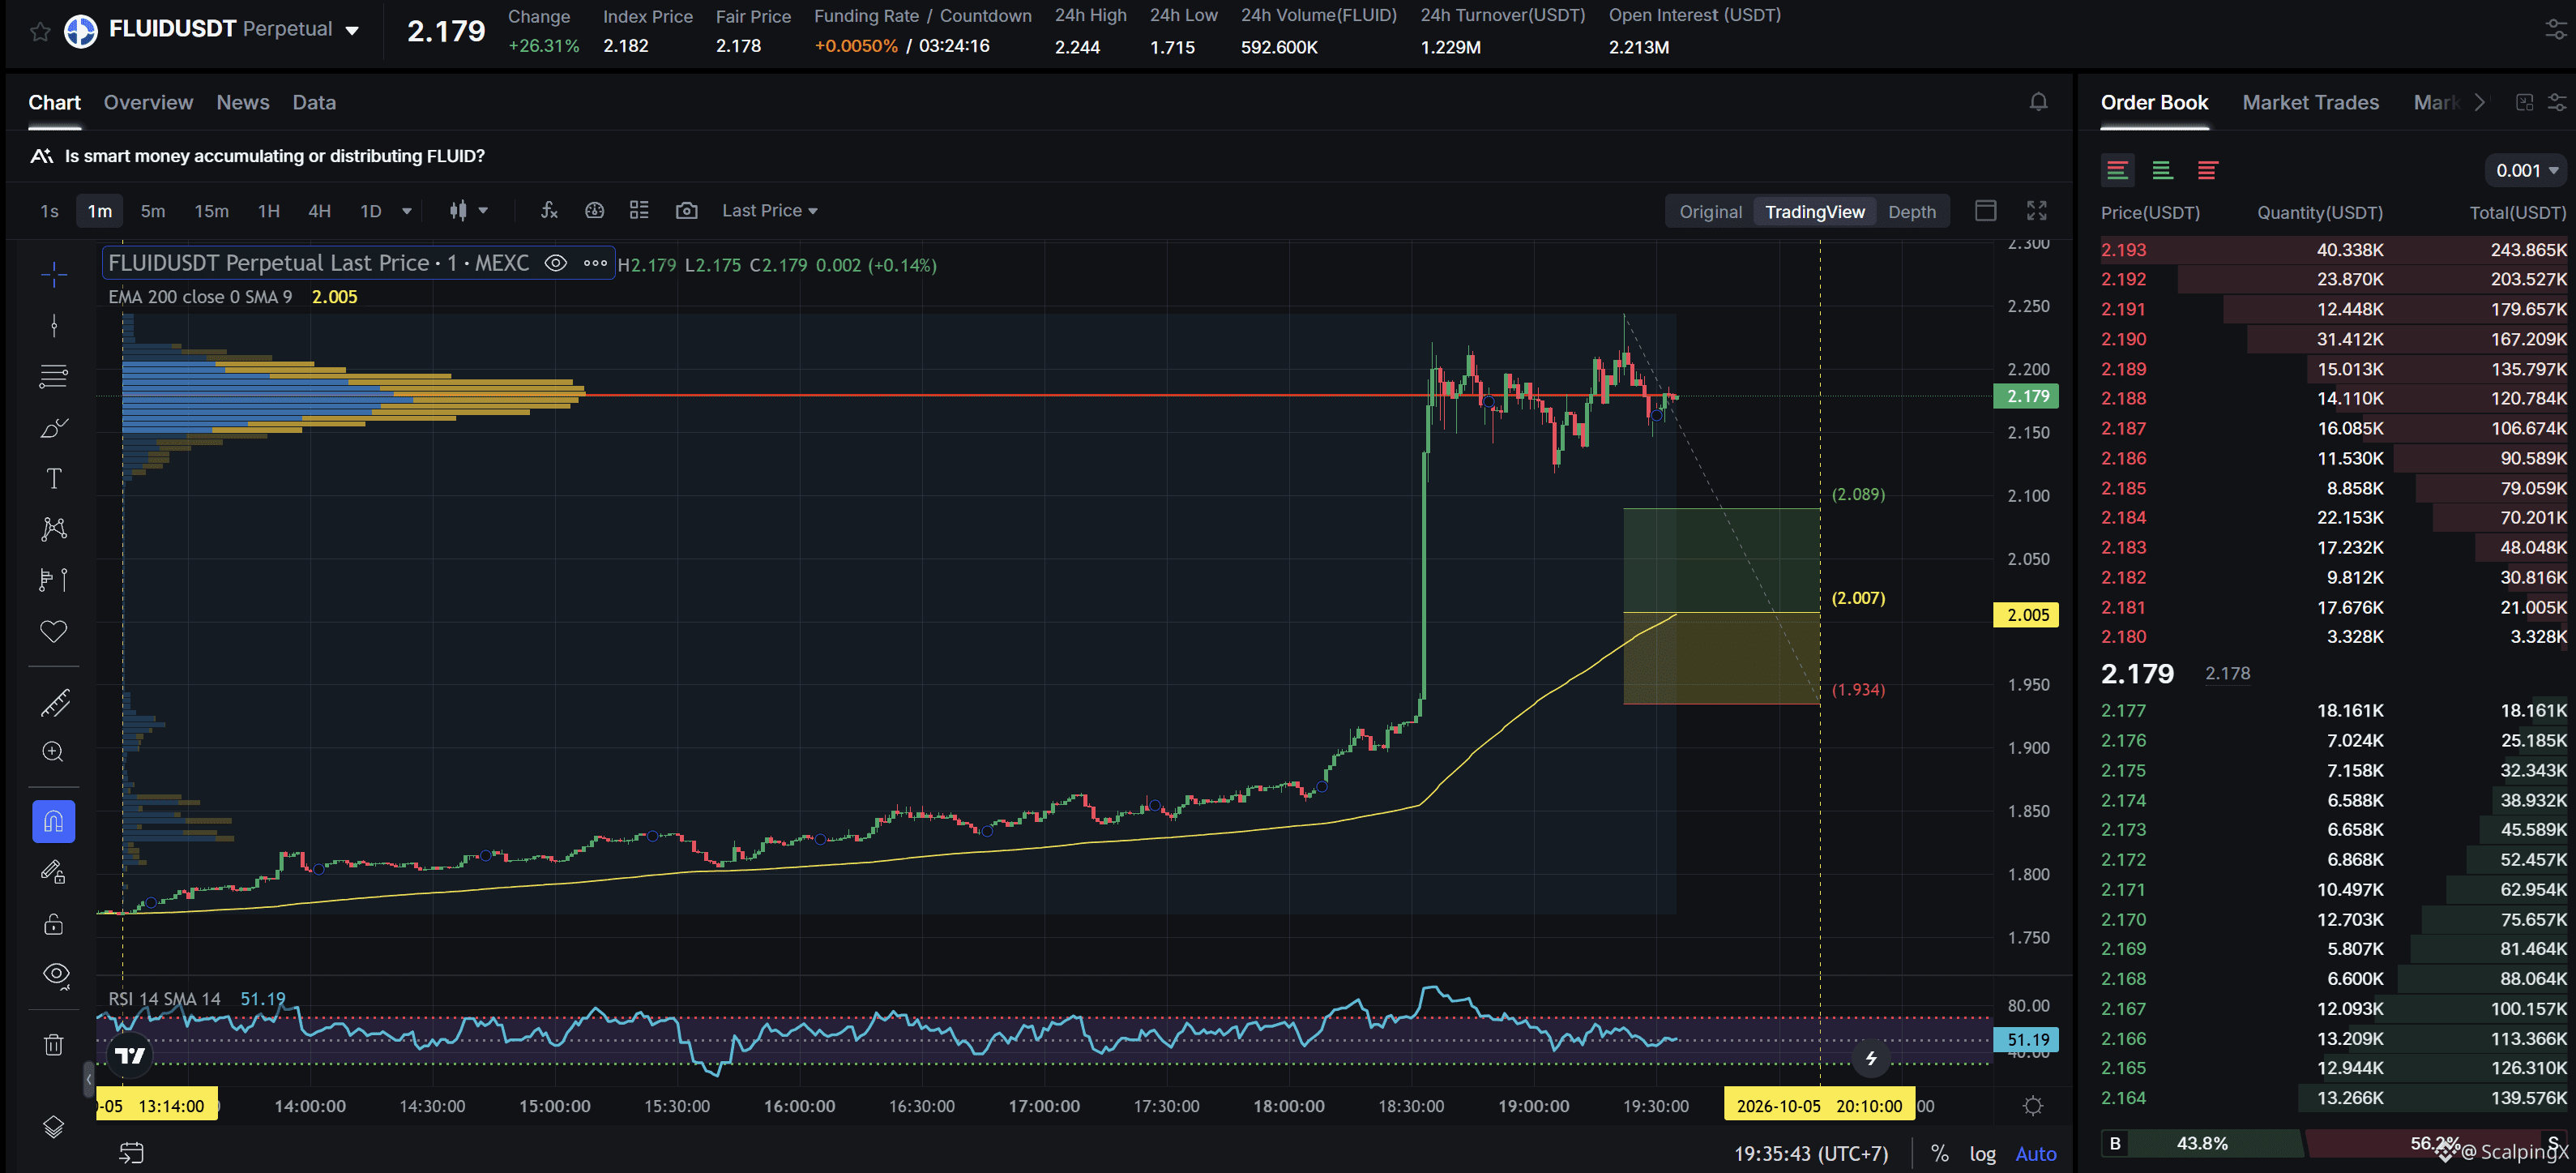
$FLUID - Mcap 183.05M$ - 24h Sentiment +2.63 Bullish
SC02 M1 - pending Long order. Entry lies within LVN + not affected by any weak zone, the current support zone is approximately 3.58% wide. The uptrend has lasted 6 hours 23 minutes, with a maximum recorded price increase of 26.95%. If price loses this support zone, the trend is highly likely to reverse downward.
$FLUID - Mcap 183.05M$ - 24h Sentiment +2.63 Bullish
SC02 M1 - pending Long order. Entry lies within LVN + not affected by any weak zone, the current support zone is approximately 3.58% wide. The uptrend has lasted 6 hours 23 minutes, with a maximum recorded price increase of 26.95%. If price loses this support zone, the trend is highly likely to reverse downward.
SC02 M1 - pending Long order. Entry lies within LVN + not affected by any weak zone, the current support zone is approximately 3.58% wide. The uptrend has lasted 6 hours 23 minutes, with a maximum recorded price increase of 26.95%. If price loses this support zone, the trend is highly likely to reverse downward.
12
·
--
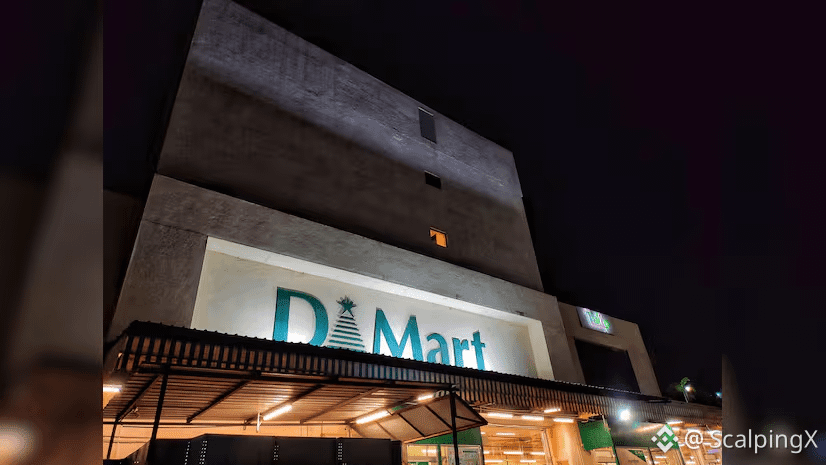
📊 D-Mart registró unos ingresos independientes de ₹19.206 crore en el Q2 del ejercicio fiscal 2027, un 18,4% más interanual y un 4,7% más que en el trimestre anterior. El crecimiento también se aceleró frente al 15,1% del Q1.
📉 A pesar de ello, la acción cayó casi un 6% en la primera sesión bursátil tras la actualización. El crecimiento de los ingresos superó las expectativas por apenas un 1%, mientras el mercado sigue siendo cauteloso respecto a la calidad del crecimiento, ya que una inflación más alta y los precios de los bienes de consumo podrían haber favorecido la cifra principal.
🏬 D-Mart abrió 15 tiendas durante el trimestre, con lo que su red llegó a 518. Sin embargo, la actualización actual aún no incluye datos sobre beneficios, márgenes ni ventas en tiendas comparables.
🔎 Ahora la atención se centra en los resultados completos del 10 de octubre. Si mejoran los márgenes y el crecimiento de las transacciones, la actual ola de ventas podría parecer relativamente brusca en comparación con el desempeño subyacente del negocio.
#IndiaStocks $DMART
📊 D-Mart registró unos ingresos independientes de ₹19.206 crore en el Q2 del ejercicio fiscal 2027, un 18,4% más interanual y un 4,7% más que en el trimestre anterior. El crecimiento también se aceleró frente al 15,1% del Q1.
📉 A pesar de ello, la acción cayó casi un 6% en la primera sesión bursátil tras la actualización. El crecimiento de los ingresos superó las expectativas por apenas un 1%, mientras el mercado sigue siendo cauteloso respecto a la calidad del crecimiento, ya que una inflación más alta y los precios de los bienes de consumo podrían haber favorecido la cifra principal.
🏬 D-Mart abrió 15 tiendas durante el trimestre, con lo que su red llegó a 518. Sin embargo, la actualización actual aún no incluye datos sobre beneficios, márgenes ni ventas en tiendas comparables.
🔎 Ahora la atención se centra en los resultados completos del 10 de octubre. Si mejoran los márgenes y el crecimiento de las transacciones, la actual ola de ventas podría parecer relativamente brusca en comparación con el desempeño subyacente del negocio.
#IndiaStocks $DMART
📉 A pesar de ello, la acción cayó casi un 6% en la primera sesión bursátil tras la actualización. El crecimiento de los ingresos superó las expectativas por apenas un 1%, mientras el mercado sigue siendo cauteloso respecto a la calidad del crecimiento, ya que una inflación más alta y los precios de los bienes de consumo podrían haber favorecido la cifra principal.
🏬 D-Mart abrió 15 tiendas durante el trimestre, con lo que su red llegó a 518. Sin embargo, la actualización actual aún no incluye datos sobre beneficios, márgenes ni ventas en tiendas comparables.
🔎 Ahora la atención se centra en los resultados completos del 10 de octubre. Si mejoran los márgenes y el crecimiento de las transacciones, la actual ola de ventas podría parecer relativamente brusca en comparación con el desempeño subyacente del negocio.
#IndiaStocks $DMART
20
·
--
Alcista
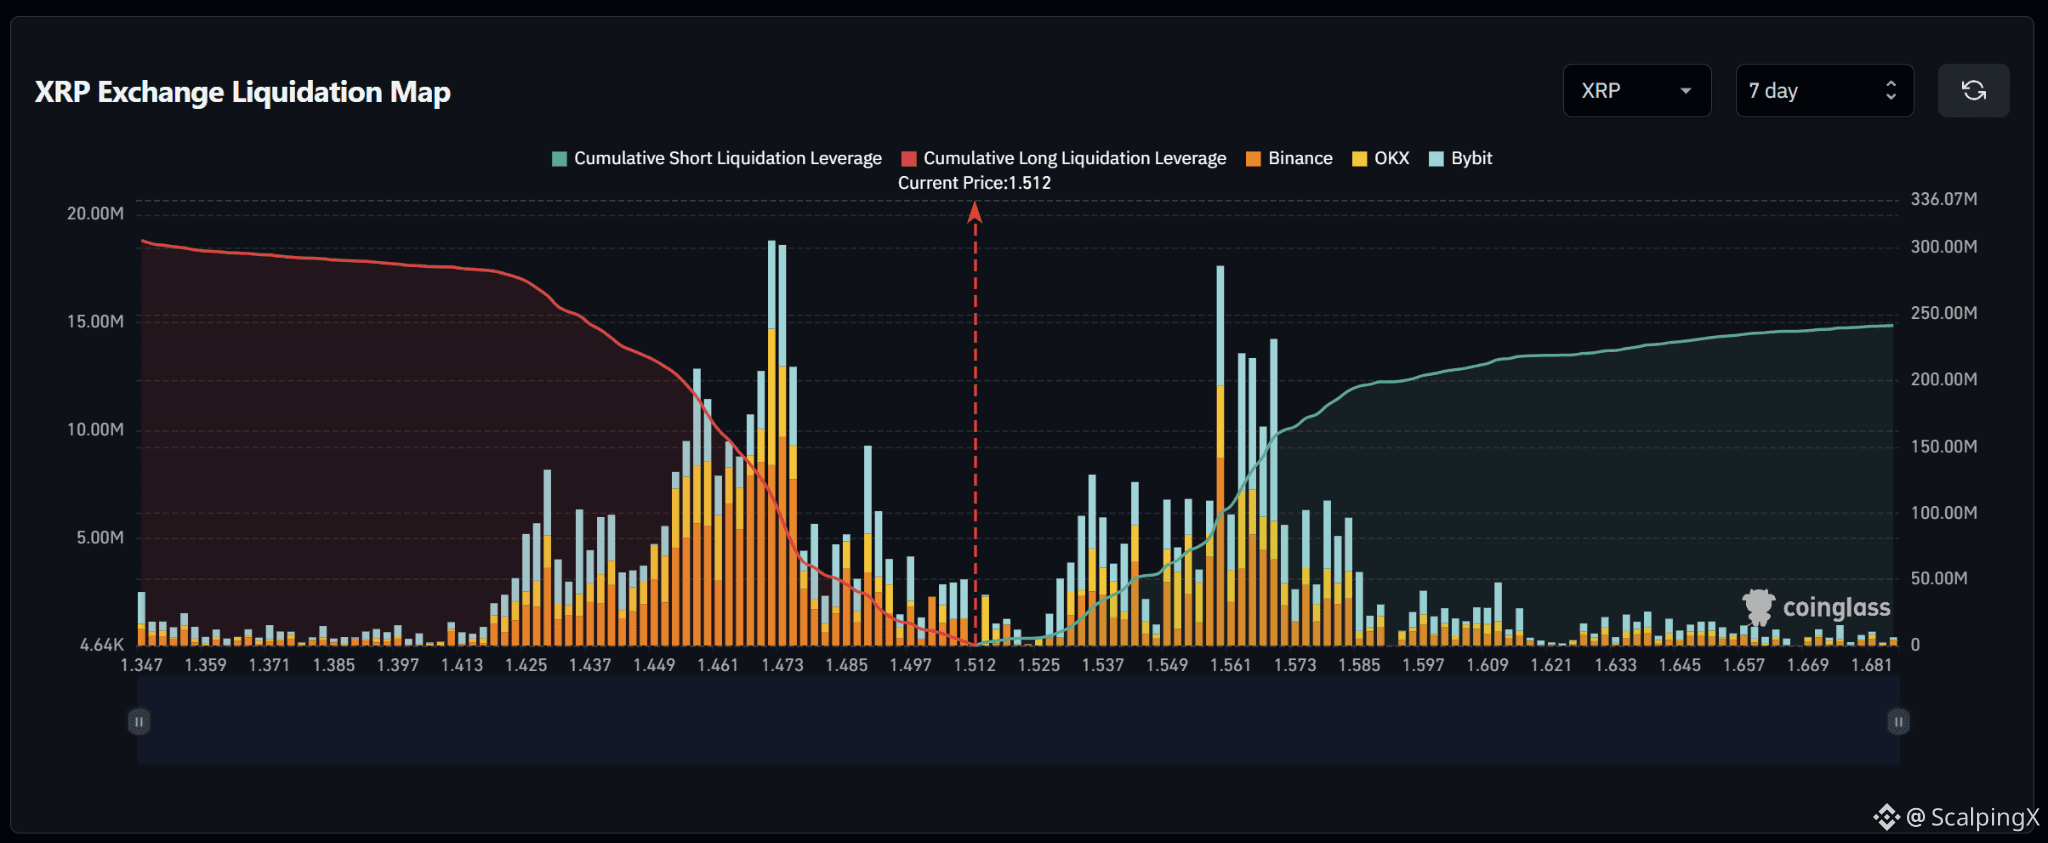
$XRP – Mapa de liquidaciones (7 días) – Precio actual 1.512
🔎 El mapa de liquidaciones de 7 días muestra aproximadamente entre 300 y 305 millones de USD en liquidaciones de posiciones largas por debajo del precio actual, superando los aproximadamente 240–245 millones de USD en liquidaciones de posiciones cortas por encima. Por lo tanto, la estructura de liquidez presenta una inclinación bajista bastante clara, con alrededor de 1,25 veces más liquidez acumulada por debajo del mercado.
📉 Por debajo del mercado, la liquidez de las liquidaciones de posiciones largas se concentra en gran medida entre 1.449 y 1.476. El grupo más fuerte se encuentra alrededor de 1.468–1.474, con varias barras de entre 13 y 19 millones de USD, mientras que entre 1.450 y 1.463 también hay varios grupos de entre 8 y 13 millones de USD. Si se pierde el nivel de 1.497–1.485, la atención se desplazaría hacia 1.476–1.468 y, después, hacia 1.461–1.449.
📈 Por encima del mercado, la liquidez de las liquidaciones de posiciones cortas se concentra entre 1.535 y 1.585. El grupo más fuerte se encuentra alrededor de 1.556–1.573, con varias barras de entre 10 y 18 millones de USD; destaca especialmente la zona de 1.559–1.562. Más arriba, entre 1.575 y 1.585, se mantienen varias barras de entre 5 y 7 millones de USD.
🧭 El panorama general favorece una caída, ya que la exposición a liquidaciones de posiciones largas es mayor por debajo del mercado. Si se pierde el nivel de 1.497–1.485, aumentaría la probabilidad de un barrido hacia 1.476–1.468, seguido de 1.461–1.449. En cambio, una ruptura por encima de 1.535–1.549 dejaría expuestos los niveles de 1.556–1.573 y, después, de 1.580–1.585.
#LiquidationMap
$XRP – Mapa de liquidaciones (7 días) – Precio actual 1.512
🔎 El mapa de liquidaciones de 7 días muestra aproximadamente entre 300 y 305 millones de USD en liquidaciones de posiciones largas por debajo del precio actual, superando los aproximadamente 240–245 millones de USD en liquidaciones de posiciones cortas por encima. Por lo tanto, la estructura de liquidez presenta una inclinación bajista bastante clara, con alrededor de 1,25 veces más liquidez acumulada por debajo del mercado.
📉 Por debajo del mercado, la liquidez de las liquidaciones de posiciones largas se concentra en gran medida entre 1.449 y 1.476. El grupo más fuerte se encuentra alrededor de 1.468–1.474, con varias barras de entre 13 y 19 millones de USD, mientras que entre 1.450 y 1.463 también hay varios grupos de entre 8 y 13 millones de USD. Si se pierde el nivel de 1.497–1.485, la atención se desplazaría hacia 1.476–1.468 y, después, hacia 1.461–1.449.
📈 Por encima del mercado, la liquidez de las liquidaciones de posiciones cortas se concentra entre 1.535 y 1.585. El grupo más fuerte se encuentra alrededor de 1.556–1.573, con varias barras de entre 10 y 18 millones de USD; destaca especialmente la zona de 1.559–1.562. Más arriba, entre 1.575 y 1.585, se mantienen varias barras de entre 5 y 7 millones de USD.
🧭 El panorama general favorece una caída, ya que la exposición a liquidaciones de posiciones largas es mayor por debajo del mercado. Si se pierde el nivel de 1.497–1.485, aumentaría la probabilidad de un barrido hacia 1.476–1.468, seguido de 1.461–1.449. En cambio, una ruptura por encima de 1.535–1.549 dejaría expuestos los niveles de 1.556–1.573 y, después, de 1.580–1.585.
#LiquidationMap
🔎 El mapa de liquidaciones de 7 días muestra aproximadamente entre 300 y 305 millones de USD en liquidaciones de posiciones largas por debajo del precio actual, superando los aproximadamente 240–245 millones de USD en liquidaciones de posiciones cortas por encima. Por lo tanto, la estructura de liquidez presenta una inclinación bajista bastante clara, con alrededor de 1,25 veces más liquidez acumulada por debajo del mercado.
📉 Por debajo del mercado, la liquidez de las liquidaciones de posiciones largas se concentra en gran medida entre 1.449 y 1.476. El grupo más fuerte se encuentra alrededor de 1.468–1.474, con varias barras de entre 13 y 19 millones de USD, mientras que entre 1.450 y 1.463 también hay varios grupos de entre 8 y 13 millones de USD. Si se pierde el nivel de 1.497–1.485, la atención se desplazaría hacia 1.476–1.468 y, después, hacia 1.461–1.449.
📈 Por encima del mercado, la liquidez de las liquidaciones de posiciones cortas se concentra entre 1.535 y 1.585. El grupo más fuerte se encuentra alrededor de 1.556–1.573, con varias barras de entre 10 y 18 millones de USD; destaca especialmente la zona de 1.559–1.562. Más arriba, entre 1.575 y 1.585, se mantienen varias barras de entre 5 y 7 millones de USD.
🧭 El panorama general favorece una caída, ya que la exposición a liquidaciones de posiciones largas es mayor por debajo del mercado. Si se pierde el nivel de 1.497–1.485, aumentaría la probabilidad de un barrido hacia 1.476–1.468, seguido de 1.461–1.449. En cambio, una ruptura por encima de 1.535–1.549 dejaría expuestos los niveles de 1.556–1.573 y, después, de 1.580–1.585.
#LiquidationMap
17
·
--
Alcista
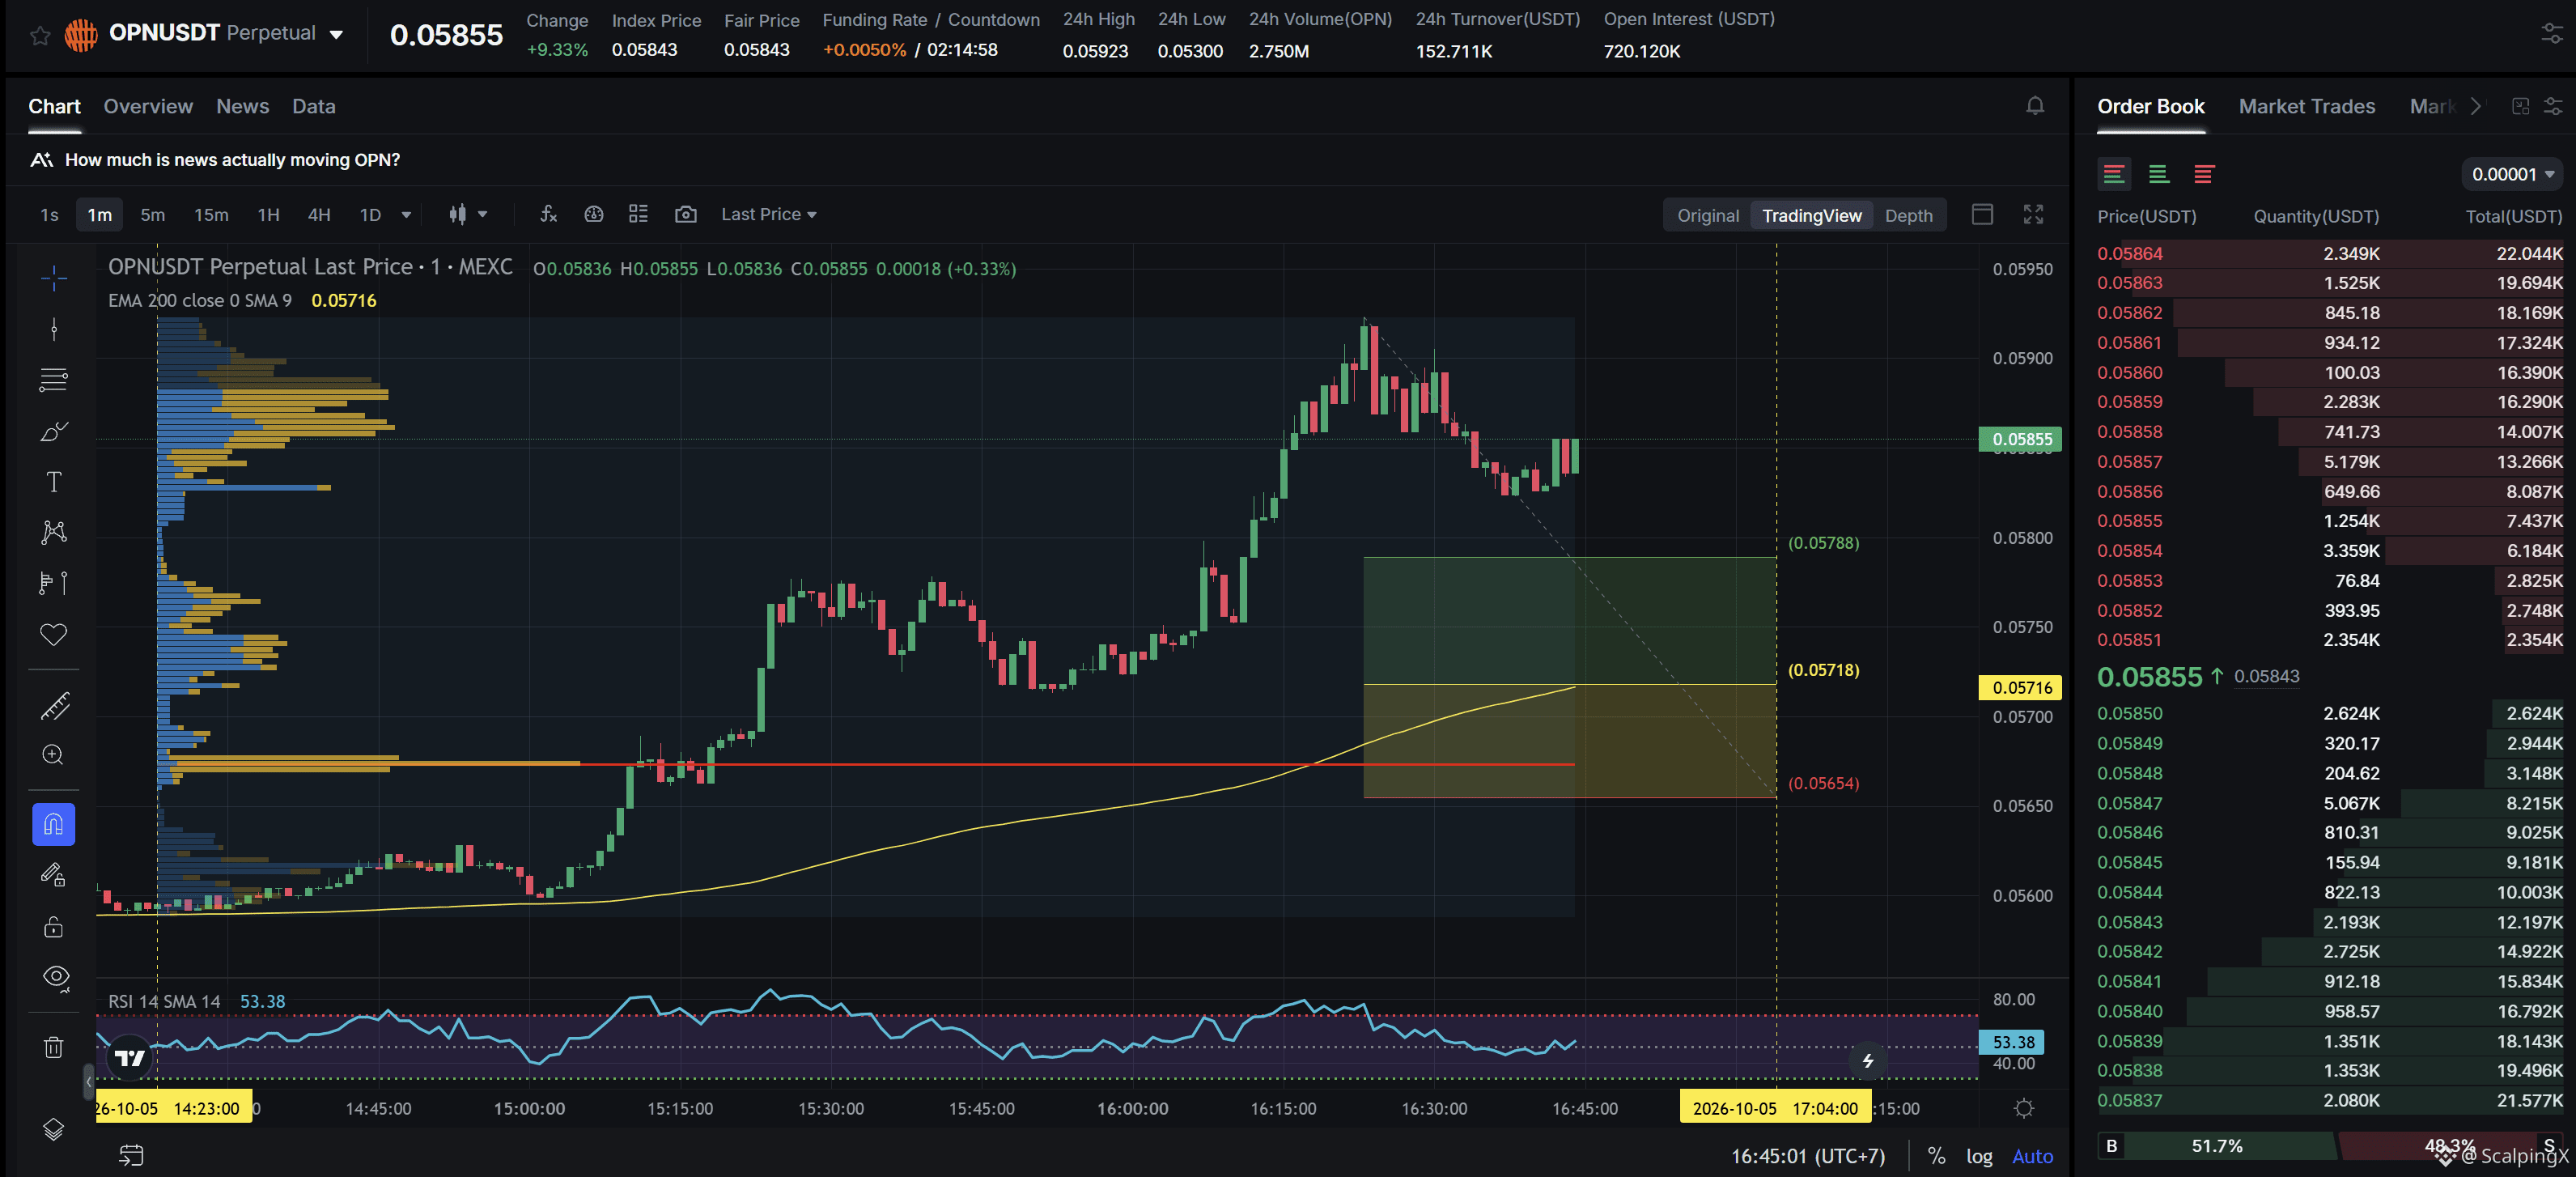
$OPN - Capitalización de mercado: 10.64 M$ - Sentimiento de las últimas 24 h: neutral
SC02 M1 - orden larga pendiente. La entrada incluye el POC y no se ve afectada por ninguna zona débil. La zona de soporte actual tiene aproximadamente un 1.11% de amplitud. La tendencia alcista ha durado 2 horas y 23 minutos, con un aumento máximo registrado del precio del 5.97%. Si el precio pierde esta zona de soporte, es muy probable que la tendencia se revierta a la baja.
$OPN - Capitalización de mercado: 10.64 M$ - Sentimiento de las últimas 24 h: neutral
SC02 M1 - orden larga pendiente. La entrada incluye el POC y no se ve afectada por ninguna zona débil. La zona de soporte actual tiene aproximadamente un 1.11% de amplitud. La tendencia alcista ha durado 2 horas y 23 minutos, con un aumento máximo registrado del precio del 5.97%. Si el precio pierde esta zona de soporte, es muy probable que la tendencia se revierta a la baja.
SC02 M1 - orden larga pendiente. La entrada incluye el POC y no se ve afectada por ninguna zona débil. La zona de soporte actual tiene aproximadamente un 1.11% de amplitud. La tendencia alcista ha durado 2 horas y 23 minutos, con un aumento máximo registrado del precio del 5.97%. Si el precio pierde esta zona de soporte, es muy probable que la tendencia se revierta a la baja.
11
·
--
Alcista
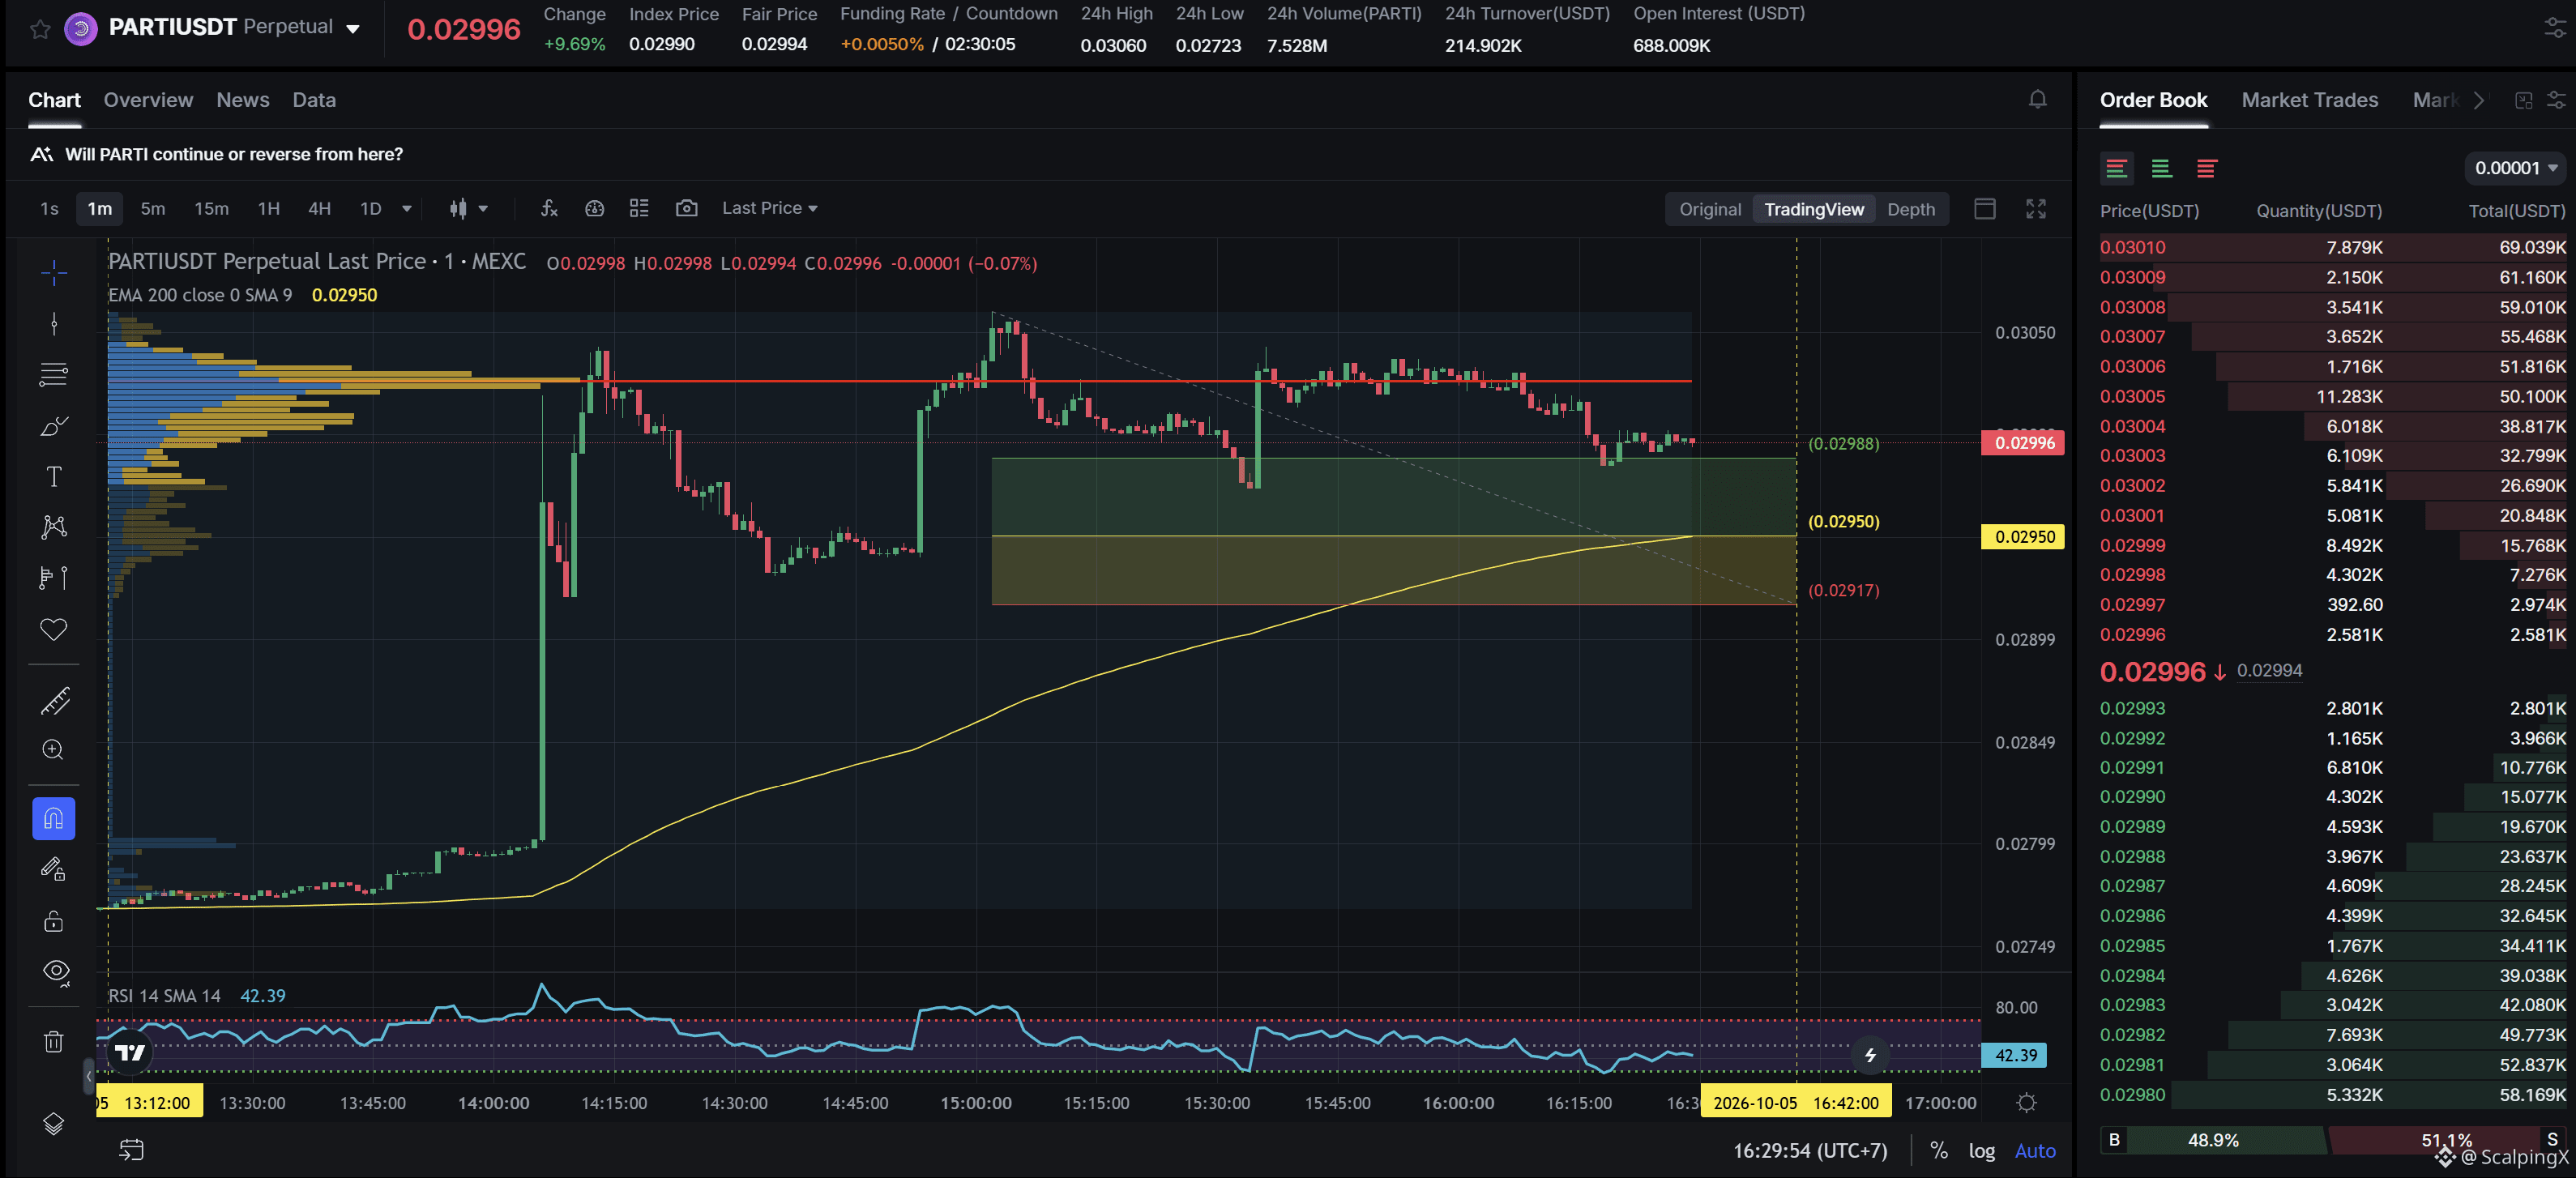
$PARTI - Capitalización de mercado: 20.06M$ - Sentimiento en 24 h: +6.00 Alcista
SC02 M1 - Orden larga pendiente. La entrada se encuentra dentro de una LVN y no está afectada por ninguna zona débil. La zona de soporte actual tiene aproximadamente un 1.14% de amplitud. La tendencia alcista ha durado 3 horas y 19 minutos, con un aumento máximo registrado del precio del 10.57%. Si el precio pierde esta zona de soporte, es muy probable que la tendencia se revierta a la baja.
$PARTI - Capitalización de mercado: 20.06M$ - Sentimiento en 24 h: +6.00 Alcista
SC02 M1 - Orden larga pendiente. La entrada se encuentra dentro de una LVN y no está afectada por ninguna zona débil. La zona de soporte actual tiene aproximadamente un 1.14% de amplitud. La tendencia alcista ha durado 3 horas y 19 minutos, con un aumento máximo registrado del precio del 10.57%. Si el precio pierde esta zona de soporte, es muy probable que la tendencia se revierta a la baja.
SC02 M1 - Orden larga pendiente. La entrada se encuentra dentro de una LVN y no está afectada por ninguna zona débil. La zona de soporte actual tiene aproximadamente un 1.14% de amplitud. La tendencia alcista ha durado 3 horas y 19 minutos, con un aumento máximo registrado del precio del 10.57%. Si el precio pierde esta zona de soporte, es muy probable que la tendencia se revierta a la baja.
23
·
--
Alcista
El trigo de Chicago prolonga su repunte, pero aún no hay un nuevo shock de oferta
🌾 Los futuros del trigo de Chicago subieron hasta un 1% antes de reducir las ganancias a alrededor de un +0,6%, cerca de los 6,87 USD por bushel. Esto marcó la racha alcista más larga en un mes, aunque los precios se mantienen apenas por encima del mínimo de seis semanas del viernes, cercano a los 6,825 USD.
⚓ La última declaración de Rusia no mencionó directamente puertos, buques ni exportaciones de cereales. Es mejor interpretar este movimiento como una señal de que el mercado mantiene la prima de riesgo del mar Negro que ya estaba incorporada, y no como una reacción a un nuevo shock geopolítico de oferta.
📉 Los riesgos para el suministro físico siguen siendo más significativos: Sovecon redujo su previsión de exportaciones rusas de cereales para 2026/27 de 49,4 millones a 44,7 millones de toneladas. El maíz bajó, mientras que la soja apenas varió, lo que refuerza la idea de que el movimiento actual sigue siendo, en gran medida, específico del trigo.
#Wheat $FIL
El trigo de Chicago prolonga su repunte, pero aún no hay un nuevo shock de oferta
🌾 Los futuros del trigo de Chicago subieron hasta un 1% antes de reducir las ganancias a alrededor de un +0,6%, cerca de los 6,87 USD por bushel. Esto marcó la racha alcista más larga en un mes, aunque los precios se mantienen apenas por encima del mínimo de seis semanas del viernes, cercano a los 6,825 USD.
⚓ La última declaración de Rusia no mencionó directamente puertos, buques ni exportaciones de cereales. Es mejor interpretar este movimiento como una señal de que el mercado mantiene la prima de riesgo del mar Negro que ya estaba incorporada, y no como una reacción a un nuevo shock geopolítico de oferta.
📉 Los riesgos para el suministro físico siguen siendo más significativos: Sovecon redujo su previsión de exportaciones rusas de cereales para 2026/27 de 49,4 millones a 44,7 millones de toneladas. El maíz bajó, mientras que la soja apenas varió, lo que refuerza la idea de que el movimiento actual sigue siendo, en gran medida, específico del trigo.
#Wheat $FIL
🌾 Los futuros del trigo de Chicago subieron hasta un 1% antes de reducir las ganancias a alrededor de un +0,6%, cerca de los 6,87 USD por bushel. Esto marcó la racha alcista más larga en un mes, aunque los precios se mantienen apenas por encima del mínimo de seis semanas del viernes, cercano a los 6,825 USD.
⚓ La última declaración de Rusia no mencionó directamente puertos, buques ni exportaciones de cereales. Es mejor interpretar este movimiento como una señal de que el mercado mantiene la prima de riesgo del mar Negro que ya estaba incorporada, y no como una reacción a un nuevo shock geopolítico de oferta.
📉 Los riesgos para el suministro físico siguen siendo más significativos: Sovecon redujo su previsión de exportaciones rusas de cereales para 2026/27 de 49,4 millones a 44,7 millones de toneladas. El maíz bajó, mientras que la soja apenas varió, lo que refuerza la idea de que el movimiento actual sigue siendo, en gran medida, específico del trigo.
#Wheat $FIL

252
·
--
Alcista
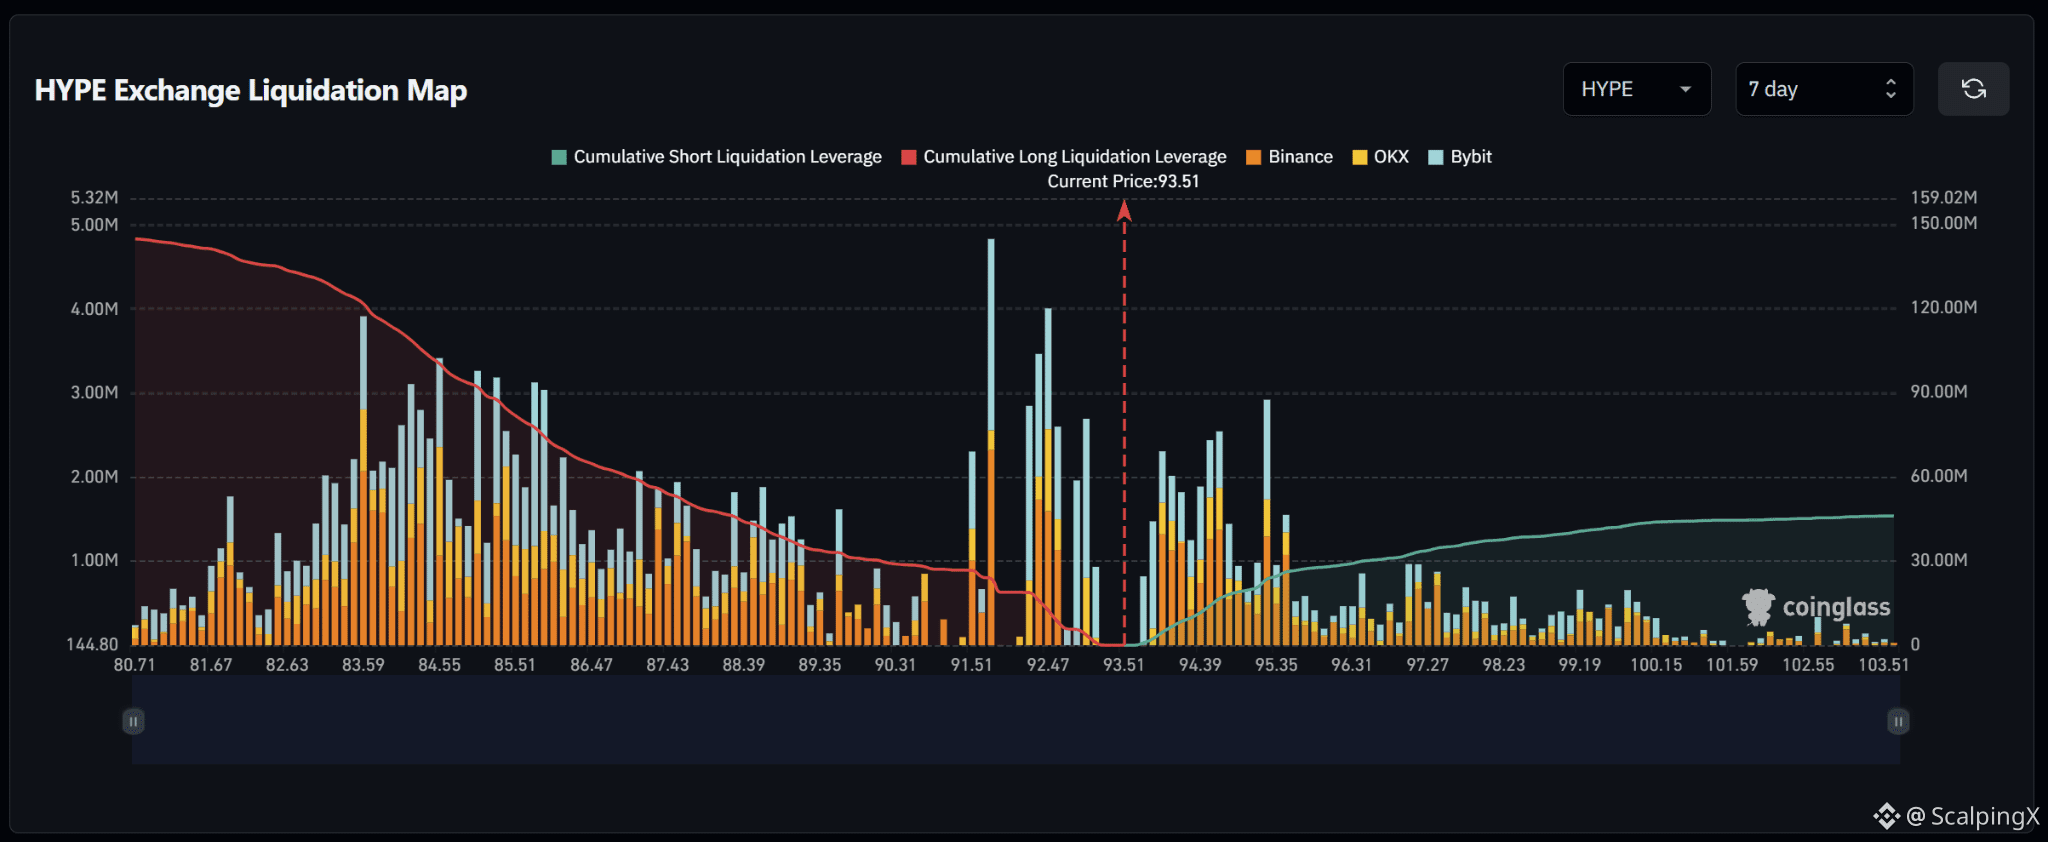
$HYPE – Mapa de liquidaciones (7 días) – Precio actual 93.51
🔎 El mapa de liquidaciones de 7 días muestra aproximadamente 145 millones de USD en liquidaciones de posiciones largas por debajo del precio actual, casi cuatro veces los aproximadamente 35–38 millones de USD en liquidaciones de posiciones cortas por encima. Por lo tanto, la estructura de liquidez presenta un sesgo bajista muy marcado.
📉 Por debajo del mercado, la liquidez de liquidaciones de posiciones largas se concentra notablemente entre 91.5 y 92.8. El grupo más fuerte se encuentra alrededor de 91.7–92.0, con una barra cercana a los 4.8 millones de USD, mientras que entre 92.3 y 92.6 hay barras adicionales de unos 3–4 millones de USD. Más abajo, entre 83.5 y 85.8, se mantiene otra banda importante de liquidez.
📈 Por encima del mercado, la liquidez más cercana de liquidaciones de posiciones cortas se concentra entre 94.0 y 95.6. Destacan grupos alrededor de 94.0–94.6, con barras cercanas a los 2–2.5 millones de USD, y de 95.2–95.5, con una barra de casi 2.9 millones de USD. La liquidez se reduce notablemente por encima de 96.0.
🧭 El panorama general favorece claramente una caída, ya que la exposición a liquidaciones de posiciones largas por debajo del precio predomina. Perder el nivel de 92.5–91.5 aumentaría la probabilidad de un barrido más profundo hacia 90.3–89.3, seguido de 87.5–85.5. En cambio, superar 94.0–94.6 dejaría expuesto el nivel de 95.2–95.6 antes de que la liquidez se reduzca.
#LiquidationMap
$HYPE – Mapa de liquidaciones (7 días) – Precio actual 93.51
🔎 El mapa de liquidaciones de 7 días muestra aproximadamente 145 millones de USD en liquidaciones de posiciones largas por debajo del precio actual, casi cuatro veces los aproximadamente 35–38 millones de USD en liquidaciones de posiciones cortas por encima. Por lo tanto, la estructura de liquidez presenta un sesgo bajista muy marcado.
📉 Por debajo del mercado, la liquidez de liquidaciones de posiciones largas se concentra notablemente entre 91.5 y 92.8. El grupo más fuerte se encuentra alrededor de 91.7–92.0, con una barra cercana a los 4.8 millones de USD, mientras que entre 92.3 y 92.6 hay barras adicionales de unos 3–4 millones de USD. Más abajo, entre 83.5 y 85.8, se mantiene otra banda importante de liquidez.
📈 Por encima del mercado, la liquidez más cercana de liquidaciones de posiciones cortas se concentra entre 94.0 y 95.6. Destacan grupos alrededor de 94.0–94.6, con barras cercanas a los 2–2.5 millones de USD, y de 95.2–95.5, con una barra de casi 2.9 millones de USD. La liquidez se reduce notablemente por encima de 96.0.
🧭 El panorama general favorece claramente una caída, ya que la exposición a liquidaciones de posiciones largas por debajo del precio predomina. Perder el nivel de 92.5–91.5 aumentaría la probabilidad de un barrido más profundo hacia 90.3–89.3, seguido de 87.5–85.5. En cambio, superar 94.0–94.6 dejaría expuesto el nivel de 95.2–95.6 antes de que la liquidez se reduzca.
#LiquidationMap
🔎 El mapa de liquidaciones de 7 días muestra aproximadamente 145 millones de USD en liquidaciones de posiciones largas por debajo del precio actual, casi cuatro veces los aproximadamente 35–38 millones de USD en liquidaciones de posiciones cortas por encima. Por lo tanto, la estructura de liquidez presenta un sesgo bajista muy marcado.
📉 Por debajo del mercado, la liquidez de liquidaciones de posiciones largas se concentra notablemente entre 91.5 y 92.8. El grupo más fuerte se encuentra alrededor de 91.7–92.0, con una barra cercana a los 4.8 millones de USD, mientras que entre 92.3 y 92.6 hay barras adicionales de unos 3–4 millones de USD. Más abajo, entre 83.5 y 85.8, se mantiene otra banda importante de liquidez.
📈 Por encima del mercado, la liquidez más cercana de liquidaciones de posiciones cortas se concentra entre 94.0 y 95.6. Destacan grupos alrededor de 94.0–94.6, con barras cercanas a los 2–2.5 millones de USD, y de 95.2–95.5, con una barra de casi 2.9 millones de USD. La liquidez se reduce notablemente por encima de 96.0.
🧭 El panorama general favorece claramente una caída, ya que la exposición a liquidaciones de posiciones largas por debajo del precio predomina. Perder el nivel de 92.5–91.5 aumentaría la probabilidad de un barrido más profundo hacia 90.3–89.3, seguido de 87.5–85.5. En cambio, superar 94.0–94.6 dejaría expuesto el nivel de 95.2–95.6 antes de que la liquidez se reduzca.
#LiquidationMap
24
·
--
Alcista
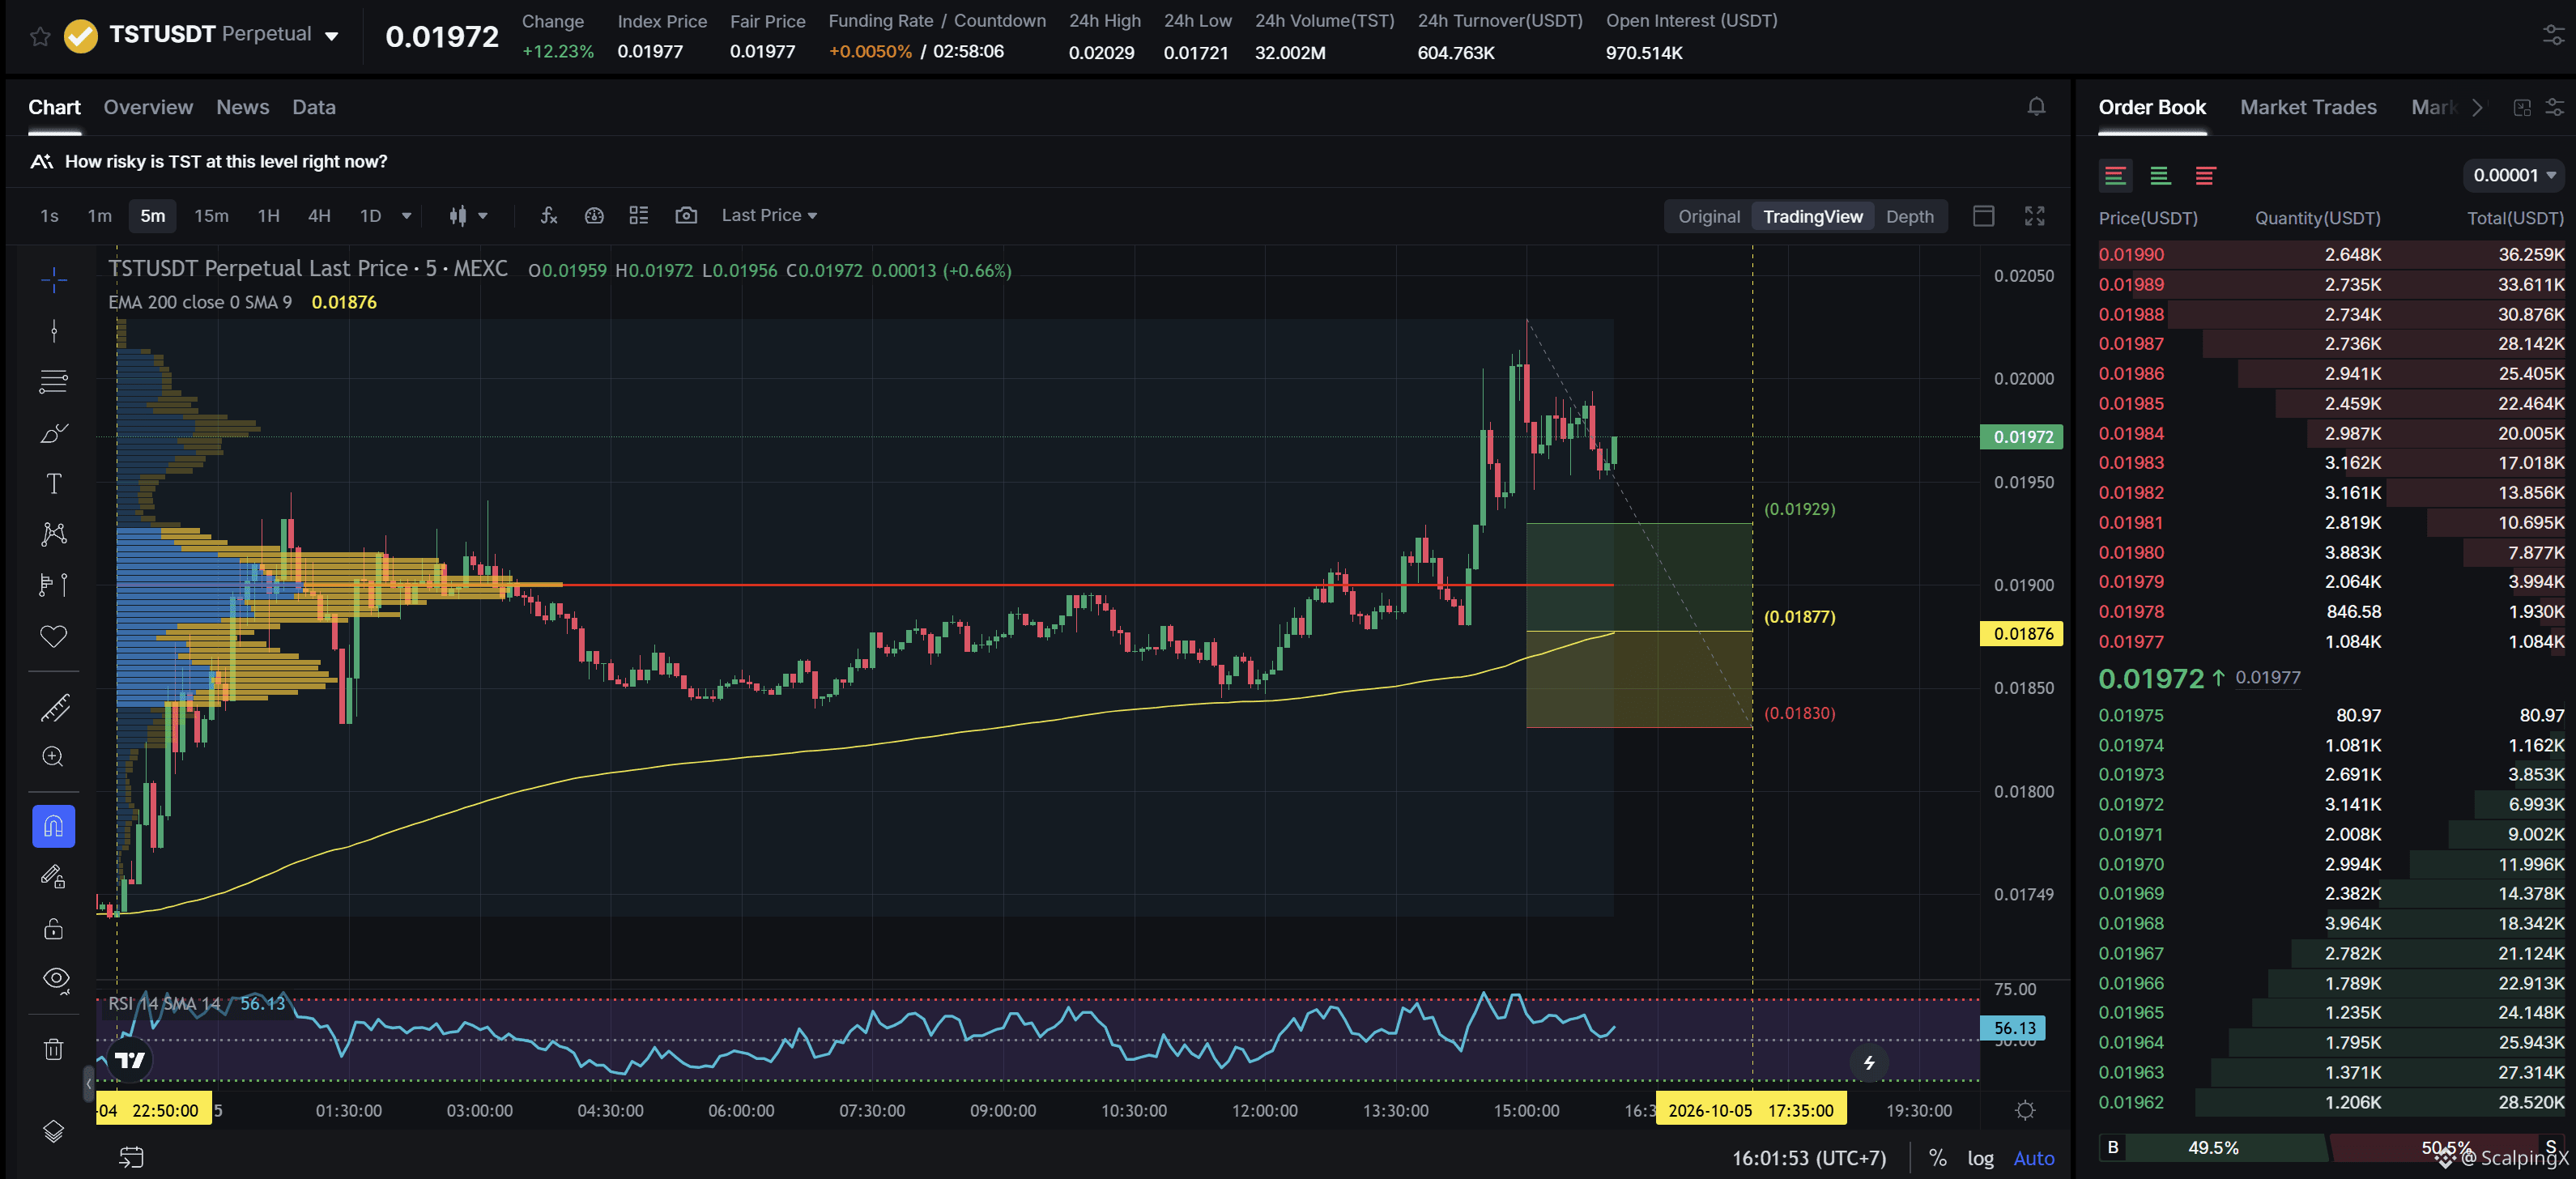
$TST - Capitalización de mercado 18,33 M$ - Sentimiento de 24 h +4,42 Alcista
SC02 M5 - Orden larga pendiente. La entrada se encuentra dentro del HVN y no está afectada por ninguna zona débil; la zona de soporte actual tiene aproximadamente un 2,42 % de anchura. La tendencia alcista ha durado 17 horas y 10 minutos, con un aumento máximo registrado del precio del 16,59 %. Si el precio pierde esta zona de soporte, es muy probable que la tendencia se revierta a la baja.
$TST - Capitalización de mercado 18,33 M$ - Sentimiento de 24 h +4,42 Alcista
SC02 M5 - Orden larga pendiente. La entrada se encuentra dentro del HVN y no está afectada por ninguna zona débil; la zona de soporte actual tiene aproximadamente un 2,42 % de anchura. La tendencia alcista ha durado 17 horas y 10 minutos, con un aumento máximo registrado del precio del 16,59 %. Si el precio pierde esta zona de soporte, es muy probable que la tendencia se revierta a la baja.
SC02 M5 - Orden larga pendiente. La entrada se encuentra dentro del HVN y no está afectada por ninguna zona débil; la zona de soporte actual tiene aproximadamente un 2,42 % de anchura. La tendencia alcista ha durado 17 horas y 10 minutos, con un aumento máximo registrado del precio del 16,59 %. Si el precio pierde esta zona de soporte, es muy probable que la tendencia se revierta a la baja.
20
·
--
Alcista
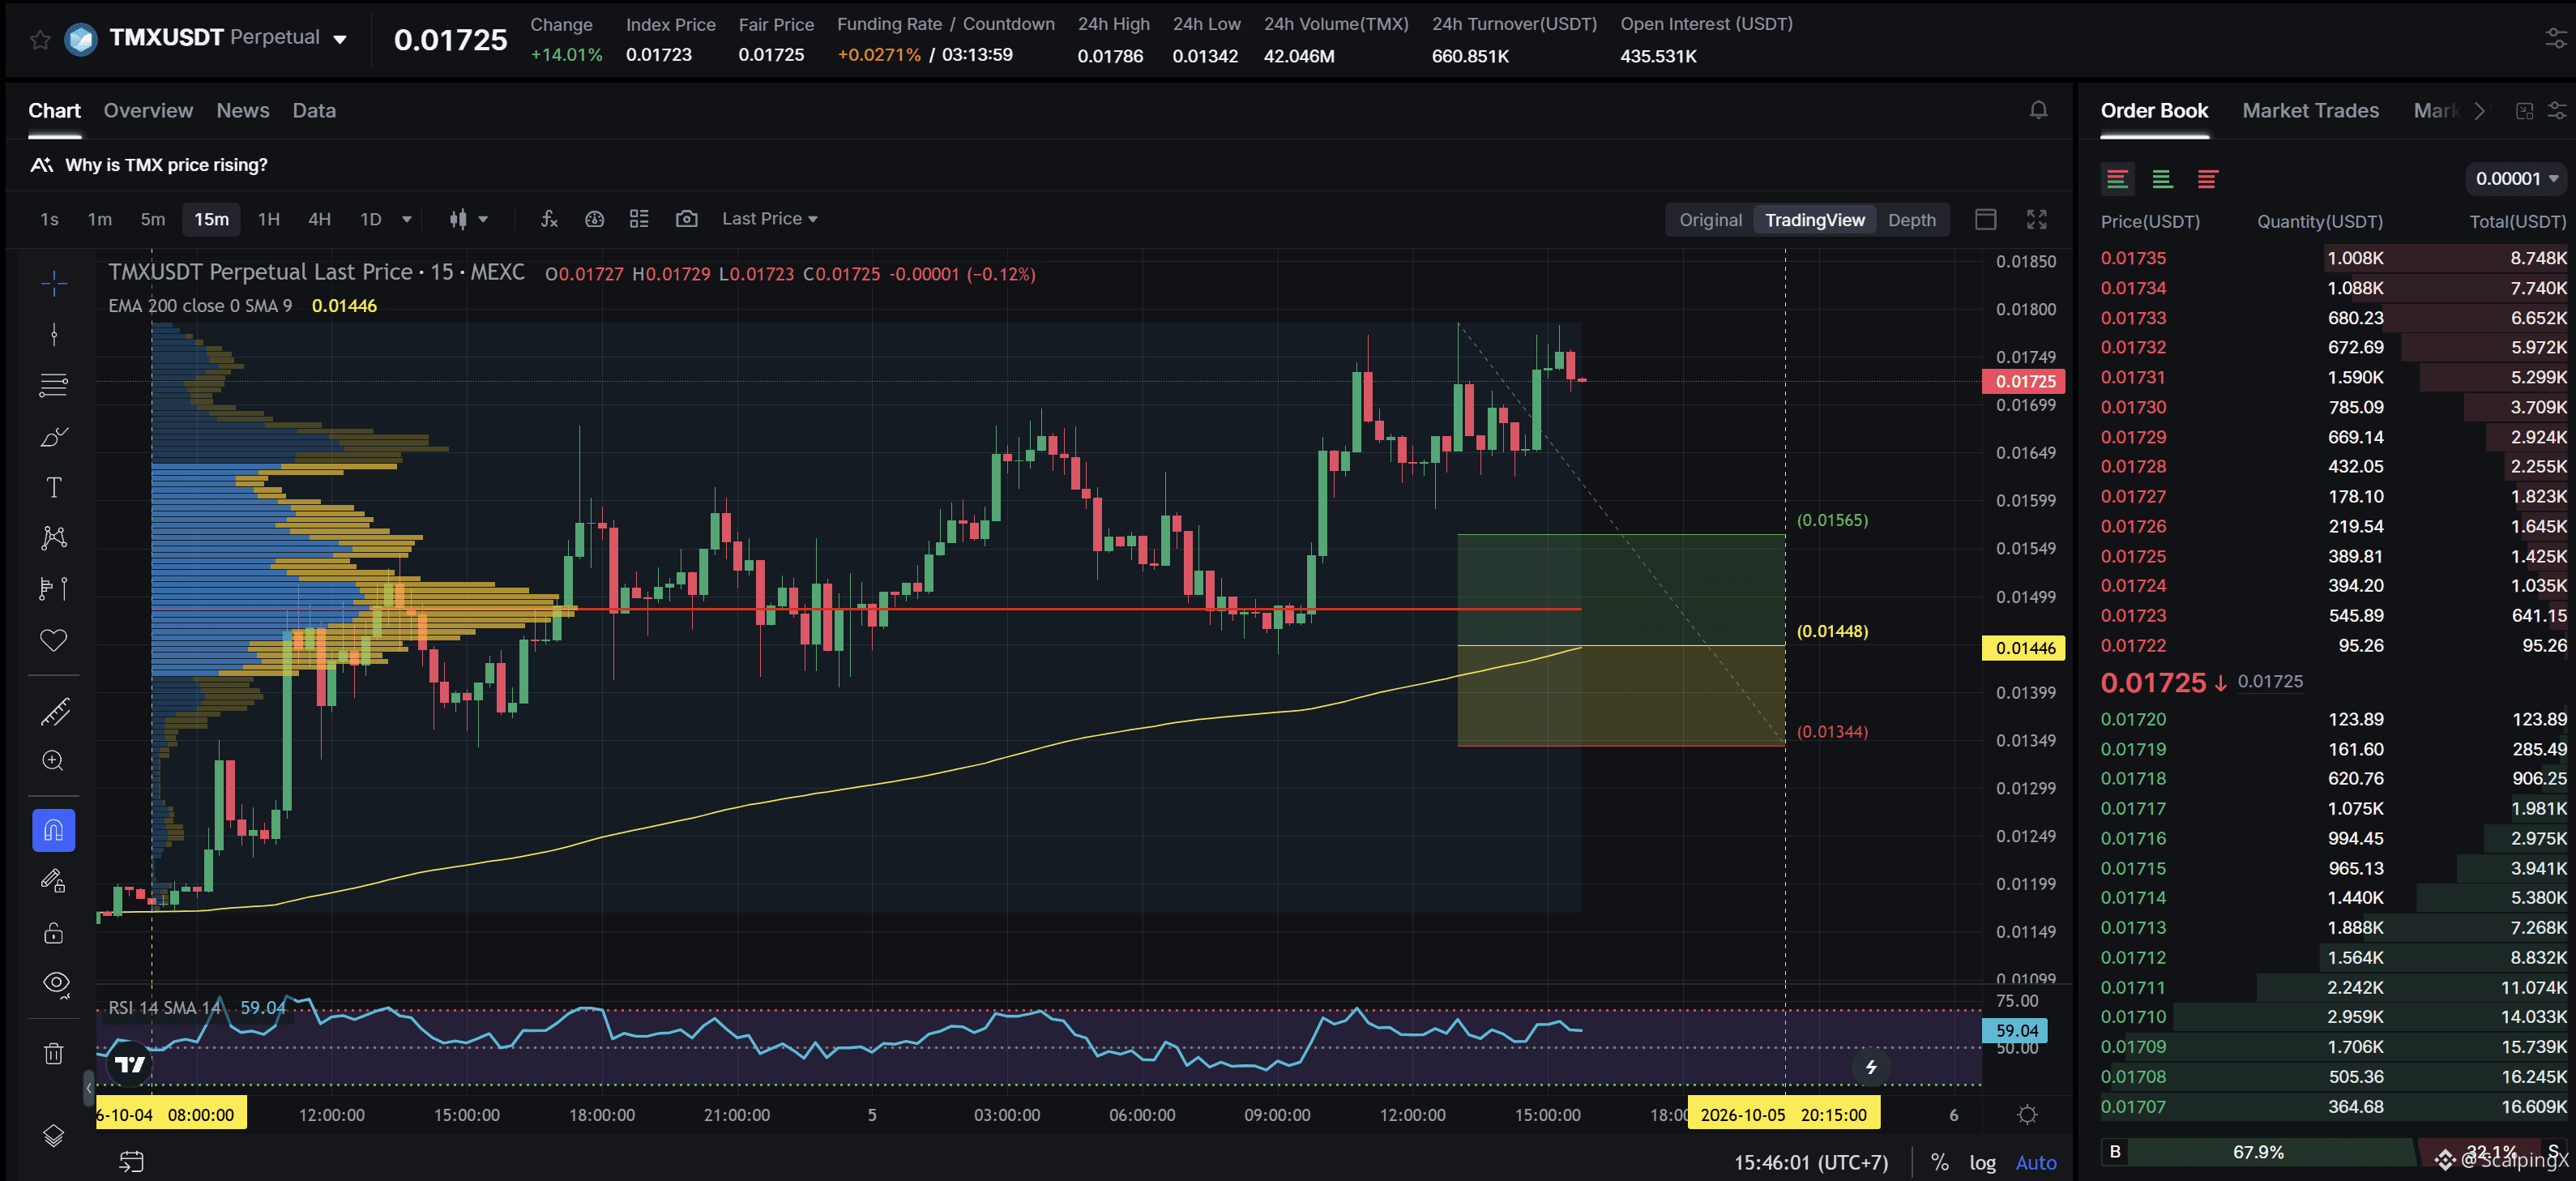
$TMX - Capitalización de mercado: 2.58M$ - Sentimiento en 24 h: +4.32 alcista
SC02 M15 - orden larga pendiente. La entrada se encuentra dentro de una zona de bajo volumen (LVN) y no está afectada por ninguna zona débil; la zona de soporte actual tiene una amplitud aproximada del 6.96%. La tendencia alcista ha durado 1 día, 7 horas y 45 minutos, con un aumento máximo registrado del precio del 52.51%. Si el precio pierde esta zona de soporte, es muy probable que la tendencia se revierta a la baja.
$TMX - Capitalización de mercado: 2.58M$ - Sentimiento en 24 h: +4.32 alcista
SC02 M15 - orden larga pendiente. La entrada se encuentra dentro de una zona de bajo volumen (LVN) y no está afectada por ninguna zona débil; la zona de soporte actual tiene una amplitud aproximada del 6.96%. La tendencia alcista ha durado 1 día, 7 horas y 45 minutos, con un aumento máximo registrado del precio del 52.51%. Si el precio pierde esta zona de soporte, es muy probable que la tendencia se revierta a la baja.
SC02 M15 - orden larga pendiente. La entrada se encuentra dentro de una zona de bajo volumen (LVN) y no está afectada por ninguna zona débil; la zona de soporte actual tiene una amplitud aproximada del 6.96%. La tendencia alcista ha durado 1 día, 7 horas y 45 minutos, con un aumento máximo registrado del precio del 52.51%. Si el precio pierde esta zona de soporte, es muy probable que la tendencia se revierta a la baja.
14
·
--
Hang Seng prácticamente plano, pero se acentúa la divergencia sectorial antes de la reapertura de Stock Connect
📉 El Hang Seng se mantuvo casi plano, en torno a los 23.950 puntos, durante la sesión del mediodía, pero el mercado subyacente mostró una clara divergencia. Las acciones inmobiliarias cayeron alrededor de un 0,9% y las financieras perdieron un 0,7%, mientras que el índice Hang Seng Tech ganó un 0,3%.
💻 Las empresas tecnológicas y de semiconductores siguieron destacando, con Hua Hong al alza cerca de un 4% y Kingboard Laminates subiendo un 9%. El capital siguió concentrándose en acciones vinculadas a la inteligencia artificial y los chips.
🌏 La liquidez fue más escasa de lo habitual, ya que los mercados de China continental permanecieron cerrados por la Semana Dorada y Stock Connect estuvo suspendido. Por ello, el pequeño movimiento del Hang Seng quizá no refleje plenamente la oferta y la demanda subyacentes.
📅 El 8 de octubre será una fecha clave, cuando reabran los mercados de China continental y Stock Connect. El regreso de los flujos de capital de China continental debería ofrecer una señal más clara sobre si la reciente debilidad se debió principalmente a la falta de liquidez o reflejó una presión vendedora más generalizada.
#HongKongStocks $CXMT
Hang Seng prácticamente plano, pero se acentúa la divergencia sectorial antes de la reapertura de Stock Connect
📉 El Hang Seng se mantuvo casi plano, en torno a los 23.950 puntos, durante la sesión del mediodía, pero el mercado subyacente mostró una clara divergencia. Las acciones inmobiliarias cayeron alrededor de un 0,9% y las financieras perdieron un 0,7%, mientras que el índice Hang Seng Tech ganó un 0,3%.
💻 Las empresas tecnológicas y de semiconductores siguieron destacando, con Hua Hong al alza cerca de un 4% y Kingboard Laminates subiendo un 9%. El capital siguió concentrándose en acciones vinculadas a la inteligencia artificial y los chips.
🌏 La liquidez fue más escasa de lo habitual, ya que los mercados de China continental permanecieron cerrados por la Semana Dorada y Stock Connect estuvo suspendido. Por ello, el pequeño movimiento del Hang Seng quizá no refleje plenamente la oferta y la demanda subyacentes.
📅 El 8 de octubre será una fecha clave, cuando reabran los mercados de China continental y Stock Connect. El regreso de los flujos de capital de China continental debería ofrecer una señal más clara sobre si la reciente debilidad se debió principalmente a la falta de liquidez o reflejó una presión vendedora más generalizada.
#HongKongStocks $CXMT
📉 El Hang Seng se mantuvo casi plano, en torno a los 23.950 puntos, durante la sesión del mediodía, pero el mercado subyacente mostró una clara divergencia. Las acciones inmobiliarias cayeron alrededor de un 0,9% y las financieras perdieron un 0,7%, mientras que el índice Hang Seng Tech ganó un 0,3%.
💻 Las empresas tecnológicas y de semiconductores siguieron destacando, con Hua Hong al alza cerca de un 4% y Kingboard Laminates subiendo un 9%. El capital siguió concentrándose en acciones vinculadas a la inteligencia artificial y los chips.
🌏 La liquidez fue más escasa de lo habitual, ya que los mercados de China continental permanecieron cerrados por la Semana Dorada y Stock Connect estuvo suspendido. Por ello, el pequeño movimiento del Hang Seng quizá no refleje plenamente la oferta y la demanda subyacentes.
📅 El 8 de octubre será una fecha clave, cuando reabran los mercados de China continental y Stock Connect. El regreso de los flujos de capital de China continental debería ofrecer una señal más clara sobre si la reciente debilidad se debió principalmente a la falta de liquidez o reflejó una presión vendedora más generalizada.
#HongKongStocks $CXMT
123
·
--
Alcista
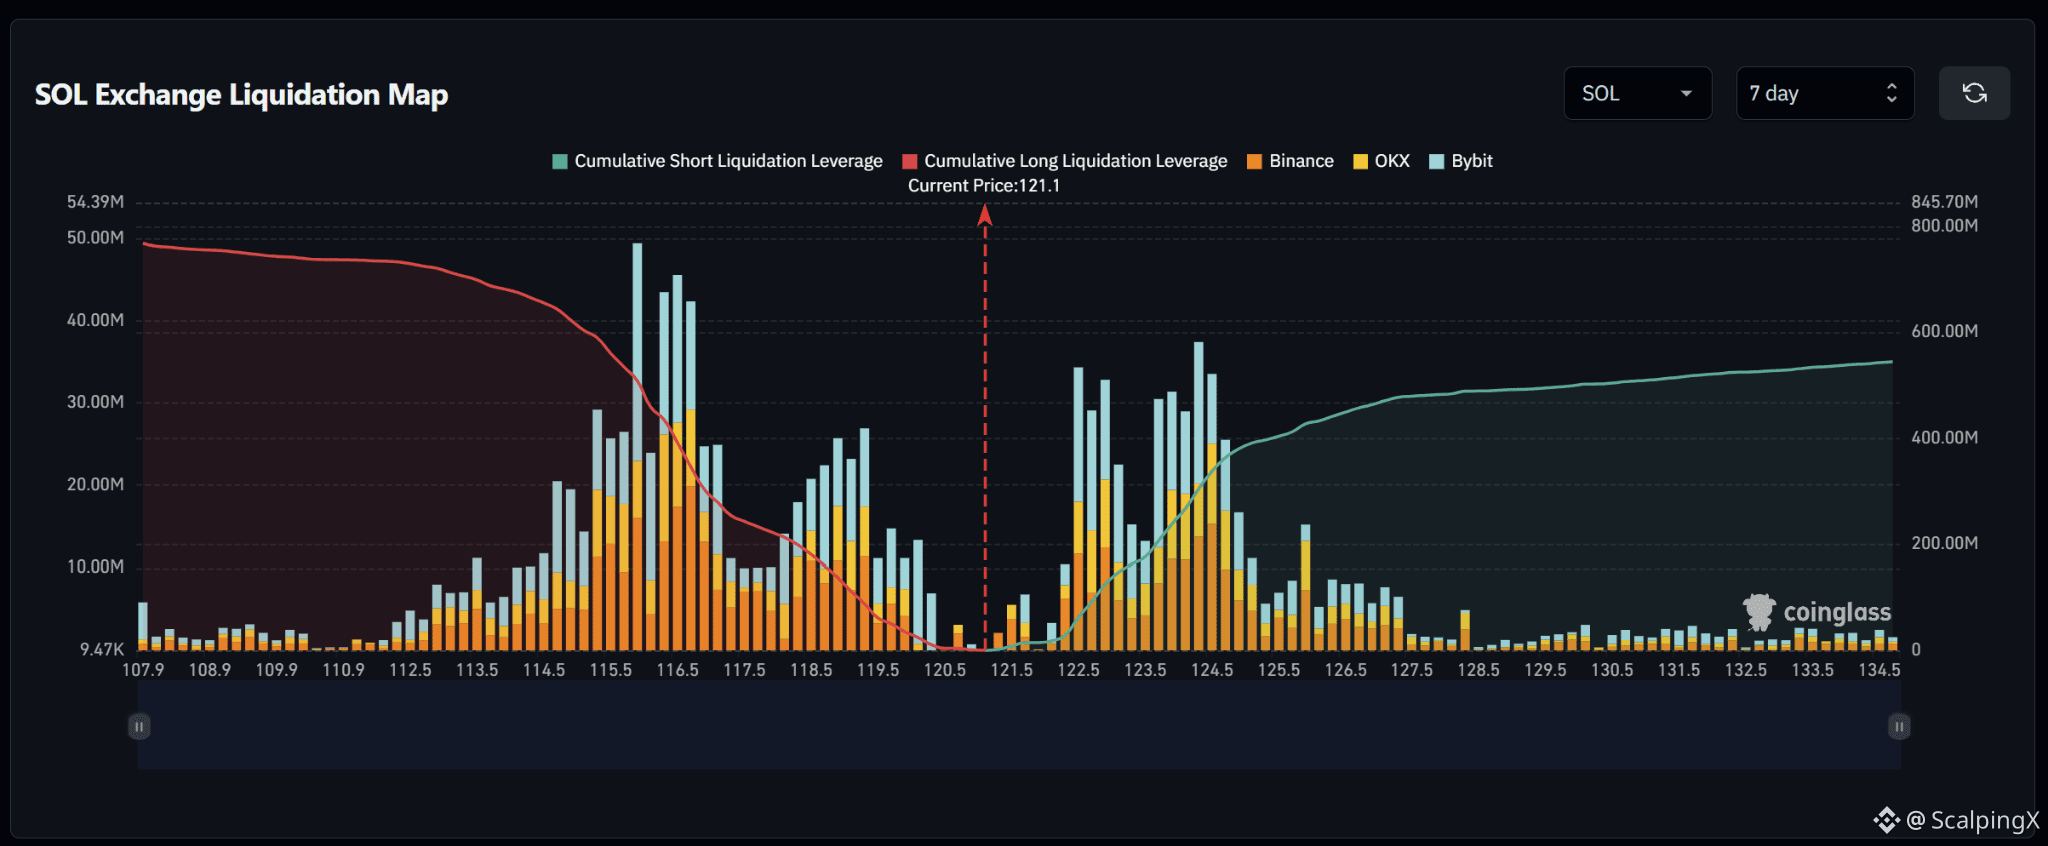
$SOL – Mapa de liquidaciones (7 días) – Precio actual 121.1
🔎 El mapa de liquidaciones de 7 días muestra aproximadamente entre 760 y 780 millones de USD en liquidaciones de posiciones largas por debajo del precio actual, frente a aproximadamente entre 540 y 560 millones de USD en liquidaciones de posiciones cortas por encima. Por lo tanto, la estructura de liquidez presenta una inclinación bajista bastante clara.
📉 Por debajo del mercado, la liquidez de liquidaciones de posiciones largas se concentra principalmente entre 115.3 y 116.8. El grupo más fuerte se sitúa alrededor de 115.8–116.6, con varias barras cercanas a los 25–49 millones de USD, mientras que entre 118.2 y 119.2 también hay otro grupo destacable, con varias barras de alrededor de 18–27 millones de USD. Perder el nivel de 120.5–119.5 dirigiría la atención hacia 118.8–118.0 y, después, hacia 116.8–115.5.
📈 Por encima del mercado, la liquidez de liquidaciones de posiciones cortas se concentra entre 122.3 y 124.8. El grupo más fuerte se sitúa alrededor de 123.5–124.5, con varias barras cercanas a los 25–38 millones de USD, mientras que entre 122.3 y 123.0 también hay barras de alrededor de 25–35 millones de USD. Más arriba, entre 125.5 y 127.0, se mantienen otras capas de liquidez más pequeñas.
🧭 El panorama general favorece una caída, ya que la exposición a liquidaciones de posiciones largas por debajo es mayor. Perder el nivel de 120.5–119.5 aumentaría la probabilidad de un barrido hacia 118.8–118.0, seguido de 116.8–115.5. En cambio, superar 122.3–123.0 dejaría expuestos los niveles de 123.5–124.5 y, después, de 125.5–127.0.
#LiquidationMap
$SOL – Mapa de liquidaciones (7 días) – Precio actual 121.1
🔎 El mapa de liquidaciones de 7 días muestra aproximadamente entre 760 y 780 millones de USD en liquidaciones de posiciones largas por debajo del precio actual, frente a aproximadamente entre 540 y 560 millones de USD en liquidaciones de posiciones cortas por encima. Por lo tanto, la estructura de liquidez presenta una inclinación bajista bastante clara.
📉 Por debajo del mercado, la liquidez de liquidaciones de posiciones largas se concentra principalmente entre 115.3 y 116.8. El grupo más fuerte se sitúa alrededor de 115.8–116.6, con varias barras cercanas a los 25–49 millones de USD, mientras que entre 118.2 y 119.2 también hay otro grupo destacable, con varias barras de alrededor de 18–27 millones de USD. Perder el nivel de 120.5–119.5 dirigiría la atención hacia 118.8–118.0 y, después, hacia 116.8–115.5.
📈 Por encima del mercado, la liquidez de liquidaciones de posiciones cortas se concentra entre 122.3 y 124.8. El grupo más fuerte se sitúa alrededor de 123.5–124.5, con varias barras cercanas a los 25–38 millones de USD, mientras que entre 122.3 y 123.0 también hay barras de alrededor de 25–35 millones de USD. Más arriba, entre 125.5 y 127.0, se mantienen otras capas de liquidez más pequeñas.
🧭 El panorama general favorece una caída, ya que la exposición a liquidaciones de posiciones largas por debajo es mayor. Perder el nivel de 120.5–119.5 aumentaría la probabilidad de un barrido hacia 118.8–118.0, seguido de 116.8–115.5. En cambio, superar 122.3–123.0 dejaría expuestos los niveles de 123.5–124.5 y, después, de 125.5–127.0.
#LiquidationMap
🔎 El mapa de liquidaciones de 7 días muestra aproximadamente entre 760 y 780 millones de USD en liquidaciones de posiciones largas por debajo del precio actual, frente a aproximadamente entre 540 y 560 millones de USD en liquidaciones de posiciones cortas por encima. Por lo tanto, la estructura de liquidez presenta una inclinación bajista bastante clara.
📉 Por debajo del mercado, la liquidez de liquidaciones de posiciones largas se concentra principalmente entre 115.3 y 116.8. El grupo más fuerte se sitúa alrededor de 115.8–116.6, con varias barras cercanas a los 25–49 millones de USD, mientras que entre 118.2 y 119.2 también hay otro grupo destacable, con varias barras de alrededor de 18–27 millones de USD. Perder el nivel de 120.5–119.5 dirigiría la atención hacia 118.8–118.0 y, después, hacia 116.8–115.5.
📈 Por encima del mercado, la liquidez de liquidaciones de posiciones cortas se concentra entre 122.3 y 124.8. El grupo más fuerte se sitúa alrededor de 123.5–124.5, con varias barras cercanas a los 25–38 millones de USD, mientras que entre 122.3 y 123.0 también hay barras de alrededor de 25–35 millones de USD. Más arriba, entre 125.5 y 127.0, se mantienen otras capas de liquidez más pequeñas.
🧭 El panorama general favorece una caída, ya que la exposición a liquidaciones de posiciones largas por debajo es mayor. Perder el nivel de 120.5–119.5 aumentaría la probabilidad de un barrido hacia 118.8–118.0, seguido de 116.8–115.5. En cambio, superar 122.3–123.0 dejaría expuestos los niveles de 123.5–124.5 y, después, de 125.5–127.0.
#LiquidationMap
41
·
--
Alcista
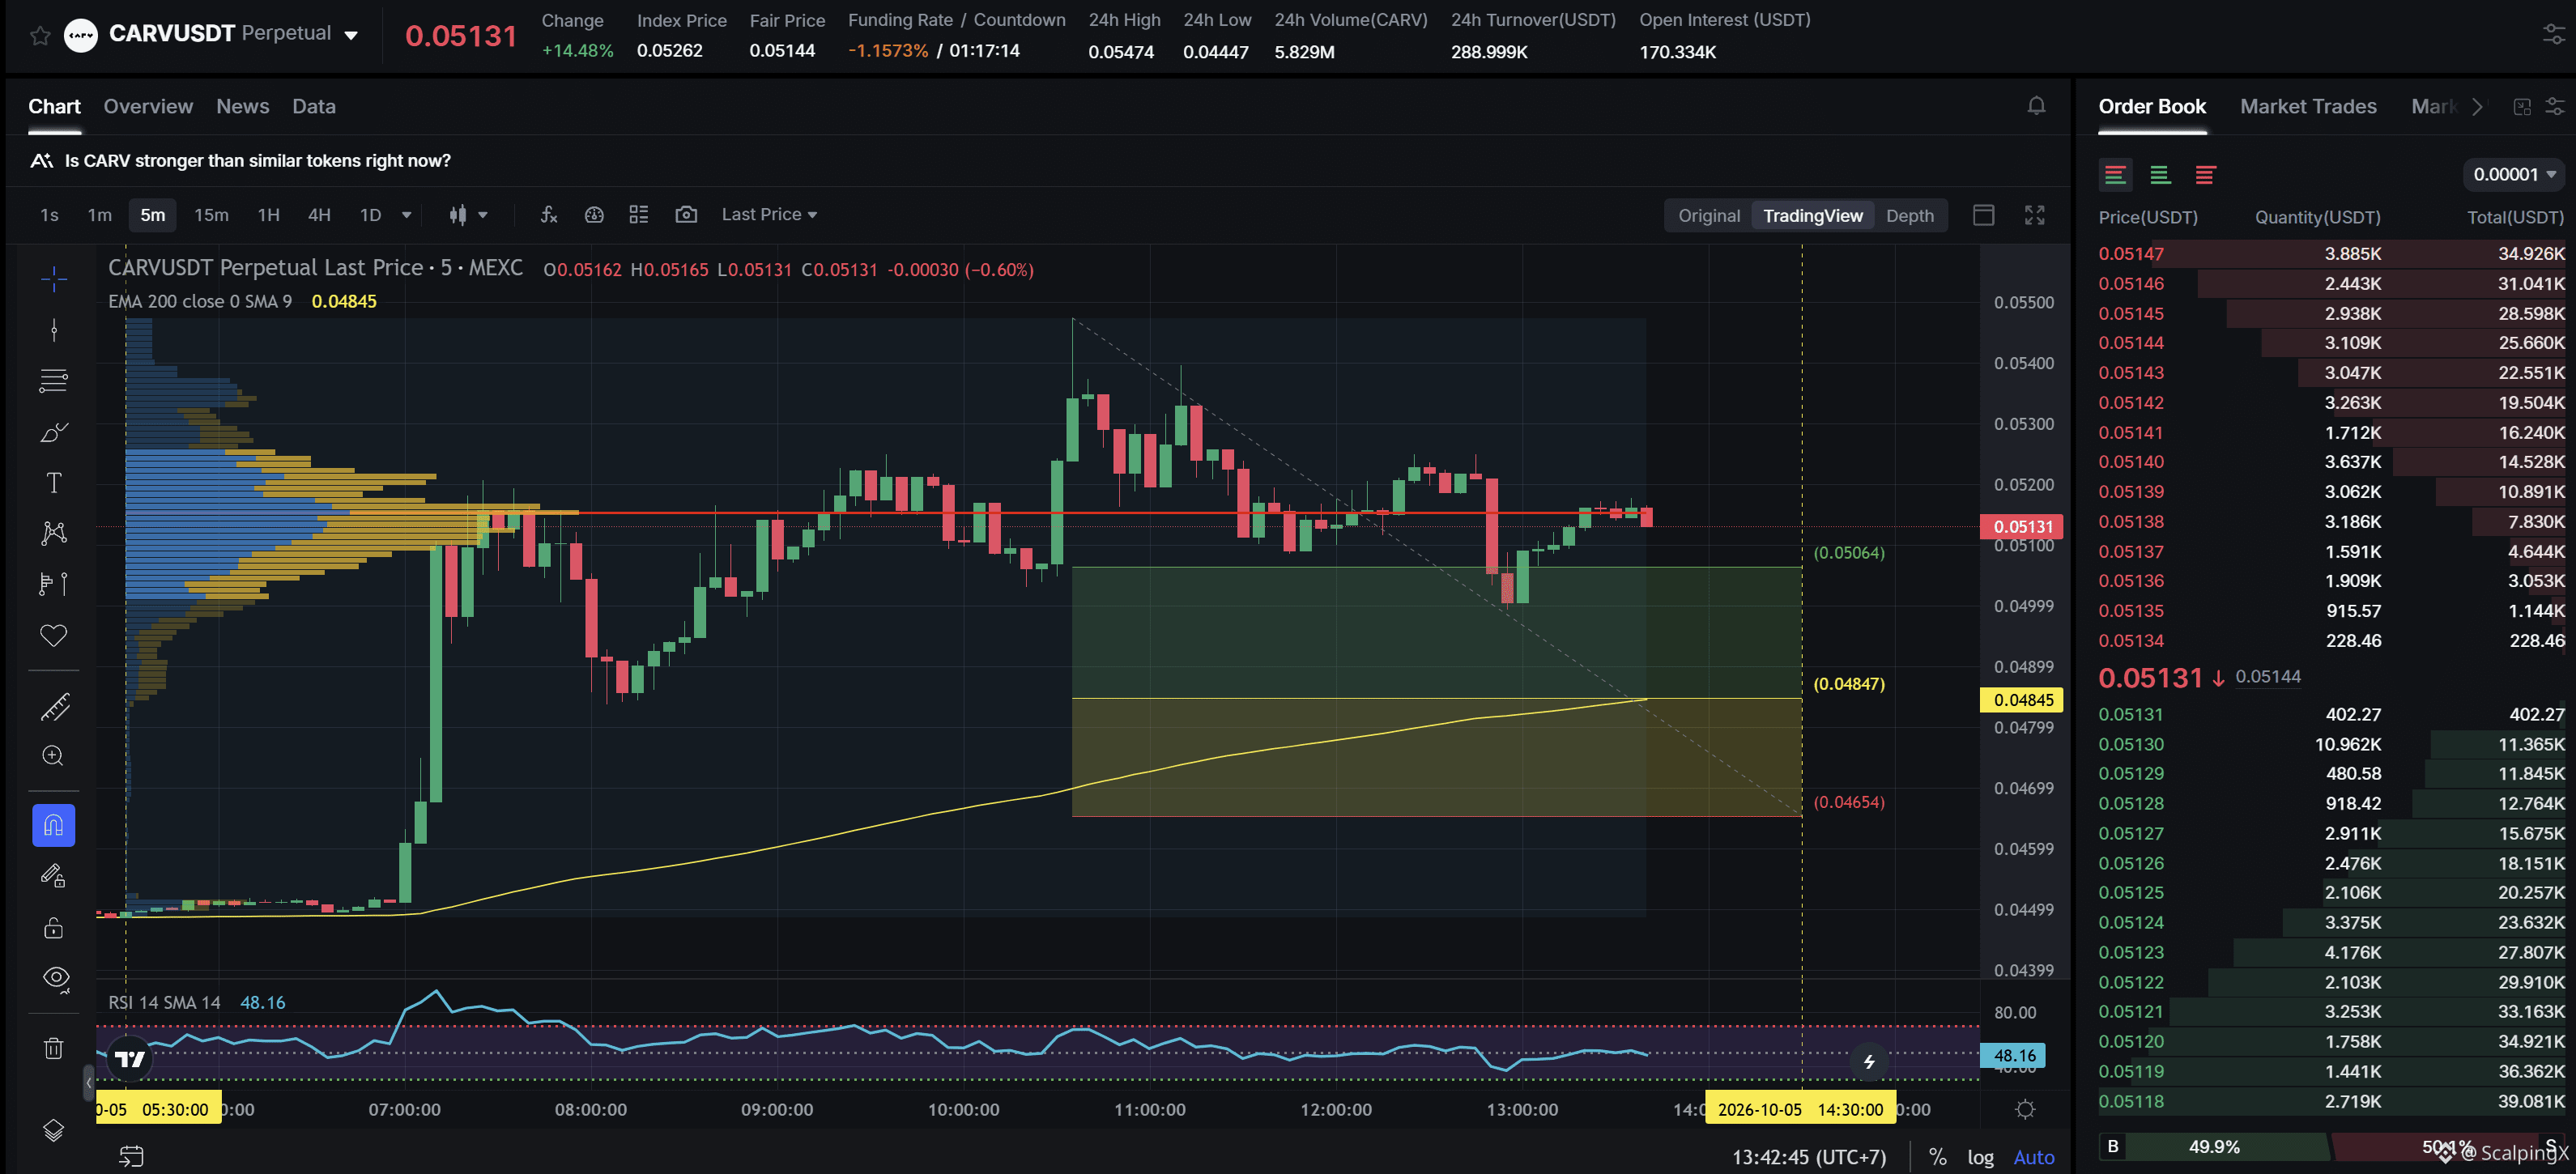
$CARV - Mcap 35M$ - Sentimiento de 24 h +2.00 Alcista
SC02 M5 - Orden larga pendiente. La entrada se encuentra dentro de una LVN y no está afectada por ninguna zona débil. La zona de soporte actual tiene una amplitud aproximada del 3.99%. La tendencia alcista ha durado 8 horas y 10 minutos, con un aumento máximo registrado del precio del 21.81%. Si el precio pierde esta zona de soporte, es muy probable que la tendencia se revierta a la baja.
$CARV - Mcap 35M$ - Sentimiento de 24 h +2.00 Alcista
SC02 M5 - Orden larga pendiente. La entrada se encuentra dentro de una LVN y no está afectada por ninguna zona débil. La zona de soporte actual tiene una amplitud aproximada del 3.99%. La tendencia alcista ha durado 8 horas y 10 minutos, con un aumento máximo registrado del precio del 21.81%. Si el precio pierde esta zona de soporte, es muy probable que la tendencia se revierta a la baja.
SC02 M5 - Orden larga pendiente. La entrada se encuentra dentro de una LVN y no está afectada por ninguna zona débil. La zona de soporte actual tiene una amplitud aproximada del 3.99%. La tendencia alcista ha durado 8 horas y 10 minutos, con un aumento máximo registrado del precio del 21.81%. Si el precio pierde esta zona de soporte, es muy probable que la tendencia se revierta a la baja.
21
·
--
Alcista
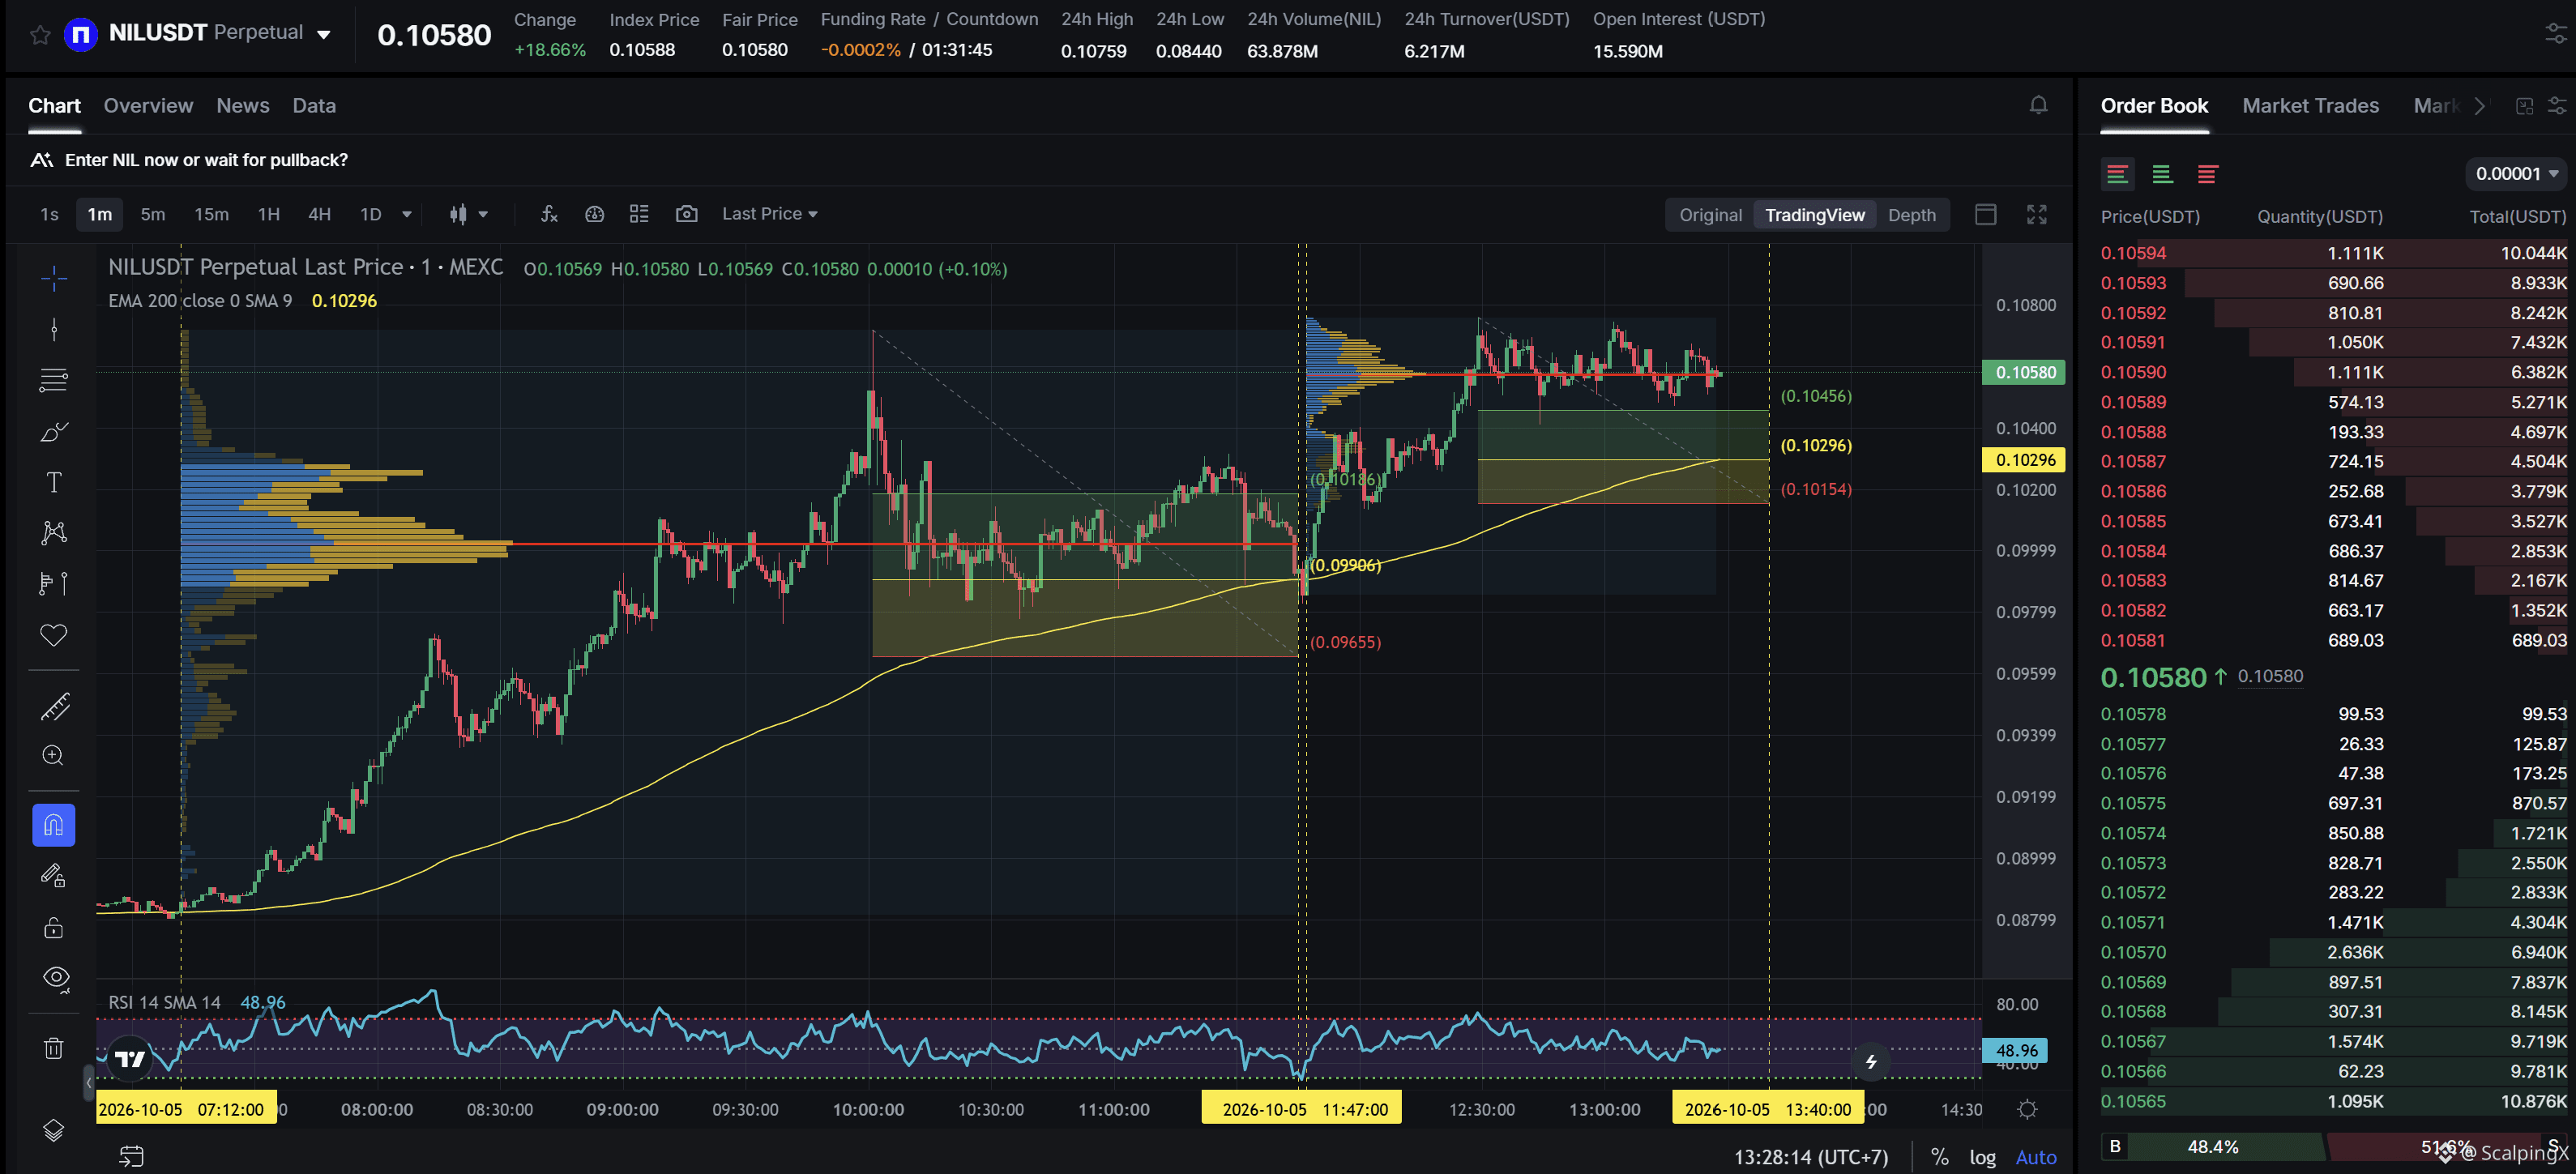
$NIL - Cap. de mercado 53.57M$ - Sentimiento de 24 h +5.05 Alcista
SC02 M1 - Orden larga pendiente. La entrada se encuentra dentro de un LVN y coincide con una simplificación positiva junto con una orden larga previamente rentable. La zona de soporte actual tiene aproximadamente un 1.37% de amplitud. La tendencia alcista ha durado 1 hora y 42 minutos, con un aumento máximo del precio registrado del 8.56%. Si el precio pierde esta zona de soporte, es muy probable que la tendencia se revierta a la baja.
$NIL - Cap. de mercado 53.57M$ - Sentimiento de 24 h +5.05 Alcista
SC02 M1 - Orden larga pendiente. La entrada se encuentra dentro de un LVN y coincide con una simplificación positiva junto con una orden larga previamente rentable. La zona de soporte actual tiene aproximadamente un 1.37% de amplitud. La tendencia alcista ha durado 1 hora y 42 minutos, con un aumento máximo del precio registrado del 8.56%. Si el precio pierde esta zona de soporte, es muy probable que la tendencia se revierta a la baja.
SC02 M1 - Orden larga pendiente. La entrada se encuentra dentro de un LVN y coincide con una simplificación positiva junto con una orden larga previamente rentable. La zona de soporte actual tiene aproximadamente un 1.37% de amplitud. La tendencia alcista ha durado 1 hora y 42 minutos, con un aumento máximo del precio registrado del 8.56%. Si el precio pierde esta zona de soporte, es muy probable que la tendencia se revierta a la baja.
46
·
--
Alcista
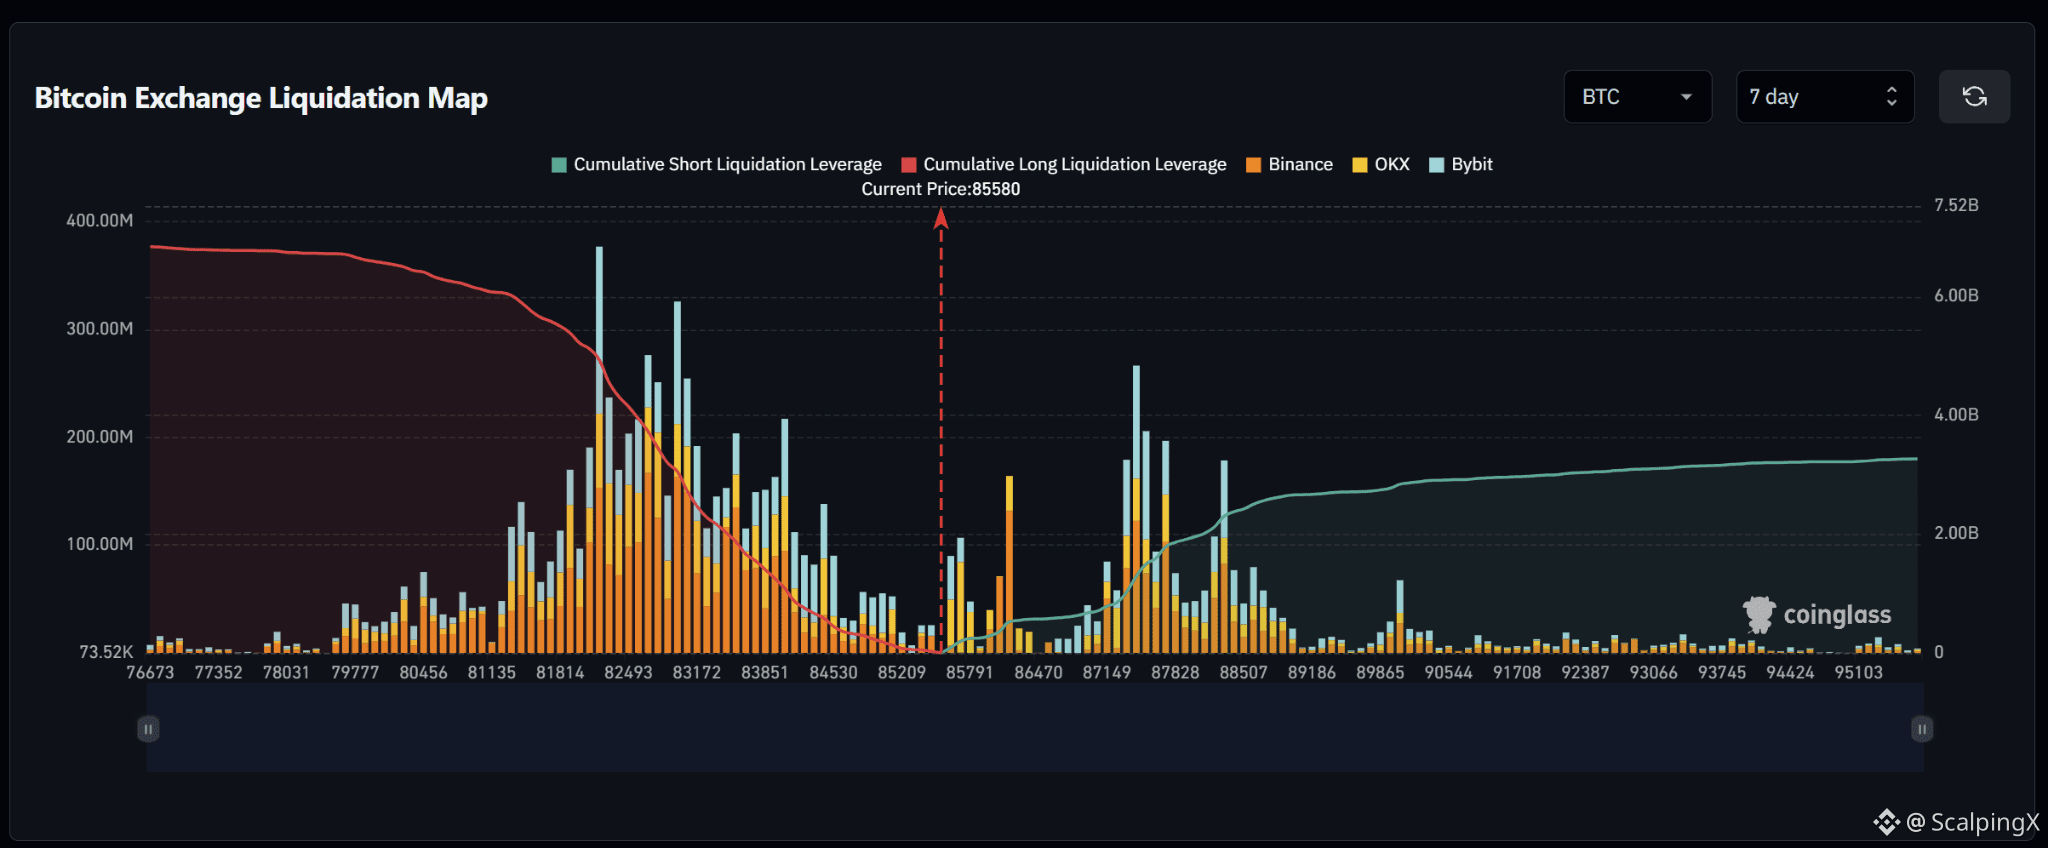
Bitcoin se acerca a la zona de liquidación corta de $87.000, pero el riesgo a la baja sigue siendo mayor
📊 El mapa de liquidaciones de 7 días muestra a BTC moviéndose hacia el clúster corto más cercano alrededor de $86.400–$87.800. En las últimas 24 horas, se liquidaron aproximadamente $71,6 millones en shorts de BTC frente a solo $5,9 millones en largos, confirmando que la presión bajista ya se está eliminando.
⚡ La financiación se mantiene relativamente moderada, en torno a +0,0067% cada 8 horas, lo que sugiere que aún no hay una acumulación excesiva de posiciones largas. Sin embargo, las entradas de ETF se han desacelerado con fuerza en comparación con la semana anterior, lo que significa que para un movimiento por encima de $87.800 aún haría falta una demanda spot más fuerte para sostenerlo.
📉 La principal asimetría se mantiene a continuación. El clúster más grande de liquidación de largos está alrededor de $81.800–$83.200 y es significativamente más grueso que la liquidez por encima. Si BTC es rechazado cerca de $87k y pierde la zona de $84.500–$85.000, aumentaría el riesgo de un movimiento hacia el pool de liquidación de $82k–$83k.
🔎 Esto convierte a $87.800 en el nivel clave de confirmación. Mantenerse por encima de ese punto podría abrir el camino hacia $88.500–$89.200, mientras que otro rechazo mantendría intacto el riesgo de un retroceso más profundo.
#Bitcoin $BTC
Bitcoin se acerca a la zona de liquidación corta de $87.000, pero el riesgo a la baja sigue siendo mayor
📊 El mapa de liquidaciones de 7 días muestra a BTC moviéndose hacia el clúster corto más cercano alrededor de $86.400–$87.800. En las últimas 24 horas, se liquidaron aproximadamente $71,6 millones en shorts de BTC frente a solo $5,9 millones en largos, confirmando que la presión bajista ya se está eliminando.
⚡ La financiación se mantiene relativamente moderada, en torno a +0,0067% cada 8 horas, lo que sugiere que aún no hay una acumulación excesiva de posiciones largas. Sin embargo, las entradas de ETF se han desacelerado con fuerza en comparación con la semana anterior, lo que significa que para un movimiento por encima de $87.800 aún haría falta una demanda spot más fuerte para sostenerlo.
📉 La principal asimetría se mantiene a continuación. El clúster más grande de liquidación de largos está alrededor de $81.800–$83.200 y es significativamente más grueso que la liquidez por encima. Si BTC es rechazado cerca de $87k y pierde la zona de $84.500–$85.000, aumentaría el riesgo de un movimiento hacia el pool de liquidación de $82k–$83k.
🔎 Esto convierte a $87.800 en el nivel clave de confirmación. Mantenerse por encima de ese punto podría abrir el camino hacia $88.500–$89.200, mientras que otro rechazo mantendría intacto el riesgo de un retroceso más profundo.
#Bitcoin $BTC
📊 El mapa de liquidaciones de 7 días muestra a BTC moviéndose hacia el clúster corto más cercano alrededor de $86.400–$87.800. En las últimas 24 horas, se liquidaron aproximadamente $71,6 millones en shorts de BTC frente a solo $5,9 millones en largos, confirmando que la presión bajista ya se está eliminando.
⚡ La financiación se mantiene relativamente moderada, en torno a +0,0067% cada 8 horas, lo que sugiere que aún no hay una acumulación excesiva de posiciones largas. Sin embargo, las entradas de ETF se han desacelerado con fuerza en comparación con la semana anterior, lo que significa que para un movimiento por encima de $87.800 aún haría falta una demanda spot más fuerte para sostenerlo.
📉 La principal asimetría se mantiene a continuación. El clúster más grande de liquidación de largos está alrededor de $81.800–$83.200 y es significativamente más grueso que la liquidez por encima. Si BTC es rechazado cerca de $87k y pierde la zona de $84.500–$85.000, aumentaría el riesgo de un movimiento hacia el pool de liquidación de $82k–$83k.
🔎 Esto convierte a $87.800 en el nivel clave de confirmación. Mantenerse por encima de ese punto podría abrir el camino hacia $88.500–$89.200, mientras que otro rechazo mantendría intacto el riesgo de un retroceso más profundo.
#Bitcoin $BTC
75
·
--
Alcista
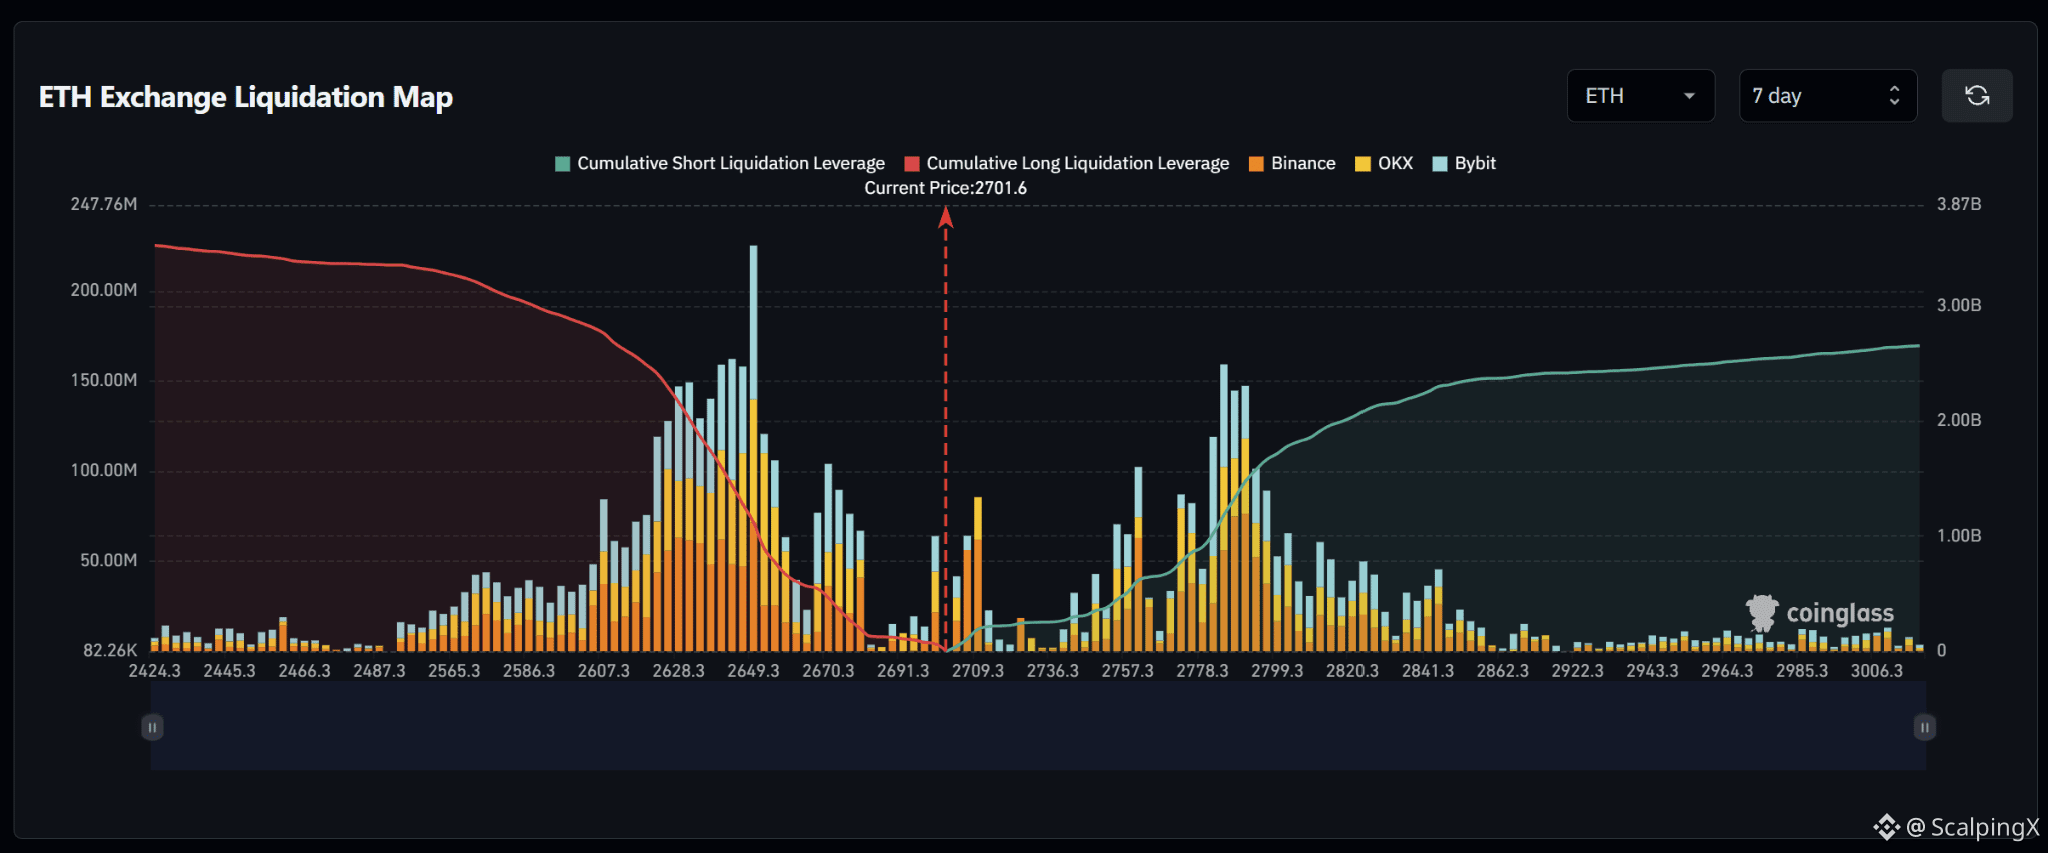
$ETH – Mapa de Liquidación (7 Días) – Precio Actual 2,701.6
🔎 El mapa de liquidaciones de 7 días muestra aproximadamente 3.4–3.5 mil millones de USD en liquidaciones largas por debajo del precio actual, superando aproximadamente 2.6–2.7 mil millones de USD en liquidaciones cortas por encima. Por lo tanto, la estructura de liquidez tiene una inclinación claramente bajista.
📉 Debajo del mercado, la liquidez de liquidación larga se concentra fuertemente en 2,610–2,675. El clúster más fuerte se sitúa alrededor de 2,635–2,655 con varias barras cerca de 140–225 millones de USD, y la concentración más densa alrededor de 2,649. La zona 2,660–2,675 también contiene varias barras alrededor de 70–105 millones de USD. Perder 2,690–2,680 desviaría la atención hacia 2,670–2,645 y luego 2,630–2,610.
📈 Por encima del mercado, la liquidez de liquidación corta se concentra en 2,750–2,805. El clúster más fuerte está alrededor de 2,780–2,795 con varias barras cerca de 120–160 millones de USD, mientras que 2,755–2,770 también contiene bolsas de alrededor de 70–100 millones de USD. Más lejos, 2,810–2,850 continúa manteniendo otra franja notable de liquidez.
🧭 La configuración general favorece la baja porque la exposición por liquidaciones largas debajo es mayor. Perder 2,690–2,680 aumentaría la probabilidad de un barrido hacia 2,670–2,645, seguido de 2,630–2,610. Romper por encima de 2,735–2,755 expondría en cambio 2,780–2,795 y luego 2,810–2,850.
#LiquidationMap
$ETH – Mapa de Liquidación (7 Días) – Precio Actual 2,701.6
🔎 El mapa de liquidaciones de 7 días muestra aproximadamente 3.4–3.5 mil millones de USD en liquidaciones largas por debajo del precio actual, superando aproximadamente 2.6–2.7 mil millones de USD en liquidaciones cortas por encima. Por lo tanto, la estructura de liquidez tiene una inclinación claramente bajista.
📉 Debajo del mercado, la liquidez de liquidación larga se concentra fuertemente en 2,610–2,675. El clúster más fuerte se sitúa alrededor de 2,635–2,655 con varias barras cerca de 140–225 millones de USD, y la concentración más densa alrededor de 2,649. La zona 2,660–2,675 también contiene varias barras alrededor de 70–105 millones de USD. Perder 2,690–2,680 desviaría la atención hacia 2,670–2,645 y luego 2,630–2,610.
📈 Por encima del mercado, la liquidez de liquidación corta se concentra en 2,750–2,805. El clúster más fuerte está alrededor de 2,780–2,795 con varias barras cerca de 120–160 millones de USD, mientras que 2,755–2,770 también contiene bolsas de alrededor de 70–100 millones de USD. Más lejos, 2,810–2,850 continúa manteniendo otra franja notable de liquidez.
🧭 La configuración general favorece la baja porque la exposición por liquidaciones largas debajo es mayor. Perder 2,690–2,680 aumentaría la probabilidad de un barrido hacia 2,670–2,645, seguido de 2,630–2,610. Romper por encima de 2,735–2,755 expondría en cambio 2,780–2,795 y luego 2,810–2,850.
#LiquidationMap
🔎 El mapa de liquidaciones de 7 días muestra aproximadamente 3.4–3.5 mil millones de USD en liquidaciones largas por debajo del precio actual, superando aproximadamente 2.6–2.7 mil millones de USD en liquidaciones cortas por encima. Por lo tanto, la estructura de liquidez tiene una inclinación claramente bajista.
📉 Debajo del mercado, la liquidez de liquidación larga se concentra fuertemente en 2,610–2,675. El clúster más fuerte se sitúa alrededor de 2,635–2,655 con varias barras cerca de 140–225 millones de USD, y la concentración más densa alrededor de 2,649. La zona 2,660–2,675 también contiene varias barras alrededor de 70–105 millones de USD. Perder 2,690–2,680 desviaría la atención hacia 2,670–2,645 y luego 2,630–2,610.
📈 Por encima del mercado, la liquidez de liquidación corta se concentra en 2,750–2,805. El clúster más fuerte está alrededor de 2,780–2,795 con varias barras cerca de 120–160 millones de USD, mientras que 2,755–2,770 también contiene bolsas de alrededor de 70–100 millones de USD. Más lejos, 2,810–2,850 continúa manteniendo otra franja notable de liquidez.
🧭 La configuración general favorece la baja porque la exposición por liquidaciones largas debajo es mayor. Perder 2,690–2,680 aumentaría la probabilidad de un barrido hacia 2,670–2,645, seguido de 2,630–2,610. Romper por encima de 2,735–2,755 expondría en cambio 2,780–2,795 y luego 2,810–2,850.
#LiquidationMap
100
·
--
Alcista
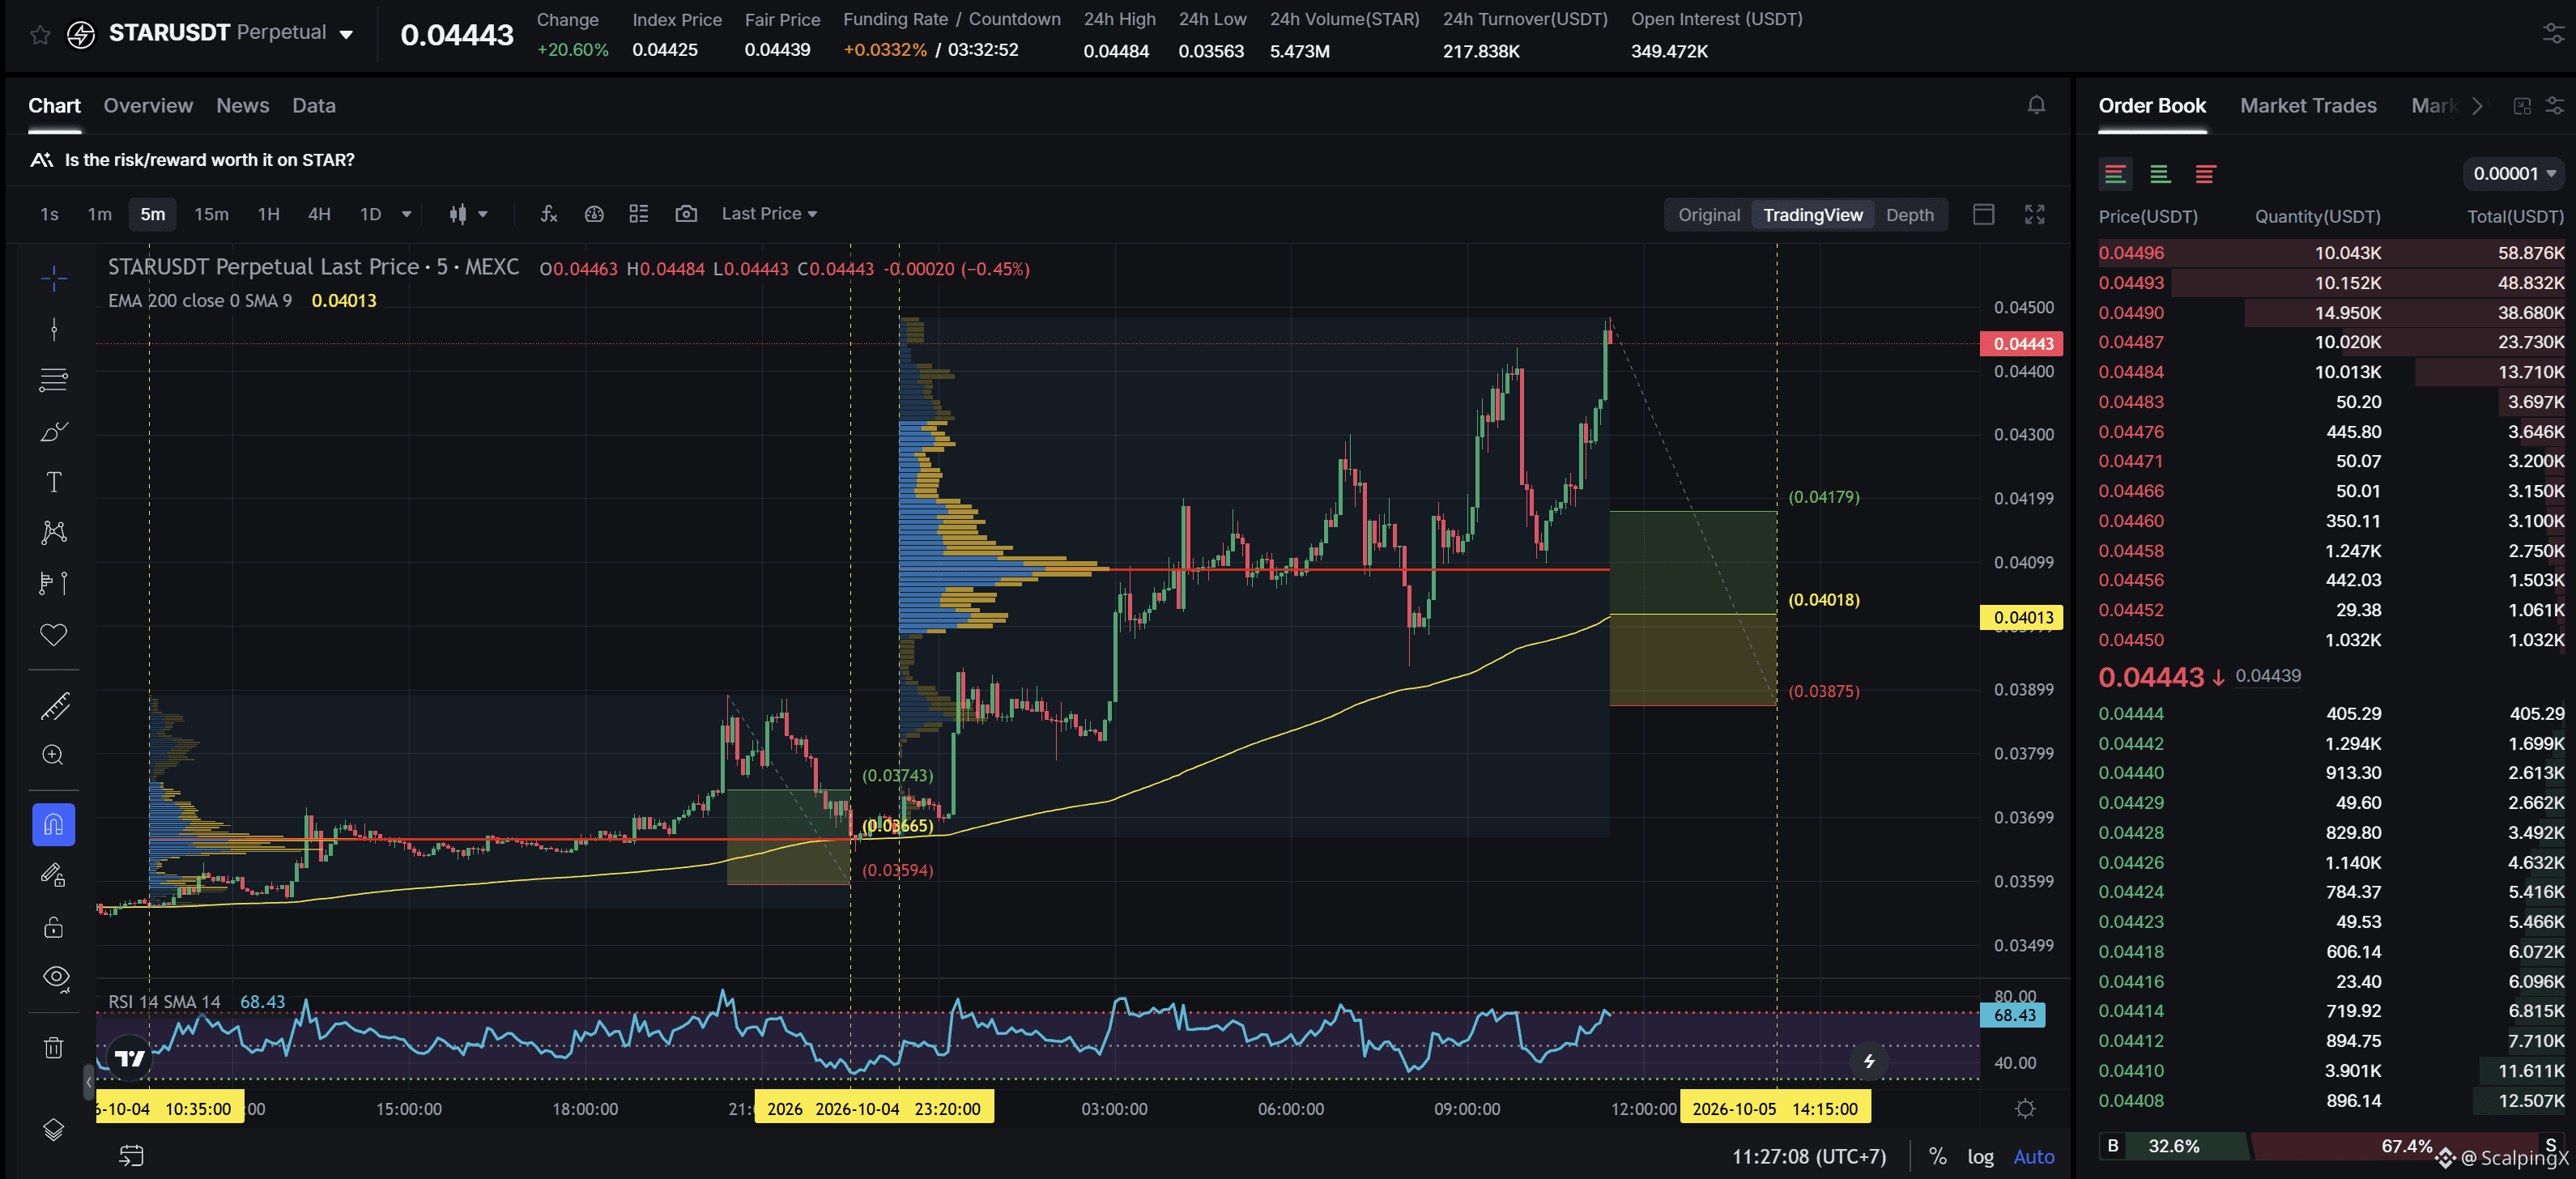
$STAR - Mcap 7.99M$ - Sentimiento 24h +3.73 Alcista
SC02 M5 - orden Long pendiente. La entrada se encuentra dentro de la LVN y cumple con una simplificación positiva junto con una orden Long previamente muy rentable; la zona de soporte actual tiene aproximadamente un 3.60% de amplitud. La tendencia alcista ha durado 12 horas y 5 minutos, con un aumento máximo de precio registrado del 23.43%. Si el precio pierde esta zona de soporte, es muy probable que la tendencia se revierta hacia abajo.
$STAR - Mcap 7.99M$ - Sentimiento 24h +3.73 Alcista
SC02 M5 - orden Long pendiente. La entrada se encuentra dentro de la LVN y cumple con una simplificación positiva junto con una orden Long previamente muy rentable; la zona de soporte actual tiene aproximadamente un 3.60% de amplitud. La tendencia alcista ha durado 12 horas y 5 minutos, con un aumento máximo de precio registrado del 23.43%. Si el precio pierde esta zona de soporte, es muy probable que la tendencia se revierta hacia abajo.
SC02 M5 - orden Long pendiente. La entrada se encuentra dentro de la LVN y cumple con una simplificación positiva junto con una orden Long previamente muy rentable; la zona de soporte actual tiene aproximadamente un 3.60% de amplitud. La tendencia alcista ha durado 12 horas y 5 minutos, con un aumento máximo de precio registrado del 23.43%. Si el precio pierde esta zona de soporte, es muy probable que la tendencia se revierta hacia abajo.
94
·
--
Alcista
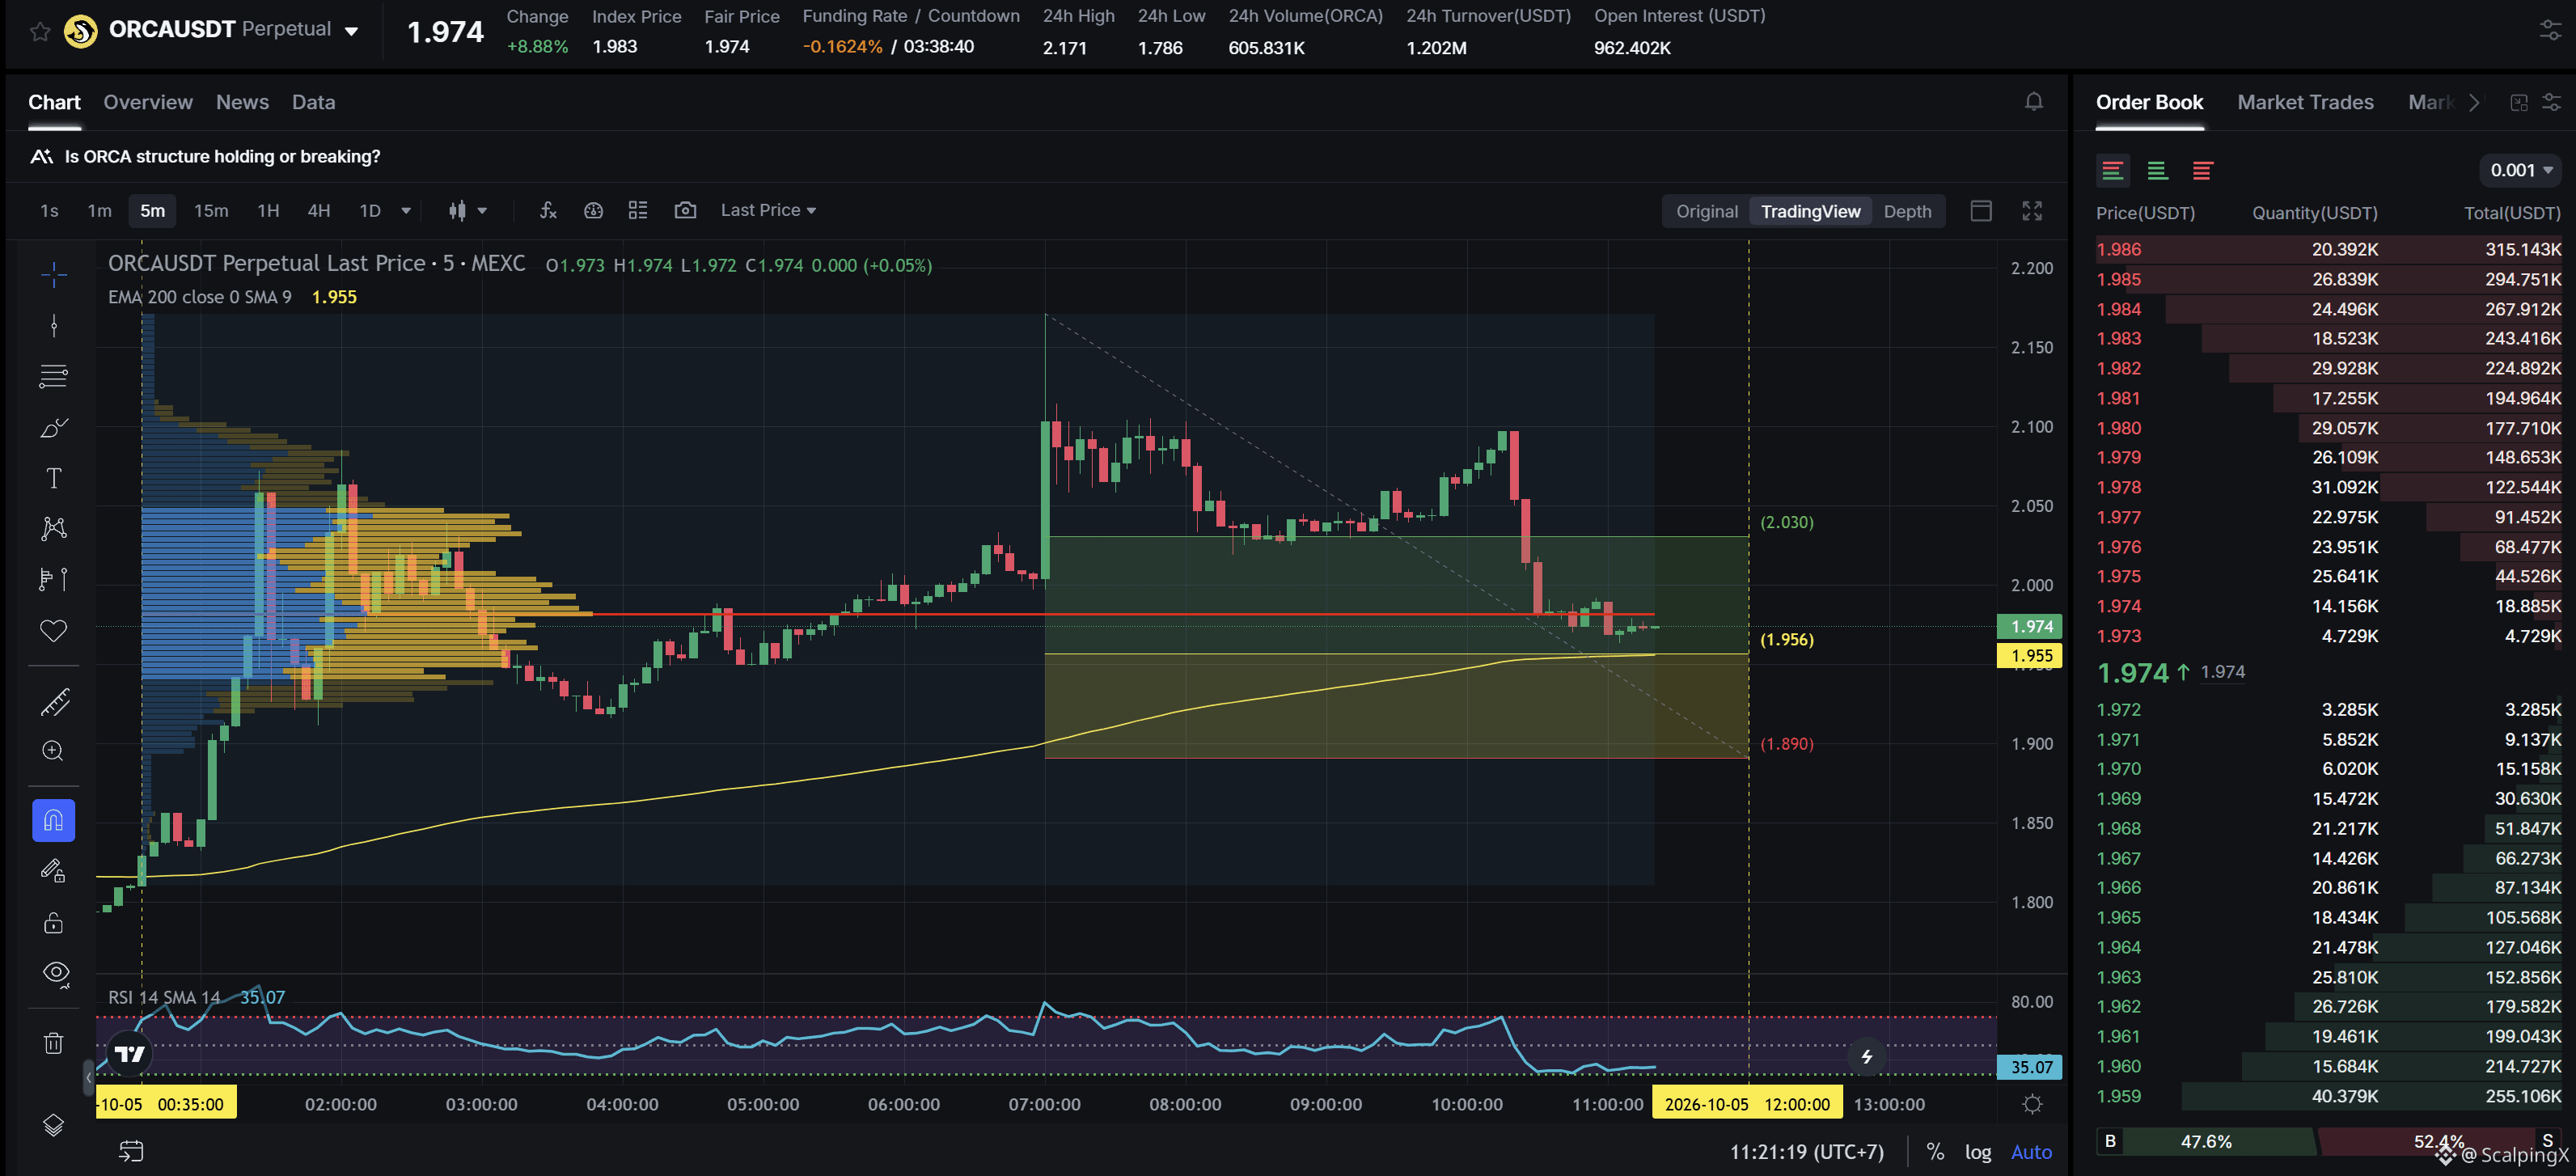
$ORCA - Mcap 120.5M$ - 24h Sentimiento +5.12 Alcista
SC02 M5 - orden Long pendiente. La entrada se encuentra dentro de la LVN + no se ve afectada por ninguna zona débil; la zona de soporte actual tiene aproximadamente un 3.37% de ancho. La tendencia alcista ha durado 10 horas 45 minutos, con un aumento máximo registrado del precio de 19.56%. Si el precio pierde esta zona de soporte, es muy probable que la tendencia se revierta hacia abajo.
$ORCA - Mcap 120.5M$ - 24h Sentimiento +5.12 Alcista
SC02 M5 - orden Long pendiente. La entrada se encuentra dentro de la LVN + no se ve afectada por ninguna zona débil; la zona de soporte actual tiene aproximadamente un 3.37% de ancho. La tendencia alcista ha durado 10 horas 45 minutos, con un aumento máximo registrado del precio de 19.56%. Si el precio pierde esta zona de soporte, es muy probable que la tendencia se revierta hacia abajo.
SC02 M5 - orden Long pendiente. La entrada se encuentra dentro de la LVN + no se ve afectada por ninguna zona débil; la zona de soporte actual tiene aproximadamente un 3.37% de ancho. La tendencia alcista ha durado 10 horas 45 minutos, con un aumento máximo registrado del precio de 19.56%. Si el precio pierde esta zona de soporte, es muy probable que la tendencia se revierta hacia abajo.
139
·
--
Alcista
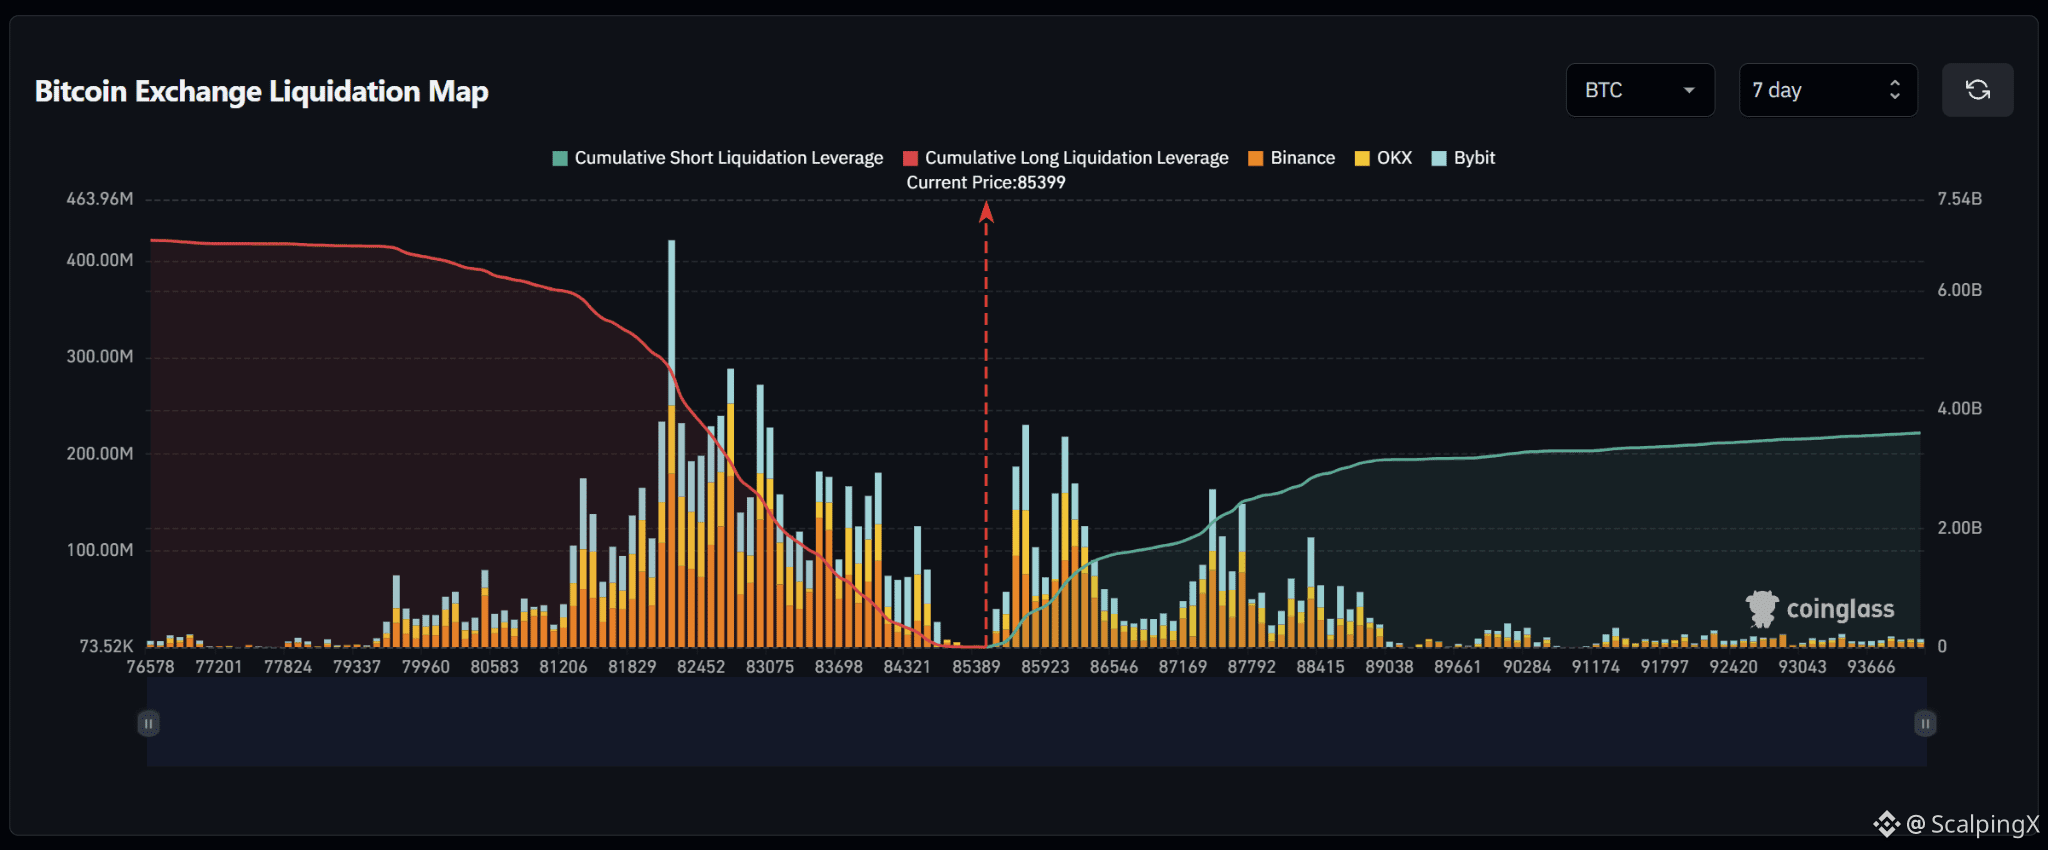
$BTC – Mapa de Liquidaciones (7 días) – Precio Actual 85,389
🔎 El mapa de liquidaciones a 7 días muestra aproximadamente 6.7–6.8 mil millones de USD en liquidaciones largas por debajo del precio actual, casi el doble de los aproximadamente 3.4–3.5 mil millones de USD en liquidaciones cortas por encima. La estructura de liquidez, por lo tanto, favorece claramente la caída.
📉 Por debajo del mercado, la liquidez de liquidaciones largas se concentra fuertemente entre 81,200–84,300. El clúster más fuerte se sitúa alrededor de 82,200–82,600 con la barra más grande por encima de 400 millones USD, mientras que 82,700–83,200 también contiene varias barras alrededor de 200–290 millones USD. Más lejos, 83,500–84,300 continúa manteniendo otra banda significativa de liquidez.
📈 Por encima del mercado, la liquidez de liquidaciones cortas se concentra más cerca en 85,700–86,500. Las barras más grandes alrededor de 85,800–86,300 alcanzan aproximadamente 180–230 millones USD. Se forma otro clúster alrededor de 87,100–87,800 con barras cercanas a 100–160 millones USD, mientras que 88,000–89,000 continúa manteniendo capas de liquidez más pequeñas.
🧭 La configuración más amplia favorece la caída porque la exposición a liquidaciones largas por debajo domina con claridad. Perder 84,300–83,700 aumentaría la probabilidad de un barrido hacia 83,100–82,400, seguido de 81,800–81,200. Romper por encima de 85,700–86,500, en cambio, expondría 87,100–87,800 y luego 88,400–89,000.
#LiquidationMap
$BTC – Mapa de Liquidaciones (7 días) – Precio Actual 85,389
🔎 El mapa de liquidaciones a 7 días muestra aproximadamente 6.7–6.8 mil millones de USD en liquidaciones largas por debajo del precio actual, casi el doble de los aproximadamente 3.4–3.5 mil millones de USD en liquidaciones cortas por encima. La estructura de liquidez, por lo tanto, favorece claramente la caída.
📉 Por debajo del mercado, la liquidez de liquidaciones largas se concentra fuertemente entre 81,200–84,300. El clúster más fuerte se sitúa alrededor de 82,200–82,600 con la barra más grande por encima de 400 millones USD, mientras que 82,700–83,200 también contiene varias barras alrededor de 200–290 millones USD. Más lejos, 83,500–84,300 continúa manteniendo otra banda significativa de liquidez.
📈 Por encima del mercado, la liquidez de liquidaciones cortas se concentra más cerca en 85,700–86,500. Las barras más grandes alrededor de 85,800–86,300 alcanzan aproximadamente 180–230 millones USD. Se forma otro clúster alrededor de 87,100–87,800 con barras cercanas a 100–160 millones USD, mientras que 88,000–89,000 continúa manteniendo capas de liquidez más pequeñas.
🧭 La configuración más amplia favorece la caída porque la exposición a liquidaciones largas por debajo domina con claridad. Perder 84,300–83,700 aumentaría la probabilidad de un barrido hacia 83,100–82,400, seguido de 81,800–81,200. Romper por encima de 85,700–86,500, en cambio, expondría 87,100–87,800 y luego 88,400–89,000.
#LiquidationMap
🔎 El mapa de liquidaciones a 7 días muestra aproximadamente 6.7–6.8 mil millones de USD en liquidaciones largas por debajo del precio actual, casi el doble de los aproximadamente 3.4–3.5 mil millones de USD en liquidaciones cortas por encima. La estructura de liquidez, por lo tanto, favorece claramente la caída.
📉 Por debajo del mercado, la liquidez de liquidaciones largas se concentra fuertemente entre 81,200–84,300. El clúster más fuerte se sitúa alrededor de 82,200–82,600 con la barra más grande por encima de 400 millones USD, mientras que 82,700–83,200 también contiene varias barras alrededor de 200–290 millones USD. Más lejos, 83,500–84,300 continúa manteniendo otra banda significativa de liquidez.
📈 Por encima del mercado, la liquidez de liquidaciones cortas se concentra más cerca en 85,700–86,500. Las barras más grandes alrededor de 85,800–86,300 alcanzan aproximadamente 180–230 millones USD. Se forma otro clúster alrededor de 87,100–87,800 con barras cercanas a 100–160 millones USD, mientras que 88,000–89,000 continúa manteniendo capas de liquidez más pequeñas.
🧭 La configuración más amplia favorece la caída porque la exposición a liquidaciones largas por debajo domina con claridad. Perder 84,300–83,700 aumentaría la probabilidad de un barrido hacia 83,100–82,400, seguido de 81,800–81,200. Romper por encima de 85,700–86,500, en cambio, expondría 87,100–87,800 y luego 88,400–89,000.
#LiquidationMap
67
Inicia sesión para explorar más contenidos
Únete a usuarios globales de criptomonedas en Binance Square
⚡️ Obtén información útil y actualizada sobre criptos.
💬 Avalado por el mayor exchange de criptomonedas en el mundo.
👍 Descubre perspectivas reales de creadores verificados.
Email/número de teléfono
Temas populares
ADAGains10%Above$0.27
7,413 vistas
139 están debatiendo
#ADAGains10%Above$0.27
El precio de Cardano (ADA) registró un explosivo rally del 11% en las últimas 24 horas, superando con fuerza la barrera psicológica de los 0,27 dólares y posicionándose como el activo de mayor rendimiento entre las principales criptomonedas del mercado. Este repentino despertar alcista, que llevó al token a registrar su nivel más alto desde el pasado mes de julio, estuvo acompañado por un impresionante volumen de transacciones de 1.160 millones de dólares, cifra que duplica holgadamente su promedio mensual. Analistas de la industria asocian este fuerte impulso con el creciente optimismo minorista en torno al desarrollo de su ecosistema de finanzas del mundo real (RealFi) y las expectativas técnicas por la futura actualización de escalabilidad conocida como Dijkstra, logrando que la zona entre los $0,258 y $0,260 se consolide como el nuevo soporte clave a defender para mantener intacto el camino hacia el objetivo de los $0,30.#writetoearn #Write2Earn $ADA $USDC
WorldWideWeb The World ARPANET Archie EFF
·1 me gusta
·1.1k vistas
ETHUp70%InQ3ButLiquidityFalls
87,202 vistas
835 están debatiendo
EthStakingExitQueueHits2026High
33,703 vistas
630 están debatiendo