
TheCryptoOnur
3k Publicaciones

TheCryptoOnur
Denunciar
Bloquear usuario
Social Media Content Creator / Full Stack Developer www.cryptoonur.xyz
57 Siguiendo
3.4K+ Seguidores
1.1K+ Me gusta
Publicaciones
Todo
Citas
Videos
Ver traducción
🔴 $WLD · 1H
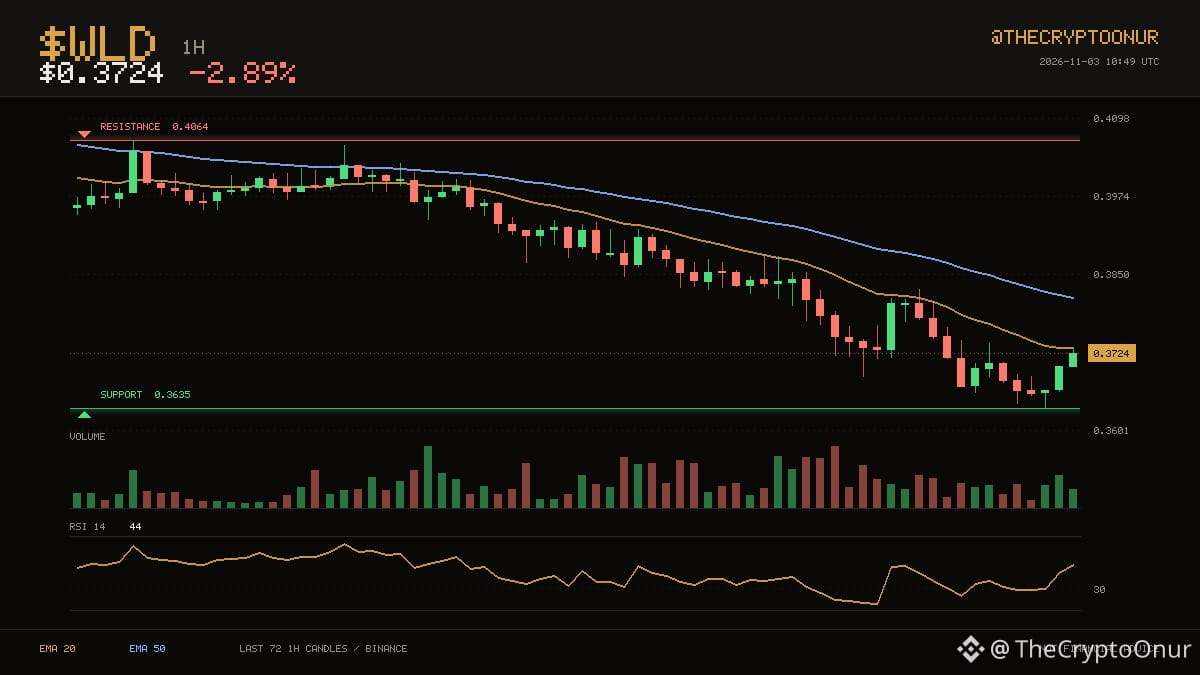
Price is $0.3724 and $WLD remains below the averages that capped it earlier. $0.3635 on the low side and $0.4064 on the high side have contained the last three days. It is sitting in the bottom third of the range. Resistance sits 9.1% above and support 2.4% below. Averages have been ordered the same way for a long stretch now, with the 20 below the 50. Momentum is mid range with RSI at 44. The 24 hour range runs $0.3635 to $0.3882, and price is around the middle of it. Volume is thin, around 0.5x the recent average, so moves here are easier to fade. Down 2.9% over 24 hours.
DYOR
$WLD #Crypto
🔴 $WLD · 1H
Price is $0.3724 and $WLD remains below the averages that capped it earlier. $0.3635 on the low side and $0.4064 on the high side have contained the last three days. It is sitting in the bottom third of the range. Resistance sits 9.1% above and support 2.4% below. Averages have been ordered the same way for a long stretch now, with the 20 below the 50. Momentum is mid range with RSI at 44. The 24 hour range runs $0.3635 to $0.3882, and price is around the middle of it. Volume is thin, around 0.5x the recent average, so moves here are easier to fade. Down 2.9% over 24 hours.
DYOR
$WLD #Crypto
Price is $0.3724 and $WLD remains below the averages that capped it earlier. $0.3635 on the low side and $0.4064 on the high side have contained the last three days. It is sitting in the bottom third of the range. Resistance sits 9.1% above and support 2.4% below. Averages have been ordered the same way for a long stretch now, with the 20 below the 50. Momentum is mid range with RSI at 44. The 24 hour range runs $0.3635 to $0.3882, and price is around the middle of it. Volume is thin, around 0.5x the recent average, so moves here are easier to fade. Down 2.9% over 24 hours.
DYOR
$WLD #Crypto
7
Ver traducción
📉 $AAVE · 1H
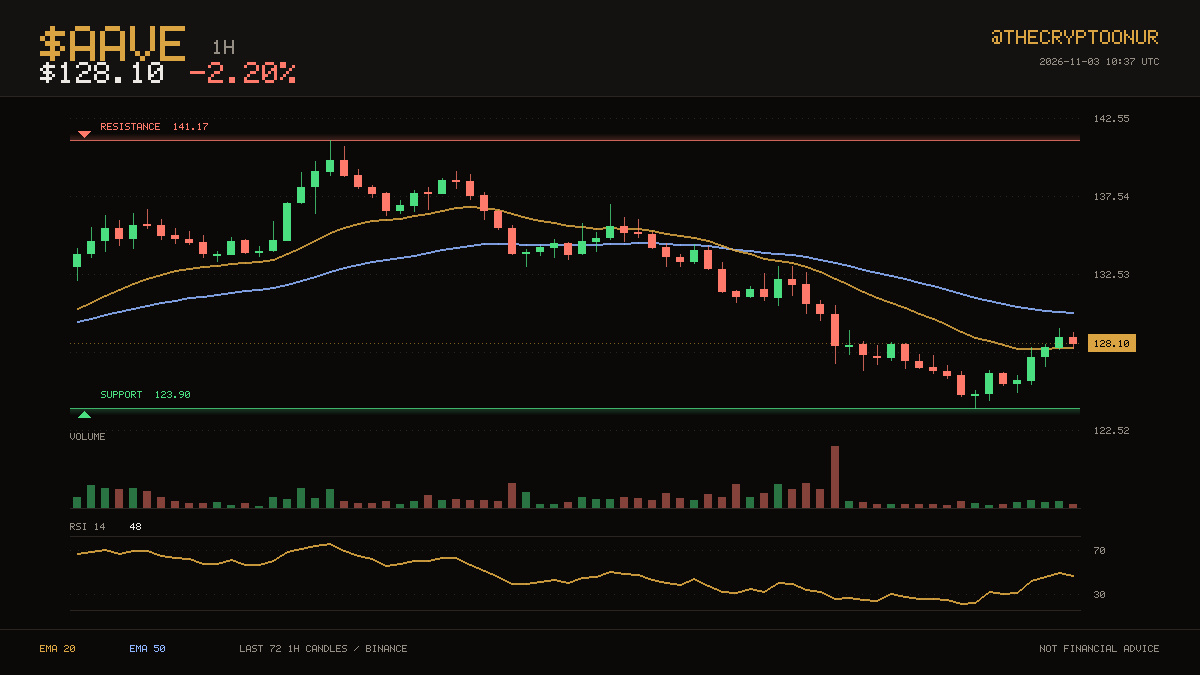
$AAVE is at $128.10, with one average above price and one below. The three day range runs from $123.90 up to $141.17. It is sitting in the bottom third of the range. Resistance sits 10.2% above and support 3.3% below. Averages have been ordered the same way for 25 candles, with the 20 below the 50. Momentum is mid range with RSI at 48. The 24 hour range runs $123.90 to $133.07, and price is around the middle of it. Volume is close to normal at 0.8x the recent average. Those averages sit at $127.86 and $130.09 respectively. Down 2.2% over 24 hours.
DYOR
$AAVE #Crypto
📉 $AAVE · 1H
$AAVE is at $128.10, with one average above price and one below. The three day range runs from $123.90 up to $141.17. It is sitting in the bottom third of the range. Resistance sits 10.2% above and support 3.3% below. Averages have been ordered the same way for 25 candles, with the 20 below the 50. Momentum is mid range with RSI at 48. The 24 hour range runs $123.90 to $133.07, and price is around the middle of it. Volume is close to normal at 0.8x the recent average. Those averages sit at $127.86 and $130.09 respectively. Down 2.2% over 24 hours.
DYOR
$AAVE #Crypto
$AAVE is at $128.10, with one average above price and one below. The three day range runs from $123.90 up to $141.17. It is sitting in the bottom third of the range. Resistance sits 10.2% above and support 3.3% below. Averages have been ordered the same way for 25 candles, with the 20 below the 50. Momentum is mid range with RSI at 48. The 24 hour range runs $123.90 to $133.07, and price is around the middle of it. Volume is close to normal at 0.8x the recent average. Those averages sit at $127.86 and $130.09 respectively. Down 2.2% over 24 hours.
DYOR
$AAVE #Crypto
6
Ver traducción
🔴 $NVDAB · 1D
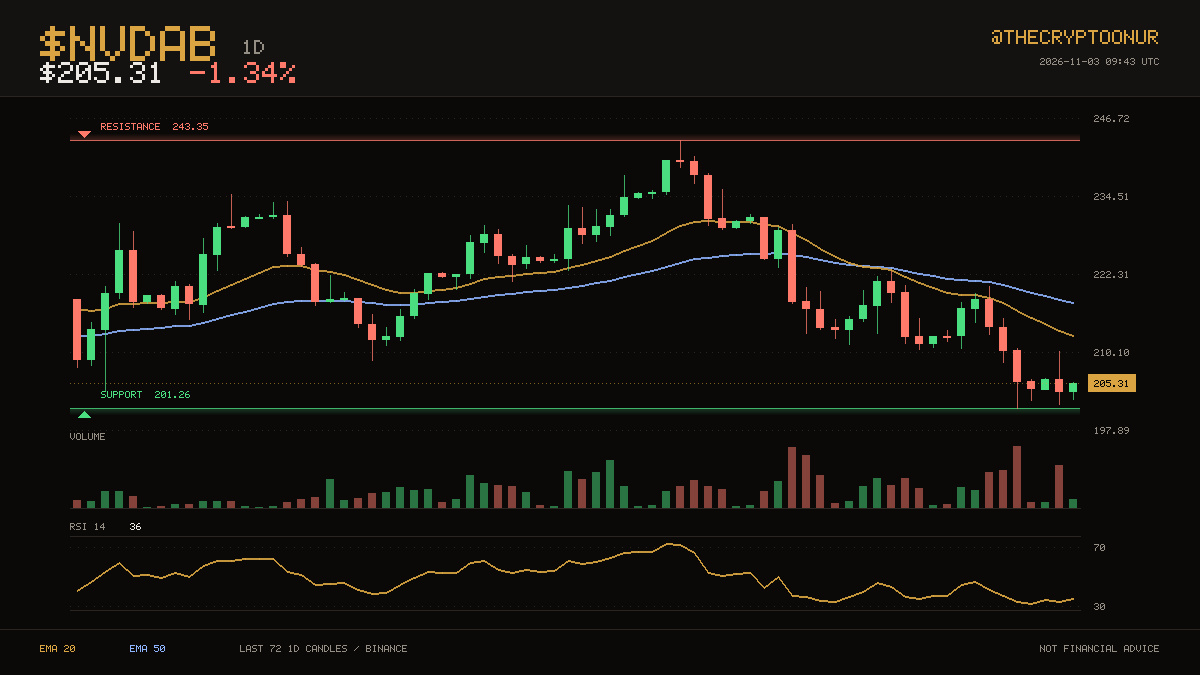
Price is $205.31 and $NVDAB remains below the averages that capped it earlier. The $201.26 area held twice over the last two months and is being tested again. Price is down in the lower third of that range. The floor is 2.0% away and the ceiling is nowhere close. The 20 has stayed below the 50 for only 16 candles. RSI at 36 is neutral, so momentum is not blocking a move either way. Over the past day it has traded between $201.98 and $210.18, sitting around the middle of it now. The last 24 hours carried roughly 3.2x normal volume. Down 1.3% over 24 hours.
DYOR
$NVDAB #TechnicalAnalysis
🔴 $NVDAB · 1D
Price is $205.31 and $NVDAB remains below the averages that capped it earlier. The $201.26 area held twice over the last two months and is being tested again. Price is down in the lower third of that range. The floor is 2.0% away and the ceiling is nowhere close. The 20 has stayed below the 50 for only 16 candles. RSI at 36 is neutral, so momentum is not blocking a move either way. Over the past day it has traded between $201.98 and $210.18, sitting around the middle of it now. The last 24 hours carried roughly 3.2x normal volume. Down 1.3% over 24 hours.
DYOR
$NVDAB #TechnicalAnalysis
Price is $205.31 and $NVDAB remains below the averages that capped it earlier. The $201.26 area held twice over the last two months and is being tested again. Price is down in the lower third of that range. The floor is 2.0% away and the ceiling is nowhere close. The 20 has stayed below the 50 for only 16 candles. RSI at 36 is neutral, so momentum is not blocking a move either way. Over the past day it has traded between $201.98 and $210.18, sitting around the middle of it now. The last 24 hours carried roughly 3.2x normal volume. Down 1.3% over 24 hours.
DYOR
$NVDAB #TechnicalAnalysis
1
Ver traducción
🔴 $GOOGLB · 1D
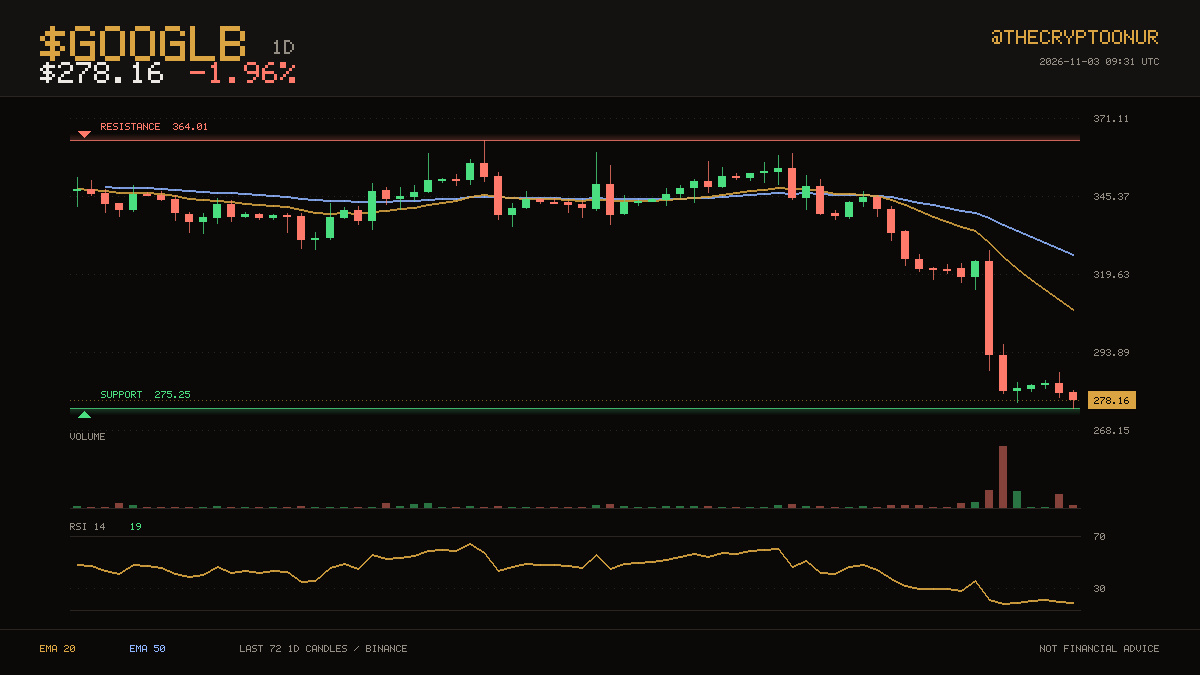
Price is $278.16 and $GOOGLB remains below the averages that capped it earlier. The $275.25 area held twice over the last two months and is being tested again. Price is down in the lower third of that range. The floor is 1.0% away and the ceiling is nowhere close. The 20 has stayed below the 50 for only 15 candles. RSI at 19 is deep in oversold territory. Over the past day it has traded between $275.25 and $287.37, sitting near the bottom of it now. The last 24 hours carried roughly 5.5x normal volume. Down 2.0% over 24 hours.
⚠️ DYOR
$GOOGLB #TechnicalAnalysis
🔴 $GOOGLB · 1D
Price is $278.16 and $GOOGLB remains below the averages that capped it earlier. The $275.25 area held twice over the last two months and is being tested again. Price is down in the lower third of that range. The floor is 1.0% away and the ceiling is nowhere close. The 20 has stayed below the 50 for only 15 candles. RSI at 19 is deep in oversold territory. Over the past day it has traded between $275.25 and $287.37, sitting near the bottom of it now. The last 24 hours carried roughly 5.5x normal volume. Down 2.0% over 24 hours.
⚠️ DYOR
$GOOGLB #TechnicalAnalysis
Price is $278.16 and $GOOGLB remains below the averages that capped it earlier. The $275.25 area held twice over the last two months and is being tested again. Price is down in the lower third of that range. The floor is 1.0% away and the ceiling is nowhere close. The 20 has stayed below the 50 for only 15 candles. RSI at 19 is deep in oversold territory. Over the past day it has traded between $275.25 and $287.37, sitting near the bottom of it now. The last 24 hours carried roughly 5.5x normal volume. Down 2.0% over 24 hours.
⚠️ DYOR
$GOOGLB #TechnicalAnalysis
14
📈 $XAUT · 1D
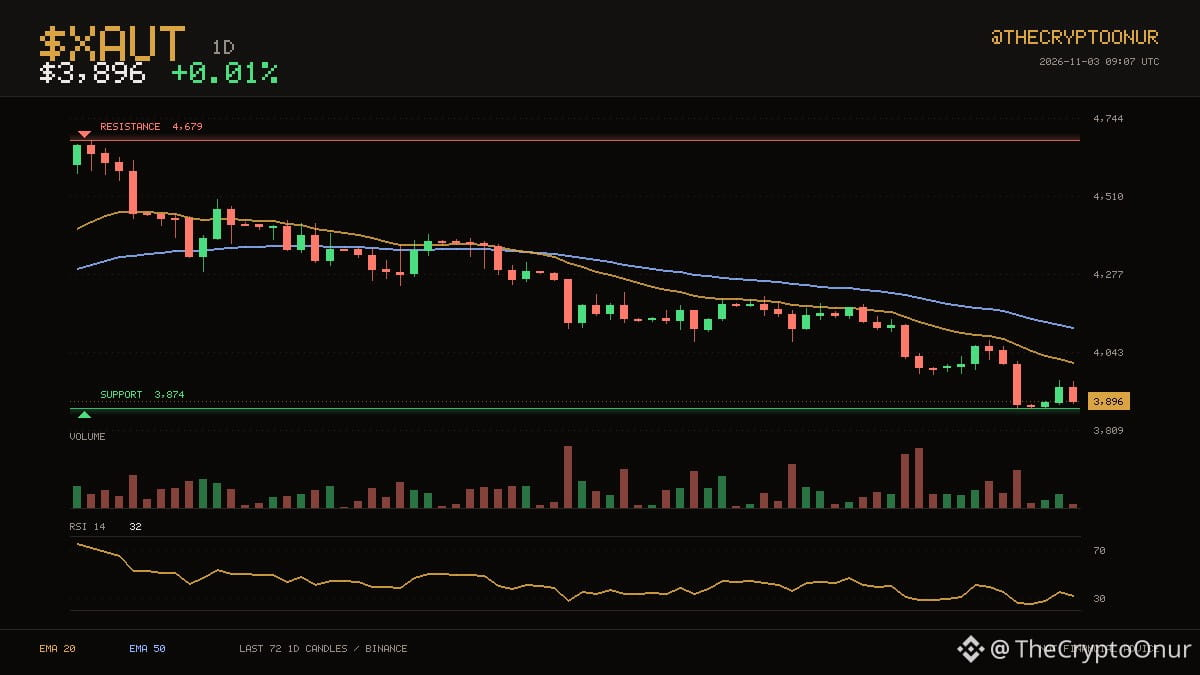
Los compradores han estado apareciendo alrededor de los $3,874, donde se encuentra el precio ahora. $XAUT está en $3,896, por debajo de sus medias diarias de 20 y 50 períodos. Se encuentra en el tercio inferior del rango. El soporte más cercano está un 0.6% por debajo; el máximo del rango está muy por encima. Las medias han mantenido el mismo orden durante 40 velas, con la de 20 períodos por debajo de la de 50. El impulso está en la zona media, con un RSI de 32. El rango de 24 horas va de $3,891 a $3,959, y el precio está cerca de la parte inferior. El volumen está cerca de lo normal, en 1.0x la media reciente. Sin cambios en las últimas 24 horas.
Datos del mercado spot de Binance. Haz tu propia investigación.
$XAUT #Binance
📈 $XAUT · 1D
Los compradores han estado apareciendo alrededor de los $3,874, donde se encuentra el precio ahora. $XAUT está en $3,896, por debajo de sus medias diarias de 20 y 50 períodos. Se encuentra en el tercio inferior del rango. El soporte más cercano está un 0.6% por debajo; el máximo del rango está muy por encima. Las medias han mantenido el mismo orden durante 40 velas, con la de 20 períodos por debajo de la de 50. El impulso está en la zona media, con un RSI de 32. El rango de 24 horas va de $3,891 a $3,959, y el precio está cerca de la parte inferior. El volumen está cerca de lo normal, en 1.0x la media reciente. Sin cambios en las últimas 24 horas.
Datos del mercado spot de Binance. Haz tu propia investigación.
$XAUT #Binance
Los compradores han estado apareciendo alrededor de los $3,874, donde se encuentra el precio ahora. $XAUT está en $3,896, por debajo de sus medias diarias de 20 y 50 períodos. Se encuentra en el tercio inferior del rango. El soporte más cercano está un 0.6% por debajo; el máximo del rango está muy por encima. Las medias han mantenido el mismo orden durante 40 velas, con la de 20 períodos por debajo de la de 50. El impulso está en la zona media, con un RSI de 32. El rango de 24 horas va de $3,891 a $3,959, y el precio está cerca de la parte inferior. El volumen está cerca de lo normal, en 1.0x la media reciente. Sin cambios en las últimas 24 horas.
Datos del mercado spot de Binance. Haz tu propia investigación.
$XAUT #Binance
15
Ver traducción
📉 $MUB · 4H
$MUB trades at $844.63, still on the weak side of its 4-hour averages. Buyers have been showing up around $830.43, which is where price is sitting now. It is sitting in the bottom third of the range. Support is the near one at 1.7% below; the range high is far above. Averages have been ordered the same way for 20 candles, with the 20 below the 50. RSI has dropped to 29, the kind of reading that usually comes with a bounce attempt. The 24 hour range runs $830.43 to $911.84, and price is near the bottom of it. Volume is close to normal at 0.9x the recent average. Down 7.0% over 24 hours.
⚠️ DYOR
$MUB #Crypto
📉 $MUB · 4H
$MUB trades at $844.63, still on the weak side of its 4-hour averages. Buyers have been showing up around $830.43, which is where price is sitting now. It is sitting in the bottom third of the range. Support is the near one at 1.7% below; the range high is far above. Averages have been ordered the same way for 20 candles, with the 20 below the 50. RSI has dropped to 29, the kind of reading that usually comes with a bounce attempt. The 24 hour range runs $830.43 to $911.84, and price is near the bottom of it. Volume is close to normal at 0.9x the recent average. Down 7.0% over 24 hours.
⚠️ DYOR
$MUB #Crypto
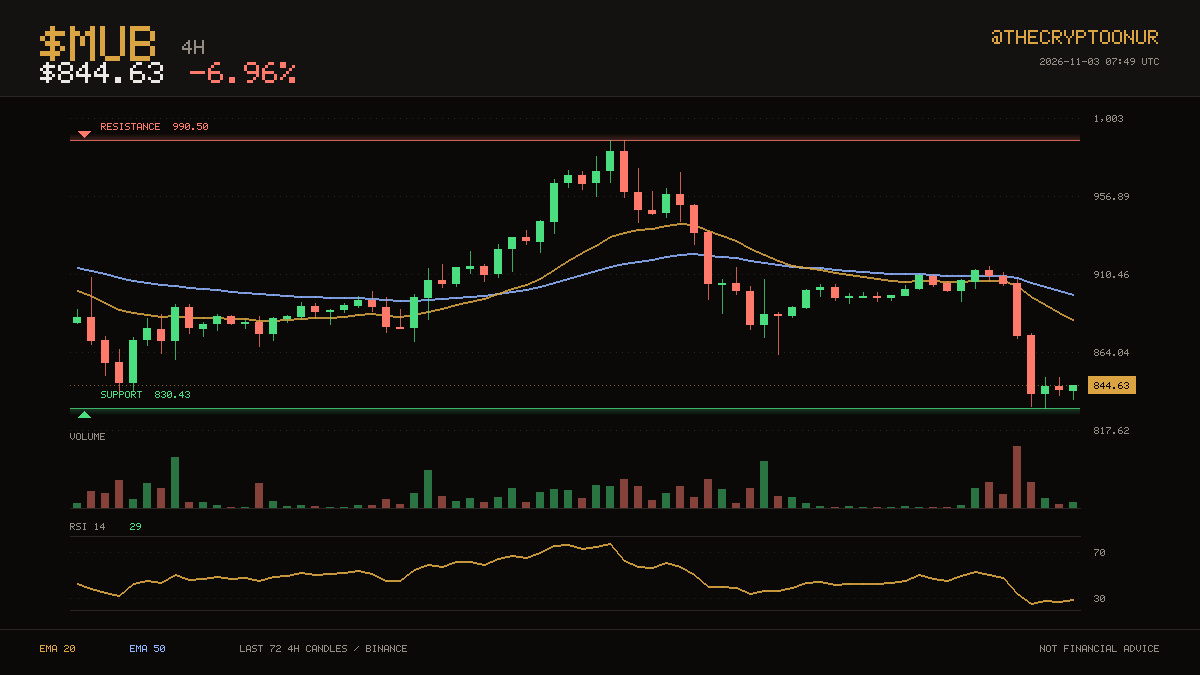
$MUB trades at $844.63, still on the weak side of its 4-hour averages. Buyers have been showing up around $830.43, which is where price is sitting now. It is sitting in the bottom third of the range. Support is the near one at 1.7% below; the range high is far above. Averages have been ordered the same way for 20 candles, with the 20 below the 50. RSI has dropped to 29, the kind of reading that usually comes with a bounce attempt. The 24 hour range runs $830.43 to $911.84, and price is near the bottom of it. Volume is close to normal at 0.9x the recent average. Down 7.0% over 24 hours.
⚠️ DYOR
$MUB #Crypto
18
Ver traducción
🔴 $SUI · 4H
Price is $0.8652 and $SUI remains below the averages that capped it earlier. $0.8277 on the low side and $1.00 on the high side have contained the last two weeks. It is sitting in the bottom third of the range. Support is the near one at 4.3% below; the range high is far above. Averages have been ordered the same way for a long stretch now, with the 20 below the 50. Momentum is mid range with RSI at 34. The 24 hour range runs $0.8595 to $0.8958, and price is near the bottom of it. Volume is thin, around 0.5x the recent average, so moves here are easier to fade. Down 3.0% over 24 hours.
DYOR
$SUI #Crypto
🔴 $SUI · 4H
Price is $0.8652 and $SUI remains below the averages that capped it earlier. $0.8277 on the low side and $1.00 on the high side have contained the last two weeks. It is sitting in the bottom third of the range. Support is the near one at 4.3% below; the range high is far above. Averages have been ordered the same way for a long stretch now, with the 20 below the 50. Momentum is mid range with RSI at 34. The 24 hour range runs $0.8595 to $0.8958, and price is near the bottom of it. Volume is thin, around 0.5x the recent average, so moves here are easier to fade. Down 3.0% over 24 hours.
DYOR
$SUI #Crypto
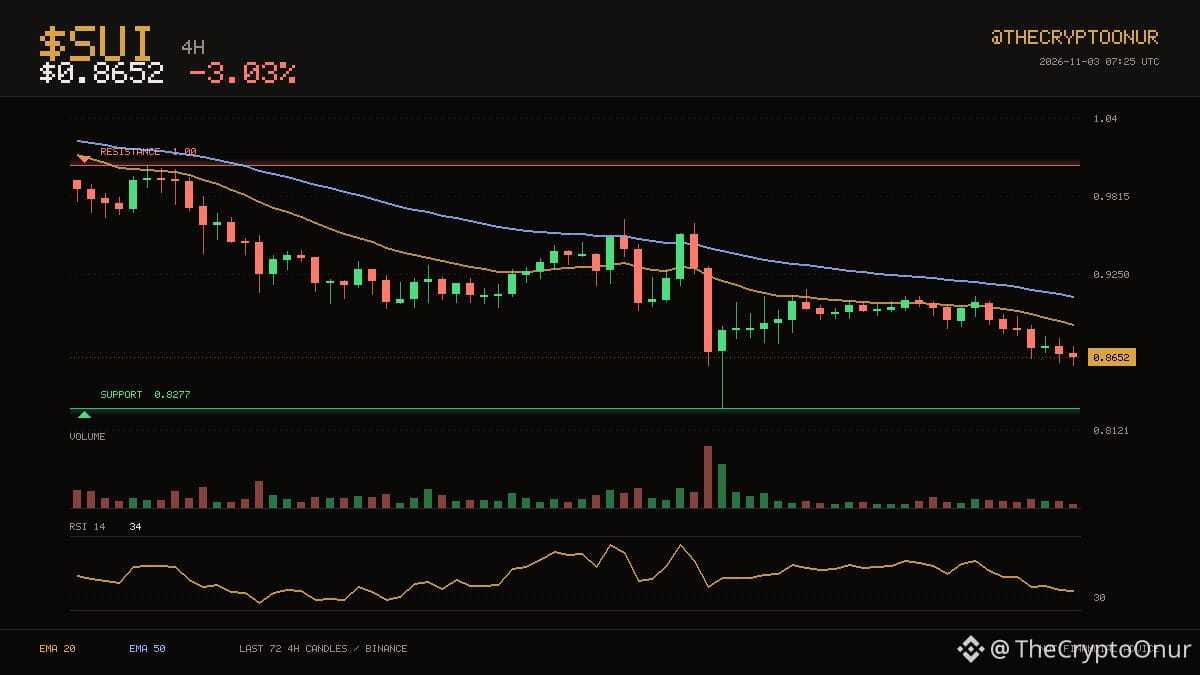
Price is $0.8652 and $SUI remains below the averages that capped it earlier. $0.8277 on the low side and $1.00 on the high side have contained the last two weeks. It is sitting in the bottom third of the range. Support is the near one at 4.3% below; the range high is far above. Averages have been ordered the same way for a long stretch now, with the 20 below the 50. Momentum is mid range with RSI at 34. The 24 hour range runs $0.8595 to $0.8958, and price is near the bottom of it. Volume is thin, around 0.5x the recent average, so moves here are easier to fade. Down 3.0% over 24 hours.
DYOR
$SUI #Crypto
16
🔴 $LINK · 4H
El precio está en $11.08 y $LINK sigue por debajo de las medias que lo frenaron anteriormente. Los $10.27 por abajo y los $12.28 por arriba han contenido el precio durante las últimas dos semanas. Eso lo sitúa en el medio del rango: a un 10.8% del techo y a un 7.3% del suelo. La media de 20 se ha mantenido por debajo de la de 50 durante un largo periodo. El RSI en 40 es neutral, así que el impulso tampoco impide un movimiento en ninguna dirección. Durante el último día, ha cotizado entre $11.00 y $11.43, y ahora está cerca de la parte baja de ese rango. El volumen negociado no destaca: se sitúa en 1.2 veces el promedio reciente. Bajó un 2.2% en 24 horas.
Investiga por tu cuenta
$LINK #AnálisisTécnico
🔴 $LINK · 4H
El precio está en $11.08 y $LINK sigue por debajo de las medias que lo frenaron anteriormente. Los $10.27 por abajo y los $12.28 por arriba han contenido el precio durante las últimas dos semanas. Eso lo sitúa en el medio del rango: a un 10.8% del techo y a un 7.3% del suelo. La media de 20 se ha mantenido por debajo de la de 50 durante un largo periodo. El RSI en 40 es neutral, así que el impulso tampoco impide un movimiento en ninguna dirección. Durante el último día, ha cotizado entre $11.00 y $11.43, y ahora está cerca de la parte baja de ese rango. El volumen negociado no destaca: se sitúa en 1.2 veces el promedio reciente. Bajó un 2.2% en 24 horas.
Investiga por tu cuenta
$LINK #AnálisisTécnico
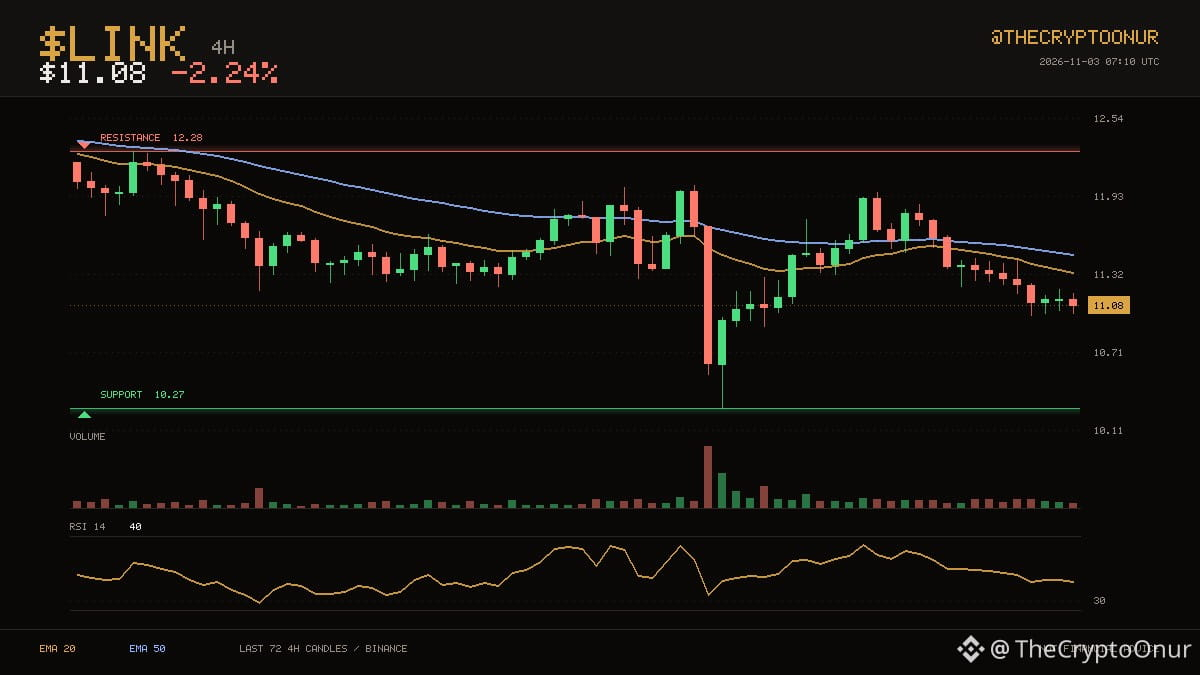
El precio está en $11.08 y $LINK sigue por debajo de las medias que lo frenaron anteriormente. Los $10.27 por abajo y los $12.28 por arriba han contenido el precio durante las últimas dos semanas. Eso lo sitúa en el medio del rango: a un 10.8% del techo y a un 7.3% del suelo. La media de 20 se ha mantenido por debajo de la de 50 durante un largo periodo. El RSI en 40 es neutral, así que el impulso tampoco impide un movimiento en ninguna dirección. Durante el último día, ha cotizado entre $11.00 y $11.43, y ahora está cerca de la parte baja de ese rango. El volumen negociado no destaca: se sitúa en 1.2 veces el promedio reciente. Bajó un 2.2% en 24 horas.
Investiga por tu cuenta
$LINK #AnálisisTécnico
25
Ver traducción
📉 $ENA · 1H
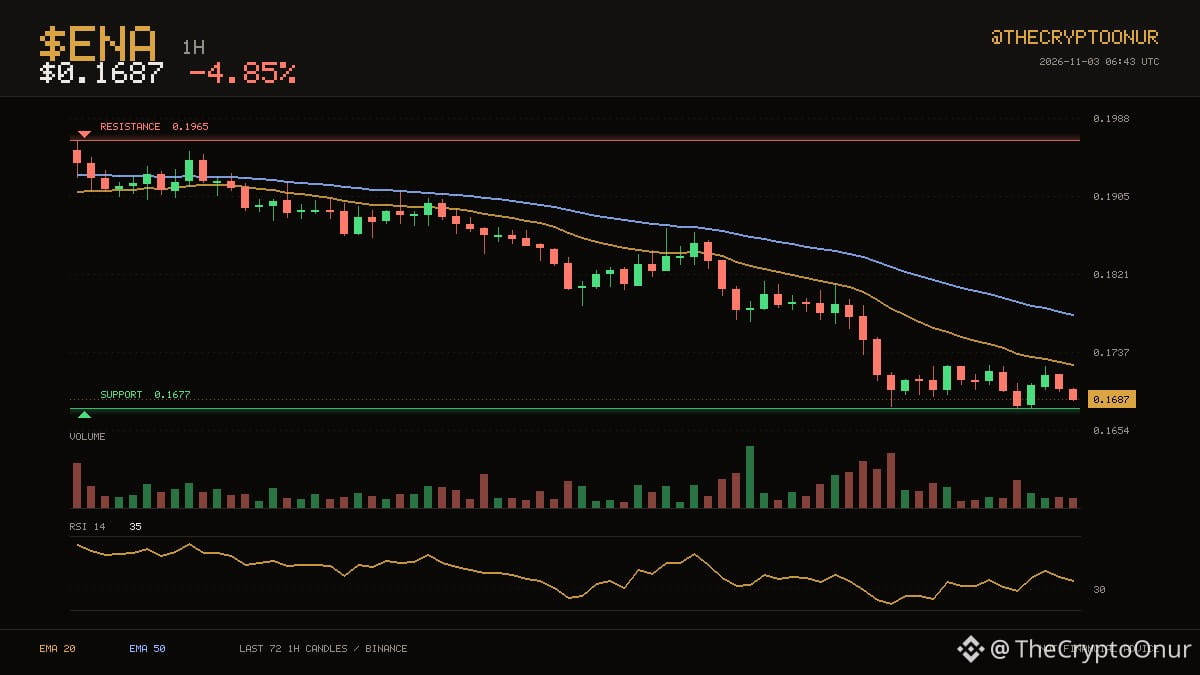
Buyers have been showing up around $0.1677, which is where price is sitting now. $ENA is at $0.1687, under both its 20 and 50 hourly averages. It is sitting in the bottom third of the range. Support is the near one at 0.6% below; the range high is far above. Averages have been ordered the same way for a long stretch now, with the 20 below the 50. Momentum is mid range with RSI at 35. The 24 hour range runs $0.1677 to $0.1814, and price is near the bottom of it. Volume is thin, around 0.4x the recent average, so moves here are easier to fade. Down 4.9% over 24 hours.
Binance spot data. DYOR
$ENA #Binance
📉 $ENA · 1H
Buyers have been showing up around $0.1677, which is where price is sitting now. $ENA is at $0.1687, under both its 20 and 50 hourly averages. It is sitting in the bottom third of the range. Support is the near one at 0.6% below; the range high is far above. Averages have been ordered the same way for a long stretch now, with the 20 below the 50. Momentum is mid range with RSI at 35. The 24 hour range runs $0.1677 to $0.1814, and price is near the bottom of it. Volume is thin, around 0.4x the recent average, so moves here are easier to fade. Down 4.9% over 24 hours.
Binance spot data. DYOR
$ENA #Binance
Buyers have been showing up around $0.1677, which is where price is sitting now. $ENA is at $0.1687, under both its 20 and 50 hourly averages. It is sitting in the bottom third of the range. Support is the near one at 0.6% below; the range high is far above. Averages have been ordered the same way for a long stretch now, with the 20 below the 50. Momentum is mid range with RSI at 35. The 24 hour range runs $0.1677 to $0.1814, and price is near the bottom of it. Volume is thin, around 0.4x the recent average, so moves here are easier to fade. Down 4.9% over 24 hours.
Binance spot data. DYOR
$ENA #Binance
19
Ver traducción
📈 $TRX · 1D
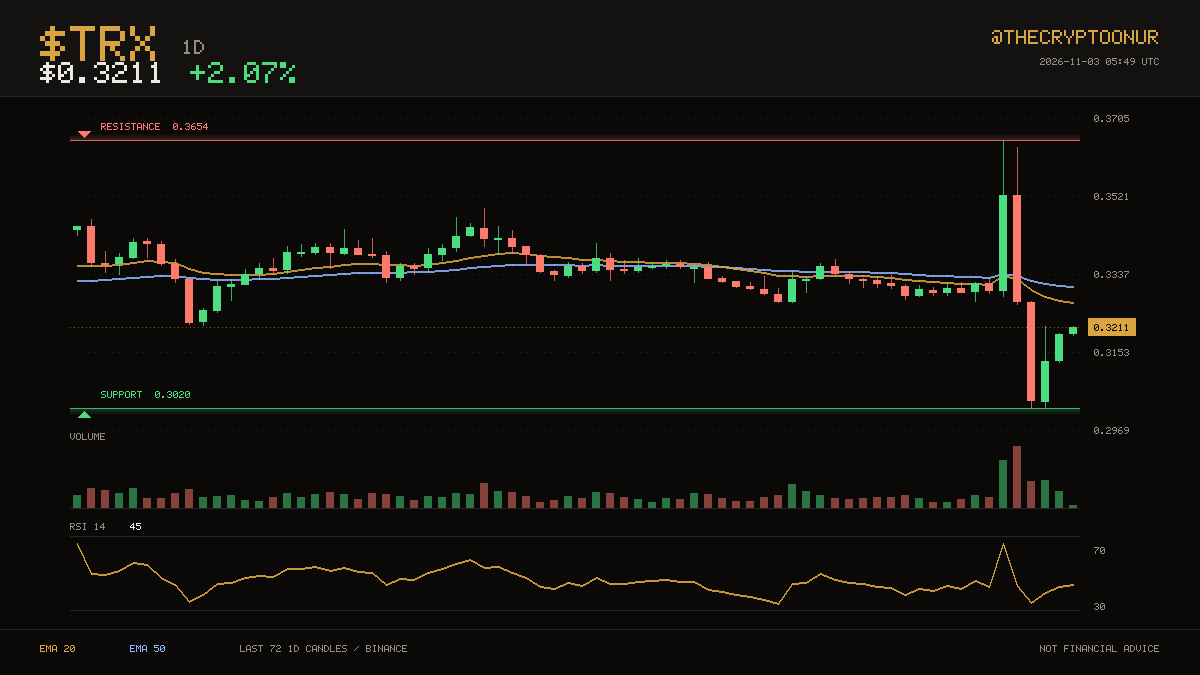
$TRX trades at $0.3211, still on the weak side of its daily averages. The two month range runs from $0.3020 up to $0.3654. It is sitting in the bottom third of the range. Resistance sits 13.8% above and support 5.9% below. Averages have been ordered the same way for 25 candles, with the 20 below the 50. Momentum is mid range with RSI at 45. The 24 hour range runs $0.3138 to $0.3215, and price is near the top of it. Volume is close to normal at 1.3x the recent average. Those averages sit at $0.3270 and $0.3308 respectively. Up 2.1% over 24 hours.
DYOR
$TRX #Crypto
📈 $TRX · 1D
$TRX trades at $0.3211, still on the weak side of its daily averages. The two month range runs from $0.3020 up to $0.3654. It is sitting in the bottom third of the range. Resistance sits 13.8% above and support 5.9% below. Averages have been ordered the same way for 25 candles, with the 20 below the 50. Momentum is mid range with RSI at 45. The 24 hour range runs $0.3138 to $0.3215, and price is near the top of it. Volume is close to normal at 1.3x the recent average. Those averages sit at $0.3270 and $0.3308 respectively. Up 2.1% over 24 hours.
DYOR
$TRX #Crypto
$TRX trades at $0.3211, still on the weak side of its daily averages. The two month range runs from $0.3020 up to $0.3654. It is sitting in the bottom third of the range. Resistance sits 13.8% above and support 5.9% below. Averages have been ordered the same way for 25 candles, with the 20 below the 50. Momentum is mid range with RSI at 45. The 24 hour range runs $0.3138 to $0.3215, and price is near the top of it. Volume is close to normal at 1.3x the recent average. Those averages sit at $0.3270 and $0.3308 respectively. Up 2.1% over 24 hours.
DYOR
$TRX #Crypto
9
Ver traducción
📉 $INTCB · 1H
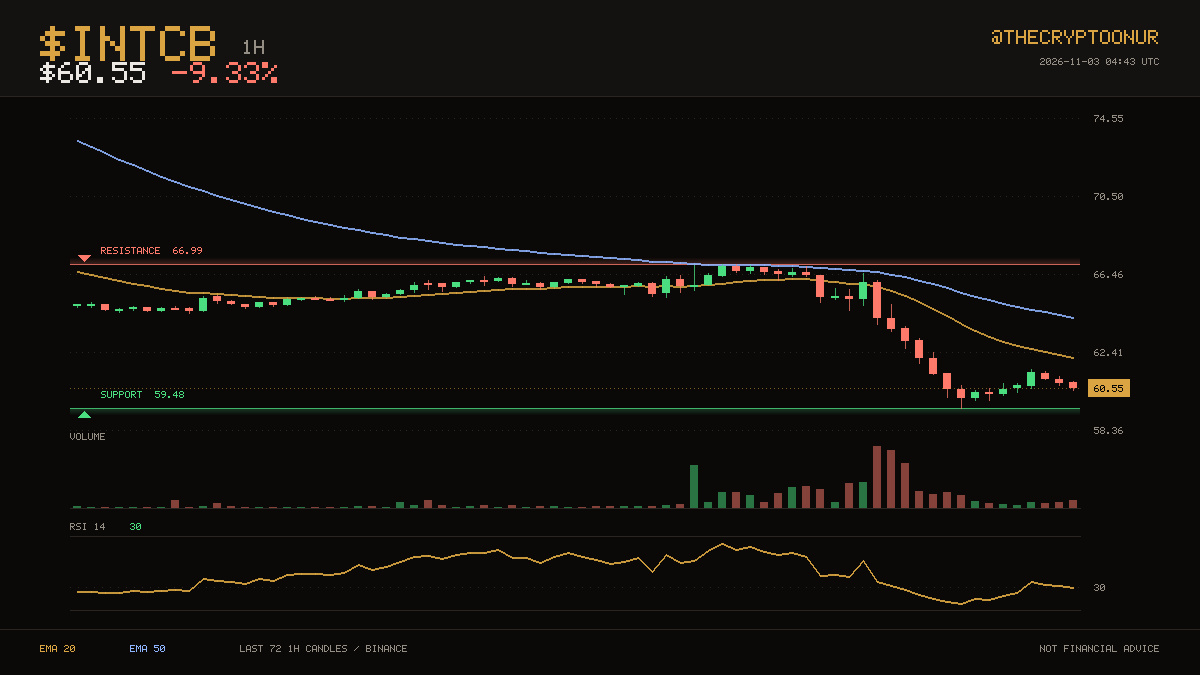
The $59.48 area held twice over the last three days and is being tested again. $INTCB is at $60.55, under both its 20 and 50 hourly averages. Price is down in the lower third of that range. That is 10.6% to the ceiling and 1.8% to the floor. The 20 has stayed below the 50 for a long stretch now. RSI at 30 is deep in oversold territory. Over the past day it has traded between $59.48 and $66.93, sitting near the bottom of it now. The last 24 hours carried roughly 1.6x normal volume. Down 9.3% over 24 hours.
⚠️ DYOR
$INTCB #Binance
📉 $INTCB · 1H
The $59.48 area held twice over the last three days and is being tested again. $INTCB is at $60.55, under both its 20 and 50 hourly averages. Price is down in the lower third of that range. That is 10.6% to the ceiling and 1.8% to the floor. The 20 has stayed below the 50 for a long stretch now. RSI at 30 is deep in oversold territory. Over the past day it has traded between $59.48 and $66.93, sitting near the bottom of it now. The last 24 hours carried roughly 1.6x normal volume. Down 9.3% over 24 hours.
⚠️ DYOR
$INTCB #Binance
The $59.48 area held twice over the last three days and is being tested again. $INTCB is at $60.55, under both its 20 and 50 hourly averages. Price is down in the lower third of that range. That is 10.6% to the ceiling and 1.8% to the floor. The 20 has stayed below the 50 for a long stretch now. RSI at 30 is deep in oversold territory. Over the past day it has traded between $59.48 and $66.93, sitting near the bottom of it now. The last 24 hours carried roughly 1.6x normal volume. Down 9.3% over 24 hours.
⚠️ DYOR
$INTCB #Binance
Ver traducción
🔴 $INTCB · 1H
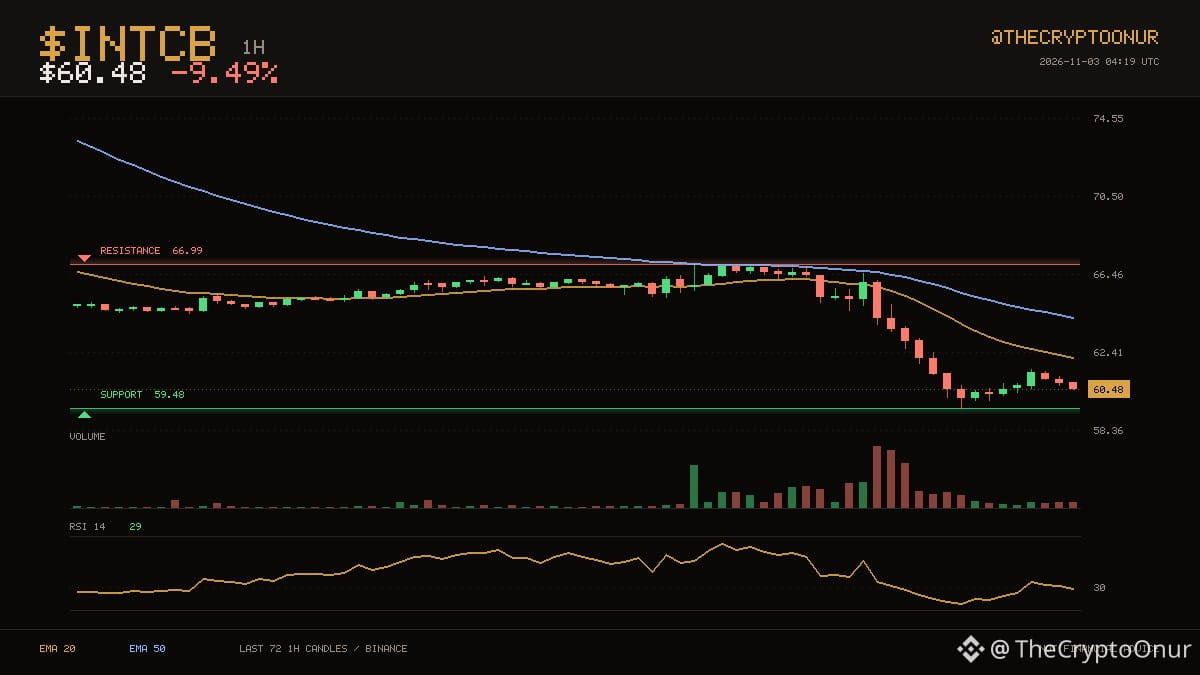
$INTCB trades at $60.48, still on the weak side of its hourly averages. Buyers have been showing up around $59.48, which is where price is sitting now. RSI has dropped to 29, the kind of reading that usually comes with a bounce attempt. Resistance sits 10.8% above and support 1.7% below. Down 9.5% over 24 hours.
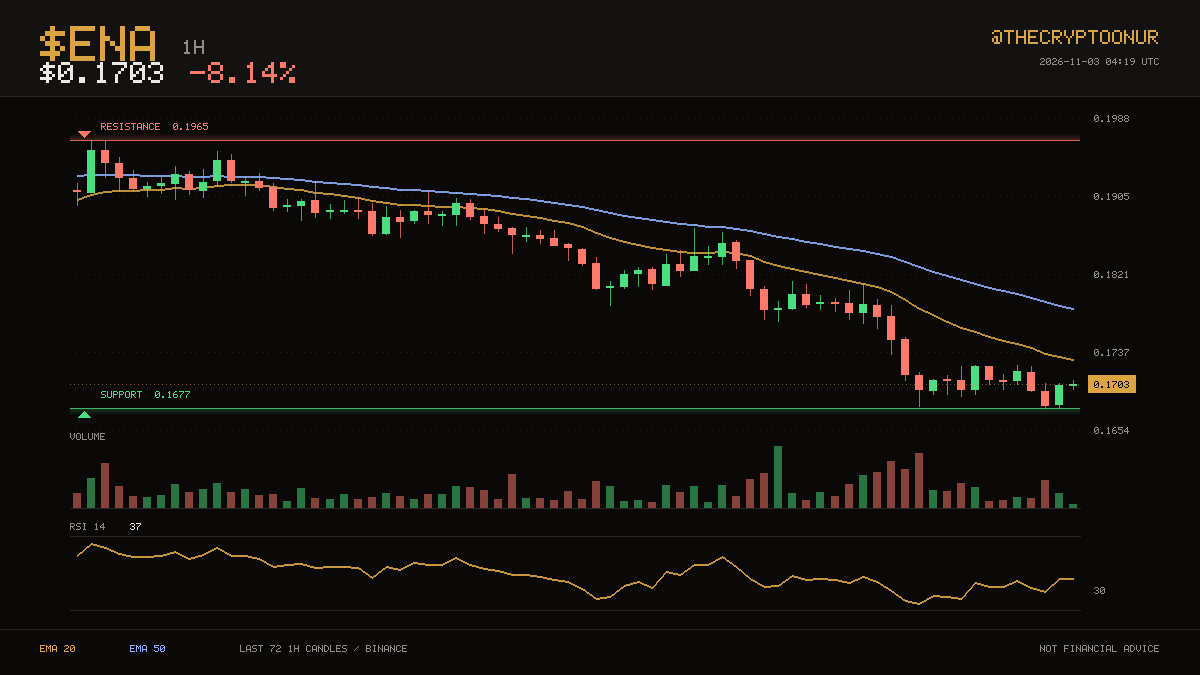
📉 $ENA · 1H
$ENA is at $0.1703, under both its 20 and 50 hourly averages. The $0.1677 area held twice over the last three days and is being tested again. RSI at 37 is neutral, so momentum is not blocking a move either way. The floor is 1.5% away and the ceiling is nowhere close. Down 8.1% over 24 hours.
⚠️ DYOR
$INTCB $ENA #Trading
🔴 $INTCB · 1H
$INTCB trades at $60.48, still on the weak side of its hourly averages. Buyers have been showing up around $59.48, which is where price is sitting now. RSI has dropped to 29, the kind of reading that usually comes with a bounce attempt. Resistance sits 10.8% above and support 1.7% below. Down 9.5% over 24 hours.
📉 $ENA · 1H
$ENA is at $0.1703, under both its 20 and 50 hourly averages. The $0.1677 area held twice over the last three days and is being tested again. RSI at 37 is neutral, so momentum is not blocking a move either way. The floor is 1.5% away and the ceiling is nowhere close. Down 8.1% over 24 hours.
⚠️ DYOR
$INTCB $ENA #Trading
$INTCB trades at $60.48, still on the weak side of its hourly averages. Buyers have been showing up around $59.48, which is where price is sitting now. RSI has dropped to 29, the kind of reading that usually comes with a bounce attempt. Resistance sits 10.8% above and support 1.7% below. Down 9.5% over 24 hours.
📉 $ENA · 1H
$ENA is at $0.1703, under both its 20 and 50 hourly averages. The $0.1677 area held twice over the last three days and is being tested again. RSI at 37 is neutral, so momentum is not blocking a move either way. The floor is 1.5% away and the ceiling is nowhere close. Down 8.1% over 24 hours.
⚠️ DYOR
$INTCB $ENA #Trading
17
Ver traducción
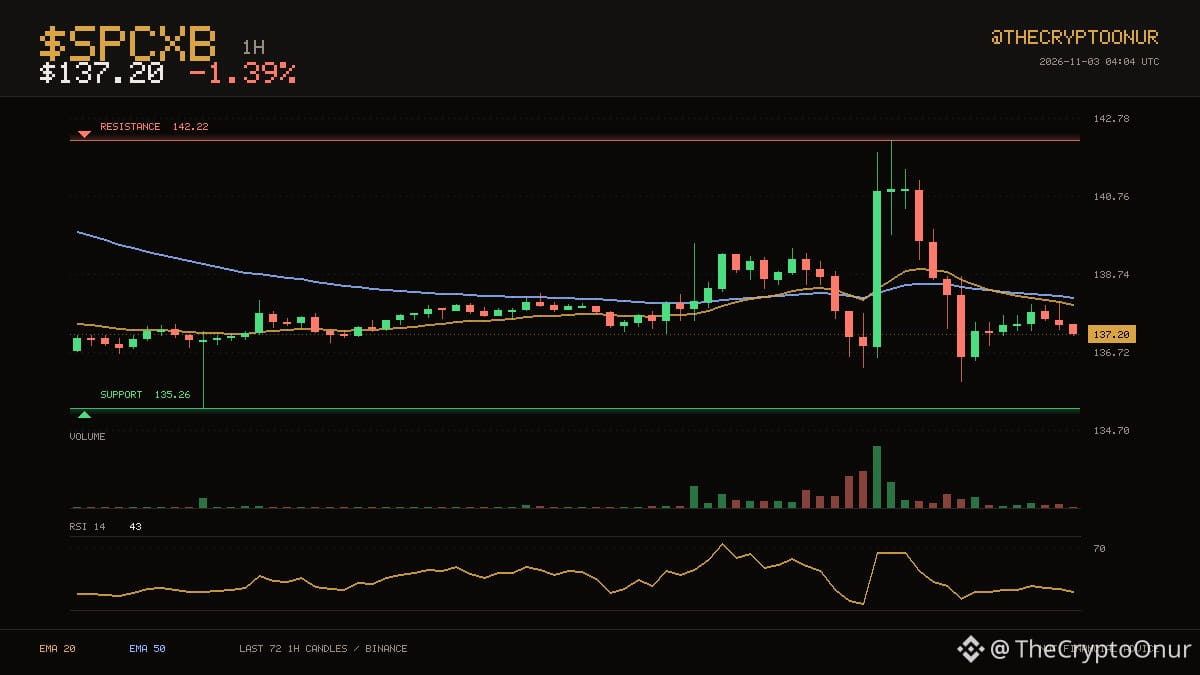
📉 $SPCXB · 1H
$SPCXB trades at $137.20, still on the weak side of its hourly averages. The three day range runs from $135.26 up to $142.22. Price is down in the lower third of that range. That is 3.7% to the ceiling and 1.4% to the floor. The 20 crossed below the 50 recently, for only 6 candles, so this leg is still young. RSI at 43 is neutral, so momentum is not blocking a move either way. Over the past day it has traded between $135.98 and $142.22, sitting near the bottom of it now. The last 24 hours carried roughly 2.0x normal volume. Down 1.4% over 24 hours.
DYOR
$SPCXB #Trading
📉 $SPCXB · 1H
$SPCXB trades at $137.20, still on the weak side of its hourly averages. The three day range runs from $135.26 up to $142.22. Price is down in the lower third of that range. That is 3.7% to the ceiling and 1.4% to the floor. The 20 crossed below the 50 recently, for only 6 candles, so this leg is still young. RSI at 43 is neutral, so momentum is not blocking a move either way. Over the past day it has traded between $135.98 and $142.22, sitting near the bottom of it now. The last 24 hours carried roughly 2.0x normal volume. Down 1.4% over 24 hours.
DYOR
$SPCXB #Trading
$SPCXB trades at $137.20, still on the weak side of its hourly averages. The three day range runs from $135.26 up to $142.22. Price is down in the lower third of that range. That is 3.7% to the ceiling and 1.4% to the floor. The 20 crossed below the 50 recently, for only 6 candles, so this leg is still young. RSI at 43 is neutral, so momentum is not blocking a move either way. Over the past day it has traded between $135.98 and $142.22, sitting near the bottom of it now. The last 24 hours carried roughly 2.0x normal volume. Down 1.4% over 24 hours.
DYOR
$SPCXB #Trading
4
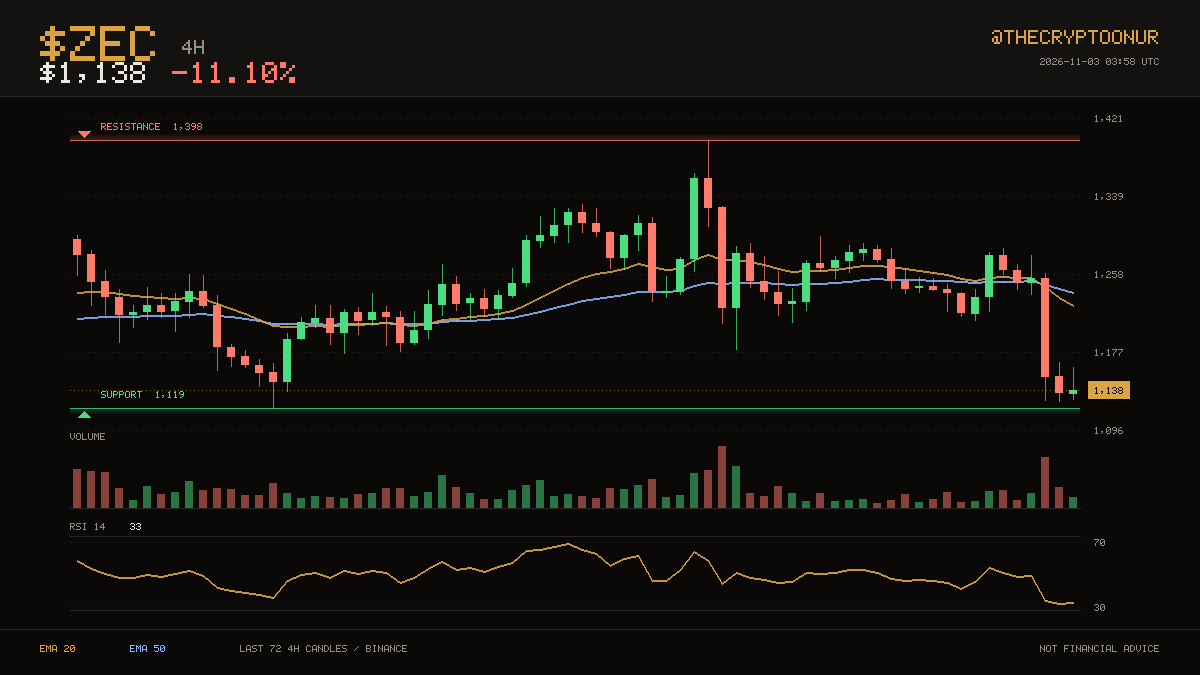
🔴 $ZEC · 4H
El precio está en $1,138 y $ZEC sigue por debajo de las medias que antes lo frenaron. Los compradores han aparecido alrededor de $1,119, donde se encuentra ahora el precio. Está en el tercio inferior del rango. El soporte más cercano está un 1.7% por debajo; el máximo del rango está muy por encima. Este cambio es reciente: la media de 20 lleva por debajo de la de 50 solo 3 velas. El impulso está en la zona media, con un RSI de 33. El rango de 24 horas va de $1,126 a $1,285, y el precio está cerca de la parte inferior. El volumen es escaso, alrededor de 0.7x la media reciente, por lo que es más fácil que los movimientos de aquí pierdan fuerza. Baja un 11.1% en 24 horas.
Investiga por tu cuenta
$ZEC #Cripto
🔴 $ZEC · 4H
El precio está en $1,138 y $ZEC sigue por debajo de las medias que antes lo frenaron. Los compradores han aparecido alrededor de $1,119, donde se encuentra ahora el precio. Está en el tercio inferior del rango. El soporte más cercano está un 1.7% por debajo; el máximo del rango está muy por encima. Este cambio es reciente: la media de 20 lleva por debajo de la de 50 solo 3 velas. El impulso está en la zona media, con un RSI de 33. El rango de 24 horas va de $1,126 a $1,285, y el precio está cerca de la parte inferior. El volumen es escaso, alrededor de 0.7x la media reciente, por lo que es más fácil que los movimientos de aquí pierdan fuerza. Baja un 11.1% en 24 horas.
Investiga por tu cuenta
$ZEC #Cripto
El precio está en $1,138 y $ZEC sigue por debajo de las medias que antes lo frenaron. Los compradores han aparecido alrededor de $1,119, donde se encuentra ahora el precio. Está en el tercio inferior del rango. El soporte más cercano está un 1.7% por debajo; el máximo del rango está muy por encima. Este cambio es reciente: la media de 20 lleva por debajo de la de 50 solo 3 velas. El impulso está en la zona media, con un RSI de 33. El rango de 24 horas va de $1,126 a $1,285, y el precio está cerca de la parte inferior. El volumen es escaso, alrededor de 0.7x la media reciente, por lo que es más fácil que los movimientos de aquí pierdan fuerza. Baja un 11.1% en 24 horas.
Investiga por tu cuenta
$ZEC #Cripto
10
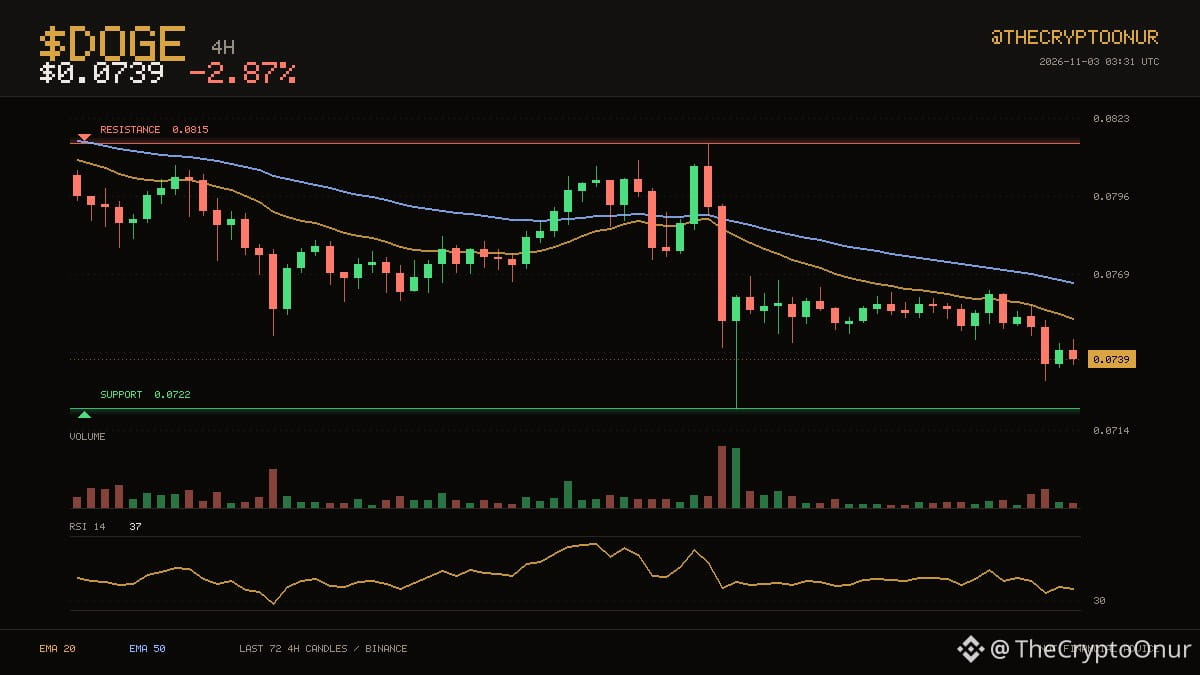
📉 $DOGE · 4H
$DOGE cotiza a $0.0739 y sigue estando por debajo de sus medias de 4 horas. Los compradores han aparecido cerca de los $0.0722, donde se encuentra ahora el precio. Está en el tercio inferior del rango. La resistencia está un 10.2% por encima y el soporte, un 2.3% por debajo. Las medias llevan mucho tiempo ordenadas de la misma manera, con la de 20 por debajo de la de 50. El impulso está en un punto medio, con el RSI en 37. El rango de 24 horas va de $0.0732 a $0.0763, y el precio está cerca del límite inferior. El volumen es escaso, alrededor de 0.5x la media reciente, por lo que es más fácil que los movimientos pierdan fuerza. Baja un 2.9% en 24 horas.
Investiga por tu cuenta (DYOR)
$DOGE #Cripto
📉 $DOGE · 4H
$DOGE cotiza a $0.0739 y sigue estando por debajo de sus medias de 4 horas. Los compradores han aparecido cerca de los $0.0722, donde se encuentra ahora el precio. Está en el tercio inferior del rango. La resistencia está un 10.2% por encima y el soporte, un 2.3% por debajo. Las medias llevan mucho tiempo ordenadas de la misma manera, con la de 20 por debajo de la de 50. El impulso está en un punto medio, con el RSI en 37. El rango de 24 horas va de $0.0732 a $0.0763, y el precio está cerca del límite inferior. El volumen es escaso, alrededor de 0.5x la media reciente, por lo que es más fácil que los movimientos pierdan fuerza. Baja un 2.9% en 24 horas.
Investiga por tu cuenta (DYOR)
$DOGE #Cripto
$DOGE cotiza a $0.0739 y sigue estando por debajo de sus medias de 4 horas. Los compradores han aparecido cerca de los $0.0722, donde se encuentra ahora el precio. Está en el tercio inferior del rango. La resistencia está un 10.2% por encima y el soporte, un 2.3% por debajo. Las medias llevan mucho tiempo ordenadas de la misma manera, con la de 20 por debajo de la de 50. El impulso está en un punto medio, con el RSI en 37. El rango de 24 horas va de $0.0732 a $0.0763, y el precio está cerca del límite inferior. El volumen es escaso, alrededor de 0.5x la media reciente, por lo que es más fácil que los movimientos pierdan fuerza. Baja un 2.9% en 24 horas.
Investiga por tu cuenta (DYOR)
$DOGE #Cripto
27
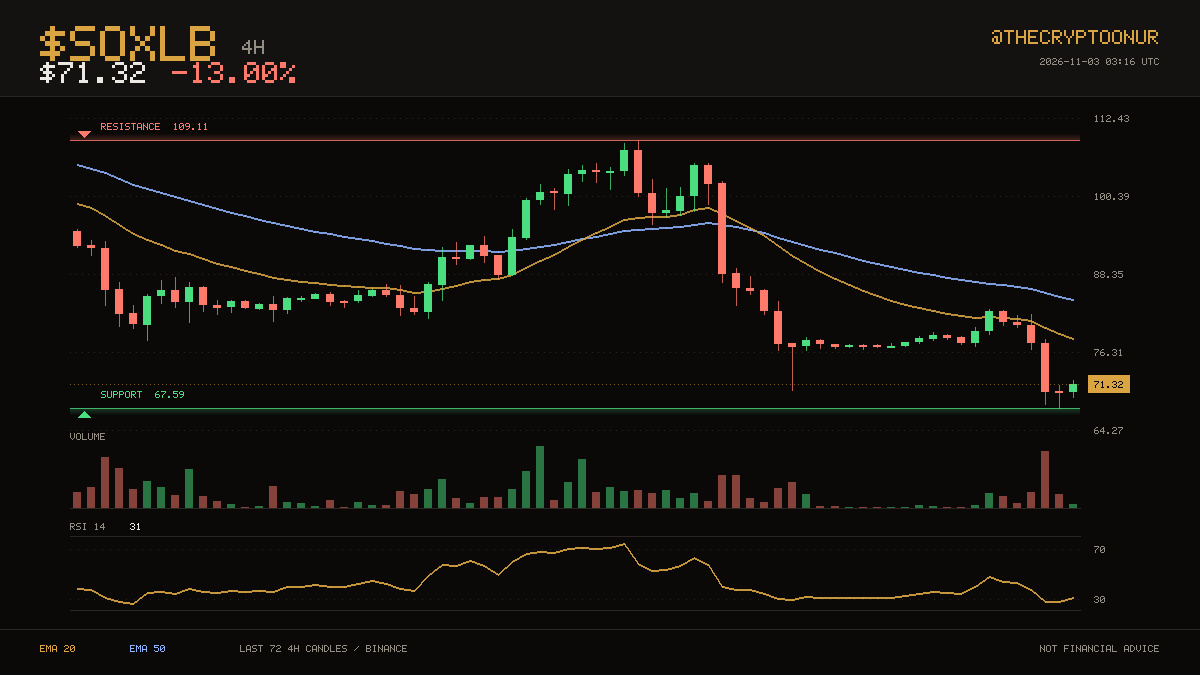
🔴 $SOXLB · 4H
El precio es de $71.32 y $SOXLB sigue por debajo de las medias que lo limitaron anteriormente. Los compradores han aparecido alrededor de $67.59, donde se encuentra ahora el precio. Está en el tercio inferior del rango. El soporte más cercano está un 5.2% por debajo; el máximo del rango está muy por encima. Las medias han mantenido el mismo orden durante 23 velas, con la de 20 por debajo de la de 50. El impulso está a mitad de rango, con un RSI de 31. El rango de las últimas 24 horas va de $67.59 a $82.88, y el precio está cerca del mínimo. El volumen es bajo, alrededor de 0.7x la media reciente, así que es más fácil que los movimientos aquí se reviertan. Ha bajado un 13.0% en las últimas 24 horas.
Haz tu propia investigación
$SOXLB #Cripto
🔴 $SOXLB · 4H
El precio es de $71.32 y $SOXLB sigue por debajo de las medias que lo limitaron anteriormente. Los compradores han aparecido alrededor de $67.59, donde se encuentra ahora el precio. Está en el tercio inferior del rango. El soporte más cercano está un 5.2% por debajo; el máximo del rango está muy por encima. Las medias han mantenido el mismo orden durante 23 velas, con la de 20 por debajo de la de 50. El impulso está a mitad de rango, con un RSI de 31. El rango de las últimas 24 horas va de $67.59 a $82.88, y el precio está cerca del mínimo. El volumen es bajo, alrededor de 0.7x la media reciente, así que es más fácil que los movimientos aquí se reviertan. Ha bajado un 13.0% en las últimas 24 horas.
Haz tu propia investigación
$SOXLB #Cripto
El precio es de $71.32 y $SOXLB sigue por debajo de las medias que lo limitaron anteriormente. Los compradores han aparecido alrededor de $67.59, donde se encuentra ahora el precio. Está en el tercio inferior del rango. El soporte más cercano está un 5.2% por debajo; el máximo del rango está muy por encima. Las medias han mantenido el mismo orden durante 23 velas, con la de 20 por debajo de la de 50. El impulso está a mitad de rango, con un RSI de 31. El rango de las últimas 24 horas va de $67.59 a $82.88, y el precio está cerca del mínimo. El volumen es bajo, alrededor de 0.7x la media reciente, así que es más fácil que los movimientos aquí se reviertan. Ha bajado un 13.0% en las últimas 24 horas.
Haz tu propia investigación
$SOXLB #Cripto
30
Ver traducción
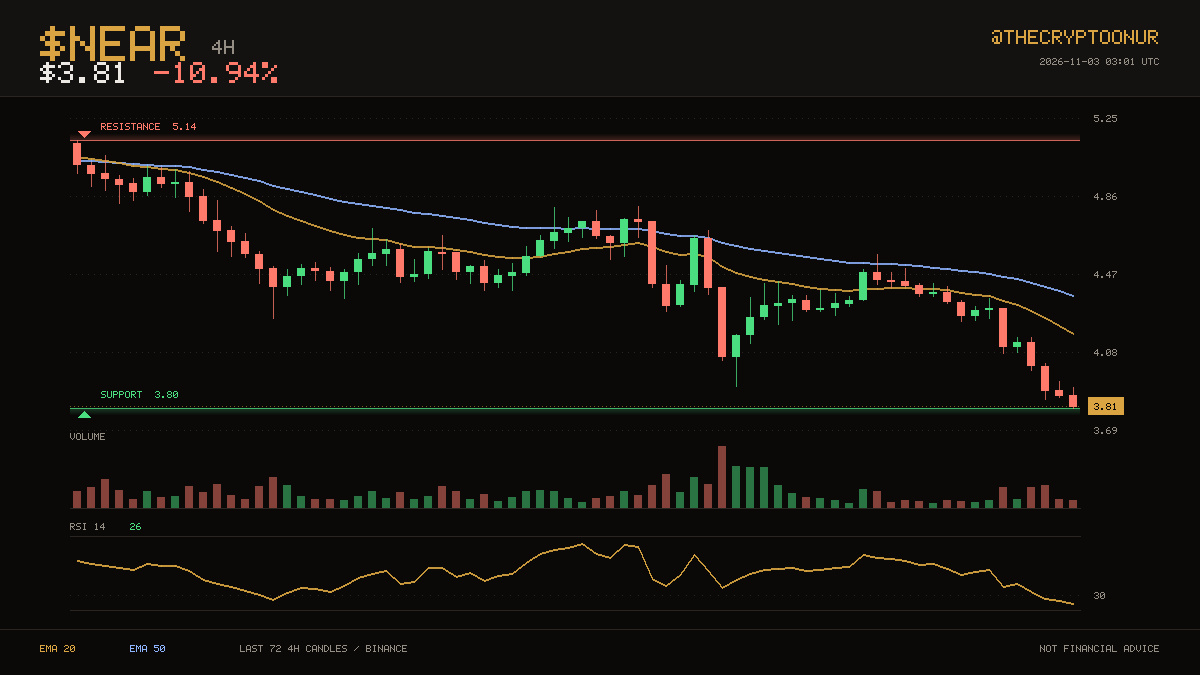
🔴 $NEAR · 4H
Price is $3.81 and $NEAR remains below the averages that capped it earlier. Buyers have been showing up around $3.80, which is where price is sitting now. It is sitting in the bottom third of the range. Support is the near one at 0.3% below; the range high is far above. Averages have been ordered the same way for a long stretch now, with the 20 below the 50. RSI has dropped to 26, the kind of reading that usually comes with a bounce attempt. The 24 hour range runs $3.80 to $4.34, and price is near the bottom of it. Volume is thin, around 0.6x the recent average, so moves here are easier to fade. Down 10.9% over 24 hours.
⚠️ DYOR
$NEAR #Crypto
🔴 $NEAR · 4H
Price is $3.81 and $NEAR remains below the averages that capped it earlier. Buyers have been showing up around $3.80, which is where price is sitting now. It is sitting in the bottom third of the range. Support is the near one at 0.3% below; the range high is far above. Averages have been ordered the same way for a long stretch now, with the 20 below the 50. RSI has dropped to 26, the kind of reading that usually comes with a bounce attempt. The 24 hour range runs $3.80 to $4.34, and price is near the bottom of it. Volume is thin, around 0.6x the recent average, so moves here are easier to fade. Down 10.9% over 24 hours.
⚠️ DYOR
$NEAR #Crypto
Price is $3.81 and $NEAR remains below the averages that capped it earlier. Buyers have been showing up around $3.80, which is where price is sitting now. It is sitting in the bottom third of the range. Support is the near one at 0.3% below; the range high is far above. Averages have been ordered the same way for a long stretch now, with the 20 below the 50. RSI has dropped to 26, the kind of reading that usually comes with a bounce attempt. The 24 hour range runs $3.80 to $4.34, and price is near the bottom of it. Volume is thin, around 0.6x the recent average, so moves here are easier to fade. Down 10.9% over 24 hours.
⚠️ DYOR
$NEAR #Crypto
41
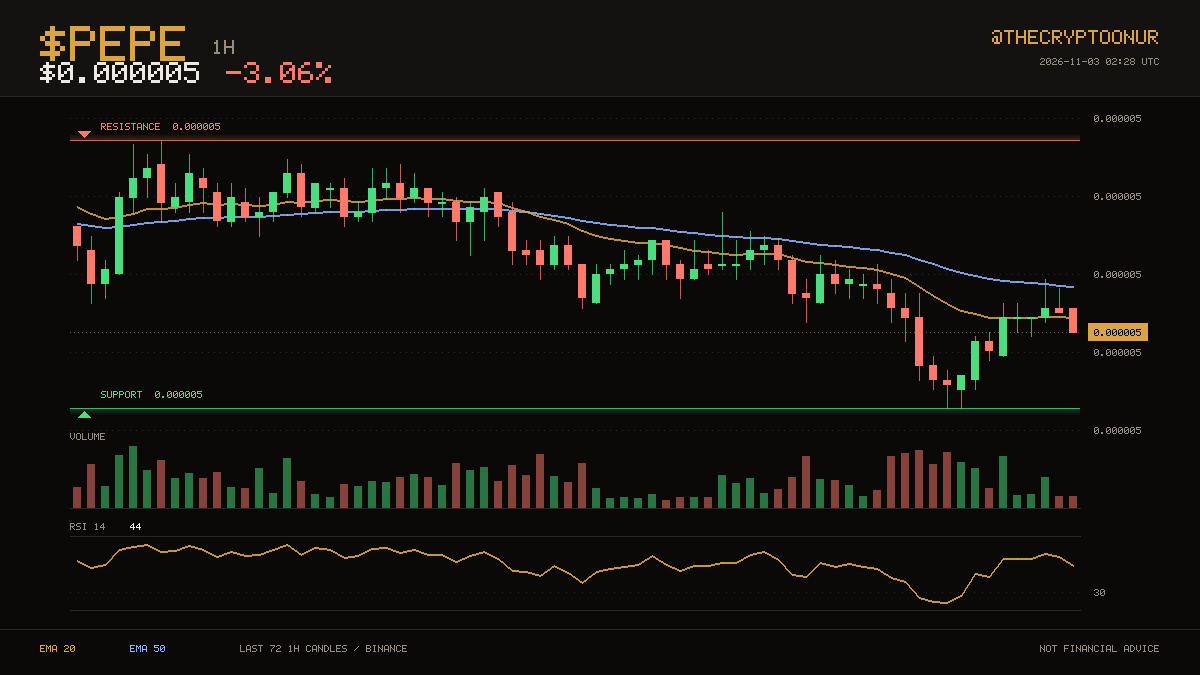
🔴 $PEPE · 1H
El precio está en $0.000005 y $PEPE sigue por debajo de las medias que lo frenaron antes. Los $0.000005 por abajo y los $0.000005 por arriba han contenido el precio durante los últimos tres días. Ahora está en el tercio inferior de ese rango: a un 8.2% del techo y a un 3.6% del suelo. La media de 20 se ha mantenido por debajo de la de 50 durante 39 velas. El RSI en 45 es neutral, así que el impulso tampoco impide un movimiento en ninguna dirección. Durante el último día ha cotizado entre $0.000005 y $0.000005, y ahora ronda el punto medio. La participación es baja, con un volumen de aproximadamente 0.4x el promedio. Ha bajado un 3.1% en 24 horas.
DYOR
$PEPE #AnálisisTécnico
🔴 $PEPE · 1H
El precio está en $0.000005 y $PEPE sigue por debajo de las medias que lo frenaron antes. Los $0.000005 por abajo y los $0.000005 por arriba han contenido el precio durante los últimos tres días. Ahora está en el tercio inferior de ese rango: a un 8.2% del techo y a un 3.6% del suelo. La media de 20 se ha mantenido por debajo de la de 50 durante 39 velas. El RSI en 45 es neutral, así que el impulso tampoco impide un movimiento en ninguna dirección. Durante el último día ha cotizado entre $0.000005 y $0.000005, y ahora ronda el punto medio. La participación es baja, con un volumen de aproximadamente 0.4x el promedio. Ha bajado un 3.1% en 24 horas.
DYOR
$PEPE #AnálisisTécnico
El precio está en $0.000005 y $PEPE sigue por debajo de las medias que lo frenaron antes. Los $0.000005 por abajo y los $0.000005 por arriba han contenido el precio durante los últimos tres días. Ahora está en el tercio inferior de ese rango: a un 8.2% del techo y a un 3.6% del suelo. La media de 20 se ha mantenido por debajo de la de 50 durante 39 velas. El RSI en 45 es neutral, así que el impulso tampoco impide un movimiento en ninguna dirección. Durante el último día ha cotizado entre $0.000005 y $0.000005, y ahora ronda el punto medio. La participación es baja, con un volumen de aproximadamente 0.4x el promedio. Ha bajado un 3.1% en 24 horas.
DYOR
$PEPE #AnálisisTécnico
104
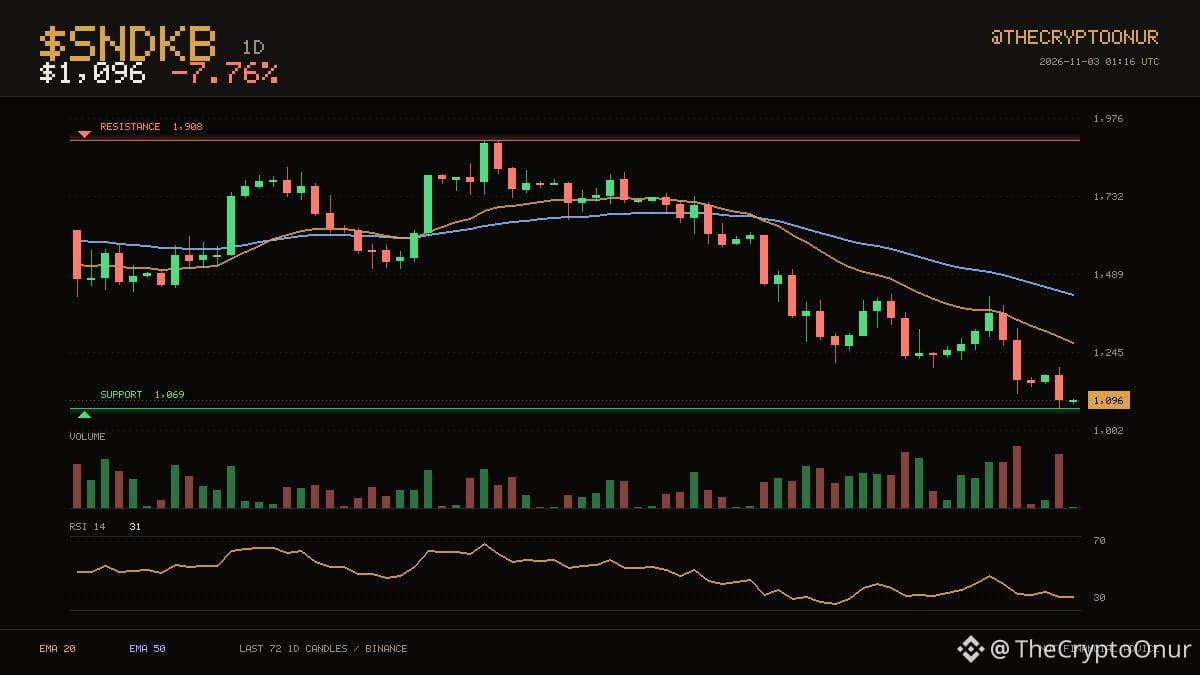
🔴 $SNDKB · 1D
El precio es de $1,096 y $SNDKB sigue por debajo de los promedios que lo limitaron anteriormente. La zona de $1,069 se mantuvo dos veces durante los últimos dos meses y vuelve a ponerse a prueba. El precio está en el tercio inferior de ese rango. El suelo está a un 2.4% de distancia y el techo no está nada cerca. La media de 20 se ha mantenido por debajo de la de 50 durante 23 velas. El RSI en 31 es neutral, así que el impulso tampoco impide un movimiento en ninguna dirección. Durante el último día, ha cotizado entre $1,069 y $1,198, y ahora está cerca del límite inferior. El volumen negociado no destaca: está en 1.4 veces el promedio reciente. Baja un 7.8% en 24 horas.
Haz tu propia investigación
$SNDKB #AnálisisTécnico
🔴 $SNDKB · 1D
El precio es de $1,096 y $SNDKB sigue por debajo de los promedios que lo limitaron anteriormente. La zona de $1,069 se mantuvo dos veces durante los últimos dos meses y vuelve a ponerse a prueba. El precio está en el tercio inferior de ese rango. El suelo está a un 2.4% de distancia y el techo no está nada cerca. La media de 20 se ha mantenido por debajo de la de 50 durante 23 velas. El RSI en 31 es neutral, así que el impulso tampoco impide un movimiento en ninguna dirección. Durante el último día, ha cotizado entre $1,069 y $1,198, y ahora está cerca del límite inferior. El volumen negociado no destaca: está en 1.4 veces el promedio reciente. Baja un 7.8% en 24 horas.
Haz tu propia investigación
$SNDKB #AnálisisTécnico
El precio es de $1,096 y $SNDKB sigue por debajo de los promedios que lo limitaron anteriormente. La zona de $1,069 se mantuvo dos veces durante los últimos dos meses y vuelve a ponerse a prueba. El precio está en el tercio inferior de ese rango. El suelo está a un 2.4% de distancia y el techo no está nada cerca. La media de 20 se ha mantenido por debajo de la de 50 durante 23 velas. El RSI en 31 es neutral, así que el impulso tampoco impide un movimiento en ninguna dirección. Durante el último día, ha cotizado entre $1,069 y $1,198, y ahora está cerca del límite inferior. El volumen negociado no destaca: está en 1.4 veces el promedio reciente. Baja un 7.8% en 24 horas.
Haz tu propia investigación
$SNDKB #AnálisisTécnico
96
📈 $TRX · 4H
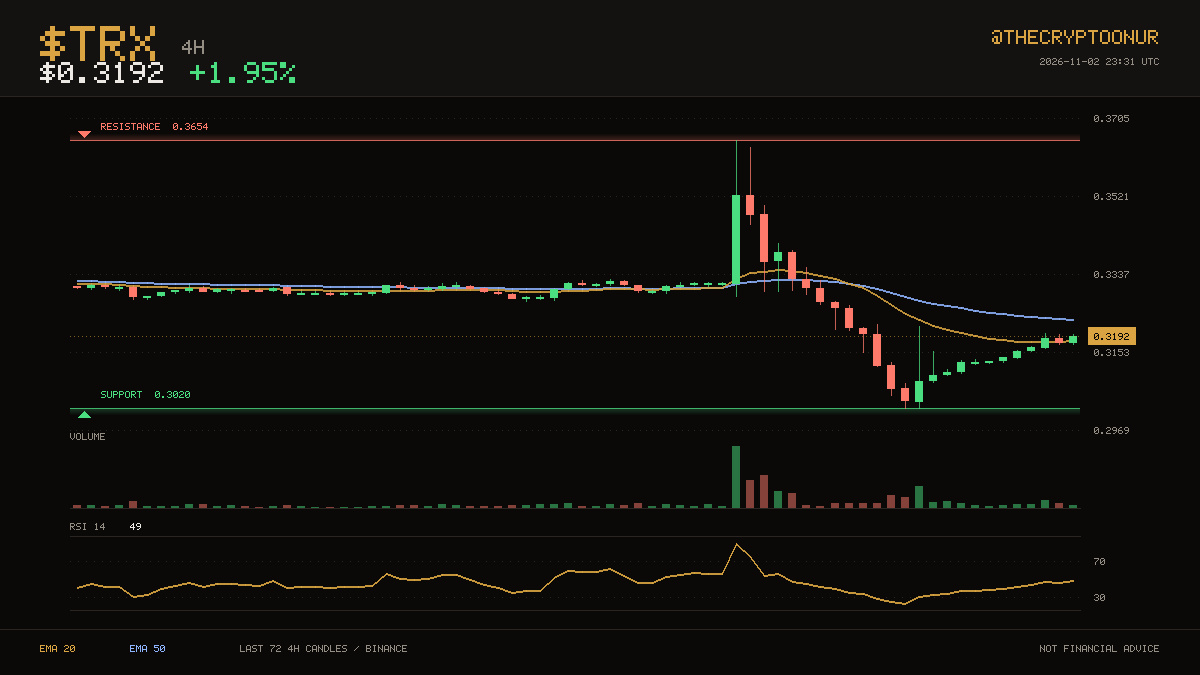
$TRX está a $0.3192, con una media por encima del precio y otra por debajo. El rango de dos semanas va de $0.3020 a $0.3654. Se encuentra en el tercio inferior del rango. La resistencia está un 14.5% por encima y el soporte un 5.4% por debajo. Las medias solo han estado ordenadas de la misma manera durante 16 velas, con la de 20 por debajo de la de 50. El impulso está en un nivel medio, con un RSI de 49. El rango de 24 horas va de $0.3129 a $0.3197, y el precio está cerca del máximo. El volumen del último día es aproximadamente 2.6 veces el promedio reciente, así que hay una participación real detrás de este movimiento. Subió un 1.9% en 24 horas.
Investiga por tu cuenta
$TRX #Cripto
📈 $TRX · 4H
$TRX está a $0.3192, con una media por encima del precio y otra por debajo. El rango de dos semanas va de $0.3020 a $0.3654. Se encuentra en el tercio inferior del rango. La resistencia está un 14.5% por encima y el soporte un 5.4% por debajo. Las medias solo han estado ordenadas de la misma manera durante 16 velas, con la de 20 por debajo de la de 50. El impulso está en un nivel medio, con un RSI de 49. El rango de 24 horas va de $0.3129 a $0.3197, y el precio está cerca del máximo. El volumen del último día es aproximadamente 2.6 veces el promedio reciente, así que hay una participación real detrás de este movimiento. Subió un 1.9% en 24 horas.
Investiga por tu cuenta
$TRX #Cripto
$TRX está a $0.3192, con una media por encima del precio y otra por debajo. El rango de dos semanas va de $0.3020 a $0.3654. Se encuentra en el tercio inferior del rango. La resistencia está un 14.5% por encima y el soporte un 5.4% por debajo. Las medias solo han estado ordenadas de la misma manera durante 16 velas, con la de 20 por debajo de la de 50. El impulso está en un nivel medio, con un RSI de 49. El rango de 24 horas va de $0.3129 a $0.3197, y el precio está cerca del máximo. El volumen del último día es aproximadamente 2.6 veces el promedio reciente, así que hay una participación real detrás de este movimiento. Subió un 1.9% en 24 horas.
Investiga por tu cuenta
$TRX #Cripto
6
Inicia sesión para explorar más contenidos
Únete a usuarios globales de criptomonedas en Binance Square
⚡️ Obtén información útil y actualizada sobre criptos.
💬 Avalado por el mayor exchange de criptomonedas en el mundo.
👍 Descubre perspectivas reales de creadores verificados.
Email/número de teléfono
Temas populares
BinanceReopensWithdrawalsForMoreAssets
31,238 vistas
768 están debatiendo
Incidente de seguridad | Actualización de recuperación n.º 6: Se reanudan los retiros de más activos (2026-11-03)
Binance Announcement
·171 me gusta
·479k vistas
AppleReportsMixedResults
20,104 vistas
558 están debatiendo
BinanceHourlyDepositsExceedWithdrawals
6,176 vistas
220 están debatiendo