

cryptotradehead
7.4k Publicaciones

cryptotradehead
Denunciar
Bloquear usuario
backtesting, analyse, how to use AI for trading - can you be a good trader?
Abrir trade
Traders de alta frecuencia
4.8 año(s)
7 Siguiendo
2.6K+ Seguidores
5.0K+ Me gusta
Publicaciones
Cartera
Todo
Citas
Ver traducción
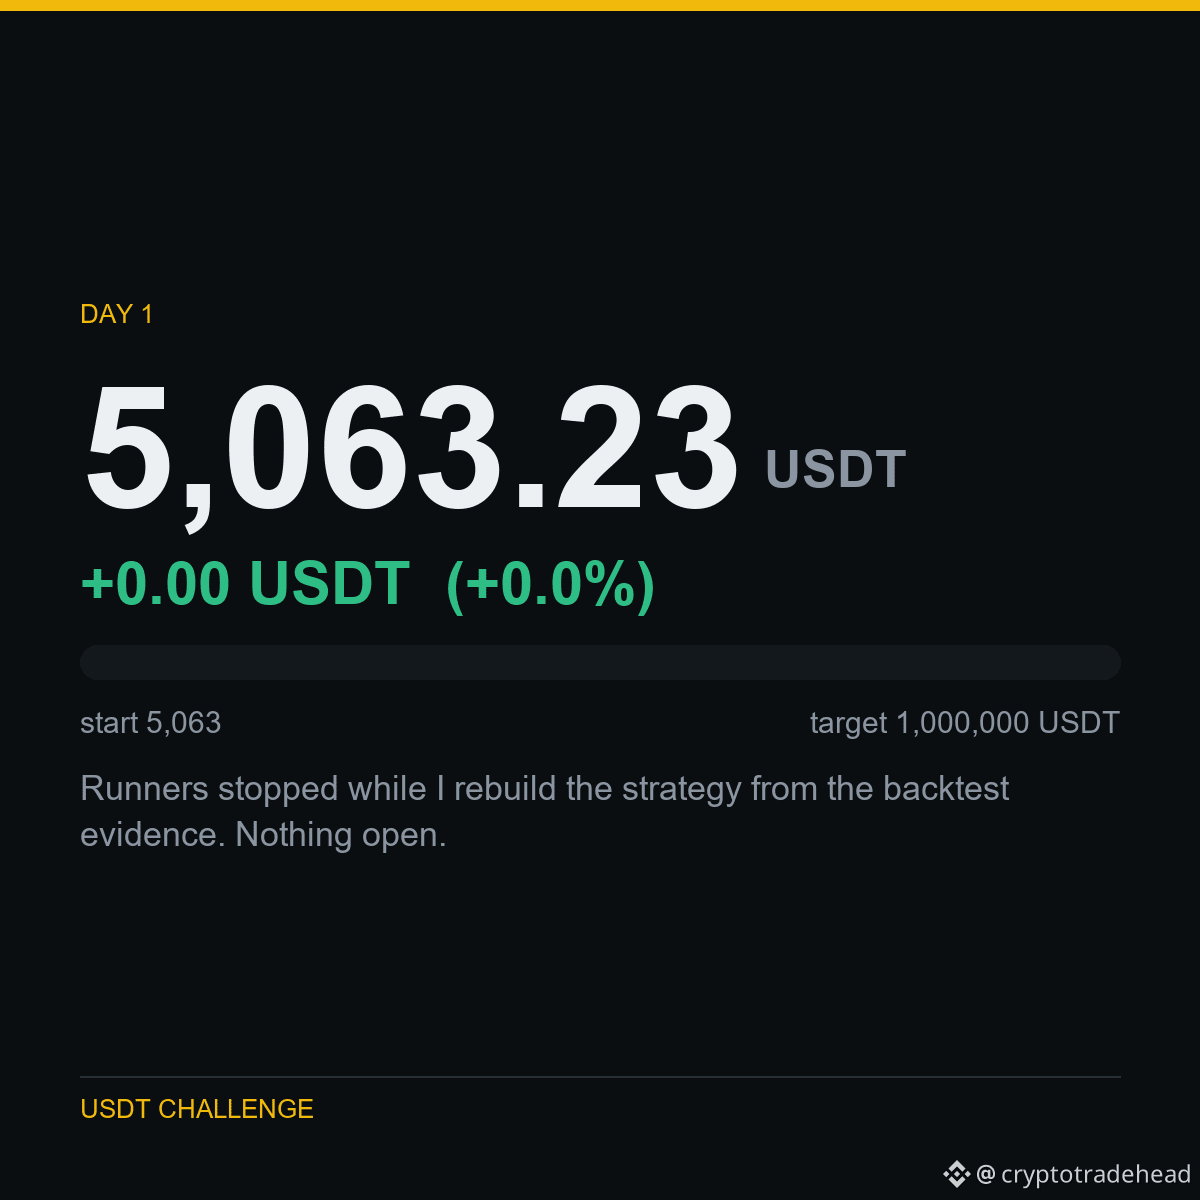
DAY 1 - 5,063 USDT to 1,000,000 USDT
Balance: 5,063.23 USDT
Change: +0.00 USDT (+0.0%)
Runners stopped while I rebuild the strategy from the backtest evidence. Nothing open.
Running on a Binance testnet account, so this is demo capital - I would rather say that than let you assume otherwise. The strategy, the costs and the losses are all real.
No signals for sale, no course, no affiliate link. Just the account and the data behind it.
Traded in this challenge: $BTC $SOL $AVAX
#Binance #USDT #Futures #TradingChallenge #Crypto
DAY 1 - 5,063 USDT to 1,000,000 USDT
Balance: 5,063.23 USDT
Change: +0.00 USDT (+0.0%)
Runners stopped while I rebuild the strategy from the backtest evidence. Nothing open.
Running on a Binance testnet account, so this is demo capital - I would rather say that than let you assume otherwise. The strategy, the costs and the losses are all real.
No signals for sale, no course, no affiliate link. Just the account and the data behind it.
Traded in this challenge: $BTC $SOL $AVAX
#Binance #USDT #Futures #TradingChallenge #Crypto
Balance: 5,063.23 USDT
Change: +0.00 USDT (+0.0%)
Runners stopped while I rebuild the strategy from the backtest evidence. Nothing open.
Running on a Binance testnet account, so this is demo capital - I would rather say that than let you assume otherwise. The strategy, the costs and the losses are all real.
No signals for sale, no course, no affiliate link. Just the account and the data behind it.
Traded in this challenge: $BTC $SOL $AVAX
#Binance #USDT #Futures #TradingChallenge #Crypto
3
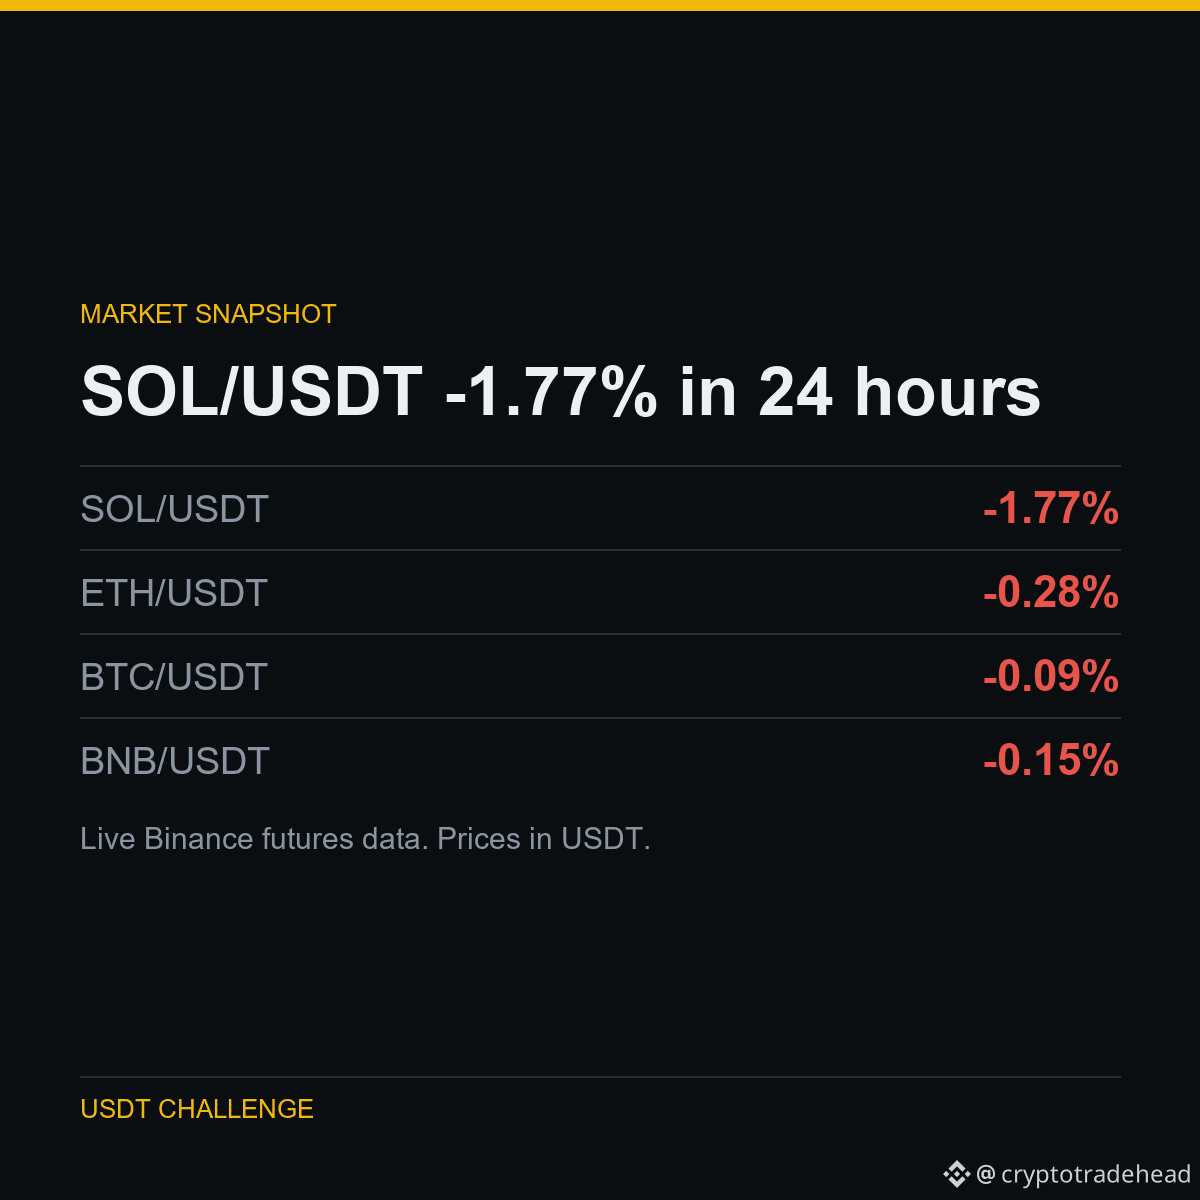
RESUMEN DE LAS ÚLTIMAS 24 HORAS
SOL/USDT: 119.55 USDT (-1.77%)
ETH/USDT: 2,694.64 USDT (-0.28%)
BTC/USDT: 85,250.10 USDT (-0.09%)
BNB/USDT: 787.84 USDT (-0.15%)
La tasa de financiación de SOL/USDT es de -0.0034% cada 8 h.
Contexto, no una recomendación: no publico entradas ni objetivos. Todas mis operaciones quedan registradas y se publican después, tanto las ganancias como las pérdidas.
Mencionado arriba: $SOL $ETH $BNB
#Binance #Crypto #Futures #BTC #Altcoins
RESUMEN DE LAS ÚLTIMAS 24 HORAS
SOL/USDT: 119.55 USDT (-1.77%)
ETH/USDT: 2,694.64 USDT (-0.28%)
BTC/USDT: 85,250.10 USDT (-0.09%)
BNB/USDT: 787.84 USDT (-0.15%)
La tasa de financiación de SOL/USDT es de -0.0034% cada 8 h.
Contexto, no una recomendación: no publico entradas ni objetivos. Todas mis operaciones quedan registradas y se publican después, tanto las ganancias como las pérdidas.
Mencionado arriba: $SOL $ETH $BNB
#Binance #Crypto #Futures #BTC #Altcoins
SOL/USDT: 119.55 USDT (-1.77%)
ETH/USDT: 2,694.64 USDT (-0.28%)
BTC/USDT: 85,250.10 USDT (-0.09%)
BNB/USDT: 787.84 USDT (-0.15%)
La tasa de financiación de SOL/USDT es de -0.0034% cada 8 h.
Contexto, no una recomendación: no publico entradas ni objetivos. Todas mis operaciones quedan registradas y se publican después, tanto las ganancias como las pérdidas.
Mencionado arriba: $SOL $ETH $BNB
#Binance #Crypto #Futures #BTC #Altcoins
1
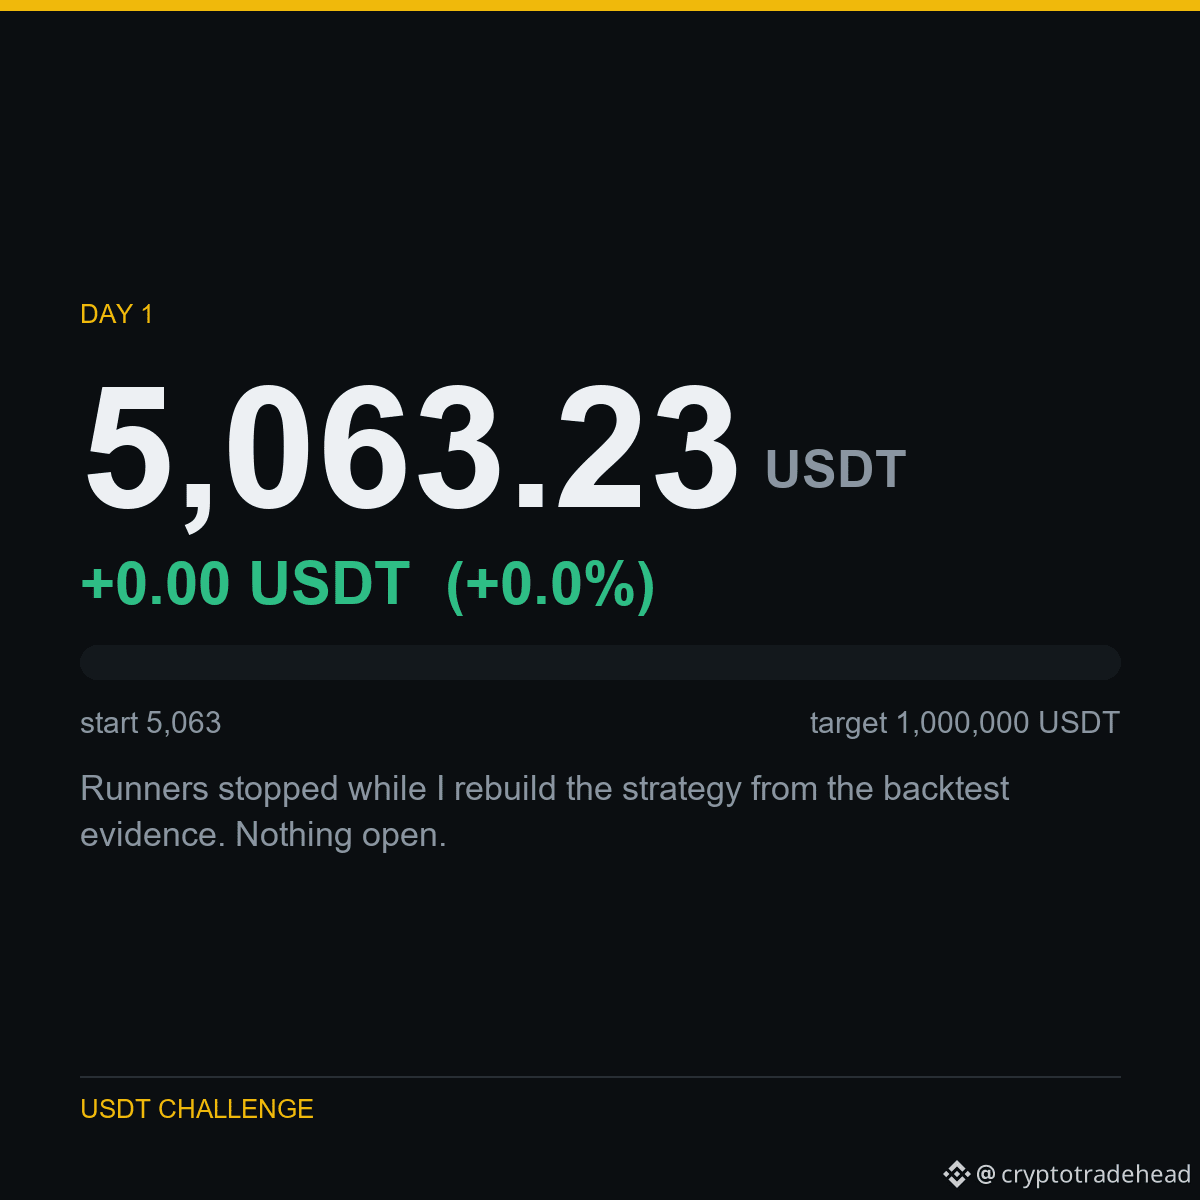
DÍA 1 - 5,063 USDT a 1,000,000 USDT
Saldo: 5,063.23 USDT
Cambio: +0.00 USDT (+0.0%)
He detenido los bots mientras reconstruyo la estrategia a partir de los resultados de las pruebas retrospectivas. No hay nada abierto.
Estoy operando con una cuenta de prueba de Binance, así que este es capital simulado; prefiero decirlo para que no des por sentado lo contrario. La estrategia, los costos y las pérdidas son reales.
No vendo señales, no ofrezco cursos ni tengo enlaces de afiliados. Solo la cuenta y los datos que la respaldan.
Operado en este desafío: $BTC $SOL $AVAX
#Binance #USDT #Futures #TradingChallenge #Crypto
DÍA 1 - 5,063 USDT a 1,000,000 USDT
Saldo: 5,063.23 USDT
Cambio: +0.00 USDT (+0.0%)
He detenido los bots mientras reconstruyo la estrategia a partir de los resultados de las pruebas retrospectivas. No hay nada abierto.
Estoy operando con una cuenta de prueba de Binance, así que este es capital simulado; prefiero decirlo para que no des por sentado lo contrario. La estrategia, los costos y las pérdidas son reales.
No vendo señales, no ofrezco cursos ni tengo enlaces de afiliados. Solo la cuenta y los datos que la respaldan.
Operado en este desafío: $BTC $SOL $AVAX
#Binance #USDT #Futures #TradingChallenge #Crypto
Saldo: 5,063.23 USDT
Cambio: +0.00 USDT (+0.0%)
He detenido los bots mientras reconstruyo la estrategia a partir de los resultados de las pruebas retrospectivas. No hay nada abierto.
Estoy operando con una cuenta de prueba de Binance, así que este es capital simulado; prefiero decirlo para que no des por sentado lo contrario. La estrategia, los costos y las pérdidas son reales.
No vendo señales, no ofrezco cursos ni tengo enlaces de afiliados. Solo la cuenta y los datos que la respaldan.
Operado en este desafío: $BTC $SOL $AVAX
#Binance #USDT #Futures #TradingChallenge #Crypto
11
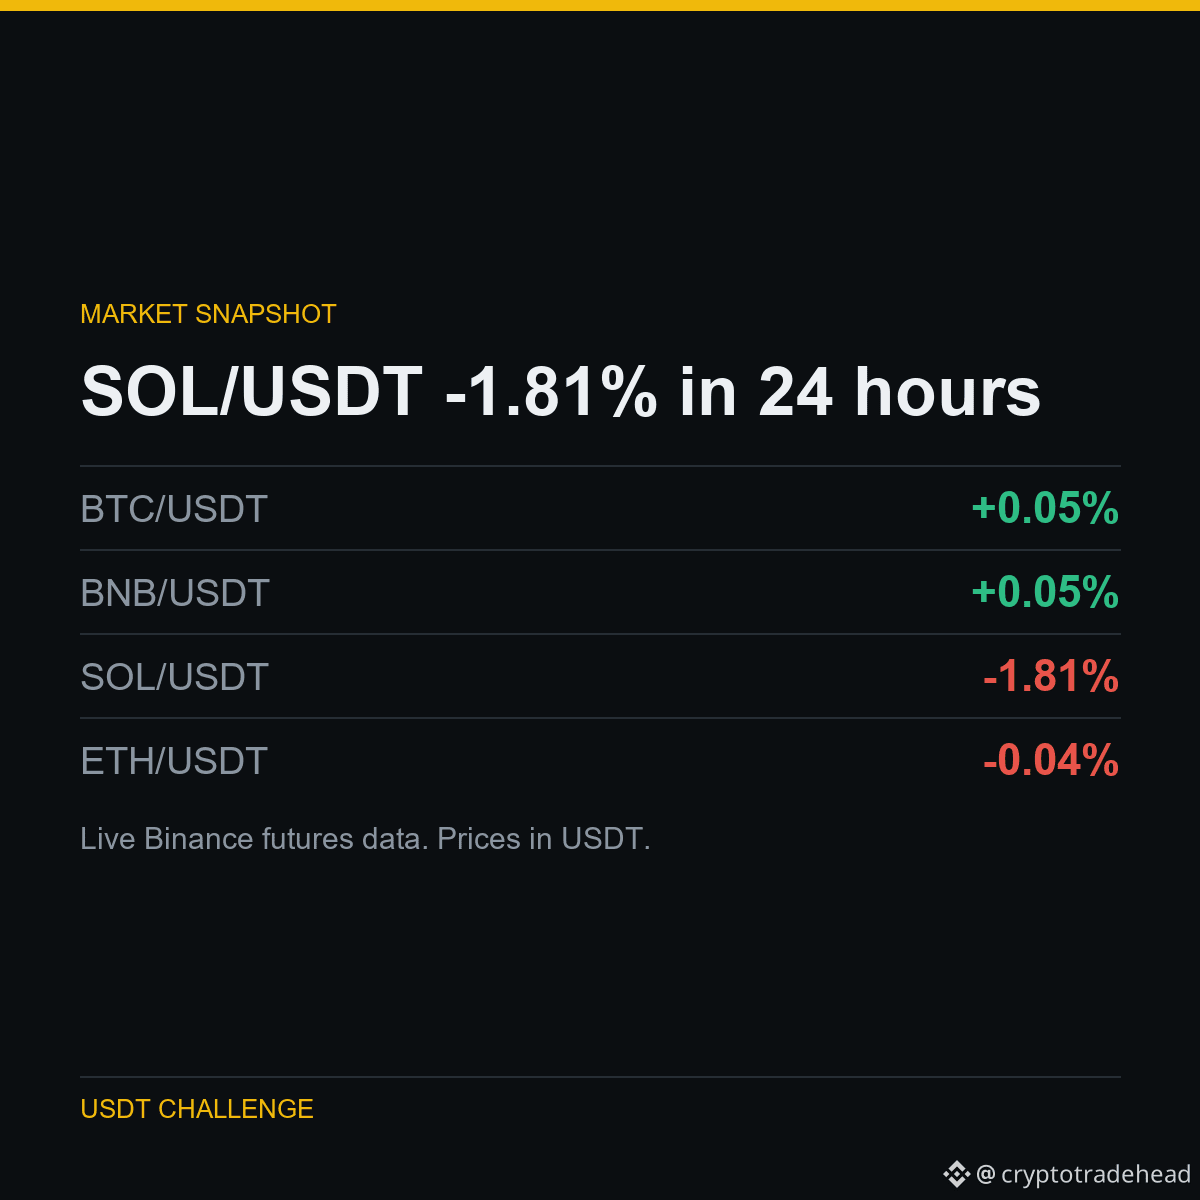
RESUMEN DE LAS ÚLTIMAS 24 HORAS
BTC/USDT: 85,248.60 USDT (+0.05%)
BNB/USDT: 787.91 USDT (+0.05%)
SOL/USDT: 119.33 USDT (-1.81%)
ETH/USDT: 2,696.22 USDT (-0.04%)
La tasa de financiación de SOL/USDT es de -0.0017% cada 8 h.
Contexto, no una recomendación: no publico entradas ni objetivos. Todas mis operaciones quedan registradas y se publican después, tanto las ganancias como las pérdidas.
Incluido arriba: $SOL $BTC $BNB
#Binance #Crypto #Futures #BTC #Altcoins
RESUMEN DE LAS ÚLTIMAS 24 HORAS
BTC/USDT: 85,248.60 USDT (+0.05%)
BNB/USDT: 787.91 USDT (+0.05%)
SOL/USDT: 119.33 USDT (-1.81%)
ETH/USDT: 2,696.22 USDT (-0.04%)
La tasa de financiación de SOL/USDT es de -0.0017% cada 8 h.
Contexto, no una recomendación: no publico entradas ni objetivos. Todas mis operaciones quedan registradas y se publican después, tanto las ganancias como las pérdidas.
Incluido arriba: $SOL $BTC $BNB
#Binance #Crypto #Futures #BTC #Altcoins
BTC/USDT: 85,248.60 USDT (+0.05%)
BNB/USDT: 787.91 USDT (+0.05%)
SOL/USDT: 119.33 USDT (-1.81%)
ETH/USDT: 2,696.22 USDT (-0.04%)
La tasa de financiación de SOL/USDT es de -0.0017% cada 8 h.
Contexto, no una recomendación: no publico entradas ni objetivos. Todas mis operaciones quedan registradas y se publican después, tanto las ganancias como las pérdidas.
Incluido arriba: $SOL $BTC $BNB
#Binance #Crypto #Futures #BTC #Altcoins
11
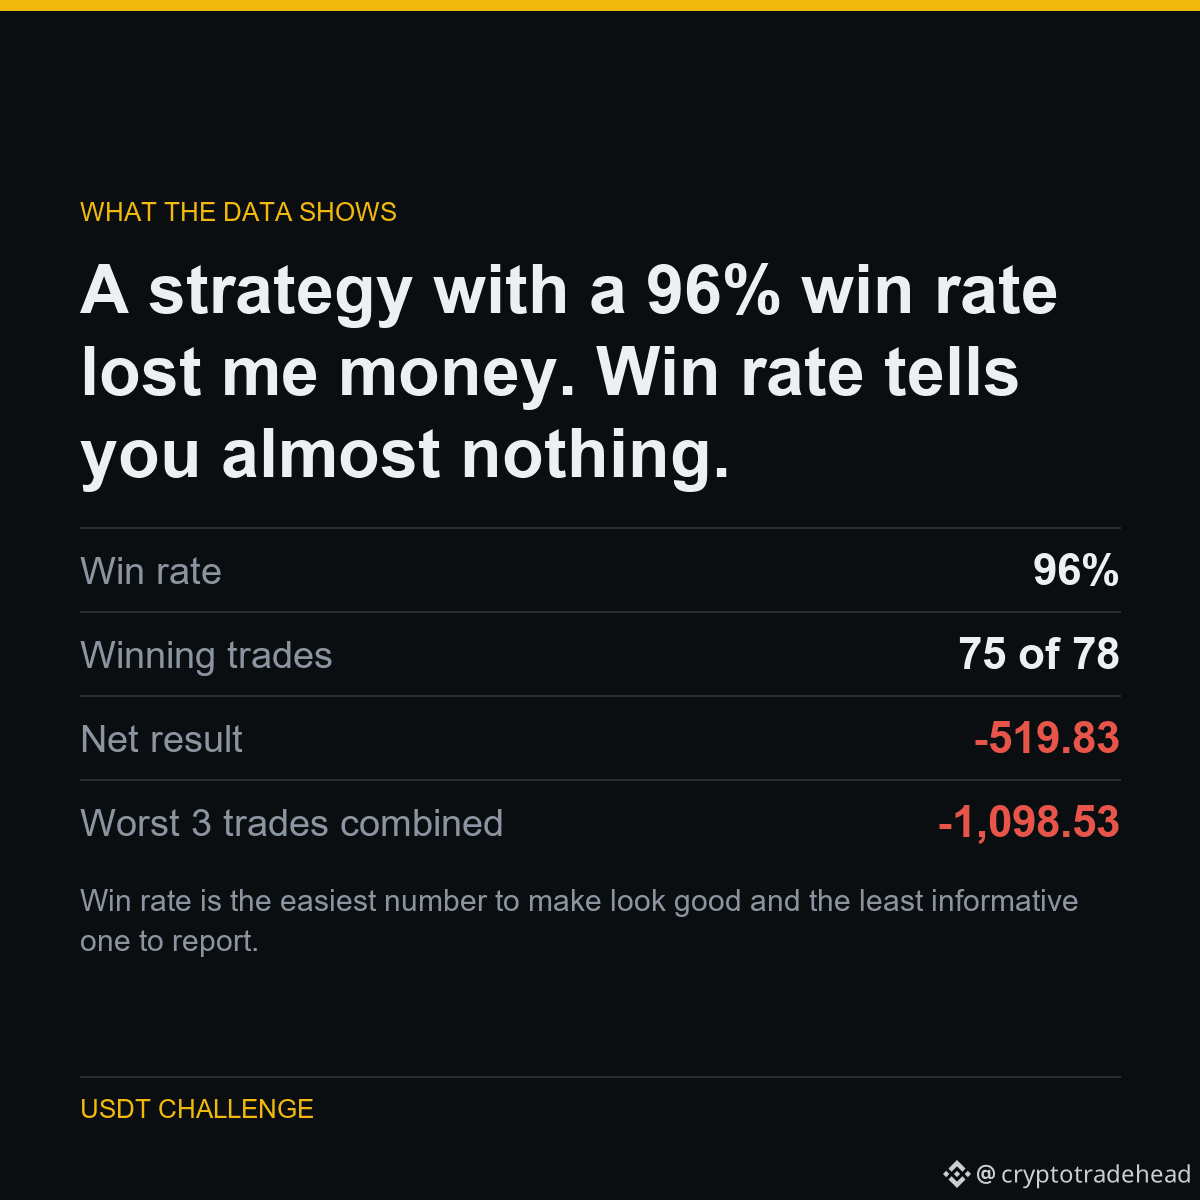
La tasa de aciertos es la cifra más fácil de hacer parecer buena y la menos informativa que se puede mostrar. Cualquiera que te enseñe una tasa de aciertos sin el tamaño de las pérdidas te está mostrando solo la parte de la historia que le favorece.
Esto es lo que hay detrás.
Una estrategia con una tasa de aciertos del 96 % me hizo perder dinero. La tasa de aciertos casi no te dice nada.
Hice una prueba retrospectiva de un sistema martingala: añadir a las posiciones perdedoras y cerrar cuando se recuperan. 75 de 78 operaciones fueron ganadoras.
Aun así, perdí 519.83 USDT, porque las tres operaciones perdedoras devolvieron más de lo que sumaron las 75 ganadoras.
El margen máximo de esas operaciones llegó a ser 4 veces el saldo total de la cuenta.
Parte de un experimento público: de 5,063 USDT a 1,000,000 USDT, con todos los resultados publicados, incluidos los que me dejan mal.
Ejecutado en $BNB
#Binance #Futures #Backtesting #TradingBot #CryptoData
La tasa de aciertos es la cifra más fácil de hacer parecer buena y la menos informativa que se puede mostrar. Cualquiera que te enseñe una tasa de aciertos sin el tamaño de las pérdidas te está mostrando solo la parte de la historia que le favorece.
Esto es lo que hay detrás.
Una estrategia con una tasa de aciertos del 96 % me hizo perder dinero. La tasa de aciertos casi no te dice nada.
Hice una prueba retrospectiva de un sistema martingala: añadir a las posiciones perdedoras y cerrar cuando se recuperan. 75 de 78 operaciones fueron ganadoras.
Aun así, perdí 519.83 USDT, porque las tres operaciones perdedoras devolvieron más de lo que sumaron las 75 ganadoras.
El margen máximo de esas operaciones llegó a ser 4 veces el saldo total de la cuenta.
Parte de un experimento público: de 5,063 USDT a 1,000,000 USDT, con todos los resultados publicados, incluidos los que me dejan mal.
Ejecutado en $BNB
#Binance #Futures #Backtesting #TradingBot #CryptoData
Esto es lo que hay detrás.
Una estrategia con una tasa de aciertos del 96 % me hizo perder dinero. La tasa de aciertos casi no te dice nada.
Hice una prueba retrospectiva de un sistema martingala: añadir a las posiciones perdedoras y cerrar cuando se recuperan. 75 de 78 operaciones fueron ganadoras.
Aun así, perdí 519.83 USDT, porque las tres operaciones perdedoras devolvieron más de lo que sumaron las 75 ganadoras.
El margen máximo de esas operaciones llegó a ser 4 veces el saldo total de la cuenta.
Parte de un experimento público: de 5,063 USDT a 1,000,000 USDT, con todos los resultados publicados, incluidos los que me dejan mal.
Ejecutado en $BNB
#Binance #Futures #Backtesting #TradingBot #CryptoData
8
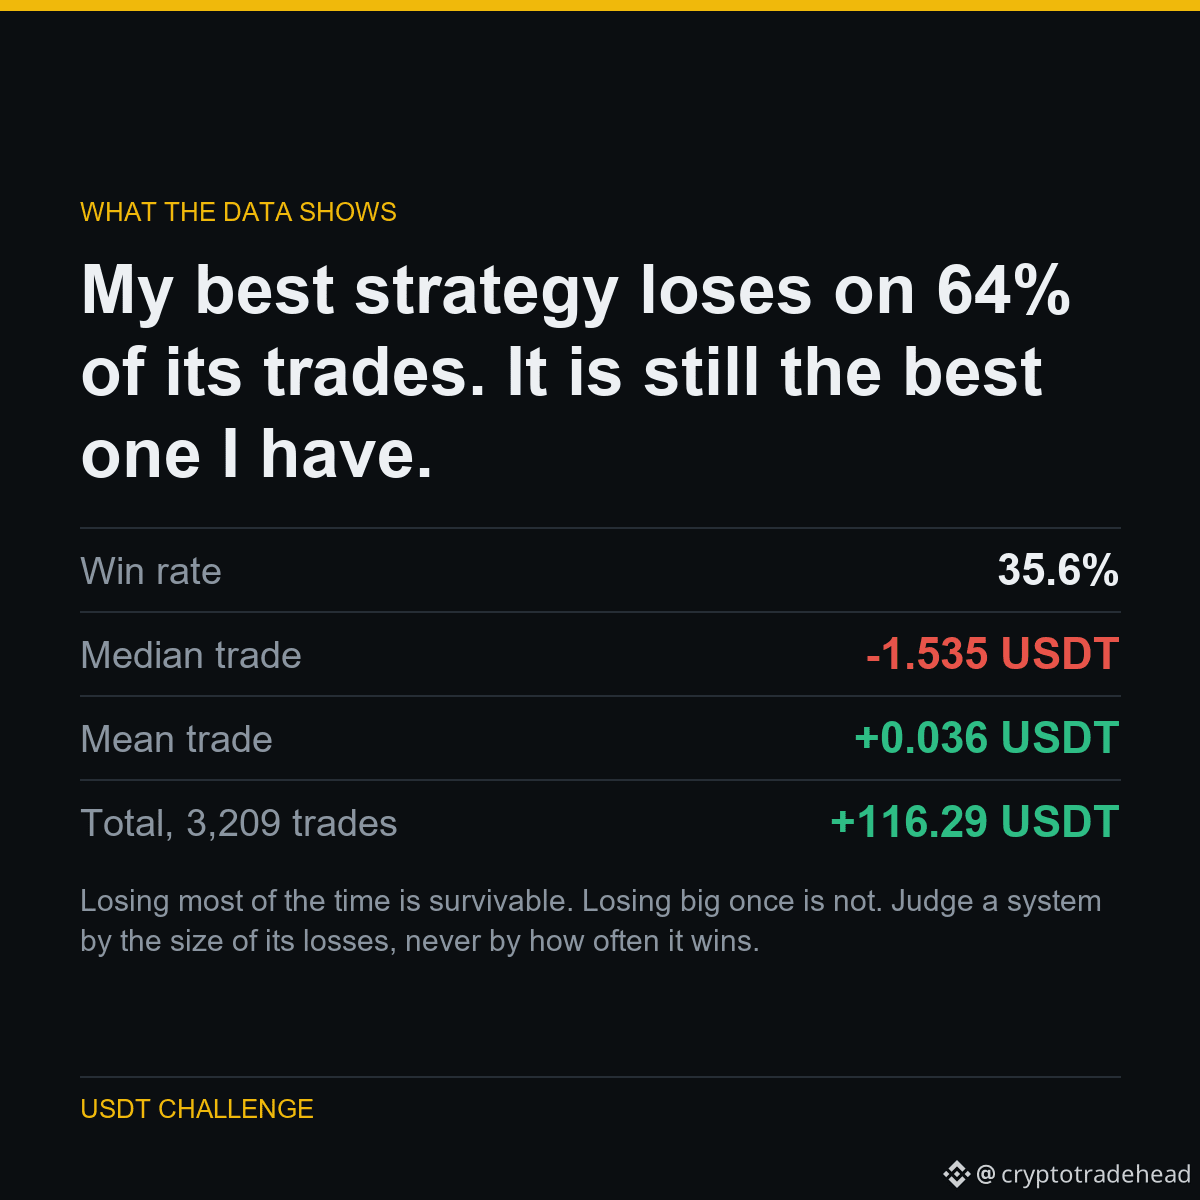
Perder la mayoría de las veces es soportable. Perder mucho una sola vez, no. Juzga un sistema por el tamaño de sus pérdidas, nunca por la frecuencia con la que gana.
Esto es lo que hay detrás.
Mi mejor estrategia pierde en el 64 % de sus operaciones. Aun así, es la mejor que tengo.
La operación típica de este sistema pierde 1.535 USDT. Casi dos de cada tres operaciones son perdedoras.
Aun así, es rentable porque las ganancias son mucho mayores que las pérdidas. La operación media arroja un resultado positivo, mientras que la mediana es claramente negativa.
También tiene un perfil opuesto al de la estrategia martingala que probé, que ganaba el 96 % de las veces y aun así perdió 519.83 USDT.
Parte de un experimento público: de 5,063 USDT a 1,000,000 USDT, con todos los resultados publicados, incluidos los que me dejan mal parado.
Ejecutado en $BTC $XRP $LTC
#Binance #Futures #Backtesting #TradingBot #CryptoData
Perder la mayoría de las veces es soportable. Perder mucho una sola vez, no. Juzga un sistema por el tamaño de sus pérdidas, nunca por la frecuencia con la que gana.
Esto es lo que hay detrás.
Mi mejor estrategia pierde en el 64 % de sus operaciones. Aun así, es la mejor que tengo.
La operación típica de este sistema pierde 1.535 USDT. Casi dos de cada tres operaciones son perdedoras.
Aun así, es rentable porque las ganancias son mucho mayores que las pérdidas. La operación media arroja un resultado positivo, mientras que la mediana es claramente negativa.
También tiene un perfil opuesto al de la estrategia martingala que probé, que ganaba el 96 % de las veces y aun así perdió 519.83 USDT.
Parte de un experimento público: de 5,063 USDT a 1,000,000 USDT, con todos los resultados publicados, incluidos los que me dejan mal parado.
Ejecutado en $BTC $XRP $LTC
#Binance #Futures #Backtesting #TradingBot #CryptoData
Esto es lo que hay detrás.
Mi mejor estrategia pierde en el 64 % de sus operaciones. Aun así, es la mejor que tengo.
La operación típica de este sistema pierde 1.535 USDT. Casi dos de cada tres operaciones son perdedoras.
Aun así, es rentable porque las ganancias son mucho mayores que las pérdidas. La operación media arroja un resultado positivo, mientras que la mediana es claramente negativa.
También tiene un perfil opuesto al de la estrategia martingala que probé, que ganaba el 96 % de las veces y aun así perdió 519.83 USDT.
Parte de un experimento público: de 5,063 USDT a 1,000,000 USDT, con todos los resultados publicados, incluidos los que me dejan mal parado.
Ejecutado en $BTC $XRP $LTC
#Binance #Futures #Backtesting #TradingBot #CryptoData
7
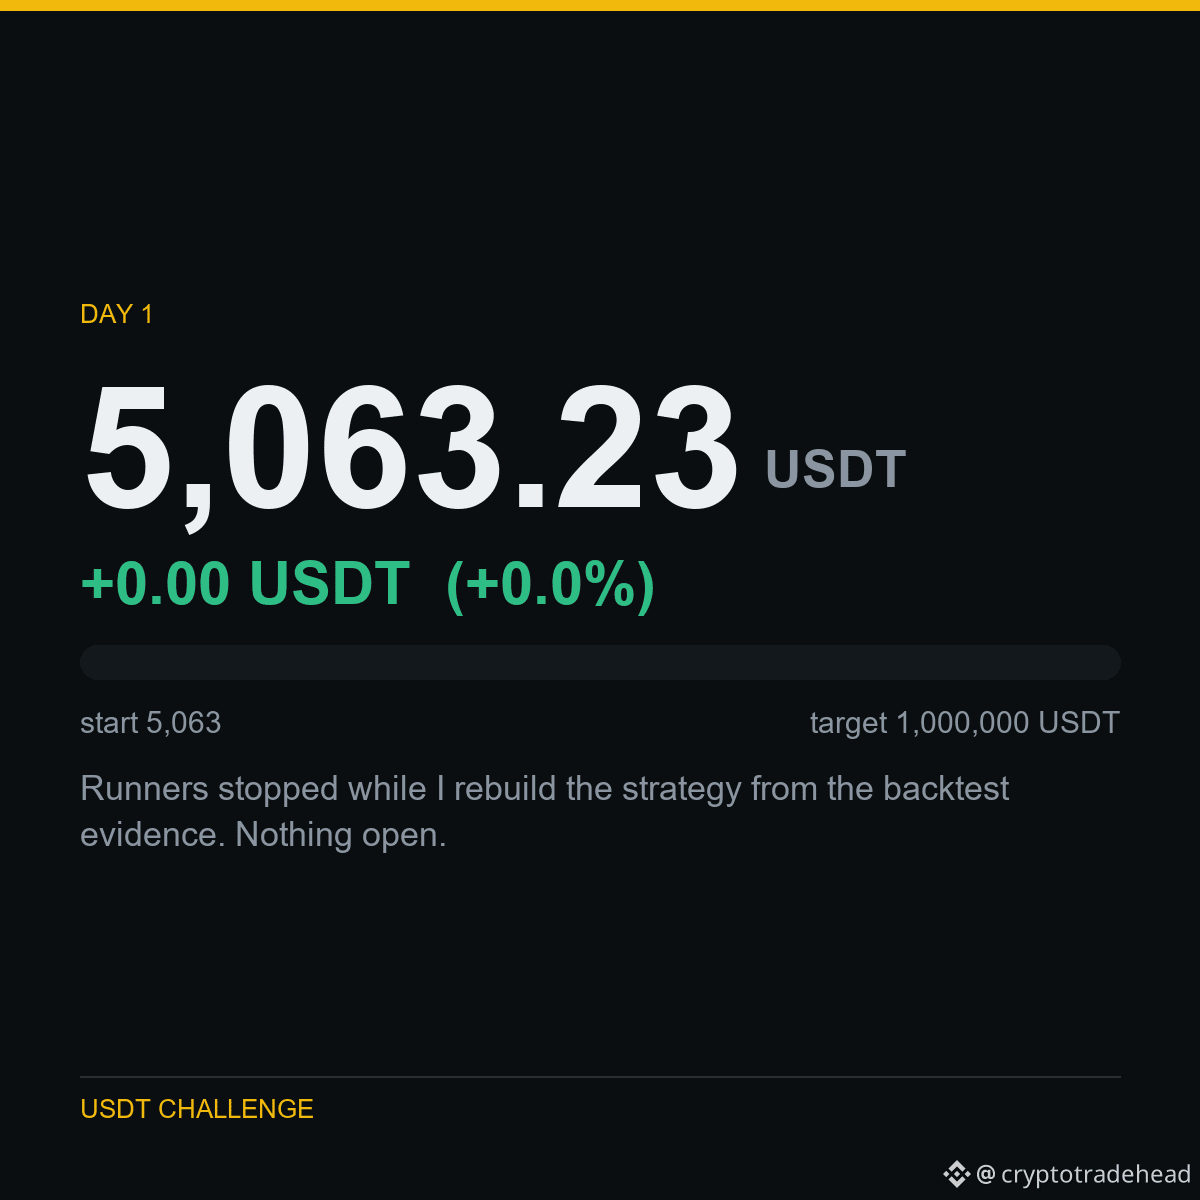
DÍA 1 - De 5,063 USDT a 1,000,000 USDT
Saldo: 5,063.23 USDT
Variación: +0.00 USDT (+0.0%)
Detuve los bots mientras reconstruyo la estrategia basándome en los datos del backtest. No hay nada abierto.
Estoy operando en una cuenta de prueba de Binance, así que este es capital de demostración; prefiero decirlo antes que dejar que supongas lo contrario. La estrategia, los costos y las pérdidas son reales.
No vendo señales, no hay cursos ni enlaces de afiliados. Solo la cuenta y los datos que la respaldan.
Operado en este desafío: $BTC $SOL $AVAX
#Binance #USDT #Futures #TradingChallenge #Crypto
DÍA 1 - De 5,063 USDT a 1,000,000 USDT
Saldo: 5,063.23 USDT
Variación: +0.00 USDT (+0.0%)
Detuve los bots mientras reconstruyo la estrategia basándome en los datos del backtest. No hay nada abierto.
Estoy operando en una cuenta de prueba de Binance, así que este es capital de demostración; prefiero decirlo antes que dejar que supongas lo contrario. La estrategia, los costos y las pérdidas son reales.
No vendo señales, no hay cursos ni enlaces de afiliados. Solo la cuenta y los datos que la respaldan.
Operado en este desafío: $BTC $SOL $AVAX
#Binance #USDT #Futures #TradingChallenge #Crypto
Saldo: 5,063.23 USDT
Variación: +0.00 USDT (+0.0%)
Detuve los bots mientras reconstruyo la estrategia basándome en los datos del backtest. No hay nada abierto.
Estoy operando en una cuenta de prueba de Binance, así que este es capital de demostración; prefiero decirlo antes que dejar que supongas lo contrario. La estrategia, los costos y las pérdidas son reales.
No vendo señales, no hay cursos ni enlaces de afiliados. Solo la cuenta y los datos que la respaldan.
Operado en este desafío: $BTC $SOL $AVAX
#Binance #USDT #Futures #TradingChallenge #Crypto
12
Artículo
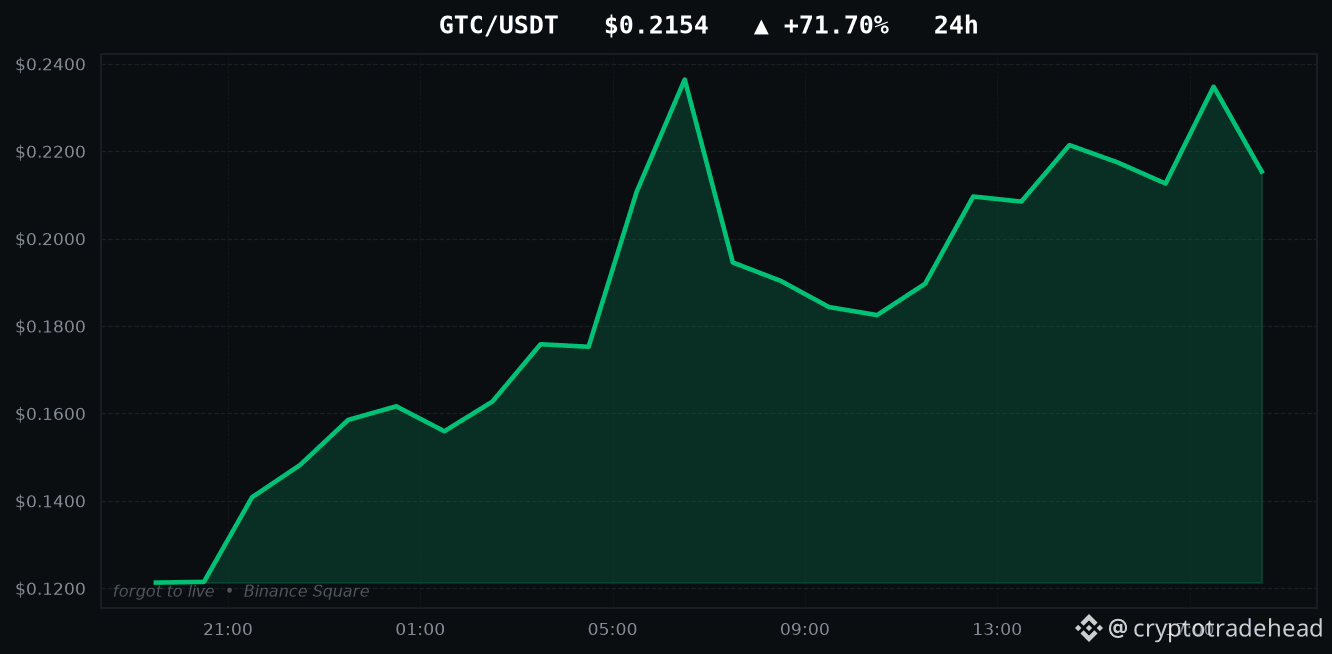
GTC sube un +71.70%: probé las dos formas de operar este movimientoLAS MAYORES SUBIDAS DE HOY
GTC: +71.70%
RLC: +56.19%
RVN: +19.46%
SCR: +12.48%
PARTI: +12.00%
Todas las cuentas de esta aplicación te mostrarán esta lista. Aquí tienes la parte que omiten.
Probé con datos históricos las dos formas de operar un movimiento como el +71.70% de GTC: comprar la ruptura y apostar en su contra suponiendo que el precio retrocede. Ambas dieron pérdidas. Y no por poco: perdieron aproximadamente lo mismo que el coste de transacción, un 0.240% por operación de ida y vuelta, que es lo que parece una señal sin información una vez que se le aplican comisiones.
Un gran movimiento en 24 horas te dice que algo ya ha sucedido. No te dice qué pasará después, y los datos lo confirman en ambos sentidos.
GTC sube un +71.70%: probé las dos formas de operar este movimiento
LAS MAYORES SUBIDAS DE HOY
GTC: +71.70%
RLC: +56.19%
RVN: +19.46%
SCR: +12.48%
PARTI: +12.00%
Todas las cuentas de esta aplicación te mostrarán esta lista. Aquí tienes la parte que omiten.
Probé con datos históricos las dos formas de operar un movimiento como el +71.70% de GTC: comprar la ruptura y apostar en su contra suponiendo que el precio retrocede. Ambas dieron pérdidas. Y no por poco: perdieron aproximadamente lo mismo que el coste de transacción, un 0.240% por operación de ida y vuelta, que es lo que parece una señal sin información una vez que se le aplican comisiones.
Un gran movimiento en 24 horas te dice que algo ya ha sucedido. No te dice qué pasará después, y los datos lo confirman en ambos sentidos.
GTC: +71.70%
RLC: +56.19%
RVN: +19.46%
SCR: +12.48%
PARTI: +12.00%
Todas las cuentas de esta aplicación te mostrarán esta lista. Aquí tienes la parte que omiten.
Probé con datos históricos las dos formas de operar un movimiento como el +71.70% de GTC: comprar la ruptura y apostar en su contra suponiendo que el precio retrocede. Ambas dieron pérdidas. Y no por poco: perdieron aproximadamente lo mismo que el coste de transacción, un 0.240% por operación de ida y vuelta, que es lo que parece una señal sin información una vez que se le aplican comisiones.
Un gran movimiento en 24 horas te dice que algo ya ha sucedido. No te dice qué pasará después, y los datos lo confirman en ambos sentidos.
3
CÓMO LO PROBÉ
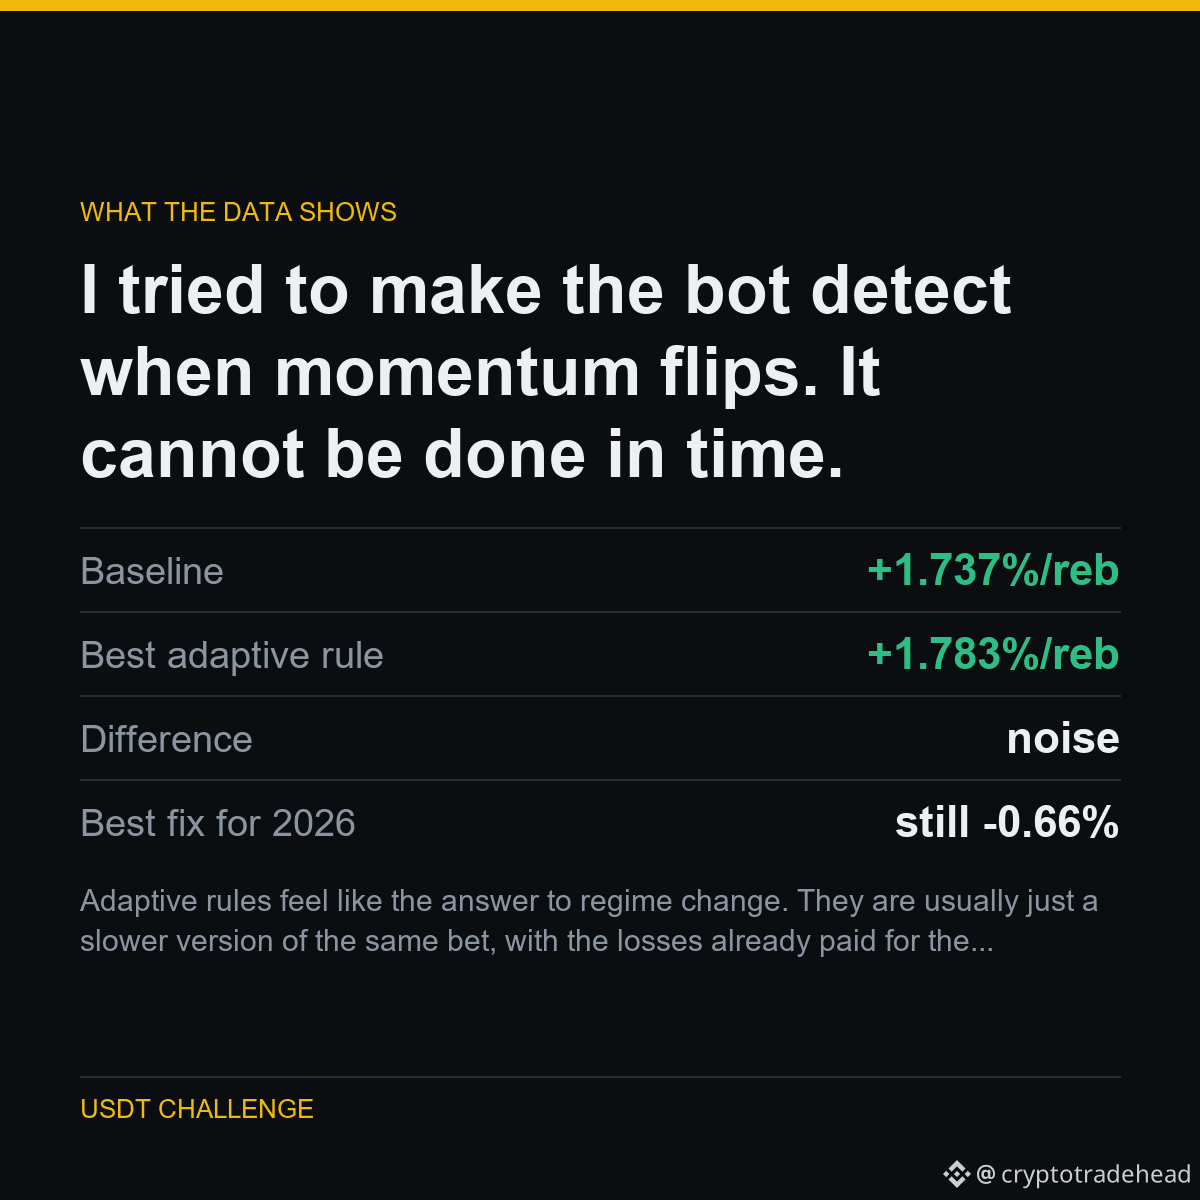
El impulso se invirtió en 2026. La solución obvia: observar el rendimiento reciente y cambiar a la regla opuesta cuando el impulso deja de dar resultados.
Lo probé con seis períodos retrospectivos diferentes. El mejor obtuvo un +1.783% por rebalanceo, frente a una referencia de +1.737%: una diferencia indistinguible del ruido. Todos los demás períodos dieron peores resultados. Ninguno corrigió el problema de 2026.
La razón es sencilla: para cuando el rendimiento pasado te indica que el régimen ha cambiado, ya has sufrido las pérdidas que te lo indicaron.
LAS CIFRAS
Referencia: +1.737%/reb
Mejor regla adaptativa: +1.783%/reb
Diferencia: ruido
Mejor solución para 2026: sigue siendo -0.66%
Las reglas adaptativas parecen ser la respuesta a los cambios de régimen. Por lo general, solo son una versión más lenta de la misma apuesta, con las pérdidas ya asumidas para obtener la señal.
Parte de un experimento público: de 5,063 USDT a 1,000,000 USDT; publico todos los resultados, incluso los que me dejan mal.
Ejecutado en $SOL $BTC
#Binance #Futures #Backtesting #TradingBot #CryptoData
CÓMO LO PROBÉ
El impulso se invirtió en 2026. La solución obvia: observar el rendimiento reciente y cambiar a la regla opuesta cuando el impulso deja de dar resultados.
Lo probé con seis períodos retrospectivos diferentes. El mejor obtuvo un +1.783% por rebalanceo, frente a una referencia de +1.737%: una diferencia indistinguible del ruido. Todos los demás períodos dieron peores resultados. Ninguno corrigió el problema de 2026.
La razón es sencilla: para cuando el rendimiento pasado te indica que el régimen ha cambiado, ya has sufrido las pérdidas que te lo indicaron.
LAS CIFRAS
Referencia: +1.737%/reb
Mejor regla adaptativa: +1.783%/reb
Diferencia: ruido
Mejor solución para 2026: sigue siendo -0.66%
Las reglas adaptativas parecen ser la respuesta a los cambios de régimen. Por lo general, solo son una versión más lenta de la misma apuesta, con las pérdidas ya asumidas para obtener la señal.
Parte de un experimento público: de 5,063 USDT a 1,000,000 USDT; publico todos los resultados, incluso los que me dejan mal.
Ejecutado en $SOL $BTC
#Binance #Futures #Backtesting #TradingBot #CryptoData
El impulso se invirtió en 2026. La solución obvia: observar el rendimiento reciente y cambiar a la regla opuesta cuando el impulso deja de dar resultados.
Lo probé con seis períodos retrospectivos diferentes. El mejor obtuvo un +1.783% por rebalanceo, frente a una referencia de +1.737%: una diferencia indistinguible del ruido. Todos los demás períodos dieron peores resultados. Ninguno corrigió el problema de 2026.
La razón es sencilla: para cuando el rendimiento pasado te indica que el régimen ha cambiado, ya has sufrido las pérdidas que te lo indicaron.
LAS CIFRAS
Referencia: +1.737%/reb
Mejor regla adaptativa: +1.783%/reb
Diferencia: ruido
Mejor solución para 2026: sigue siendo -0.66%
Las reglas adaptativas parecen ser la respuesta a los cambios de régimen. Por lo general, solo son una versión más lenta de la misma apuesta, con las pérdidas ya asumidas para obtener la señal.
Parte de un experimento público: de 5,063 USDT a 1,000,000 USDT; publico todos los resultados, incluso los que me dejan mal.
Ejecutado en $SOL $BTC
#Binance #Futures #Backtesting #TradingBot #CryptoData
5
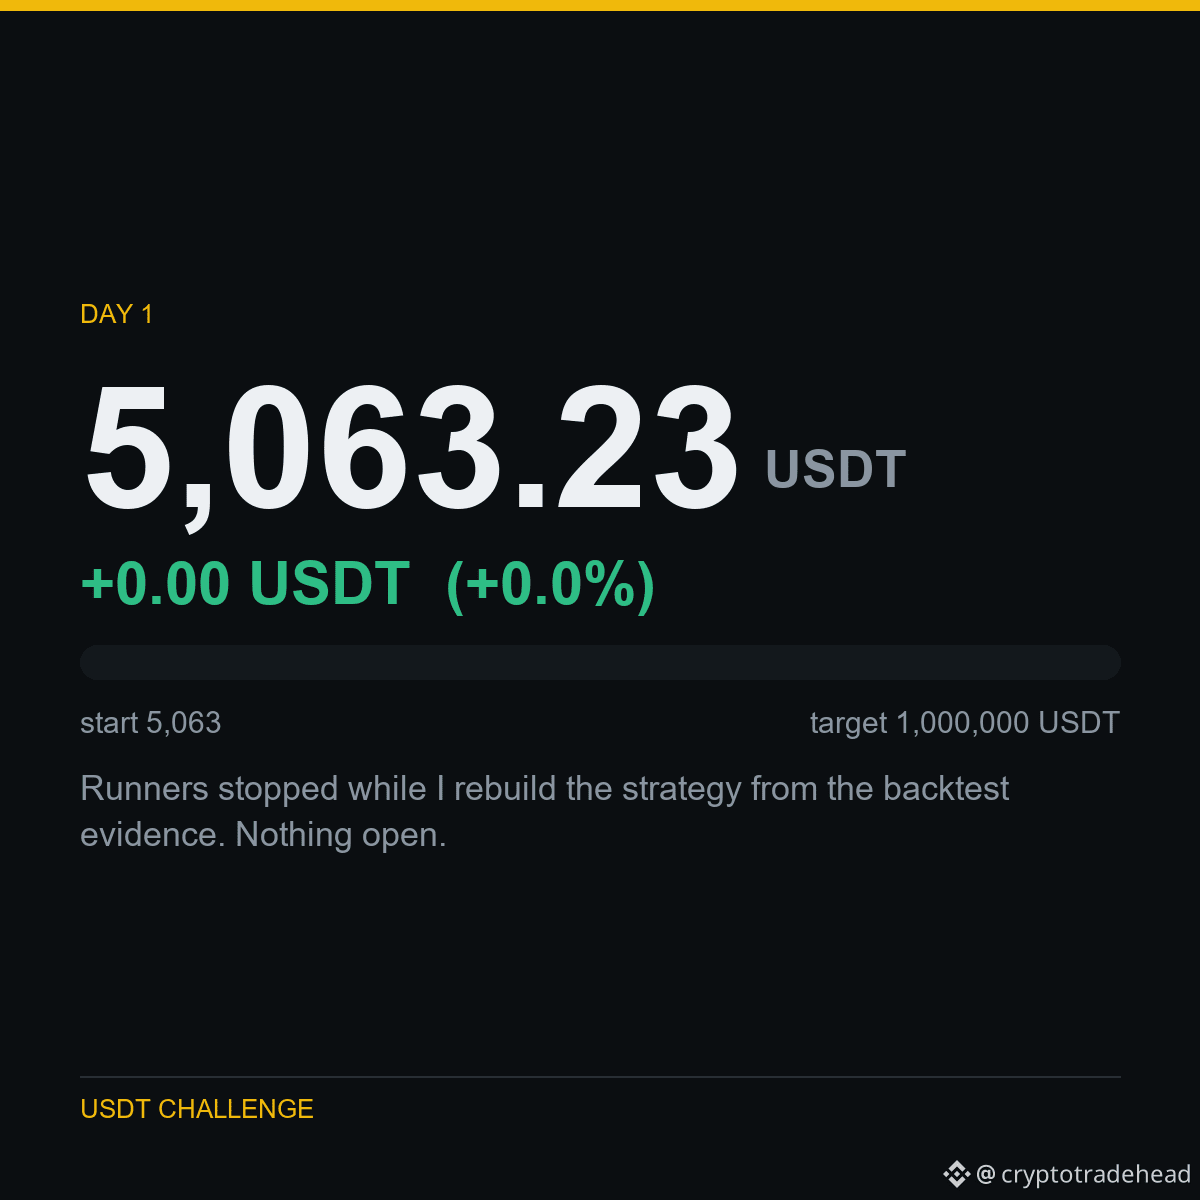
DÍA 1 - 5,063 USDT a 1,000,000 USDT
Saldo: 5,063.23 USDT
Cambio: +0.00 USDT (+0.0%)
Los bots están detenidos mientras reconstruyo la estrategia a partir de los datos del backtest. No hay nada abierto.
Opero en una cuenta de la red de pruebas de Binance, así que este es capital de demostración; prefiero decirlo para que no des por sentado lo contrario. La estrategia, los costos y las pérdidas son reales.
No vendo señales ni cursos, y no tengo enlaces de afiliados. Solo la cuenta y los datos que la respaldan.
Operado en este desafío: $BTC $SOL $AVAX
#Binance #USDT #Futures #TradingChallenge #Crypto
DÍA 1 - 5,063 USDT a 1,000,000 USDT
Saldo: 5,063.23 USDT
Cambio: +0.00 USDT (+0.0%)
Los bots están detenidos mientras reconstruyo la estrategia a partir de los datos del backtest. No hay nada abierto.
Opero en una cuenta de la red de pruebas de Binance, así que este es capital de demostración; prefiero decirlo para que no des por sentado lo contrario. La estrategia, los costos y las pérdidas son reales.
No vendo señales ni cursos, y no tengo enlaces de afiliados. Solo la cuenta y los datos que la respaldan.
Operado en este desafío: $BTC $SOL $AVAX
#Binance #USDT #Futures #TradingChallenge #Crypto
Saldo: 5,063.23 USDT
Cambio: +0.00 USDT (+0.0%)
Los bots están detenidos mientras reconstruyo la estrategia a partir de los datos del backtest. No hay nada abierto.
Opero en una cuenta de la red de pruebas de Binance, así que este es capital de demostración; prefiero decirlo para que no des por sentado lo contrario. La estrategia, los costos y las pérdidas son reales.
No vendo señales ni cursos, y no tengo enlaces de afiliados. Solo la cuenta y los datos que la respaldan.
Operado en este desafío: $BTC $SOL $AVAX
#Binance #USDT #Futures #TradingChallenge #Crypto
6
Artículo
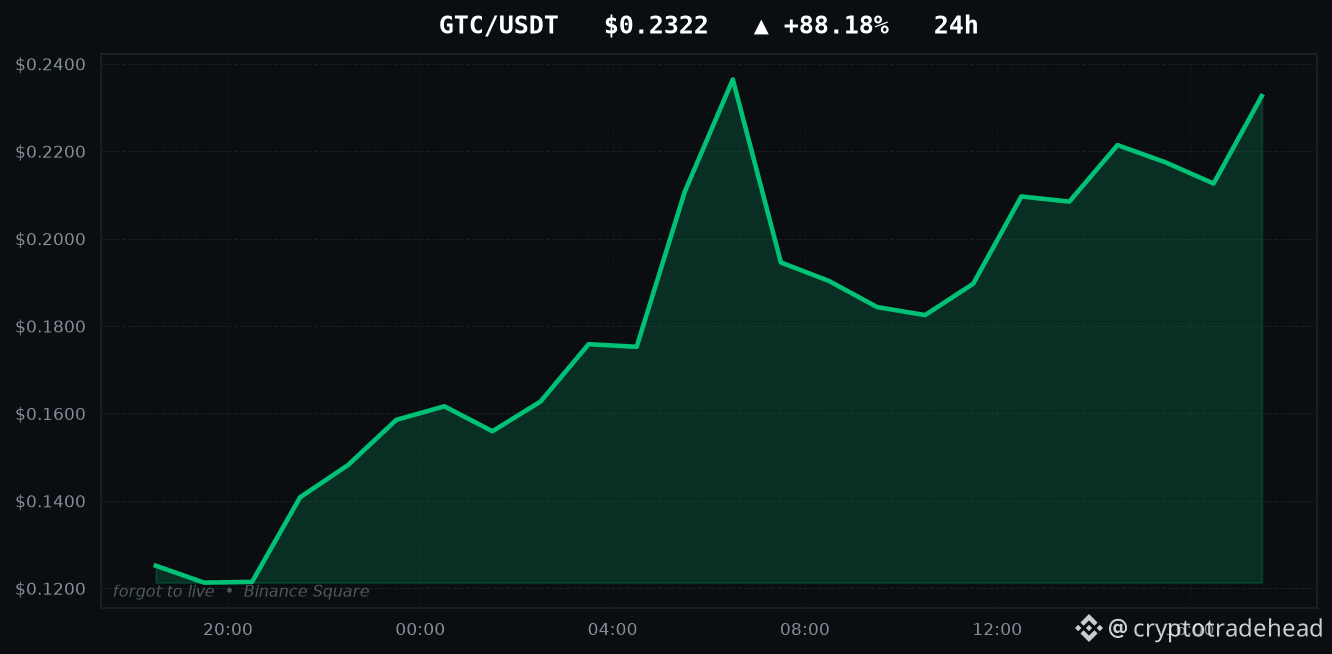
GTC sube un +88.18%: probé las dos formas de operarMAYORES SUBIDAS DE HOY
GTC: +88.18%
RLC: +55.00%
SCR: +17.57%
UMA: +16.09%
EDU: +11.88%
Todas las cuentas de esta app te mostrarán esta lista. Esta es la parte que omiten.
Probé con datos históricos ambas formas de operar un movimiento como el +88.18% de GTC: comprar la ruptura y apostar en contra suponiendo que el precio vuelve a su nivel anterior. Ambas dieron pérdidas. No por poco: perdieron aproximadamente lo que cuesta la transacción, un 0.240% por operación de ida y vuelta; eso es lo que parece una señal sin información cuando se le aplican comisiones.
Un gran movimiento en 24 horas te dice que algo ya sucedió. No te dice qué pasará después, y los datos lo demuestran en ambos sentidos.
GTC sube un +88.18%: probé las dos formas de operar
MAYORES SUBIDAS DE HOY
GTC: +88.18%
RLC: +55.00%
SCR: +17.57%
UMA: +16.09%
EDU: +11.88%
Todas las cuentas de esta app te mostrarán esta lista. Esta es la parte que omiten.
Probé con datos históricos ambas formas de operar un movimiento como el +88.18% de GTC: comprar la ruptura y apostar en contra suponiendo que el precio vuelve a su nivel anterior. Ambas dieron pérdidas. No por poco: perdieron aproximadamente lo que cuesta la transacción, un 0.240% por operación de ida y vuelta; eso es lo que parece una señal sin información cuando se le aplican comisiones.
Un gran movimiento en 24 horas te dice que algo ya sucedió. No te dice qué pasará después, y los datos lo demuestran en ambos sentidos.
GTC: +88.18%
RLC: +55.00%
SCR: +17.57%
UMA: +16.09%
EDU: +11.88%
Todas las cuentas de esta app te mostrarán esta lista. Esta es la parte que omiten.
Probé con datos históricos ambas formas de operar un movimiento como el +88.18% de GTC: comprar la ruptura y apostar en contra suponiendo que el precio vuelve a su nivel anterior. Ambas dieron pérdidas. No por poco: perdieron aproximadamente lo que cuesta la transacción, un 0.240% por operación de ida y vuelta; eso es lo que parece una señal sin información cuando se le aplican comisiones.
Un gran movimiento en 24 horas te dice que algo ya sucedió. No te dice qué pasará después, y los datos lo demuestran en ambos sentidos.
12
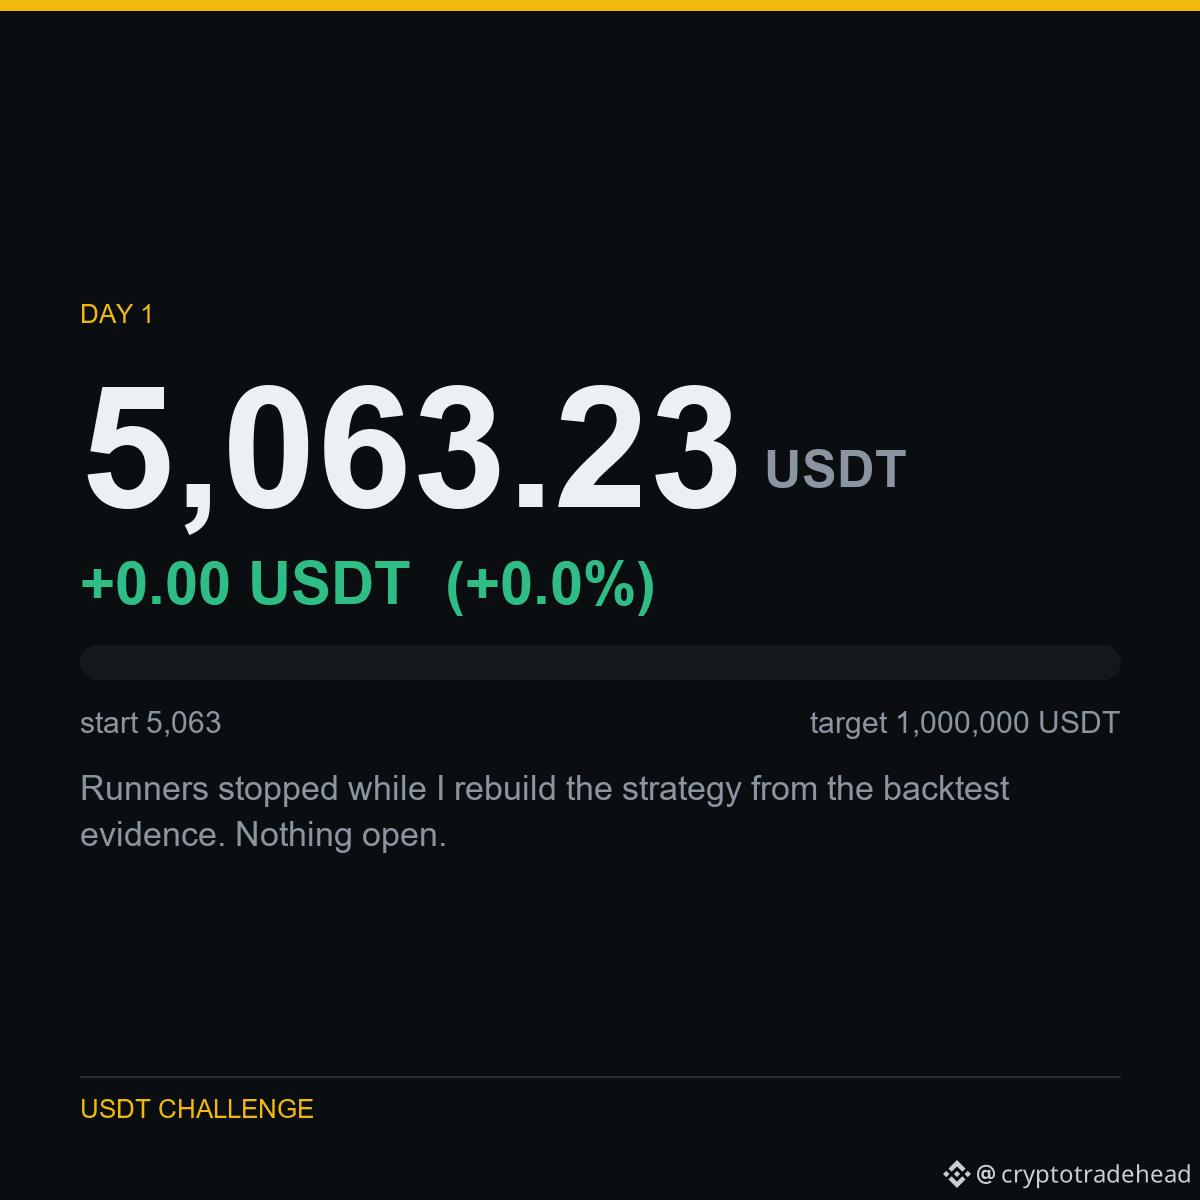
DÍA 1 - 5,063 USDT hasta 1,000,000 USDT
Saldo: 5,063.23 USDT
Cambio: +0.00 USDT (+0.0%)
Detuve los bots mientras reconstruyo la estrategia a partir de las pruebas del backtest. No hay nada abierto.
Opero en una cuenta de testnet de Binance, así que este es capital de demostración; prefiero decirlo antes que dejar que supongas lo contrario. La estrategia, los costos y las pérdidas son reales.
No vendo señales, no hay cursos ni enlaces de afiliados. Solo la cuenta y los datos que la respaldan.
Operado en este desafío: $BTC $SOL $AVAX
#Binance #USDT #Futures #TradingChallenge #Crypto
DÍA 1 - 5,063 USDT hasta 1,000,000 USDT
Saldo: 5,063.23 USDT
Cambio: +0.00 USDT (+0.0%)
Detuve los bots mientras reconstruyo la estrategia a partir de las pruebas del backtest. No hay nada abierto.
Opero en una cuenta de testnet de Binance, así que este es capital de demostración; prefiero decirlo antes que dejar que supongas lo contrario. La estrategia, los costos y las pérdidas son reales.
No vendo señales, no hay cursos ni enlaces de afiliados. Solo la cuenta y los datos que la respaldan.
Operado en este desafío: $BTC $SOL $AVAX
#Binance #USDT #Futures #TradingChallenge #Crypto
Saldo: 5,063.23 USDT
Cambio: +0.00 USDT (+0.0%)
Detuve los bots mientras reconstruyo la estrategia a partir de las pruebas del backtest. No hay nada abierto.
Opero en una cuenta de testnet de Binance, así que este es capital de demostración; prefiero decirlo antes que dejar que supongas lo contrario. La estrategia, los costos y las pérdidas son reales.
No vendo señales, no hay cursos ni enlaces de afiliados. Solo la cuenta y los datos que la respaldan.
Operado en este desafío: $BTC $SOL $AVAX
#Binance #USDT #Futures #TradingChallenge #Crypto
3
Artículo
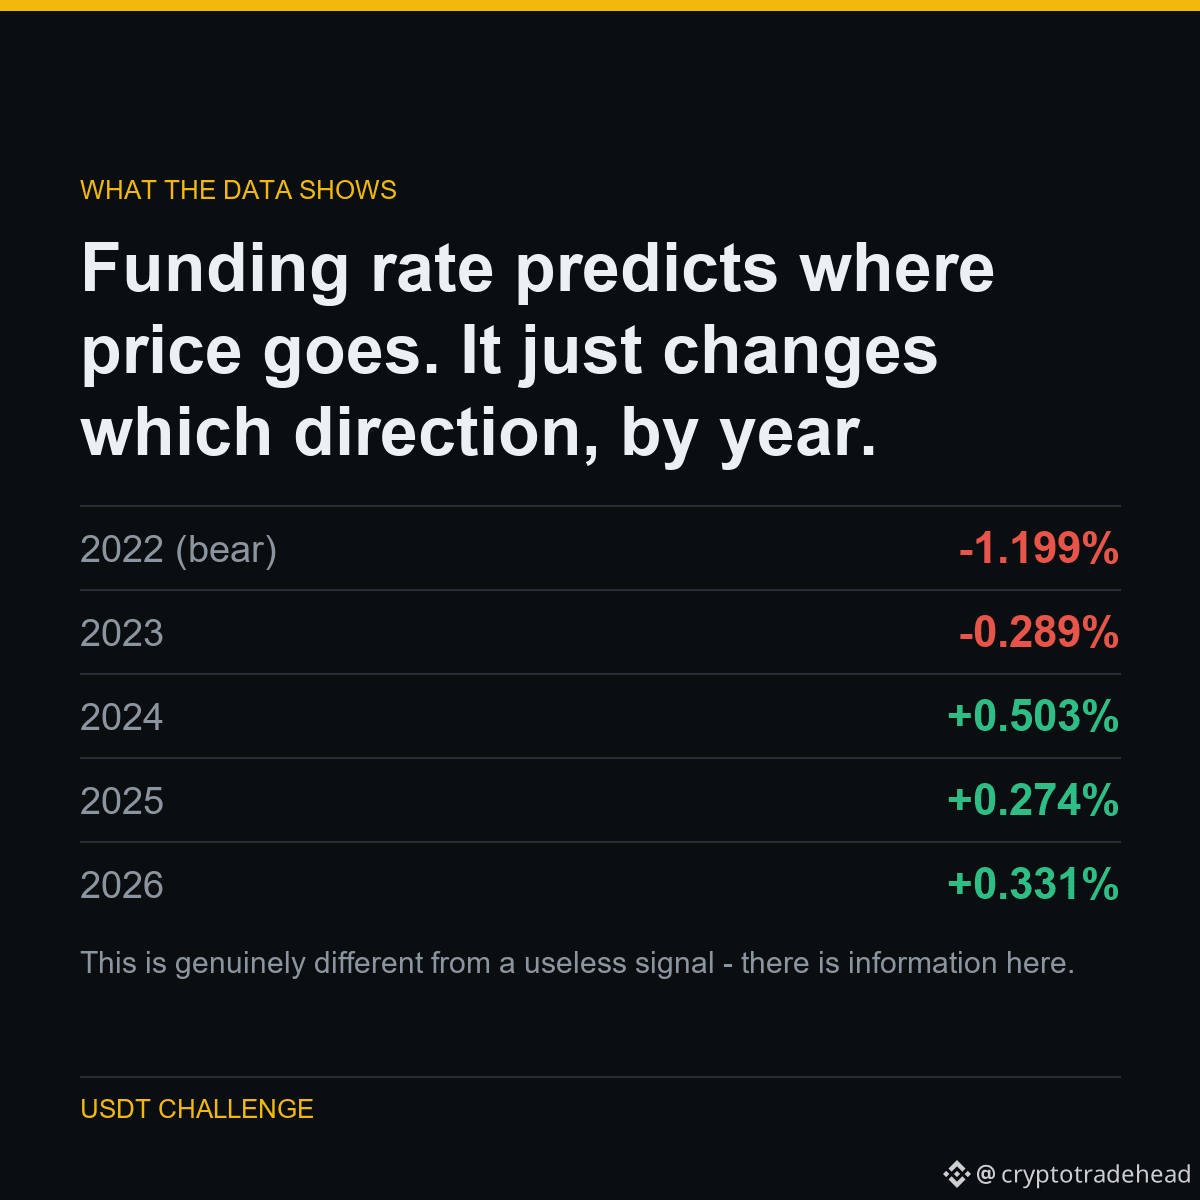
La tasa de financiación predice hacia dónde irá el precio. Lo único que cambia, según el año, es la dirección.La tasa de financiación predice hacia dónde irá el precio. Lo único que cambia, según el año, es la dirección.
Dividí todas las lecturas de financiación en quintiles y medí el rendimiento de las 72 horas siguientes del quintil más alto frente al más bajo.
En los mercados bajistas, una financiación alta precedía a PEORES rendimientos: los largos saturados sufrían liquidaciones. Desde 2024 en adelante, precedía a MEJORES rendimientos: impulso.
La señal es real. El signo no es estable. Si calculas el promedio de todos los años, obtienes un -0,08%, por debajo del 0,240% que cuesta operar.
QUÉ SIGNIFICA
Esto es realmente distinto de una señal inútil: aquí hay información. Pero para aprovecharla tendrías que conocer de antemano el régimen, y ese es el mismo problema circular que hace fracasar todo lo demás.
La tasa de financiación predice hacia dónde irá el precio. Lo único que cambia, según el año, es la dirección.
La tasa de financiación predice hacia dónde irá el precio. Lo único que cambia, según el año, es la dirección.
Dividí todas las lecturas de financiación en quintiles y medí el rendimiento de las 72 horas siguientes del quintil más alto frente al más bajo.
En los mercados bajistas, una financiación alta precedía a PEORES rendimientos: los largos saturados sufrían liquidaciones. Desde 2024 en adelante, precedía a MEJORES rendimientos: impulso.
La señal es real. El signo no es estable. Si calculas el promedio de todos los años, obtienes un -0,08%, por debajo del 0,240% que cuesta operar.
QUÉ SIGNIFICA
Esto es realmente distinto de una señal inútil: aquí hay información. Pero para aprovecharla tendrías que conocer de antemano el régimen, y ese es el mismo problema circular que hace fracasar todo lo demás.
Dividí todas las lecturas de financiación en quintiles y medí el rendimiento de las 72 horas siguientes del quintil más alto frente al más bajo.
En los mercados bajistas, una financiación alta precedía a PEORES rendimientos: los largos saturados sufrían liquidaciones. Desde 2024 en adelante, precedía a MEJORES rendimientos: impulso.
La señal es real. El signo no es estable. Si calculas el promedio de todos los años, obtienes un -0,08%, por debajo del 0,240% que cuesta operar.
QUÉ SIGNIFICA
Esto es realmente distinto de una señal inútil: aquí hay información. Pero para aprovecharla tendrías que conocer de antemano el régimen, y ese es el mismo problema circular que hace fracasar todo lo demás.
5
Artículo
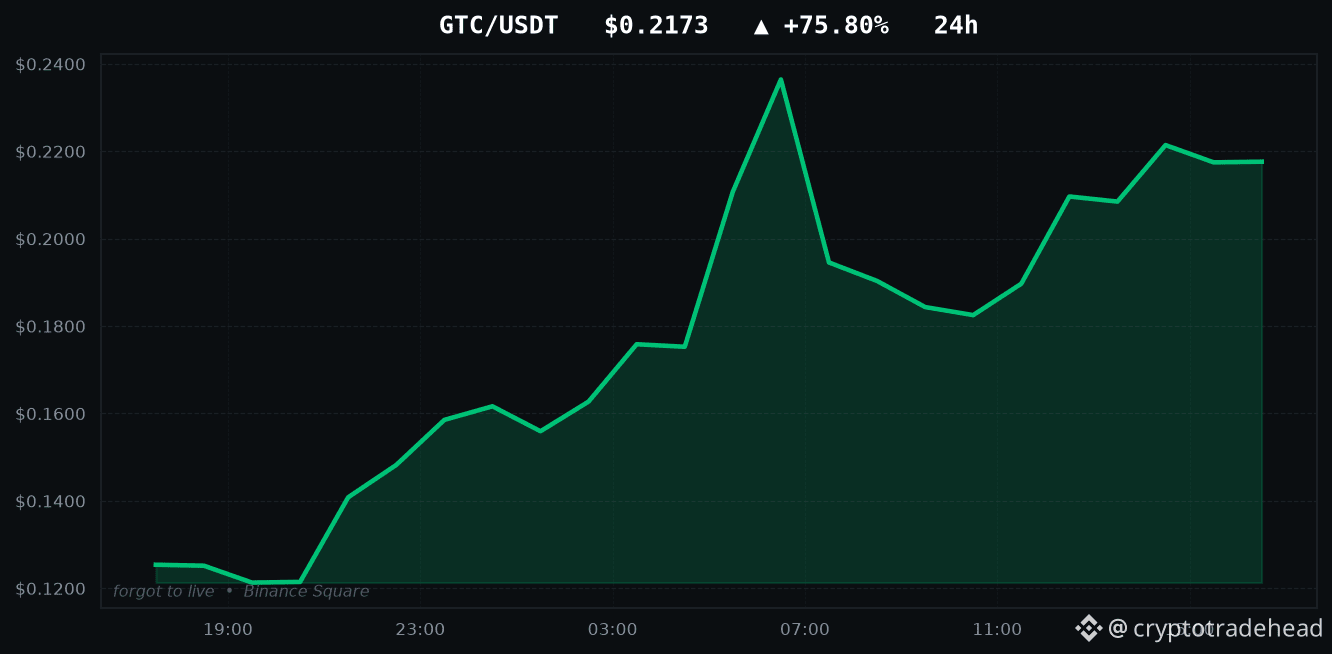
GTC sube un +75.80%: probé las dos formas de operar este movimientoLAS MAYORES SUBIDAS DE HOY
GTC: +75.80%
RLC: +27.91%
SCR: +23.57%
MOVR: +19.68%
MUBARAK: +16.64%
Todas las cuentas de esta aplicación te mostrarán esta lista. Aquí está la parte que omiten.
Probé con datos históricos ambas formas de operar un movimiento como el +75.80% de GTC: comprar cuando rompe al alza y apostar en su contra suponiendo que retrocederá. Ambas dieron pérdidas. Y no por poco: perdieron aproximadamente lo mismo que cuesta la transacción, un 0.240% por operación de ida y vuelta. Así es como se ve una señal sin información cuando se le cobran comisiones.
Un gran movimiento en 24 horas te dice que algo ya pasó. No te dice qué pasará después, y los datos lo demuestran en ambos sentidos.
GTC sube un +75.80%: probé las dos formas de operar este movimiento
LAS MAYORES SUBIDAS DE HOY
GTC: +75.80%
RLC: +27.91%
SCR: +23.57%
MOVR: +19.68%
MUBARAK: +16.64%
Todas las cuentas de esta aplicación te mostrarán esta lista. Aquí está la parte que omiten.
Probé con datos históricos ambas formas de operar un movimiento como el +75.80% de GTC: comprar cuando rompe al alza y apostar en su contra suponiendo que retrocederá. Ambas dieron pérdidas. Y no por poco: perdieron aproximadamente lo mismo que cuesta la transacción, un 0.240% por operación de ida y vuelta. Así es como se ve una señal sin información cuando se le cobran comisiones.
Un gran movimiento en 24 horas te dice que algo ya pasó. No te dice qué pasará después, y los datos lo demuestran en ambos sentidos.
GTC: +75.80%
RLC: +27.91%
SCR: +23.57%
MOVR: +19.68%
MUBARAK: +16.64%
Todas las cuentas de esta aplicación te mostrarán esta lista. Aquí está la parte que omiten.
Probé con datos históricos ambas formas de operar un movimiento como el +75.80% de GTC: comprar cuando rompe al alza y apostar en su contra suponiendo que retrocederá. Ambas dieron pérdidas. Y no por poco: perdieron aproximadamente lo mismo que cuesta la transacción, un 0.240% por operación de ida y vuelta. Así es como se ve una señal sin información cuando se le cobran comisiones.
Un gran movimiento en 24 horas te dice que algo ya pasó. No te dice qué pasará después, y los datos lo demuestran en ambos sentidos.
8
CÓMO LO PROBÉ
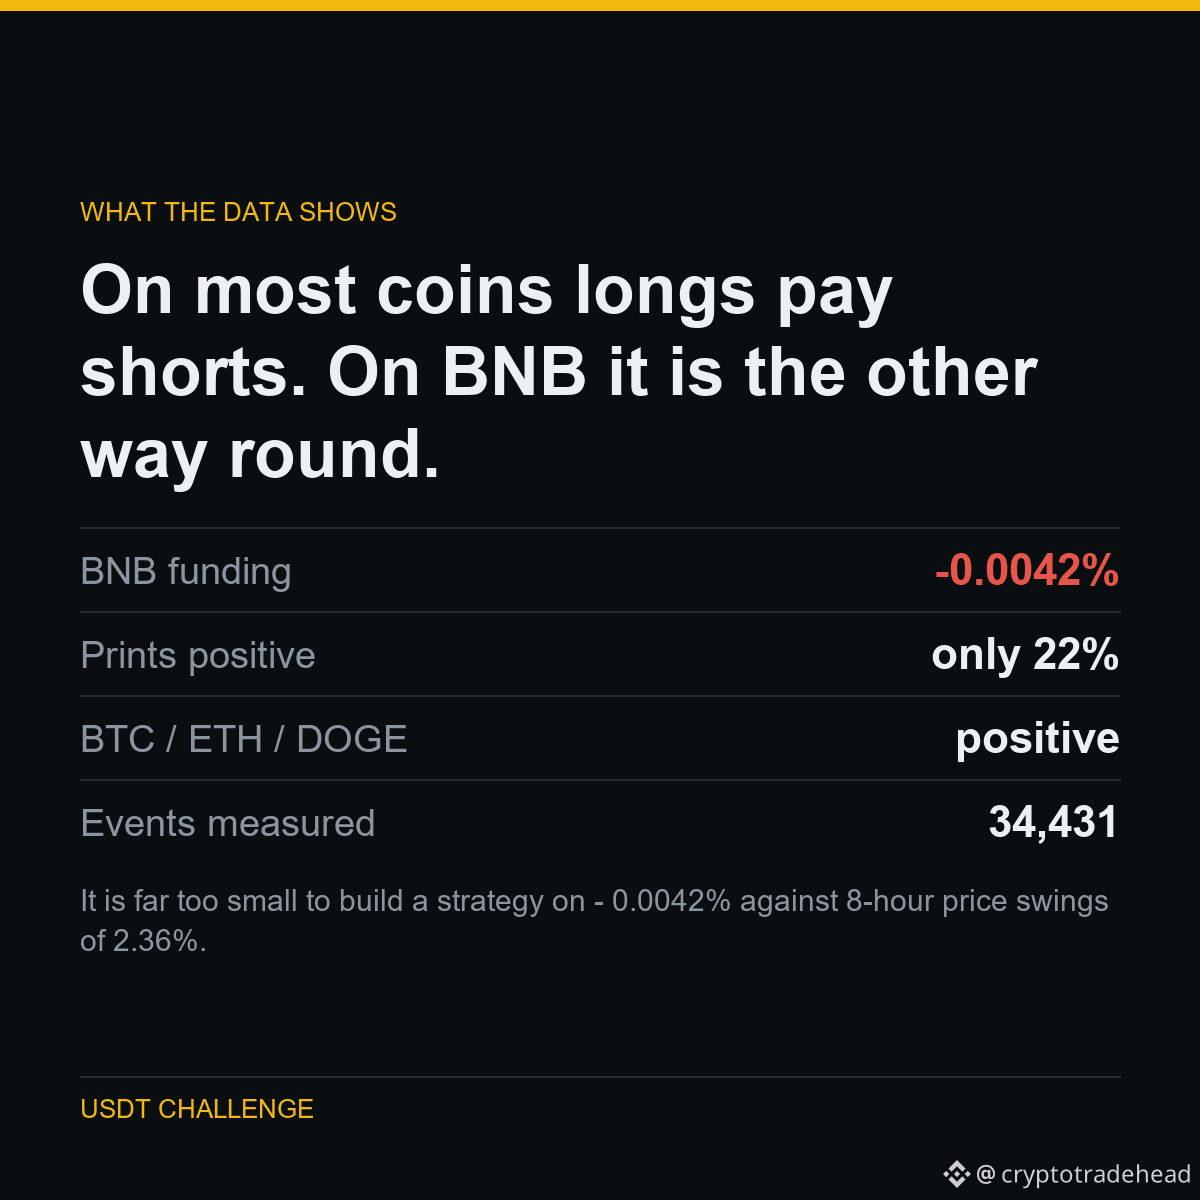
La financiación es el pago entre quienes mantienen posiciones largas y cortas en un contrato perpetuo. Si es positiva, quienes están en largo pagan a quienes están en corto, que es lo habitual en un mercado donde la mayoría apuesta a que los precios subirán.
En 34,431 operaciones, la financiación de BNB promedia un valor NEGATIVO: quienes están en corto pagan a quienes están en largo, y solo el 22% de sus operaciones arroja un valor positivo. BTC, ETH y DOGE tienen valores positivos.
Así que mantener una posición larga en un perpetuo de BNB te paga por estar ahí, mientras que una posición larga en un perpetuo de BTC te cobra alquiler.
LAS CIFRAS
Financiación de BNB: -0.0042%
Operaciones con financiación positiva: solo el 22%
BTC / ETH / DOGE: positiva
Eventos medidos: 34,431
Es demasiado poco para construir una estrategia: 0.0042% frente a oscilaciones de precio del 2.36% en 8 horas. Pero si ya tienes una posición, la dirección de la financiación no es la misma en todas las monedas, aunque la mayoría da por hecho que sí.
Parte de un experimento público: de 5,063 USDT a 1,000,000 USDT; publico todos los resultados, incluso los que me dejan mal.
Ejecutado en $BNB $BTC $ETH
#Binance #Futures #Backtesting #TradingBot #CryptoData
CÓMO LO PROBÉ
La financiación es el pago entre quienes mantienen posiciones largas y cortas en un contrato perpetuo. Si es positiva, quienes están en largo pagan a quienes están en corto, que es lo habitual en un mercado donde la mayoría apuesta a que los precios subirán.
En 34,431 operaciones, la financiación de BNB promedia un valor NEGATIVO: quienes están en corto pagan a quienes están en largo, y solo el 22% de sus operaciones arroja un valor positivo. BTC, ETH y DOGE tienen valores positivos.
Así que mantener una posición larga en un perpetuo de BNB te paga por estar ahí, mientras que una posición larga en un perpetuo de BTC te cobra alquiler.
LAS CIFRAS
Financiación de BNB: -0.0042%
Operaciones con financiación positiva: solo el 22%
BTC / ETH / DOGE: positiva
Eventos medidos: 34,431
Es demasiado poco para construir una estrategia: 0.0042% frente a oscilaciones de precio del 2.36% en 8 horas. Pero si ya tienes una posición, la dirección de la financiación no es la misma en todas las monedas, aunque la mayoría da por hecho que sí.
Parte de un experimento público: de 5,063 USDT a 1,000,000 USDT; publico todos los resultados, incluso los que me dejan mal.
Ejecutado en $BNB $BTC $ETH
#Binance #Futures #Backtesting #TradingBot #CryptoData
La financiación es el pago entre quienes mantienen posiciones largas y cortas en un contrato perpetuo. Si es positiva, quienes están en largo pagan a quienes están en corto, que es lo habitual en un mercado donde la mayoría apuesta a que los precios subirán.
En 34,431 operaciones, la financiación de BNB promedia un valor NEGATIVO: quienes están en corto pagan a quienes están en largo, y solo el 22% de sus operaciones arroja un valor positivo. BTC, ETH y DOGE tienen valores positivos.
Así que mantener una posición larga en un perpetuo de BNB te paga por estar ahí, mientras que una posición larga en un perpetuo de BTC te cobra alquiler.
LAS CIFRAS
Financiación de BNB: -0.0042%
Operaciones con financiación positiva: solo el 22%
BTC / ETH / DOGE: positiva
Eventos medidos: 34,431
Es demasiado poco para construir una estrategia: 0.0042% frente a oscilaciones de precio del 2.36% en 8 horas. Pero si ya tienes una posición, la dirección de la financiación no es la misma en todas las monedas, aunque la mayoría da por hecho que sí.
Parte de un experimento público: de 5,063 USDT a 1,000,000 USDT; publico todos los resultados, incluso los que me dejan mal.
Ejecutado en $BNB $BTC $ETH
#Binance #Futures #Backtesting #TradingBot #CryptoData
5
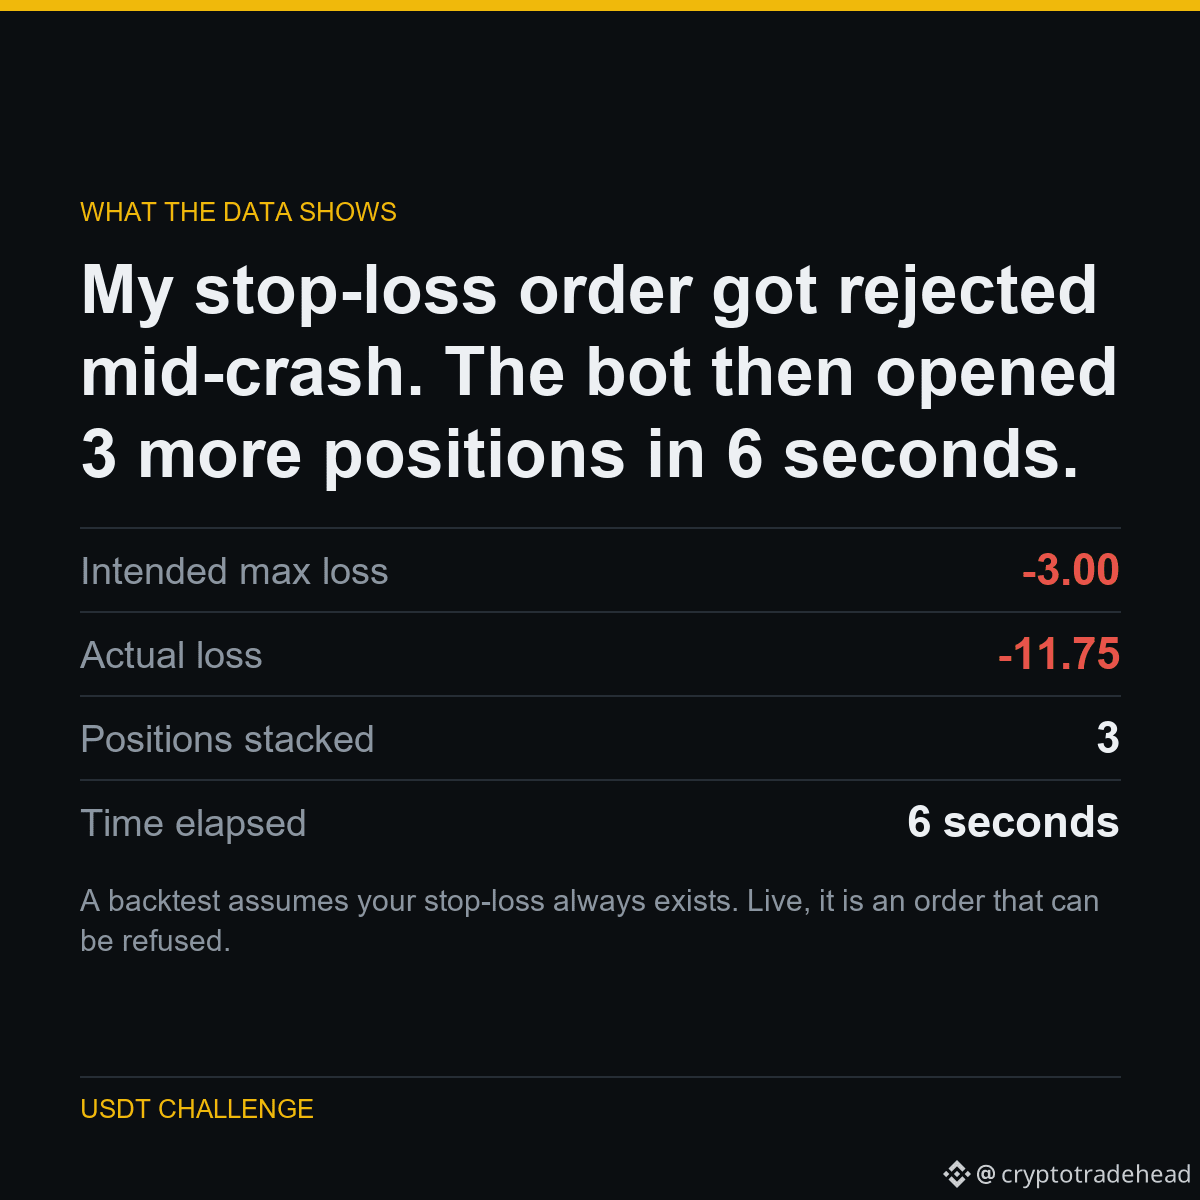
Un backtest supone que tu stop-loss siempre existe. En vivo, puede que rechacen la orden. La diferencia entre esas dos suposiciones es donde se pierde dinero real.
Esto es lo que pasó.
Rechazaron mi orden stop-loss en plena caída. Luego, el bot abrió 3 posiciones más en 6 segundos.
Durante una caída rápida, Binance rechazó mi stop-loss con el error -2021: el mercado ya había superado el precio de activación antes de que llegara la orden.
Mi código no gestionó ese rechazo. La posición quedó abierta sin stop y, como el estado interno del bot nunca lo registró, la siguiente señal abrió otra posición encima. Tres veces.
El riesgo previsto era de 3 USDT. La pérdida real fue de 11.75 USDT.
Esto forma parte de un experimento público: de 5,063 USDT a 1,000,000 USDT. Publico todos los resultados, incluso los que me dejan mal.
Operando con $BNB
#Binance #Futures #Backtesting #TradingBot #CryptoData
Un backtest supone que tu stop-loss siempre existe. En vivo, puede que rechacen la orden. La diferencia entre esas dos suposiciones es donde se pierde dinero real.
Esto es lo que pasó.
Rechazaron mi orden stop-loss en plena caída. Luego, el bot abrió 3 posiciones más en 6 segundos.
Durante una caída rápida, Binance rechazó mi stop-loss con el error -2021: el mercado ya había superado el precio de activación antes de que llegara la orden.
Mi código no gestionó ese rechazo. La posición quedó abierta sin stop y, como el estado interno del bot nunca lo registró, la siguiente señal abrió otra posición encima. Tres veces.
El riesgo previsto era de 3 USDT. La pérdida real fue de 11.75 USDT.
Esto forma parte de un experimento público: de 5,063 USDT a 1,000,000 USDT. Publico todos los resultados, incluso los que me dejan mal.
Operando con $BNB
#Binance #Futures #Backtesting #TradingBot #CryptoData
Esto es lo que pasó.
Rechazaron mi orden stop-loss en plena caída. Luego, el bot abrió 3 posiciones más en 6 segundos.
Durante una caída rápida, Binance rechazó mi stop-loss con el error -2021: el mercado ya había superado el precio de activación antes de que llegara la orden.
Mi código no gestionó ese rechazo. La posición quedó abierta sin stop y, como el estado interno del bot nunca lo registró, la siguiente señal abrió otra posición encima. Tres veces.
El riesgo previsto era de 3 USDT. La pérdida real fue de 11.75 USDT.
Esto forma parte de un experimento público: de 5,063 USDT a 1,000,000 USDT. Publico todos los resultados, incluso los que me dejan mal.
Operando con $BNB
#Binance #Futures #Backtesting #TradingBot #CryptoData
11
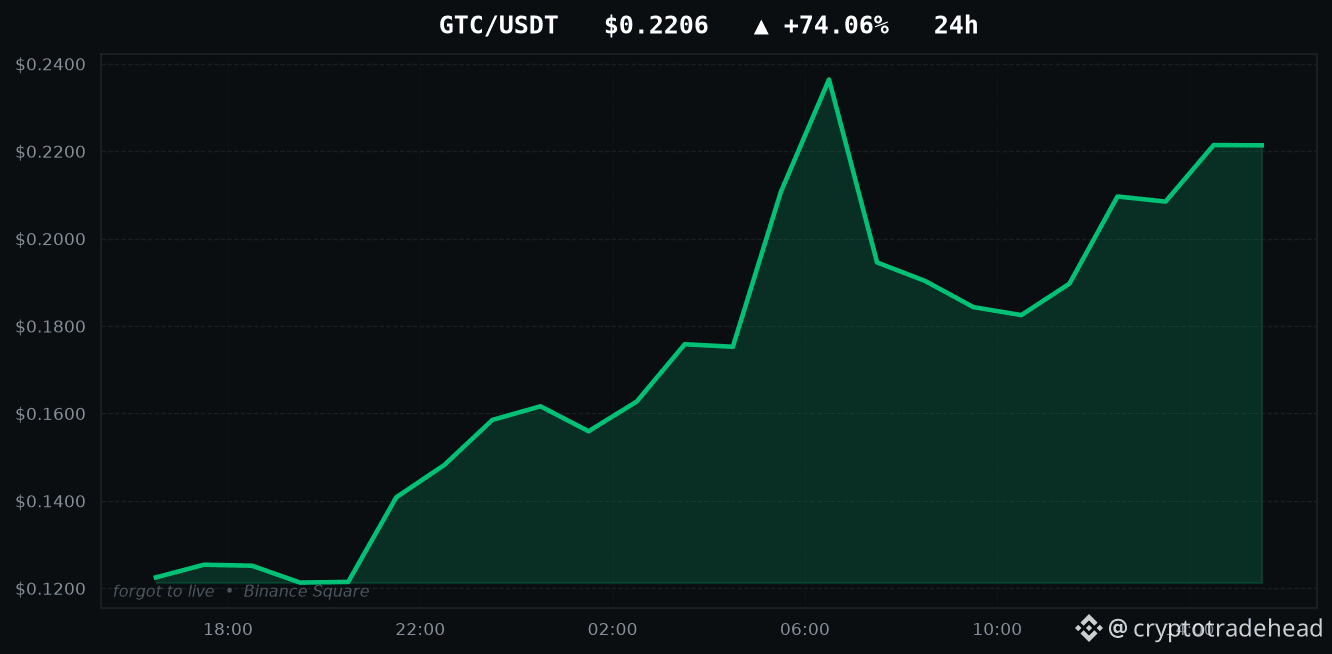
Artículo
GTC sube un +74.06%: probé ambas formas de operar con esta subidaLAS MAYORES SUBIDAS DE HOY
GTC: +74.06%
SCR: +26.41%
MOVR: +25.60%
RLC: +24.35%
MUBARAK: +13.34%
Todas las cuentas de esta aplicación te mostrarán esta lista. Aquí está la parte que omiten.
Probé ambas estrategias con datos históricos para operar un movimiento como el +74.06% de GTC: comprar la ruptura y apostar en contra suponiendo que el precio volvería a su nivel anterior. Ambas dieron pérdidas. Y no por poco: perdieron aproximadamente lo que cuesta la transacción, un 0.240% por operación de ida y vuelta. Así se ve una señal sin información cuando se le aplican comisiones.
Una gran variación en 24 horas te dice que algo ya ocurrió. No te dice qué ocurrirá después, y los datos lo demuestran en ambos sentidos.
GTC sube un +74.06%: probé ambas formas de operar con esta subida
LAS MAYORES SUBIDAS DE HOY
GTC: +74.06%
SCR: +26.41%
MOVR: +25.60%
RLC: +24.35%
MUBARAK: +13.34%
Todas las cuentas de esta aplicación te mostrarán esta lista. Aquí está la parte que omiten.
Probé ambas estrategias con datos históricos para operar un movimiento como el +74.06% de GTC: comprar la ruptura y apostar en contra suponiendo que el precio volvería a su nivel anterior. Ambas dieron pérdidas. Y no por poco: perdieron aproximadamente lo que cuesta la transacción, un 0.240% por operación de ida y vuelta. Así se ve una señal sin información cuando se le aplican comisiones.
Una gran variación en 24 horas te dice que algo ya ocurrió. No te dice qué ocurrirá después, y los datos lo demuestran en ambos sentidos.
GTC: +74.06%
SCR: +26.41%
MOVR: +25.60%
RLC: +24.35%
MUBARAK: +13.34%
Todas las cuentas de esta aplicación te mostrarán esta lista. Aquí está la parte que omiten.
Probé ambas estrategias con datos históricos para operar un movimiento como el +74.06% de GTC: comprar la ruptura y apostar en contra suponiendo que el precio volvería a su nivel anterior. Ambas dieron pérdidas. Y no por poco: perdieron aproximadamente lo que cuesta la transacción, un 0.240% por operación de ida y vuelta. Así se ve una señal sin información cuando se le aplican comisiones.
Una gran variación en 24 horas te dice que algo ya ocurrió. No te dice qué ocurrirá después, y los datos lo demuestran en ambos sentidos.
9
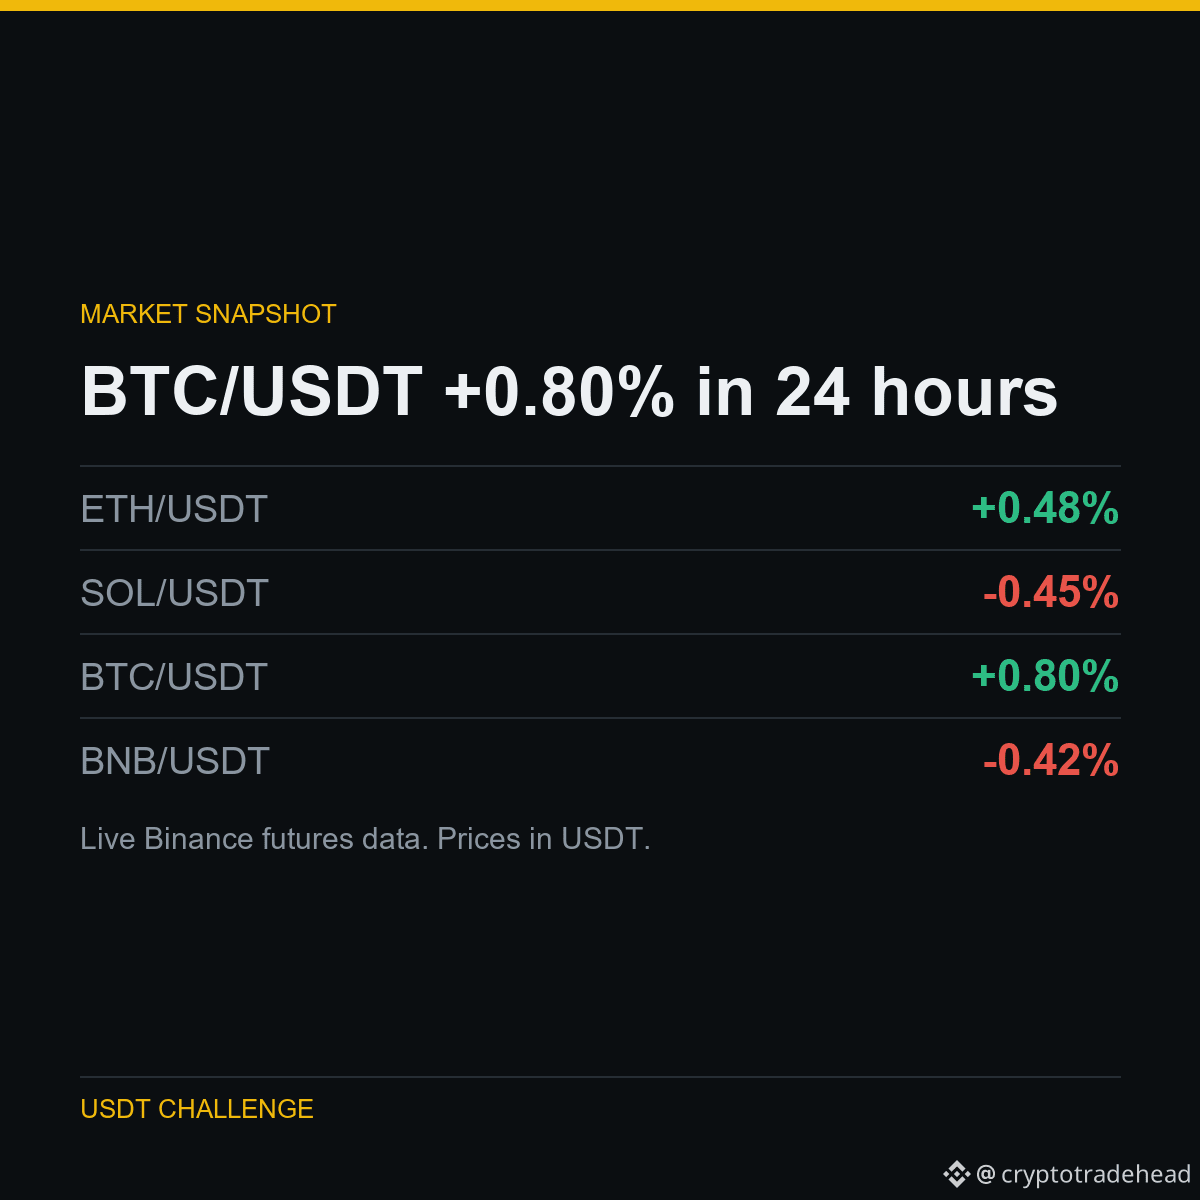
RESUMEN DE LAS ÚLTIMAS 24 HORAS
ETH/USDT: 2,716.71 USDT (+0.48%)
SOL/USDT: 120.67 USDT (-0.45%)
BTC/USDT: 86,017.80 USDT (+0.80%)
BNB/USDT: 788.21 USDT (-0.42%)
La tasa de financiación de BTC/USDT es de +0.0056% cada 8 h.
Contexto, no una recomendación: no publico puntos de entrada ni objetivos. Todas mis operaciones quedan registradas y se publican a posteriori, tanto las ganancias como las pérdidas.
Mencionado arriba: $BTC $ETH $SOL
#Binance #Crypto #Futures #BTC #Altcoins
RESUMEN DE LAS ÚLTIMAS 24 HORAS
ETH/USDT: 2,716.71 USDT (+0.48%)
SOL/USDT: 120.67 USDT (-0.45%)
BTC/USDT: 86,017.80 USDT (+0.80%)
BNB/USDT: 788.21 USDT (-0.42%)
La tasa de financiación de BTC/USDT es de +0.0056% cada 8 h.
Contexto, no una recomendación: no publico puntos de entrada ni objetivos. Todas mis operaciones quedan registradas y se publican a posteriori, tanto las ganancias como las pérdidas.
Mencionado arriba: $BTC $ETH $SOL
#Binance #Crypto #Futures #BTC #Altcoins
ETH/USDT: 2,716.71 USDT (+0.48%)
SOL/USDT: 120.67 USDT (-0.45%)
BTC/USDT: 86,017.80 USDT (+0.80%)
BNB/USDT: 788.21 USDT (-0.42%)
La tasa de financiación de BTC/USDT es de +0.0056% cada 8 h.
Contexto, no una recomendación: no publico puntos de entrada ni objetivos. Todas mis operaciones quedan registradas y se publican a posteriori, tanto las ganancias como las pérdidas.
Mencionado arriba: $BTC $ETH $SOL
#Binance #Crypto #Futures #BTC #Altcoins
4
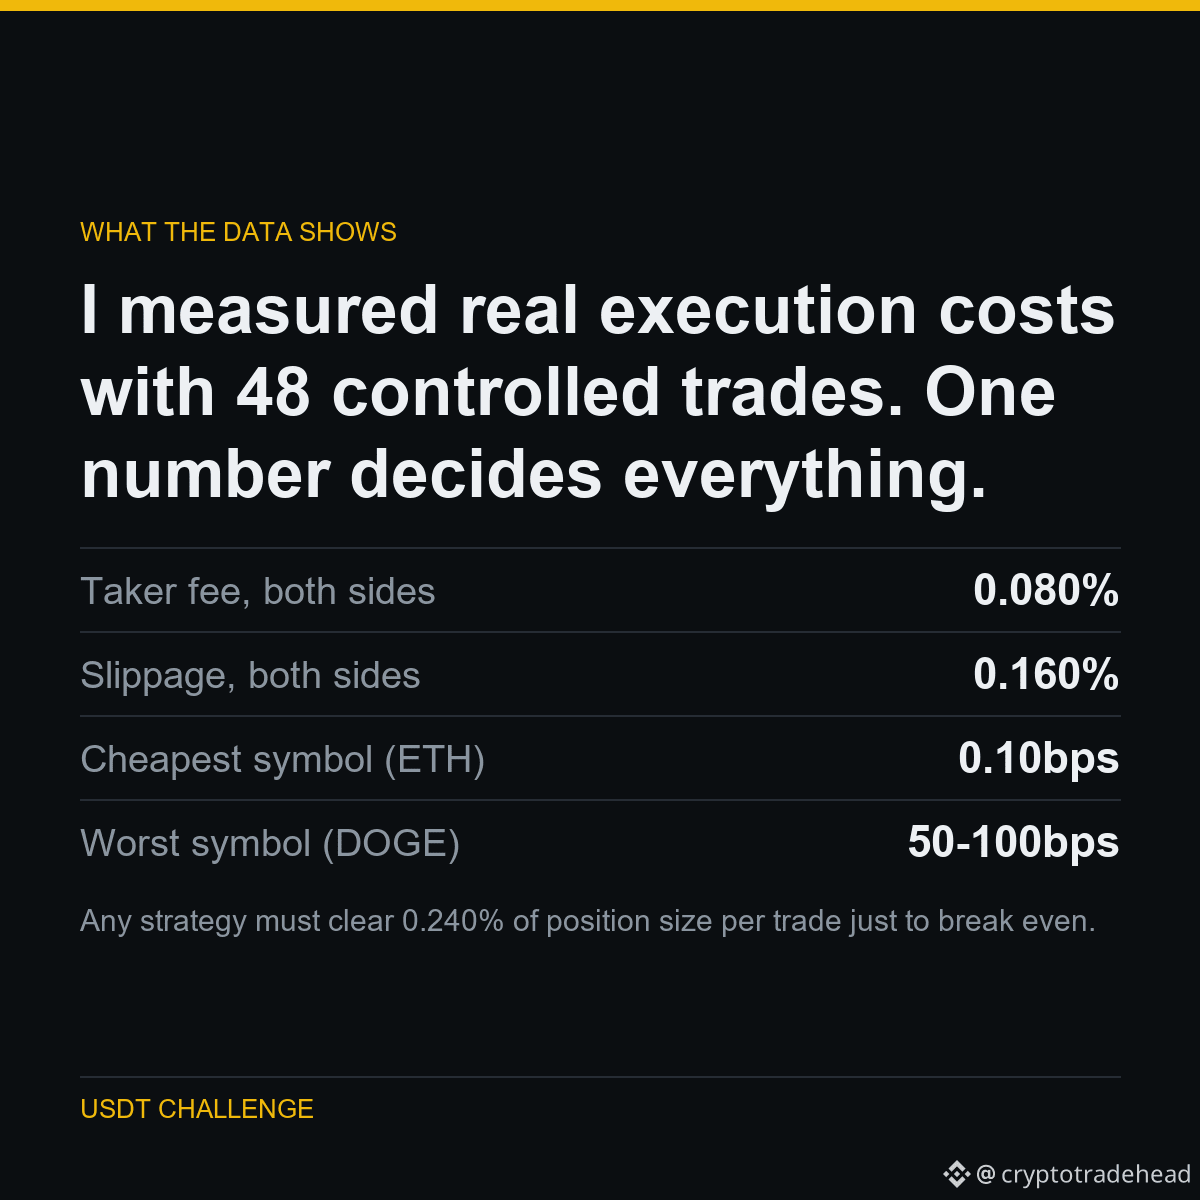
CÓMO LO PROBÉ
Dejé de dar por sentado cuánto cuesta operar y lo medí: 48 operaciones completas controladas, entrando y saliendo de inmediato, y registrando la ejecución real frente al precio de referencia.
La comisión se mantuvo constante en un 0.04% por lado. El deslizamiento, no: ETH se ejecutó prácticamente sin deslizamiento, mientras que operar con DOGE costó entre 50 y 100 puntos básicos por operación completa.
En una posición de 150 USDT, una operación completa cuesta 0.36 USDT, incluso antes de que el mercado se mueva.
LAS CIFRAS
Comisión taker, ambos lados: 0.080%
Deslizamiento, ambos lados: 0.160%
Símbolo más barato (ETH): 0.10bps
Símbolo más caro (DOGE): 50-100bps
Cualquier estrategia debe superar el 0.240% del tamaño de la posición por operación solo para alcanzar el punto de equilibrio. La mayoría de las estrategias publicadas nunca menciona esta cifra, por eso la mayoría pierde dinero.
Parte de un experimento público: de 5,063 USDT a 1,000,000 USDT, con todos los resultados publicados, incluidos los que me dejan mal.
Ejecutado en $ETH $DOGE
#Binance #Futures #Backtesting #TradingBot #CryptoData
CÓMO LO PROBÉ
Dejé de dar por sentado cuánto cuesta operar y lo medí: 48 operaciones completas controladas, entrando y saliendo de inmediato, y registrando la ejecución real frente al precio de referencia.
La comisión se mantuvo constante en un 0.04% por lado. El deslizamiento, no: ETH se ejecutó prácticamente sin deslizamiento, mientras que operar con DOGE costó entre 50 y 100 puntos básicos por operación completa.
En una posición de 150 USDT, una operación completa cuesta 0.36 USDT, incluso antes de que el mercado se mueva.
LAS CIFRAS
Comisión taker, ambos lados: 0.080%
Deslizamiento, ambos lados: 0.160%
Símbolo más barato (ETH): 0.10bps
Símbolo más caro (DOGE): 50-100bps
Cualquier estrategia debe superar el 0.240% del tamaño de la posición por operación solo para alcanzar el punto de equilibrio. La mayoría de las estrategias publicadas nunca menciona esta cifra, por eso la mayoría pierde dinero.
Parte de un experimento público: de 5,063 USDT a 1,000,000 USDT, con todos los resultados publicados, incluidos los que me dejan mal.
Ejecutado en $ETH $DOGE
#Binance #Futures #Backtesting #TradingBot #CryptoData
Dejé de dar por sentado cuánto cuesta operar y lo medí: 48 operaciones completas controladas, entrando y saliendo de inmediato, y registrando la ejecución real frente al precio de referencia.
La comisión se mantuvo constante en un 0.04% por lado. El deslizamiento, no: ETH se ejecutó prácticamente sin deslizamiento, mientras que operar con DOGE costó entre 50 y 100 puntos básicos por operación completa.
En una posición de 150 USDT, una operación completa cuesta 0.36 USDT, incluso antes de que el mercado se mueva.
LAS CIFRAS
Comisión taker, ambos lados: 0.080%
Deslizamiento, ambos lados: 0.160%
Símbolo más barato (ETH): 0.10bps
Símbolo más caro (DOGE): 50-100bps
Cualquier estrategia debe superar el 0.240% del tamaño de la posición por operación solo para alcanzar el punto de equilibrio. La mayoría de las estrategias publicadas nunca menciona esta cifra, por eso la mayoría pierde dinero.
Parte de un experimento público: de 5,063 USDT a 1,000,000 USDT, con todos los resultados publicados, incluidos los que me dejan mal.
Ejecutado en $ETH $DOGE
#Binance #Futures #Backtesting #TradingBot #CryptoData
4
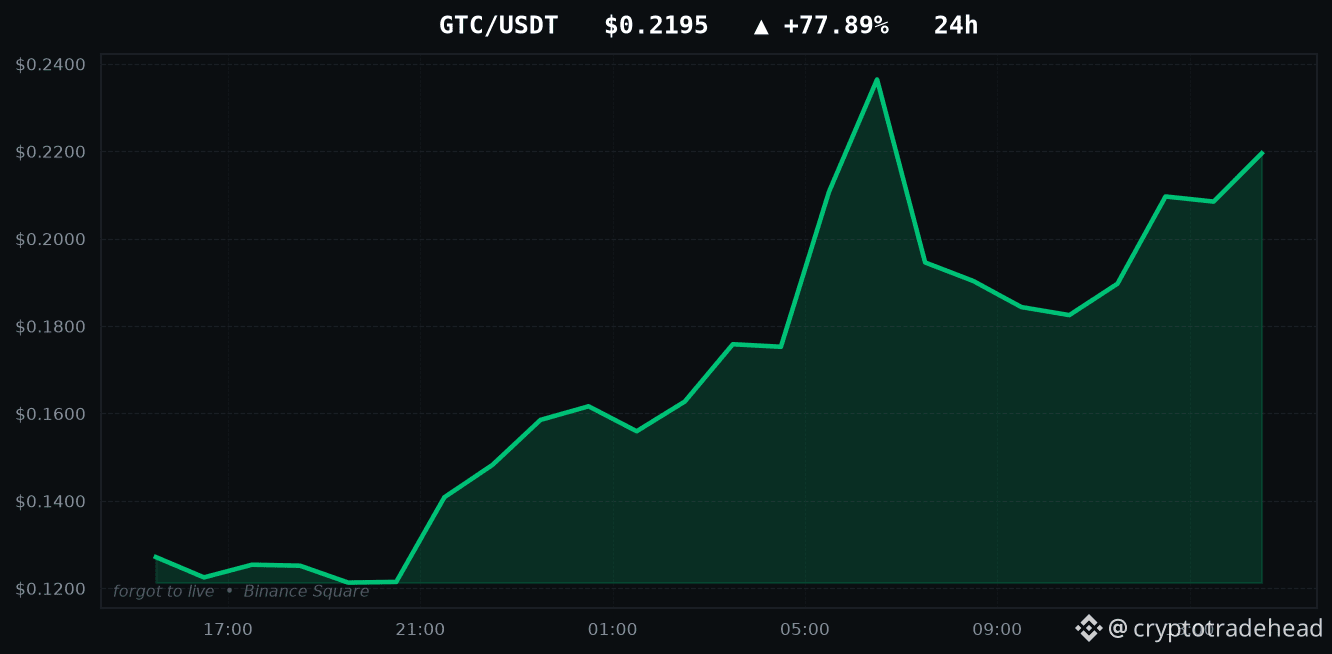
Artículo
GTC sube un +77.89%: probé ambas formas de operarLOS ACTIVOS QUE MÁS SUBEN HOY
GTC: +77.89%
MOVR: +24.15%
SCR: +17.97%
FET: +15.10%
MUBARAK: +13.63%
Todas las cuentas de esta aplicación te mostrarán esta lista. Aquí está la parte que omiten.
Probé con datos históricos ambas formas de operar un movimiento como el +77.89% de GTC: comprar cuando rompe al alza y apostar en contra suponiendo que el precio volverá a su nivel anterior. Ambas dieron pérdidas. Y no por poco: perdieron aproximadamente lo mismo que cuesta la transacción, un 0.240% por operación completa. Así es como se ve una señal sin valor informativo cuando se tienen en cuenta las comisiones.
Un gran movimiento en 24 horas te dice que algo ya pasó. No te dice qué pasará después, y los datos lo demuestran en ambos sentidos.
GTC sube un +77.89%: probé ambas formas de operar
LOS ACTIVOS QUE MÁS SUBEN HOY
GTC: +77.89%
MOVR: +24.15%
SCR: +17.97%
FET: +15.10%
MUBARAK: +13.63%
Todas las cuentas de esta aplicación te mostrarán esta lista. Aquí está la parte que omiten.
Probé con datos históricos ambas formas de operar un movimiento como el +77.89% de GTC: comprar cuando rompe al alza y apostar en contra suponiendo que el precio volverá a su nivel anterior. Ambas dieron pérdidas. Y no por poco: perdieron aproximadamente lo mismo que cuesta la transacción, un 0.240% por operación completa. Así es como se ve una señal sin valor informativo cuando se tienen en cuenta las comisiones.
Un gran movimiento en 24 horas te dice que algo ya pasó. No te dice qué pasará después, y los datos lo demuestran en ambos sentidos.
GTC: +77.89%
MOVR: +24.15%
SCR: +17.97%
FET: +15.10%
MUBARAK: +13.63%
Todas las cuentas de esta aplicación te mostrarán esta lista. Aquí está la parte que omiten.
Probé con datos históricos ambas formas de operar un movimiento como el +77.89% de GTC: comprar cuando rompe al alza y apostar en contra suponiendo que el precio volverá a su nivel anterior. Ambas dieron pérdidas. Y no por poco: perdieron aproximadamente lo mismo que cuesta la transacción, un 0.240% por operación completa. Así es como se ve una señal sin valor informativo cuando se tienen en cuenta las comisiones.
Un gran movimiento en 24 horas te dice que algo ya pasó. No te dice qué pasará después, y los datos lo demuestran en ambos sentidos.
13
Inicia sesión para explorar más contenidos
Únete a usuarios globales de criptomonedas en Binance Square
⚡️ Obtén información útil y actualizada sobre criptos.
💬 Avalado por el mayor exchange de criptomonedas en el mundo.
👍 Descubre perspectivas reales de creadores verificados.
Email/número de teléfono
Temas populares
ADAGains10%Above$0.27
3,590 vistas
107 están debatiendo
$ADA perfora resistencias y consolida sobre los $0,274! Radiografía técnica en Futuros Perpetuos
El par ADA/USDT en futuros perpetuos registra una subida superior al +12% en 24 horas, alcanzando un máximo intradía de $0,2768 con un volumen negociado de más de 485 millones de USDT (1.840 millones de ADA).
Niveles e indicadores clave en el gráfico:
La vela de 4h confirmó una ruptura limpia por encima del rango de consolidación previo ($0,232 – $0,251) y se despegó de la MA(99) ubicada en $0,246. No obstante, el RSI(6) en 89,69 y el StochRSI en 99,26 advierten que el movimiento entra en zona de sobrecompra extendida, donde suele presentarse toma de beneficios o pausas laterales.
En temporalidades cortas, el precio comprime en torno a la MA(7) en $0,2744, con la MA(25) en $0,2728 actuando como primer soporte dinámico.
Mientras no pierda esta base, la estructura alcista inmediata sigue intacta. El interés abierto se mantiene firme en 484 millones. Esto nos dice que hay suficiente respaldo y confianza en la zona alta, impidiendo que el precio caiga de golpe como ficha de dominó por falta de compradores.
Para mantener la continuidad alcista hacia el rango de los $0,29 - $0,30, el activo necesita sostener los $0,270 - $0,272 como nuevo soporte. Si el agotamiento del indicador diario fuerza un enfriamiento, la zona de retroceso saludable se sitúa hacia la MA(25) de 4h cerca de los $0,251.
¡Déjame tu entrada en los comentarios!
#ADAGains10%Above$0.27
ALØNDRACRYPTØ1
·6 me gusta
·4.1k vistas
ETHUp70%InQ3ButLiquidityFalls
48,228 vistas
597 están debatiendo
EthStakingExitQueueHits2026High
17,615 vistas
495 están debatiendo