
Hassan v277
671 Publicaciones

Hassan v277
Denunciar
Bloquear usuario
Hlw Assalamualaikum I am posting daily fresh News follow me for daily News
Abrir trade

Holder de ACE
Trader frecuente
3.7 año(s)
4 Siguiendo
229 Seguidores
1.0K+ Me gusta
Publicaciones
Cartera
Todo
Citas
Videos
·
--
Ver traducción
Ethereum Price Faces a Reality Check as EIP-8288 Puts Its Technology to the Test
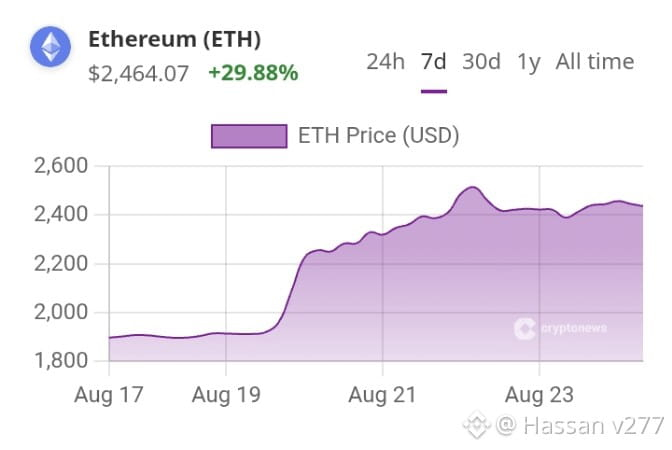
Ethereum price is trading at $2,465, steady and calm on the surface. Underneath it, the network is being asked a much harder question: can it actually deliver post-quantum cryptography at scale, or is this another roadmap promise that outruns its execution timeline?
The catalyst is EIP-8288, a proposal from Vitalik Buterin introducing a recursive STARK aggregation mempool framework designed to make Ethereum more quantum-resistant and more efficient at processing cryptographic proofs. The proposal merged into the official EIP repository on September 9, 2026.
Can Ethereum Price Hit $2,600 This Week?
ETH sits at $2,465, essentially flat on the day, with volume holding near $15.82 billion across major venues. Technically, the setup is a coiled range: resistance clusters around $2,544–$2,600, with a breakout above $2,600 needed to open a run toward $2,800. Support sits at $2,438–$2,440, reinforced by the 50-week moving average and a Fibonacci cluster.
The bull case sees EIP-8288 gaining developer traction while softer CPI data helps ETH clear $2,550, opening targets at $2,656 and $2,786. The base case has ETH chopping between $2,440 and $2,550 as traders wait for clearer roadmap signals.
Ethereum Price Faces a Reality Check as EIP-8288 Puts Its Technology to the Test
Ethereum price is trading at $2,465, steady and calm on the surface. Underneath it, the network is being asked a much harder question: can it actually deliver post-quantum cryptography at scale, or is this another roadmap promise that outruns its execution timeline?
The catalyst is EIP-8288, a proposal from Vitalik Buterin introducing a recursive STARK aggregation mempool framework designed to make Ethereum more quantum-resistant and more efficient at processing cryptographic proofs. The proposal merged into the official EIP repository on September 9, 2026.
Can Ethereum Price Hit $2,600 This Week?
ETH sits at $2,465, essentially flat on the day, with volume holding near $15.82 billion across major venues. Technically, the setup is a coiled range: resistance clusters around $2,544–$2,600, with a breakout above $2,600 needed to open a run toward $2,800. Support sits at $2,438–$2,440, reinforced by the 50-week moving average and a Fibonacci cluster.
The bull case sees EIP-8288 gaining developer traction while softer CPI data helps ETH clear $2,550, opening targets at $2,656 and $2,786. The base case has ETH chopping between $2,440 and $2,550 as traders wait for clearer roadmap signals.
Ethereum price is trading at $2,465, steady and calm on the surface. Underneath it, the network is being asked a much harder question: can it actually deliver post-quantum cryptography at scale, or is this another roadmap promise that outruns its execution timeline?
The catalyst is EIP-8288, a proposal from Vitalik Buterin introducing a recursive STARK aggregation mempool framework designed to make Ethereum more quantum-resistant and more efficient at processing cryptographic proofs. The proposal merged into the official EIP repository on September 9, 2026.
Can Ethereum Price Hit $2,600 This Week?
ETH sits at $2,465, essentially flat on the day, with volume holding near $15.82 billion across major venues. Technically, the setup is a coiled range: resistance clusters around $2,544–$2,600, with a breakout above $2,600 needed to open a run toward $2,800. Support sits at $2,438–$2,440, reinforced by the 50-week moving average and a Fibonacci cluster.
The bull case sees EIP-8288 gaining developer traction while softer CPI data helps ETH clear $2,550, opening targets at $2,656 and $2,786. The base case has ETH chopping between $2,440 and $2,550 as traders wait for clearer roadmap signals.

54
·
--
Ver traducción
Bitcoin tests critical $76,000 support cluster during macro energy shock
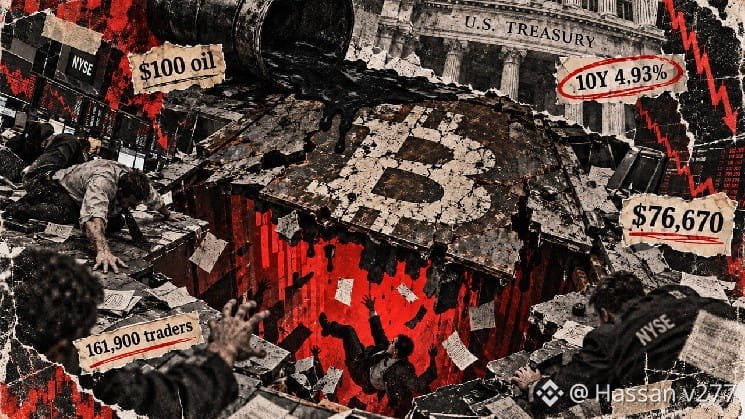
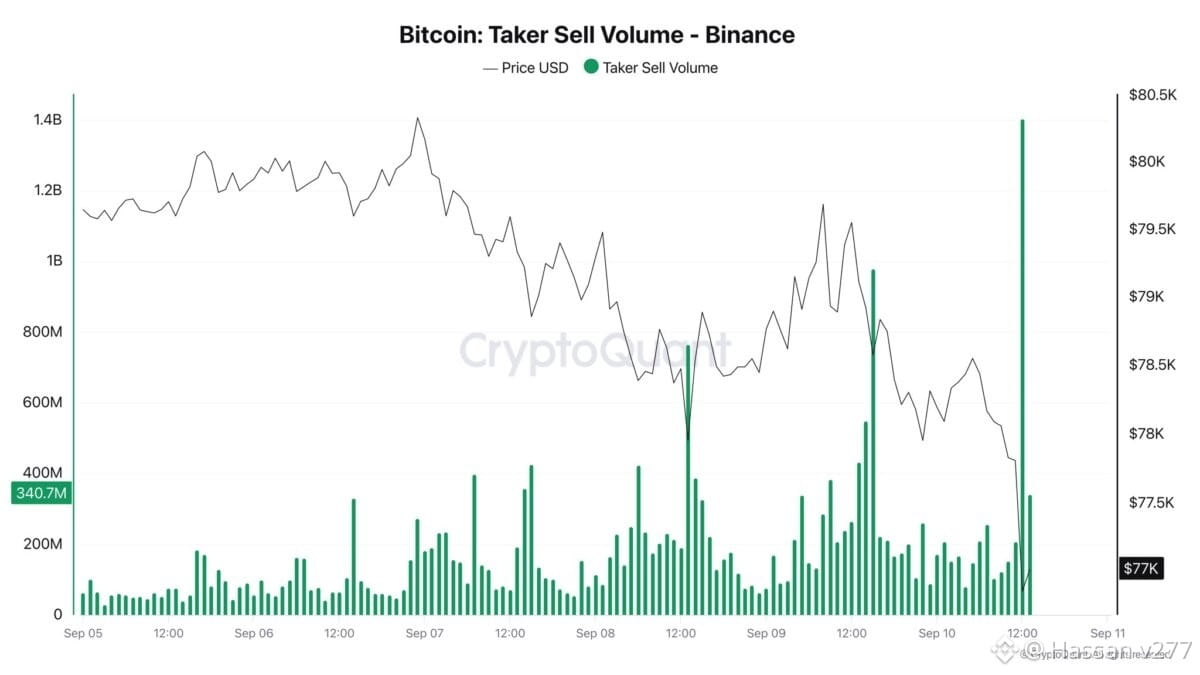
Bitcoin fell below $77,000 on Sept. 10 as oil rose above $100, and a global bond selloff pushed traders toward another Fed hike.
$BTC reached an intraday low of $76,676.07, Nasdaq 100 futures fell 0.7%, and the 10-year Treasury yield climbed to 4.93% while the 30-year touched 5.35%, its highest level in 19 years.
The moves followed another acceleration in US producer prices and a renewed surge in crude, pushing rate markets to price in about a 76% chance of a quarter-point Federal Reserve increase next week.
Chart shows Bitcoin’s Binance taker sell volume spiking near $1.4 billion as its price fell toward $77,000 on Sept. 10. Source: CryptoQuant
The selloff has also pushed Bitcoin back into a price zone where recent buyers had been accumulating coins.
Glassnode data show supply building between roughly $76,000 and $82,000 beneath a much heavier long-term-holder block between $83,000 and $86,000, where about 1.07 million $BTC were acquired.
That leaves the Sept. 10 decline testing a support cluster that formed during the latest recovery.
Bitcoin tests critical $76,000 support cluster during macro energy shock
Bitcoin fell below $77,000 on Sept. 10 as oil rose above $100, and a global bond selloff pushed traders toward another Fed hike.
$BTC reached an intraday low of $76,676.07, Nasdaq 100 futures fell 0.7%, and the 10-year Treasury yield climbed to 4.93% while the 30-year touched 5.35%, its highest level in 19 years.
The moves followed another acceleration in US producer prices and a renewed surge in crude, pushing rate markets to price in about a 76% chance of a quarter-point Federal Reserve increase next week.
Chart shows Bitcoin’s Binance taker sell volume spiking near $1.4 billion as its price fell toward $77,000 on Sept. 10. Source: CryptoQuant
The selloff has also pushed Bitcoin back into a price zone where recent buyers had been accumulating coins.
Glassnode data show supply building between roughly $76,000 and $82,000 beneath a much heavier long-term-holder block between $83,000 and $86,000, where about 1.07 million $BTC were acquired.
That leaves the Sept. 10 decline testing a support cluster that formed during the latest recovery.
Bitcoin fell below $77,000 on Sept. 10 as oil rose above $100, and a global bond selloff pushed traders toward another Fed hike.
$BTC reached an intraday low of $76,676.07, Nasdaq 100 futures fell 0.7%, and the 10-year Treasury yield climbed to 4.93% while the 30-year touched 5.35%, its highest level in 19 years.
The moves followed another acceleration in US producer prices and a renewed surge in crude, pushing rate markets to price in about a 76% chance of a quarter-point Federal Reserve increase next week.
Chart shows Bitcoin’s Binance taker sell volume spiking near $1.4 billion as its price fell toward $77,000 on Sept. 10. Source: CryptoQuant
The selloff has also pushed Bitcoin back into a price zone where recent buyers had been accumulating coins.
Glassnode data show supply building between roughly $76,000 and $82,000 beneath a much heavier long-term-holder block between $83,000 and $86,000, where about 1.07 million $BTC were acquired.
That leaves the Sept. 10 decline testing a support cluster that formed during the latest recovery.
57
·
--
Ver traducción
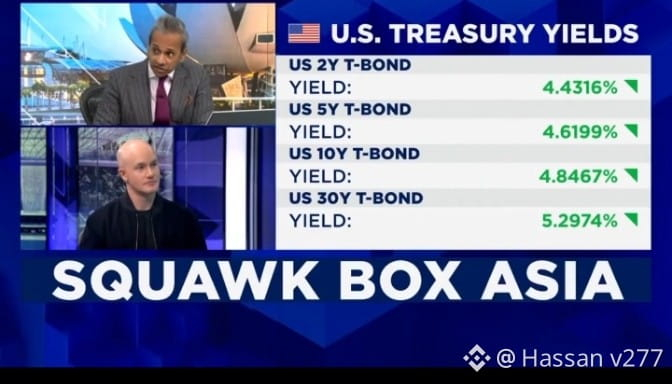
🚨JUST IN: Coinbase CEO Brian Armstrong says crypto wins no matter how the CLARITY Act vote turns out.
“If it passes, we get legislation,”
“If it doesn’t pass, the SEC and CFTC are ready to issue rules.”
Armstrong said the Sept. 15 Senate vote will bring regulatory clarity regardless of the outcome while speaking on CNBC early Thursday morning.
He added that the bill is “ready to get a YES vote,” saying the senators he has spoken with are on board.
Armstrong said the main issue still standing in the way is ethics rules for government officials holding digital assets.
🚨JUST IN: Coinbase CEO Brian Armstrong says crypto wins no matter how the CLARITY Act vote turns out.
“If it passes, we get legislation,”
“If it doesn’t pass, the SEC and CFTC are ready to issue rules.”
Armstrong said the Sept. 15 Senate vote will bring regulatory clarity regardless of the outcome while speaking on CNBC early Thursday morning.
He added that the bill is “ready to get a YES vote,” saying the senators he has spoken with are on board.
Armstrong said the main issue still standing in the way is ethics rules for government officials holding digital assets.
“If it passes, we get legislation,”
“If it doesn’t pass, the SEC and CFTC are ready to issue rules.”
Armstrong said the Sept. 15 Senate vote will bring regulatory clarity regardless of the outcome while speaking on CNBC early Thursday morning.
He added that the bill is “ready to get a YES vote,” saying the senators he has spoken with are on board.
Armstrong said the main issue still standing in the way is ethics rules for government officials holding digital assets.

Best Wishes!
De Hassan v277
2
·
--
Ver traducción
🚨🇮🇷💥IRAN GOES CRYPTO💥 🇮🇷🚨
Iran is turning to crypto to keep cross-border trade moving under U.S. sanctions, according to the Financial Times.
USDT and Bitcoin are being used for settlements.
Sanctions are closing doors.
CRYPTO IS OPENING NEW ONES. 🌎🔥
🚨🇮🇷💥IRAN GOES CRYPTO💥 🇮🇷🚨
Iran is turning to crypto to keep cross-border trade moving under U.S. sanctions, according to the Financial Times.
USDT and Bitcoin are being used for settlements.
Sanctions are closing doors.
CRYPTO IS OPENING NEW ONES. 🌎🔥
Iran is turning to crypto to keep cross-border trade moving under U.S. sanctions, according to the Financial Times.
USDT and Bitcoin are being used for settlements.
Sanctions are closing doors.
CRYPTO IS OPENING NEW ONES. 🌎🔥


Best Wishes!
De Hassan v277
3
·
--
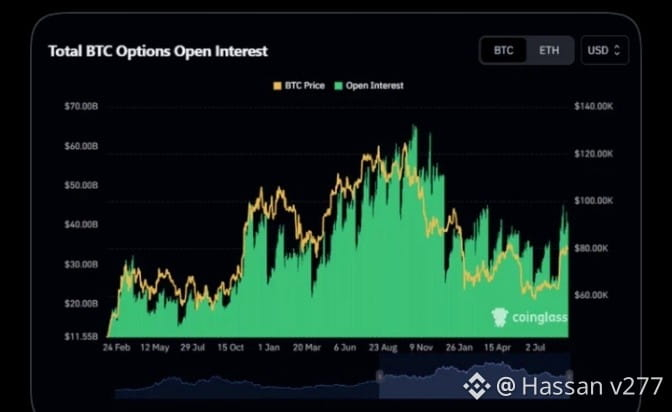
🐋 OBSERVACIÓN DE BALLENAS: el interés abierto de opciones sobre $BTC está rebotando con fuerza. Al observar el gráfico, el interés abierto total de opciones sobre Bitcoin ya volvió a subir al rango de aproximadamente 40 a 45 mil millones de USD después de haber caído significativamente desde el máximo por encima de 60 mil millones de USD. En particular, el OI se está recuperando mientras el BTC también rebota alrededor del nivel de 80 000 USD. Esto indica que la actividad en el mercado de opciones se está intensificando y que se están abriendo más posiciones. Sin embargo, un aumento del OI no significa automáticamente que el BTC vaya a subir. Solo muestra que el capital y las posiciones se están acumulando con más fuerza, lo que hace que las fluctuaciones posteriores sean aún más importantes de vigilar. ¿El BTC se está preparando para una ruptura importante o el mercado de derivados simplemente se está llenando demasiado otra vez?
🐋 OBSERVACIÓN DE BALLENAS: el interés abierto de opciones sobre $BTC está rebotando con fuerza. Al observar el gráfico, el interés abierto total de opciones sobre Bitcoin ya volvió a subir al rango de aproximadamente 40 a 45 mil millones de USD después de haber caído significativamente desde el máximo por encima de 60 mil millones de USD. En particular, el OI se está recuperando mientras el BTC también rebota alrededor del nivel de 80 000 USD. Esto indica que la actividad en el mercado de opciones se está intensificando y que se están abriendo más posiciones. Sin embargo, un aumento del OI no significa automáticamente que el BTC vaya a subir. Solo muestra que el capital y las posiciones se están acumulando con más fuerza, lo que hace que las fluctuaciones posteriores sean aún más importantes de vigilar. ¿El BTC se está preparando para una ruptura importante o el mercado de derivados simplemente se está llenando demasiado otra vez?
63
·
--
El Interés Institucional en las Criptomonedas Está Aumentando; ¡$6.7 Mil Millones de Capital Institucional Inyectado en el Mercado Cripto en los Últimos 30 Días! Aquí Tienes los...
BIT, la plataforma de opciones de criptomonedas anteriormente conocida como Matrixport, anunció que los inversores institucionales inyectaron un total de $6.7 mil millones en el mercado de criptomonedas durante los últimos 30 días. Los datos indican que el mercado ha vuelto a una tendencia neta de compra después de experimentar importantes salidas de capital en junio.
Los cálculos de BIT revelan esta entrada de capital en función de la suma de las compras de Bitcoin de Strategy, las entradas netas en los ETFs spot de Bitcoin y las nuevas emisiones de stablecoins. Una evaluación combinada de estos tres indicadores sugiere que el capital institucional empieza a redirigirse hacia los criptoactivos.
En junio, el mercado de criptomonedas experimentó una salida neta de capital de aproximadamente $13 mil millones. Sin embargo, la entrada de $6.7 mil millones en los últimos 30 días indica un cambio significativo en la dinámica del mercado. Esto sugiere que la tendencia predominantemente vendedora se está sustituyendo gradualmente por una tendencia neta de compra y de entrada de capital.
BIT señaló que la mejora en las entradas de capital ha respaldado la reciente recuperación del sentimiento del mercado. El retorno de los fondos institucionales al mercado está contribuyendo especialmente a limitar los movimientos a la baja en el precio de Bitcoin y a generar soporte en ciertos niveles.
Sin embargo, BIT indicó que para que Bitcoin muestre una tendencia alcista más fuerte y sostenida, el ritmo actual de entradas de capital necesita acelerarse aún más. Según la empresa, aunque la entrada de $6.7 mil millones respalda el panorama del mercado, una recuperación más amplia requiere una aceleración de los flujos de capital institucional.
El Interés Institucional en las Criptomonedas Está Aumentando; ¡$6.7 Mil Millones de Capital Institucional Inyectado en el Mercado Cripto en los Últimos 30 Días! Aquí Tienes los...
BIT, la plataforma de opciones de criptomonedas anteriormente conocida como Matrixport, anunció que los inversores institucionales inyectaron un total de $6.7 mil millones en el mercado de criptomonedas durante los últimos 30 días. Los datos indican que el mercado ha vuelto a una tendencia neta de compra después de experimentar importantes salidas de capital en junio.
Los cálculos de BIT revelan esta entrada de capital en función de la suma de las compras de Bitcoin de Strategy, las entradas netas en los ETFs spot de Bitcoin y las nuevas emisiones de stablecoins. Una evaluación combinada de estos tres indicadores sugiere que el capital institucional empieza a redirigirse hacia los criptoactivos.
En junio, el mercado de criptomonedas experimentó una salida neta de capital de aproximadamente $13 mil millones. Sin embargo, la entrada de $6.7 mil millones en los últimos 30 días indica un cambio significativo en la dinámica del mercado. Esto sugiere que la tendencia predominantemente vendedora se está sustituyendo gradualmente por una tendencia neta de compra y de entrada de capital.
BIT señaló que la mejora en las entradas de capital ha respaldado la reciente recuperación del sentimiento del mercado. El retorno de los fondos institucionales al mercado está contribuyendo especialmente a limitar los movimientos a la baja en el precio de Bitcoin y a generar soporte en ciertos niveles.
Sin embargo, BIT indicó que para que Bitcoin muestre una tendencia alcista más fuerte y sostenida, el ritmo actual de entradas de capital necesita acelerarse aún más. Según la empresa, aunque la entrada de $6.7 mil millones respalda el panorama del mercado, una recuperación más amplia requiere una aceleración de los flujos de capital institucional.
BIT, la plataforma de opciones de criptomonedas anteriormente conocida como Matrixport, anunció que los inversores institucionales inyectaron un total de $6.7 mil millones en el mercado de criptomonedas durante los últimos 30 días. Los datos indican que el mercado ha vuelto a una tendencia neta de compra después de experimentar importantes salidas de capital en junio.
Los cálculos de BIT revelan esta entrada de capital en función de la suma de las compras de Bitcoin de Strategy, las entradas netas en los ETFs spot de Bitcoin y las nuevas emisiones de stablecoins. Una evaluación combinada de estos tres indicadores sugiere que el capital institucional empieza a redirigirse hacia los criptoactivos.
En junio, el mercado de criptomonedas experimentó una salida neta de capital de aproximadamente $13 mil millones. Sin embargo, la entrada de $6.7 mil millones en los últimos 30 días indica un cambio significativo en la dinámica del mercado. Esto sugiere que la tendencia predominantemente vendedora se está sustituyendo gradualmente por una tendencia neta de compra y de entrada de capital.
BIT señaló que la mejora en las entradas de capital ha respaldado la reciente recuperación del sentimiento del mercado. El retorno de los fondos institucionales al mercado está contribuyendo especialmente a limitar los movimientos a la baja en el precio de Bitcoin y a generar soporte en ciertos niveles.
Sin embargo, BIT indicó que para que Bitcoin muestre una tendencia alcista más fuerte y sostenida, el ritmo actual de entradas de capital necesita acelerarse aún más. Según la empresa, aunque la entrada de $6.7 mil millones respalda el panorama del mercado, una recuperación más amplia requiere una aceleración de los flujos de capital institucional.

Best Wishes!
De Hassan v277
4
·
--
Ver traducción
Bitcoin recovers toward $79,000 as Zcash records a $500 million ETF haul
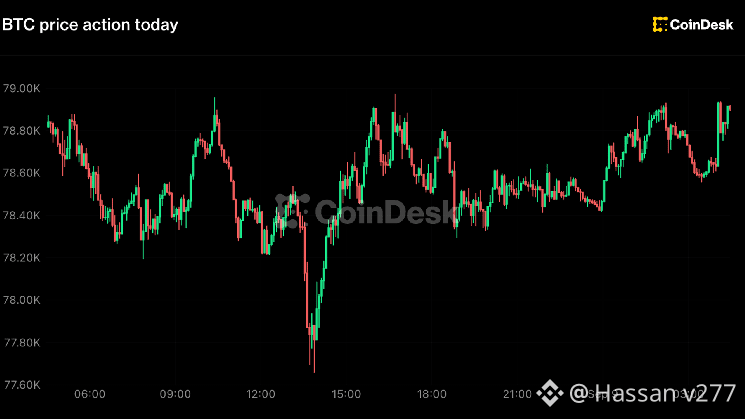
Bitcoin dropped below $78,000 on Tuesday, hitting $77,666 before buyers took it back to nearly $78,900 as of Asian morning hours on Wednesday, according to CoinDesk data.
The round trip left the token little changed over 24 hours and just under 2% higher on the week. The money that moved went to zcash, where Grayscale said its Zcash ETF crossed $500 million in assets two weeks after listing on NYSE Arca.
The fund, trading under ZCSH, took in more than $70 million of cumulative inflows since its Aug. 25 debut on top of a $100 million investment from DCG International Investments, according to Grayscale
We're proud to share The Zcash ETF $ZCSH has crossed $500M+ in AUM.
The only $ZEC fund in the world now holds over 550,000 $ZEC.
This milestone reflects continued investor conviction in Zcash and the demand for privacy in the digital asset ecosystem.
Full announcement… pic.twitter.com/mnaVl5d3tV
— The Zcash ETF 🛡️ (@ZcashETF) September 8, 2026
It now holds more than 550,000 $ZEC, or roughly 3% of the token's 16.9 million circulating supply, pulled out of float in a fortnight. $ZEC traded past $1,180 on the day, up more than 4%, with about $1 billion in 24-hour volume against a $20 billion market value that has carried it to tenth largest in the past week.
BNB was the standout among the rest at about $755, up nearly 2%, while tron added more than 1% to roughly 34 cents and XRP gained about 1% to $1.42. Ether held near $2,490 and solana near $103, both close to unchanged. Dogecoin sat near 9 cents and hyperliquid's HYPE edged up to almost $86. Total market value stood at about $2.8 trillion.
Bitcoin recovers toward $79,000 as Zcash records a $500 million ETF haul
Bitcoin dropped below $78,000 on Tuesday, hitting $77,666 before buyers took it back to nearly $78,900 as of Asian morning hours on Wednesday, according to CoinDesk data.
The round trip left the token little changed over 24 hours and just under 2% higher on the week. The money that moved went to zcash, where Grayscale said its Zcash ETF crossed $500 million in assets two weeks after listing on NYSE Arca.
The fund, trading under ZCSH, took in more than $70 million of cumulative inflows since its Aug. 25 debut on top of a $100 million investment from DCG International Investments, according to Grayscale
We're proud to share The Zcash ETF $ZCSH has crossed $500M+ in AUM.
The only $ZEC fund in the world now holds over 550,000 $ZEC.
This milestone reflects continued investor conviction in Zcash and the demand for privacy in the digital asset ecosystem.
Full announcement… pic.twitter.com/mnaVl5d3tV
— The Zcash ETF 🛡️ (@ZcashETF) September 8, 2026
It now holds more than 550,000 $ZEC, or roughly 3% of the token's 16.9 million circulating supply, pulled out of float in a fortnight. $ZEC traded past $1,180 on the day, up more than 4%, with about $1 billion in 24-hour volume against a $20 billion market value that has carried it to tenth largest in the past week.
BNB was the standout among the rest at about $755, up nearly 2%, while tron added more than 1% to roughly 34 cents and XRP gained about 1% to $1.42. Ether held near $2,490 and solana near $103, both close to unchanged. Dogecoin sat near 9 cents and hyperliquid's HYPE edged up to almost $86. Total market value stood at about $2.8 trillion.
Bitcoin dropped below $78,000 on Tuesday, hitting $77,666 before buyers took it back to nearly $78,900 as of Asian morning hours on Wednesday, according to CoinDesk data.
The round trip left the token little changed over 24 hours and just under 2% higher on the week. The money that moved went to zcash, where Grayscale said its Zcash ETF crossed $500 million in assets two weeks after listing on NYSE Arca.
The fund, trading under ZCSH, took in more than $70 million of cumulative inflows since its Aug. 25 debut on top of a $100 million investment from DCG International Investments, according to Grayscale
We're proud to share The Zcash ETF $ZCSH has crossed $500M+ in AUM.
The only $ZEC fund in the world now holds over 550,000 $ZEC.
This milestone reflects continued investor conviction in Zcash and the demand for privacy in the digital asset ecosystem.
Full announcement… pic.twitter.com/mnaVl5d3tV
— The Zcash ETF 🛡️ (@ZcashETF) September 8, 2026
It now holds more than 550,000 $ZEC, or roughly 3% of the token's 16.9 million circulating supply, pulled out of float in a fortnight. $ZEC traded past $1,180 on the day, up more than 4%, with about $1 billion in 24-hour volume against a $20 billion market value that has carried it to tenth largest in the past week.
BNB was the standout among the rest at about $755, up nearly 2%, while tron added more than 1% to roughly 34 cents and XRP gained about 1% to $1.42. Ether held near $2,490 and solana near $103, both close to unchanged. Dogecoin sat near 9 cents and hyperliquid's HYPE edged up to almost $86. Total market value stood at about $2.8 trillion.
Best Wishes!
De Hassan v277
8
·
--
Ver traducción
Big Bull Tom Lee’s $6,000 Scenario for Ethereum: He Listed 4 Catalysts! Here Are the Details
Leading cryptocurrency Bitcoin is trading below the $80,000 level, influenced by upcoming US inflation data and increasing expectations of a Fed interest rate hike. Altcoins are showing mixed performance, while Ethereum is moving sideways around the $2,480 level.
However, BitMine President Tom Lee stated that Ethereum has significant upside potential, listing four key catalysts that could support the $ETH price.
In a recent interview, Lee stated that the price of $ETH could reach approximately $6,000.
The First Catalyst: “CLARITY Act”
The first development Lee highlighted was the CLARITY Act, the most important law expected to clarify the regulatory framework for cryptocurrencies in the US.
Lee believes that the passage of the law in September could significantly increase Wall Street’s interest in the crypto market. According to Lee, the removal of regulatory uncertainty could pave the way for larger financial institutions to operate more extensively in the crypto market.
The Second Catalyst: “Waiting Capital!”
Lee’s second catalyst was the unwinding of capital and short positions that had not yet entered the market and were sitting idle, redirecting them back into crypto assets. According to Lee, some investors stayed out of the crypto market after the previous downturn, and the sustained increase in prices could encourage these investors to return.
Lee notes that investors, particularly those expecting a potential bottom in October due to the traditional four-year cycle in the crypto market, may be forced to change their positions sooner if the market remains strong, potentially driving the price up.
Big Bull Tom Lee’s $6,000 Scenario for Ethereum: He Listed 4 Catalysts! Here Are the Details
Leading cryptocurrency Bitcoin is trading below the $80,000 level, influenced by upcoming US inflation data and increasing expectations of a Fed interest rate hike. Altcoins are showing mixed performance, while Ethereum is moving sideways around the $2,480 level.
However, BitMine President Tom Lee stated that Ethereum has significant upside potential, listing four key catalysts that could support the $ETH price.
In a recent interview, Lee stated that the price of $ETH could reach approximately $6,000.
The First Catalyst: “CLARITY Act”
The first development Lee highlighted was the CLARITY Act, the most important law expected to clarify the regulatory framework for cryptocurrencies in the US.
Lee believes that the passage of the law in September could significantly increase Wall Street’s interest in the crypto market. According to Lee, the removal of regulatory uncertainty could pave the way for larger financial institutions to operate more extensively in the crypto market.
The Second Catalyst: “Waiting Capital!”
Lee’s second catalyst was the unwinding of capital and short positions that had not yet entered the market and were sitting idle, redirecting them back into crypto assets. According to Lee, some investors stayed out of the crypto market after the previous downturn, and the sustained increase in prices could encourage these investors to return.
Lee notes that investors, particularly those expecting a potential bottom in October due to the traditional four-year cycle in the crypto market, may be forced to change their positions sooner if the market remains strong, potentially driving the price up.
Leading cryptocurrency Bitcoin is trading below the $80,000 level, influenced by upcoming US inflation data and increasing expectations of a Fed interest rate hike. Altcoins are showing mixed performance, while Ethereum is moving sideways around the $2,480 level.
However, BitMine President Tom Lee stated that Ethereum has significant upside potential, listing four key catalysts that could support the $ETH price.
In a recent interview, Lee stated that the price of $ETH could reach approximately $6,000.
The First Catalyst: “CLARITY Act”
The first development Lee highlighted was the CLARITY Act, the most important law expected to clarify the regulatory framework for cryptocurrencies in the US.
Lee believes that the passage of the law in September could significantly increase Wall Street’s interest in the crypto market. According to Lee, the removal of regulatory uncertainty could pave the way for larger financial institutions to operate more extensively in the crypto market.
The Second Catalyst: “Waiting Capital!”
Lee’s second catalyst was the unwinding of capital and short positions that had not yet entered the market and were sitting idle, redirecting them back into crypto assets. According to Lee, some investors stayed out of the crypto market after the previous downturn, and the sustained increase in prices could encourage these investors to return.
Lee notes that investors, particularly those expecting a potential bottom in October due to the traditional four-year cycle in the crypto market, may be forced to change their positions sooner if the market remains strong, potentially driving the price up.

free gifts daliy
De Hassan v277
15
·
--
Bajista
Precio del Bitcoin hoy: $79,414 mantiene la tendencia, pero el impulso se está resquebrajando
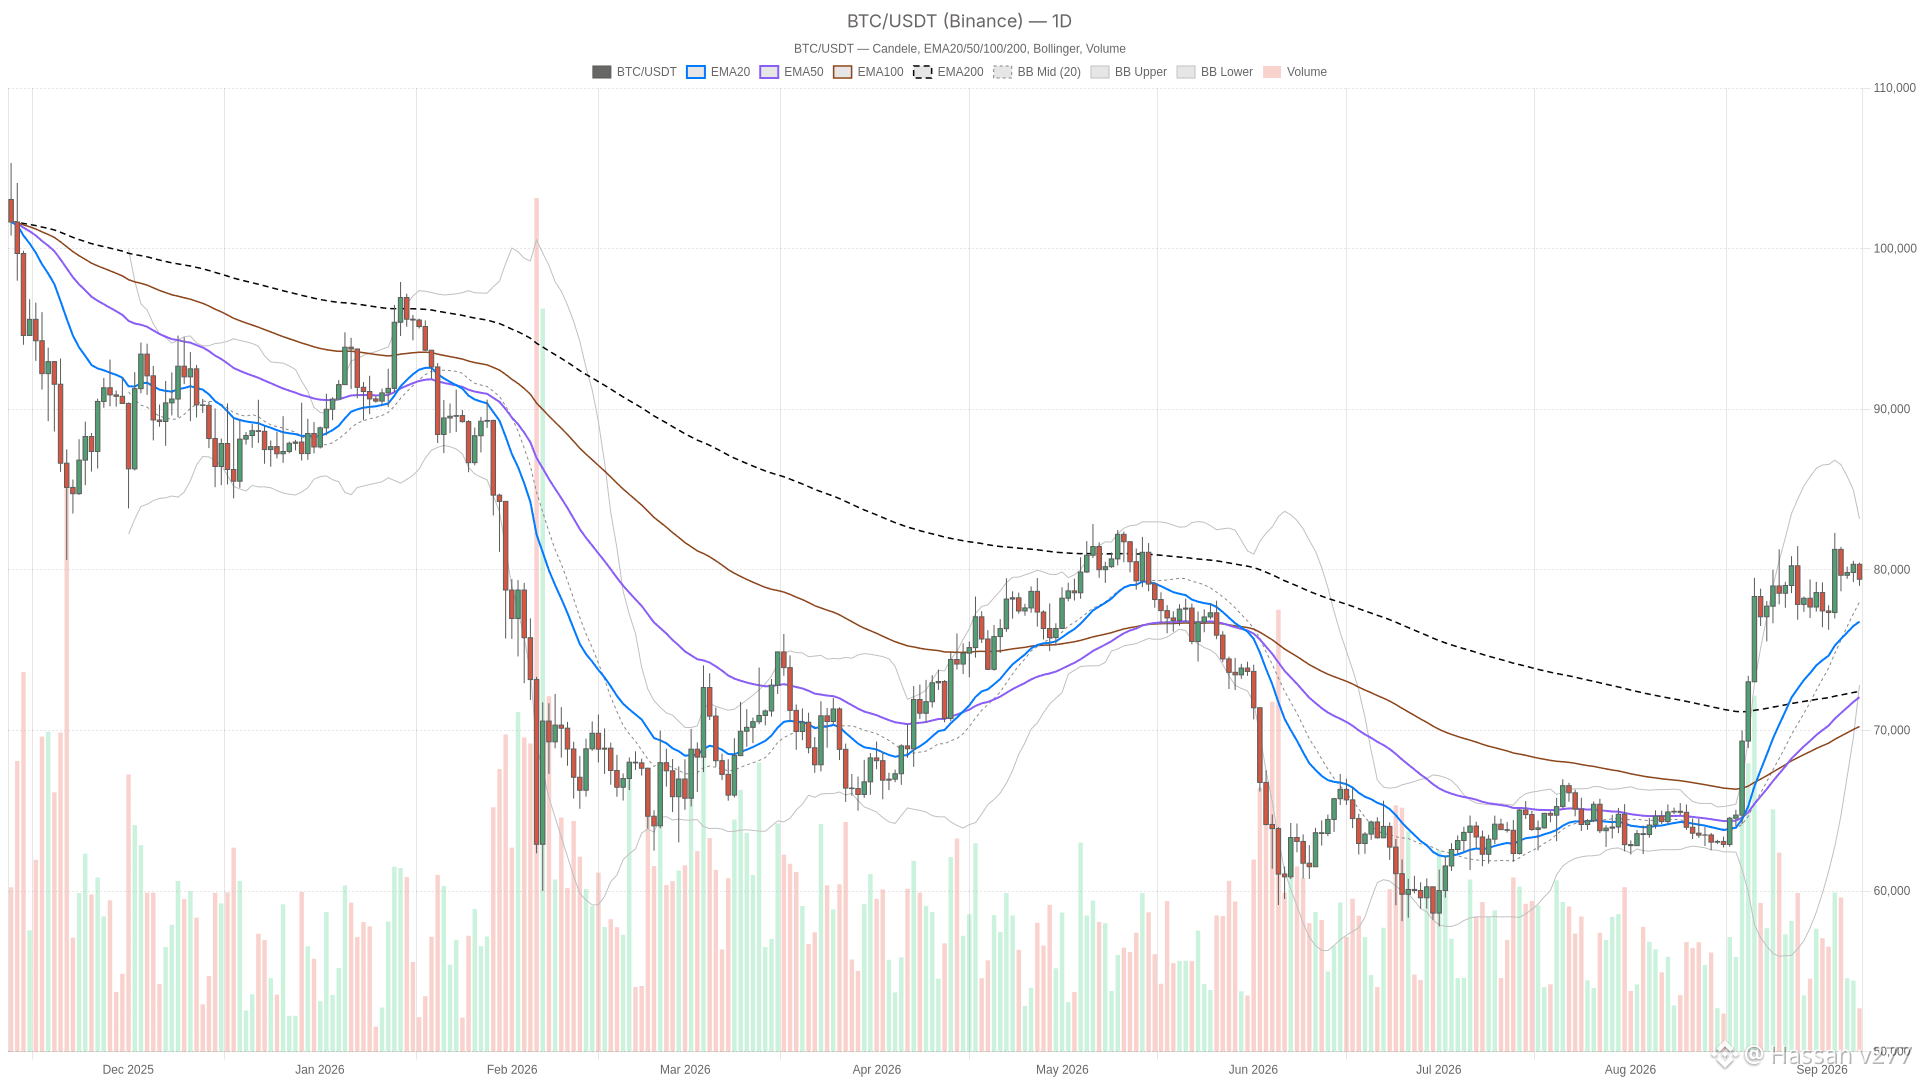
Observando el 7 de septiembre de 2026, el precio del Bitcoin hoy se sitúa en $79,414.14, un nivel que mantiene técnicamente vivo el impulso alcista de varios meses, incluso mientras los marcos temporales más cortos empiezan a mostrar señales de advertencia por debajo de la superficie.
Conclusiones clave
El Bitcoin cotiza a $79,414.14 el 7 de septiembre de 2026, manteniéndose por encima de su EMA20, EMA50 y EMA200 en el gráfico diario.
El RSI14 diario en 63.91 sigue siendo alcista sin estar sobrecomprado, aunque el histograma del MACD se ha vuelto negativo en -241.15.
La capitalización total del mercado cripto cayó un 3.12% en 24 horas, hasta aproximadamente $2.69 billones, con una dominancia de Bitcoin del 59.12%.
La estrategia, liderada por Michael Saylor, reinició su programa de compras con una adquisición de $370 millones a finales de agosto.
El Índice de Miedo y Codicia marca 71 (“Codicia”), aunque los marcos temporales de corto plazo muestran una alineación bajista.
Gráfico diario: $BTC todavía monta la tendencia alcista, pero el impulso se está debilitando
La pila de EMA en el diario — precio por encima de las de 20, 50 y 200 — es la señal alcista más clara en el tablero. Indica que la tendencia general no se ha roto. El RSI14 en 63.91 respalda eso: firme y con sesgo alcista, sin estar estirado hacia una zona de sobrecompra. CNBC señaló que el Bitcoin iba camino de su tercera semana consecutiva de ganancias incluso mientras aumentan las presiones macro, capturando un mercado que sigue siendo alcista en el panorama general pero pierde fuerza por debajo. Eso deja espacio para un alza adicional si los compradores vuelven a entrar.
Precio del Bitcoin hoy: $79,414 mantiene la tendencia, pero el impulso se está resquebrajando
Observando el 7 de septiembre de 2026, el precio del Bitcoin hoy se sitúa en $79,414.14, un nivel que mantiene técnicamente vivo el impulso alcista de varios meses, incluso mientras los marcos temporales más cortos empiezan a mostrar señales de advertencia por debajo de la superficie.
Conclusiones clave
El Bitcoin cotiza a $79,414.14 el 7 de septiembre de 2026, manteniéndose por encima de su EMA20, EMA50 y EMA200 en el gráfico diario.
El RSI14 diario en 63.91 sigue siendo alcista sin estar sobrecomprado, aunque el histograma del MACD se ha vuelto negativo en -241.15.
La capitalización total del mercado cripto cayó un 3.12% en 24 horas, hasta aproximadamente $2.69 billones, con una dominancia de Bitcoin del 59.12%.
La estrategia, liderada por Michael Saylor, reinició su programa de compras con una adquisición de $370 millones a finales de agosto.
El Índice de Miedo y Codicia marca 71 (“Codicia”), aunque los marcos temporales de corto plazo muestran una alineación bajista.
Gráfico diario: $BTC todavía monta la tendencia alcista, pero el impulso se está debilitando
La pila de EMA en el diario — precio por encima de las de 20, 50 y 200 — es la señal alcista más clara en el tablero. Indica que la tendencia general no se ha roto. El RSI14 en 63.91 respalda eso: firme y con sesgo alcista, sin estar estirado hacia una zona de sobrecompra. CNBC señaló que el Bitcoin iba camino de su tercera semana consecutiva de ganancias incluso mientras aumentan las presiones macro, capturando un mercado que sigue siendo alcista en el panorama general pero pierde fuerza por debajo. Eso deja espacio para un alza adicional si los compradores vuelven a entrar.
Observando el 7 de septiembre de 2026, el precio del Bitcoin hoy se sitúa en $79,414.14, un nivel que mantiene técnicamente vivo el impulso alcista de varios meses, incluso mientras los marcos temporales más cortos empiezan a mostrar señales de advertencia por debajo de la superficie.
Conclusiones clave
El Bitcoin cotiza a $79,414.14 el 7 de septiembre de 2026, manteniéndose por encima de su EMA20, EMA50 y EMA200 en el gráfico diario.
El RSI14 diario en 63.91 sigue siendo alcista sin estar sobrecomprado, aunque el histograma del MACD se ha vuelto negativo en -241.15.
La capitalización total del mercado cripto cayó un 3.12% en 24 horas, hasta aproximadamente $2.69 billones, con una dominancia de Bitcoin del 59.12%.
La estrategia, liderada por Michael Saylor, reinició su programa de compras con una adquisición de $370 millones a finales de agosto.
El Índice de Miedo y Codicia marca 71 (“Codicia”), aunque los marcos temporales de corto plazo muestran una alineación bajista.
Gráfico diario: $BTC todavía monta la tendencia alcista, pero el impulso se está debilitando
La pila de EMA en el diario — precio por encima de las de 20, 50 y 200 — es la señal alcista más clara en el tablero. Indica que la tendencia general no se ha roto. El RSI14 en 63.91 respalda eso: firme y con sesgo alcista, sin estar estirado hacia una zona de sobrecompra. CNBC señaló que el Bitcoin iba camino de su tercera semana consecutiva de ganancias incluso mientras aumentan las presiones macro, capturando un mercado que sigue siendo alcista en el panorama general pero pierde fuerza por debajo. Eso deja espacio para un alza adicional si los compradores vuelven a entrar.

follow me free gifts
De Hassan v277
4
·
--
Alcista
El repunte de altcoins del fin de semana se queda sin gasolina mientras el bitcoin cae
Bitcoin $BTC$79,394.02 cotiza alrededor de $79,300, el lunes, después de haber perdido un 1.3% de su valor desde la medianoche UTC. Pasó el fin de semana atrapado en un rango de negociación estrecho tras no lograr romper por encima de $81,400.
El retroceso del lunes coincide con un salto en los futuros de renta variable de EE. UU., con los futuros del Nasdaq 100 subiendo 0.3% desde la medianoche, extendiendo la divergencia de la semana pasada. El mercado está cerrado hoy por el feriado nacional del Día del Trabajo.
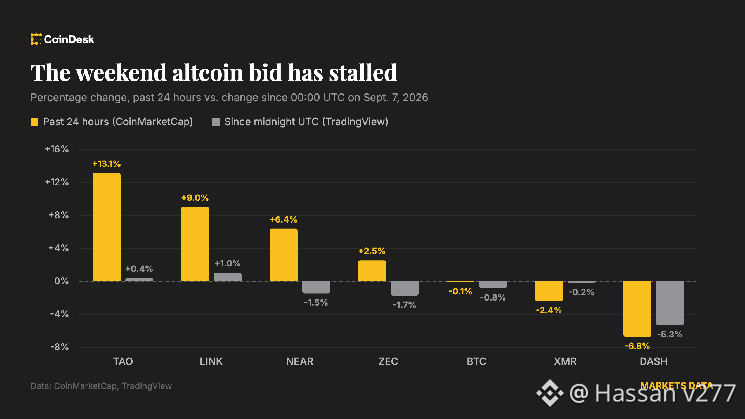
Las altcoins hicieron la mayor parte del trabajo durante el fin de semana y ahora están devolviendo parte de sus ganancias. Bittensor ($TAO), kaspa $KAS$0.03524, internet computer (ICP) y celestia (TIA) subieron más de 12% en las últimas 24 horas, pero la mayor parte de esos movimientos se produjo antes de la medianoche UTC. Desde entonces $TAO sube 0.4%, chainlink $LINK$13.26 sube 1% y $NEAR Protocol $NEAR$2.3548 ha caído 1.5%.
El sentimiento se vuelve bajista: La relación volumen compra-venta del tomador en los futuros cripto se inclina hacia posiciones cortas, con apuestas bajistas que representan el 51.6% del flujo. Eso marca un cambio frente a la lectura alcista del viernes. El catalizador probable es la escalada del fin de semana de las hostilidades entre EE. UU. e Irán, junto con los temores a un aumento de las tasas de la Fed, aunque esas preocupaciones parecen exageradas.
$BTC futuros ven salida de capital: El capital sigue saliendo de los futuros de bitcoin. El interés abierto (OI) cayó a 670K $BTC desde 709K el viernes, el nivel más bajo desde el 23 de marzo, según la fuente de datos Coinglass. Las tasas de financiamiento perpetuo anualizadas se acercan rápidamente a cero, perdiendo su sesgo alcista, como se aprecia en las lecturas recientes de 8% a 10%.
Ether, solana reflejan el movimiento: Los mercados de ether y solana muestran una dinámica similar.
Se enfría el $XRP interés abierto: El interés abierto en los futuros de $XRP también se ha enfriado, hasta 2.29 mil millones de tokens, el nivel más bajo desde el 7 de agosto y notablemente inferior al máximo de 2.78 mil millones a mediados de mes. El mensaje es claro: el capital está saliendo, dejando el precio de $XRP oscilando entre $1.35 y $1.45.
El repunte de altcoins del fin de semana se queda sin gasolina mientras el bitcoin cae
Bitcoin $BTC$79,394.02 cotiza alrededor de $79,300, el lunes, después de haber perdido un 1.3% de su valor desde la medianoche UTC. Pasó el fin de semana atrapado en un rango de negociación estrecho tras no lograr romper por encima de $81,400.
El retroceso del lunes coincide con un salto en los futuros de renta variable de EE. UU., con los futuros del Nasdaq 100 subiendo 0.3% desde la medianoche, extendiendo la divergencia de la semana pasada. El mercado está cerrado hoy por el feriado nacional del Día del Trabajo.
Las altcoins hicieron la mayor parte del trabajo durante el fin de semana y ahora están devolviendo parte de sus ganancias. Bittensor ($TAO), kaspa $KAS$0.03524, internet computer (ICP) y celestia (TIA) subieron más de 12% en las últimas 24 horas, pero la mayor parte de esos movimientos se produjo antes de la medianoche UTC. Desde entonces $TAO sube 0.4%, chainlink $LINK$13.26 sube 1% y $NEAR Protocol $NEAR$2.3548 ha caído 1.5%.
El sentimiento se vuelve bajista: La relación volumen compra-venta del tomador en los futuros cripto se inclina hacia posiciones cortas, con apuestas bajistas que representan el 51.6% del flujo. Eso marca un cambio frente a la lectura alcista del viernes. El catalizador probable es la escalada del fin de semana de las hostilidades entre EE. UU. e Irán, junto con los temores a un aumento de las tasas de la Fed, aunque esas preocupaciones parecen exageradas.
$BTC futuros ven salida de capital: El capital sigue saliendo de los futuros de bitcoin. El interés abierto (OI) cayó a 670K $BTC desde 709K el viernes, el nivel más bajo desde el 23 de marzo, según la fuente de datos Coinglass. Las tasas de financiamiento perpetuo anualizadas se acercan rápidamente a cero, perdiendo su sesgo alcista, como se aprecia en las lecturas recientes de 8% a 10%.
Ether, solana reflejan el movimiento: Los mercados de ether y solana muestran una dinámica similar.
Se enfría el $XRP interés abierto: El interés abierto en los futuros de $XRP también se ha enfriado, hasta 2.29 mil millones de tokens, el nivel más bajo desde el 7 de agosto y notablemente inferior al máximo de 2.78 mil millones a mediados de mes. El mensaje es claro: el capital está saliendo, dejando el precio de $XRP oscilando entre $1.35 y $1.45.
Bitcoin $BTC$79,394.02 cotiza alrededor de $79,300, el lunes, después de haber perdido un 1.3% de su valor desde la medianoche UTC. Pasó el fin de semana atrapado en un rango de negociación estrecho tras no lograr romper por encima de $81,400.
El retroceso del lunes coincide con un salto en los futuros de renta variable de EE. UU., con los futuros del Nasdaq 100 subiendo 0.3% desde la medianoche, extendiendo la divergencia de la semana pasada. El mercado está cerrado hoy por el feriado nacional del Día del Trabajo.
Las altcoins hicieron la mayor parte del trabajo durante el fin de semana y ahora están devolviendo parte de sus ganancias. Bittensor ($TAO), kaspa $KAS$0.03524, internet computer (ICP) y celestia (TIA) subieron más de 12% en las últimas 24 horas, pero la mayor parte de esos movimientos se produjo antes de la medianoche UTC. Desde entonces $TAO sube 0.4%, chainlink $LINK$13.26 sube 1% y $NEAR Protocol $NEAR$2.3548 ha caído 1.5%.
El sentimiento se vuelve bajista: La relación volumen compra-venta del tomador en los futuros cripto se inclina hacia posiciones cortas, con apuestas bajistas que representan el 51.6% del flujo. Eso marca un cambio frente a la lectura alcista del viernes. El catalizador probable es la escalada del fin de semana de las hostilidades entre EE. UU. e Irán, junto con los temores a un aumento de las tasas de la Fed, aunque esas preocupaciones parecen exageradas.
$BTC futuros ven salida de capital: El capital sigue saliendo de los futuros de bitcoin. El interés abierto (OI) cayó a 670K $BTC desde 709K el viernes, el nivel más bajo desde el 23 de marzo, según la fuente de datos Coinglass. Las tasas de financiamiento perpetuo anualizadas se acercan rápidamente a cero, perdiendo su sesgo alcista, como se aprecia en las lecturas recientes de 8% a 10%.
Ether, solana reflejan el movimiento: Los mercados de ether y solana muestran una dinámica similar.
Se enfría el $XRP interés abierto: El interés abierto en los futuros de $XRP también se ha enfriado, hasta 2.29 mil millones de tokens, el nivel más bajo desde el 7 de agosto y notablemente inferior al máximo de 2.78 mil millones a mediados de mes. El mensaje es claro: el capital está saliendo, dejando el precio de $XRP oscilando entre $1.35 y $1.45.
follow me free gifts
De Hassan v277
56
·
--
Alcista
Ver traducción
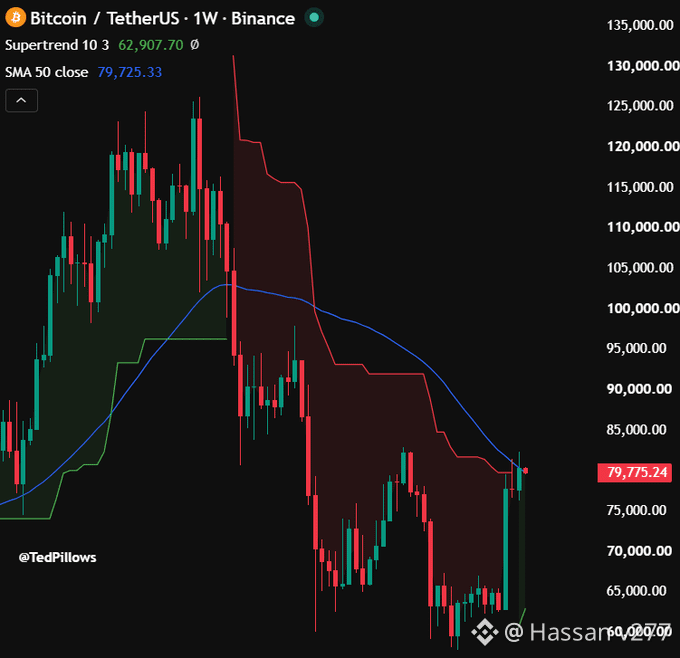
Bitcoin Price Prediction: Crypto Experts Say Buying and Holding Bitcoin Easily Beats Trying to Time the Market
Today’s Bitcoin price prediction has BTC USD price trading at $79,500, down -0.5% on the day, sitting just below the psychologically loaded $80k line. That’s the boring part. The interesting part, the part most traders never check, is how much of any given year’s return comes from a handful of days most people miss while they’re busy “waiting for confirmation.”
Bitwise Europe’s Andre Dragosch calls bitcoin “a relatively boring asset” for exactly this reason: most days are sideways noise, and the real performance loads into a few violent sessions.
Bitcoin is trading near $79,134, down almost 1% over the past 24 hours after briefly testing levels above $80,500. Range-bound trading has dominated recent sessions, with the market unable to decisively clear resistance stacked between $80,000 and $82,000.
Reuters’ technical mapping flags $82,793 as the key Fibonacci resistance, with support levels layered at $75,674 and $71,781 beneath current price action.
The bull case: a reclaim of the $79,730–$79,920 cluster confirms the reversal attempt from the $77,000 zone and opens a path toward $81,000+.
The base case: continued consolidation between $77,165 and $80,000 while the market digests macro noise, including fallout from recent jobs data and shifting ETF demand.
The bear case: a clean break below $77,165 reactivates downside risk toward the mid-$70,000s.
😊
Bitcoin Price Prediction: Crypto Experts Say Buying and Holding Bitcoin Easily Beats Trying to Time the Market
Today’s Bitcoin price prediction has BTC USD price trading at $79,500, down -0.5% on the day, sitting just below the psychologically loaded $80k line. That’s the boring part. The interesting part, the part most traders never check, is how much of any given year’s return comes from a handful of days most people miss while they’re busy “waiting for confirmation.”
Bitwise Europe’s Andre Dragosch calls bitcoin “a relatively boring asset” for exactly this reason: most days are sideways noise, and the real performance loads into a few violent sessions.
Bitcoin is trading near $79,134, down almost 1% over the past 24 hours after briefly testing levels above $80,500. Range-bound trading has dominated recent sessions, with the market unable to decisively clear resistance stacked between $80,000 and $82,000.
Reuters’ technical mapping flags $82,793 as the key Fibonacci resistance, with support levels layered at $75,674 and $71,781 beneath current price action.
The bull case: a reclaim of the $79,730–$79,920 cluster confirms the reversal attempt from the $77,000 zone and opens a path toward $81,000+.
The base case: continued consolidation between $77,165 and $80,000 while the market digests macro noise, including fallout from recent jobs data and shifting ETF demand.
The bear case: a clean break below $77,165 reactivates downside risk toward the mid-$70,000s.
😊
Today’s Bitcoin price prediction has BTC USD price trading at $79,500, down -0.5% on the day, sitting just below the psychologically loaded $80k line. That’s the boring part. The interesting part, the part most traders never check, is how much of any given year’s return comes from a handful of days most people miss while they’re busy “waiting for confirmation.”
Bitwise Europe’s Andre Dragosch calls bitcoin “a relatively boring asset” for exactly this reason: most days are sideways noise, and the real performance loads into a few violent sessions.
Bitcoin is trading near $79,134, down almost 1% over the past 24 hours after briefly testing levels above $80,500. Range-bound trading has dominated recent sessions, with the market unable to decisively clear resistance stacked between $80,000 and $82,000.
Reuters’ technical mapping flags $82,793 as the key Fibonacci resistance, with support levels layered at $75,674 and $71,781 beneath current price action.
The bull case: a reclaim of the $79,730–$79,920 cluster confirms the reversal attempt from the $77,000 zone and opens a path toward $81,000+.
The base case: continued consolidation between $77,165 and $80,000 while the market digests macro noise, including fallout from recent jobs data and shifting ETF demand.
The bear case: a clean break below $77,165 reactivates downside risk toward the mid-$70,000s.
😊
follow me free gifts
De Hassan v277
1
·
--
Ver traducción
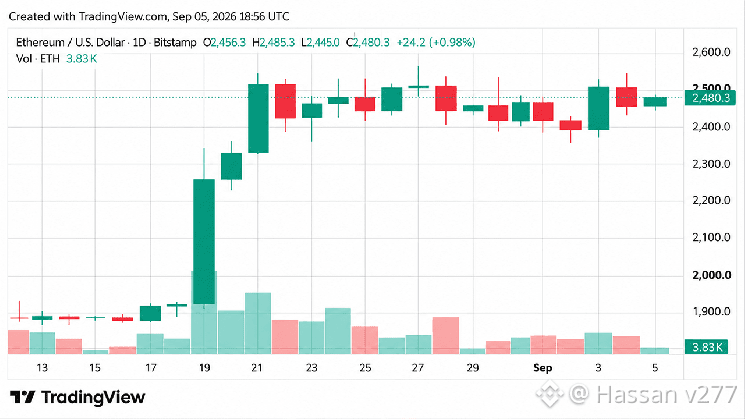
Ethereum Price Teases Breakout as Bulls Eye a Violent Move
Ether Holds Its Ground With $302 Billion Market Cap
One-month statistics against bitcoin show that ethereum’s price has jumped higher with a 29.6% gain. But year-to-date and 12-month metrics show bitcoin’s price still has the leading edge. Of the crypto economy’s $2.7 trillion market capitalization, ether commands a $302 billion valuation, giving $ETH roughly 10.8% dominance today.
$ETH also retains its position as the second-largest crypto asset by market cap, sitting a hefty $119 billion above USDT’s valuation. This weekend, $ETH has traded in a tight range between $2,445 to $2,483 per coin and volume is a touch lower with $6.74 billion over the last day of $ETH-based trades.
Ether Holds Its Ground With $302 Billion Market Cap
One-month statistics against bitcoin show that ethereum’s price has jumped higher with a 29.6% gain. But year-to-date and 12-month metrics show bitcoin’s price still has the leading edge. Of the crypto economy’s $2.7 trillion market capitalization, ether commands a $302 billion valuation, giving $ETH roughly 10.8% dominance today.
$ETH also retains its position as the second-largest crypto asset by market cap, sitting a hefty $119 billion above USDT’s valuation. This weekend, $ETH has traded in a tight range between $2,445 to $2,483 per coin and volume is a touch lower with $6.74 billion over the last day of $ETH-based trades.
$ETH’s current foundation stands between $2300 to $2,400 per unit, and upper resistance on Saturday is around $2,500 to $2,600 and higher. If ether could finish a day in the $2,550 range, it would put the current price in better standing. The price is currently above the near and long term simple moving averages (SMAs) and exponential moving averages (EMAs) via the daily chart.
Ethereum Price Teases Breakout as Bulls Eye a Violent Move
Ether Holds Its Ground With $302 Billion Market Cap
One-month statistics against bitcoin show that ethereum’s price has jumped higher with a 29.6% gain. But year-to-date and 12-month metrics show bitcoin’s price still has the leading edge. Of the crypto economy’s $2.7 trillion market capitalization, ether commands a $302 billion valuation, giving $ETH roughly 10.8% dominance today.
$ETH also retains its position as the second-largest crypto asset by market cap, sitting a hefty $119 billion above USDT’s valuation. This weekend, $ETH has traded in a tight range between $2,445 to $2,483 per coin and volume is a touch lower with $6.74 billion over the last day of $ETH-based trades.
Ether Holds Its Ground With $302 Billion Market Cap
One-month statistics against bitcoin show that ethereum’s price has jumped higher with a 29.6% gain. But year-to-date and 12-month metrics show bitcoin’s price still has the leading edge. Of the crypto economy’s $2.7 trillion market capitalization, ether commands a $302 billion valuation, giving $ETH roughly 10.8% dominance today.
$ETH also retains its position as the second-largest crypto asset by market cap, sitting a hefty $119 billion above USDT’s valuation. This weekend, $ETH has traded in a tight range between $2,445 to $2,483 per coin and volume is a touch lower with $6.74 billion over the last day of $ETH-based trades.
$ETH’s current foundation stands between $2300 to $2,400 per unit, and upper resistance on Saturday is around $2,500 to $2,600 and higher. If ether could finish a day in the $2,550 range, it would put the current price in better standing. The price is currently above the near and long term simple moving averages (SMAs) and exponential moving averages (EMAs) via the daily chart.
Ether Holds Its Ground With $302 Billion Market Cap
One-month statistics against bitcoin show that ethereum’s price has jumped higher with a 29.6% gain. But year-to-date and 12-month metrics show bitcoin’s price still has the leading edge. Of the crypto economy’s $2.7 trillion market capitalization, ether commands a $302 billion valuation, giving $ETH roughly 10.8% dominance today.
$ETH also retains its position as the second-largest crypto asset by market cap, sitting a hefty $119 billion above USDT’s valuation. This weekend, $ETH has traded in a tight range between $2,445 to $2,483 per coin and volume is a touch lower with $6.74 billion over the last day of $ETH-based trades.
Ether Holds Its Ground With $302 Billion Market Cap
One-month statistics against bitcoin show that ethereum’s price has jumped higher with a 29.6% gain. But year-to-date and 12-month metrics show bitcoin’s price still has the leading edge. Of the crypto economy’s $2.7 trillion market capitalization, ether commands a $302 billion valuation, giving $ETH roughly 10.8% dominance today.
$ETH also retains its position as the second-largest crypto asset by market cap, sitting a hefty $119 billion above USDT’s valuation. This weekend, $ETH has traded in a tight range between $2,445 to $2,483 per coin and volume is a touch lower with $6.74 billion over the last day of $ETH-based trades.
$ETH’s current foundation stands between $2300 to $2,400 per unit, and upper resistance on Saturday is around $2,500 to $2,600 and higher. If ether could finish a day in the $2,550 range, it would put the current price in better standing. The price is currently above the near and long term simple moving averages (SMAs) and exponential moving averages (EMAs) via the daily chart.

follow me free gifts
De Hassan v277
5
·
--
Alcista
14 altcoins con mayor número de búsquedas en las últimas horas han sido identificadas
Según los datos de CoinGecko, se han revelado las criptomonedas más buscadas en la plataforma en las últimas 3 horas. Firo (FIRO) ocupa el primer lugar, seguido por Zcash ($ZEC) en segundo lugar, y Pons ($PONS) en tercero.
Según los datos compartidos por CoinGecko, las criptomonedas más buscadas en la plataforma en las últimas horas, junto con su capitalización total de mercado, son las siguientes:
Firo (FIRO): $18.03 millones
Zcash ($ZEC): $19.81 mil millones
Pons ($PONS): $656.52 millones
Lil’ Shrub (SHRUB): $28.83 millones
STONK (STONK): $106.49 millones
Arbitrum (ARB): $1.33 mil millones
Pudgy Penguins (PENGU): $548.90 millones
Radium (RAY): $299.23 millones
Anonymous Cat (ZCAT): $80.09 millones
Sui (SUI): $3.26 mil millones
Hookr.fun (HOOKR): $16.62 millones
Ethereum (ETH): $304.78 mil millones
Lighter (LIT): $1.15 mil millones
Ondo (ONDO): $1.82 mil millones
Bitcoin (BTC): $1.60 billones
Según los datos, FIRO subió un 24%, $ZEC un 14.4% y $PONS un 25.9% en las últimas 24 horas, mientras que nombres destacados de la lista, STONK y ZCAT, aumentaron un 296.3% y un 191.5% respectivamente. Arbitrum también registró un incremento diario del 50.8%.
*Esto no es un consejo de inversión.
14 altcoins con mayor número de búsquedas en las últimas horas han sido identificadas
Según los datos de CoinGecko, se han revelado las criptomonedas más buscadas en la plataforma en las últimas 3 horas. Firo (FIRO) ocupa el primer lugar, seguido por Zcash ($ZEC) en segundo lugar, y Pons ($PONS) en tercero.
Según los datos compartidos por CoinGecko, las criptomonedas más buscadas en la plataforma en las últimas horas, junto con su capitalización total de mercado, son las siguientes:
Firo (FIRO): $18.03 millones
Zcash ($ZEC): $19.81 mil millones
Pons ($PONS): $656.52 millones
Lil’ Shrub (SHRUB): $28.83 millones
STONK (STONK): $106.49 millones
Arbitrum (ARB): $1.33 mil millones
Pudgy Penguins (PENGU): $548.90 millones
Radium (RAY): $299.23 millones
Anonymous Cat (ZCAT): $80.09 millones
Sui (SUI): $3.26 mil millones
Hookr.fun (HOOKR): $16.62 millones
Ethereum (ETH): $304.78 mil millones
Lighter (LIT): $1.15 mil millones
Ondo (ONDO): $1.82 mil millones
Bitcoin (BTC): $1.60 billones
Según los datos, FIRO subió un 24%, $ZEC un 14.4% y $PONS un 25.9% en las últimas 24 horas, mientras que nombres destacados de la lista, STONK y ZCAT, aumentaron un 296.3% y un 191.5% respectivamente. Arbitrum también registró un incremento diario del 50.8%.
*Esto no es un consejo de inversión.
Según los datos de CoinGecko, se han revelado las criptomonedas más buscadas en la plataforma en las últimas 3 horas. Firo (FIRO) ocupa el primer lugar, seguido por Zcash ($ZEC) en segundo lugar, y Pons ($PONS) en tercero.
Según los datos compartidos por CoinGecko, las criptomonedas más buscadas en la plataforma en las últimas horas, junto con su capitalización total de mercado, son las siguientes:
Firo (FIRO): $18.03 millones
Zcash ($ZEC): $19.81 mil millones
Pons ($PONS): $656.52 millones
Lil’ Shrub (SHRUB): $28.83 millones
STONK (STONK): $106.49 millones
Arbitrum (ARB): $1.33 mil millones
Pudgy Penguins (PENGU): $548.90 millones
Radium (RAY): $299.23 millones
Anonymous Cat (ZCAT): $80.09 millones
Sui (SUI): $3.26 mil millones
Hookr.fun (HOOKR): $16.62 millones
Ethereum (ETH): $304.78 mil millones
Lighter (LIT): $1.15 mil millones
Ondo (ONDO): $1.82 mil millones
Bitcoin (BTC): $1.60 billones
Según los datos, FIRO subió un 24%, $ZEC un 14.4% y $PONS un 25.9% en las últimas 24 horas, mientras que nombres destacados de la lista, STONK y ZCAT, aumentaron un 296.3% y un 191.5% respectivamente. Arbitrum también registró un incremento diario del 50.8%.
*Esto no es un consejo de inversión.

follow me daliy gift
De Hassan v277
296
·
--
Ver traducción
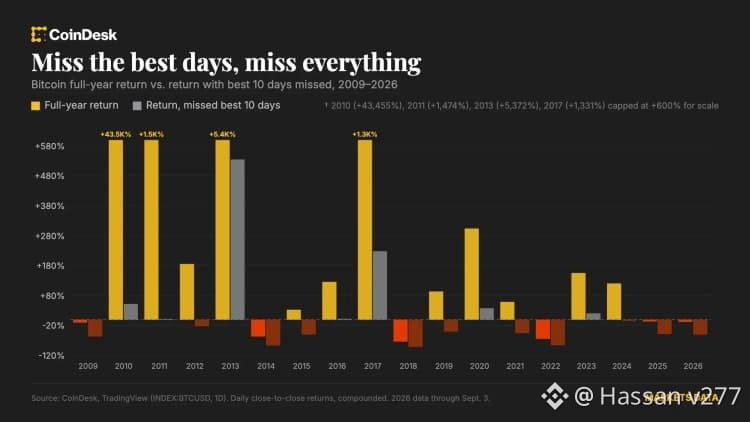
Timing the bitcoin market is exciting but nearly impossible. Here's why
A historical analysis of bitcoin price performance from 2010 through 2026 demonstrates that the vast majority of the asset's annual returns occur during a tiny fraction of the calendar year.
Bitcoin BTC$79,940.50 trades 24 hours a day, seven days a week, allowing traders and fund managers to react to the news and manage risk at any hour, including weekends and holidays.
Yet out of 365 trading days a year, only a handful actually decide whether a year is a win or a loss. Which is why some experts say it’s likely better to buy and hold than to try to time bitcoin price swings for gains.
For example, in 2026, bitcoin fell about 9%, a mediocre loss, not a disaster. But without the five best-performing days of the year, bitcoin is down 36%.
Andre Dragosch, head of research at Bitwise Europe, said this is simply bitcoin's nature. "Bitcoin is actually a relatively boring asset," he told CoinDesk.
"The majority of performance is usually made in a handful of days, while most of the time it moves sideways and consolidates."
That's not a one-off event. Looking through bitcoin's history since its earliest days in 2010, when it traded for mere cents, gains since then have consistently been concentrated in just a handful of trading days.
Timing the bitcoin market is exciting but nearly impossible. Here's why
A historical analysis of bitcoin price performance from 2010 through 2026 demonstrates that the vast majority of the asset's annual returns occur during a tiny fraction of the calendar year.
Bitcoin BTC$79,940.50 trades 24 hours a day, seven days a week, allowing traders and fund managers to react to the news and manage risk at any hour, including weekends and holidays.
Yet out of 365 trading days a year, only a handful actually decide whether a year is a win or a loss. Which is why some experts say it’s likely better to buy and hold than to try to time bitcoin price swings for gains.
For example, in 2026, bitcoin fell about 9%, a mediocre loss, not a disaster. But without the five best-performing days of the year, bitcoin is down 36%.
Andre Dragosch, head of research at Bitwise Europe, said this is simply bitcoin's nature. "Bitcoin is actually a relatively boring asset," he told CoinDesk.
"The majority of performance is usually made in a handful of days, while most of the time it moves sideways and consolidates."
That's not a one-off event. Looking through bitcoin's history since its earliest days in 2010, when it traded for mere cents, gains since then have consistently been concentrated in just a handful of trading days.
A historical analysis of bitcoin price performance from 2010 through 2026 demonstrates that the vast majority of the asset's annual returns occur during a tiny fraction of the calendar year.
Bitcoin BTC$79,940.50 trades 24 hours a day, seven days a week, allowing traders and fund managers to react to the news and manage risk at any hour, including weekends and holidays.
Yet out of 365 trading days a year, only a handful actually decide whether a year is a win or a loss. Which is why some experts say it’s likely better to buy and hold than to try to time bitcoin price swings for gains.
For example, in 2026, bitcoin fell about 9%, a mediocre loss, not a disaster. But without the five best-performing days of the year, bitcoin is down 36%.
Andre Dragosch, head of research at Bitwise Europe, said this is simply bitcoin's nature. "Bitcoin is actually a relatively boring asset," he told CoinDesk.
"The majority of performance is usually made in a handful of days, while most of the time it moves sideways and consolidates."
That's not a one-off event. Looking through bitcoin's history since its earliest days in 2010, when it traded for mere cents, gains since then have consistently been concentrated in just a handful of trading days.
enjoy for free gift
De Hassan v277
4
·
--
Alcista
Ver traducción
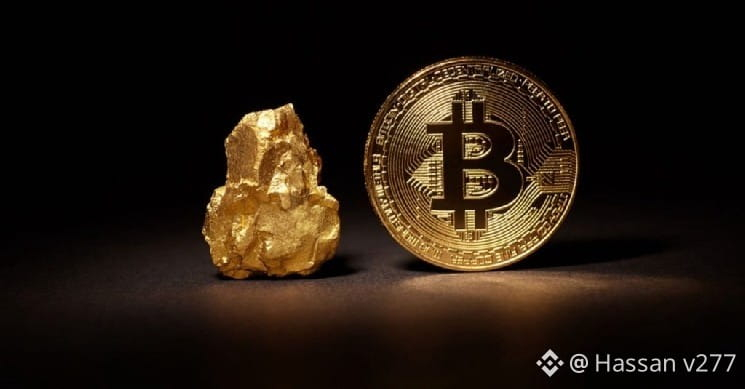
Bitcoin’s Correlation with Gold Has Reached Extremely High Levels: What Does This Mean?
Bitcoin’s (BTC) correlation with gold has reached one of its highest levels in recent years, while its relationship with technology stocks has weakened significantly.
According to data cited in The Kobeissi Letter, based on an analysis by Bitwise Asset Management using Bloomberg data, Bitcoin’s 90-day moving average correlation with gold has risen to approximately +0.50. This ratio marks one of the highest levels seen since the pandemic in 2020 and is more than double the level at the beginning of the year.
In contrast, Bitcoin’s 90-day correlation with the Nasdaq 100 index has fallen to approximately +0.30, reaching its lowest level in the past year. The data suggests that Bitcoin has recently moved away from technology stocks and begun to exhibit price behavior more similar to gold.
The Kobeissi Letter noted that the strengthening correlation between Bitcoin and gold accelerated after the US Treasury Department announced on August 19 that it would increase the limit for long-term bond repurchases from a minimum of $2 billion to $4 billion per transaction.
increasingly viewing Bitcoin and gold as similar hedging assets due to concerns about rising public debt and currency depreciation. The fact that Bitcoin’s correlation with Nasdaq is declining while its correlation with gold is rising also indicates a strengthening tendency in the market to price Bitcoin not just as a risky technology asset, but as an alternative store of value.
*This is not investment advice.
Bitcoin’s Correlation with Gold Has Reached Extremely High Levels: What Does This Mean?
Bitcoin’s (BTC) correlation with gold has reached one of its highest levels in recent years, while its relationship with technology stocks has weakened significantly.
According to data cited in The Kobeissi Letter, based on an analysis by Bitwise Asset Management using Bloomberg data, Bitcoin’s 90-day moving average correlation with gold has risen to approximately +0.50. This ratio marks one of the highest levels seen since the pandemic in 2020 and is more than double the level at the beginning of the year.
In contrast, Bitcoin’s 90-day correlation with the Nasdaq 100 index has fallen to approximately +0.30, reaching its lowest level in the past year. The data suggests that Bitcoin has recently moved away from technology stocks and begun to exhibit price behavior more similar to gold.
The Kobeissi Letter noted that the strengthening correlation between Bitcoin and gold accelerated after the US Treasury Department announced on August 19 that it would increase the limit for long-term bond repurchases from a minimum of $2 billion to $4 billion per transaction.
increasingly viewing Bitcoin and gold as similar hedging assets due to concerns about rising public debt and currency depreciation. The fact that Bitcoin’s correlation with Nasdaq is declining while its correlation with gold is rising also indicates a strengthening tendency in the market to price Bitcoin not just as a risky technology asset, but as an alternative store of value.
*This is not investment advice.
Bitcoin’s (BTC) correlation with gold has reached one of its highest levels in recent years, while its relationship with technology stocks has weakened significantly.
According to data cited in The Kobeissi Letter, based on an analysis by Bitwise Asset Management using Bloomberg data, Bitcoin’s 90-day moving average correlation with gold has risen to approximately +0.50. This ratio marks one of the highest levels seen since the pandemic in 2020 and is more than double the level at the beginning of the year.
In contrast, Bitcoin’s 90-day correlation with the Nasdaq 100 index has fallen to approximately +0.30, reaching its lowest level in the past year. The data suggests that Bitcoin has recently moved away from technology stocks and begun to exhibit price behavior more similar to gold.
The Kobeissi Letter noted that the strengthening correlation between Bitcoin and gold accelerated after the US Treasury Department announced on August 19 that it would increase the limit for long-term bond repurchases from a minimum of $2 billion to $4 billion per transaction.
increasingly viewing Bitcoin and gold as similar hedging assets due to concerns about rising public debt and currency depreciation. The fact that Bitcoin’s correlation with Nasdaq is declining while its correlation with gold is rising also indicates a strengthening tendency in the market to price Bitcoin not just as a risky technology asset, but as an alternative store of value.
*This is not investment advice.
earn daliy reward
De Hassan v277
3
·
--
Bitcoin: ‘Este período de consolidación ha sembrado dudas en cada inversor, incluso en los OGs’
Bitcoin [$BTC] ha estado en la parte alta durante los últimos días, con el activo tanteando un posible movimiento por encima de la región de los $80,000 en el gráfico.
La cuestión es que el precio sigue oscilando alrededor de esta región sin un impulso definitivo. Lo que hagan los participantes del mercado en este nivel sigue siendo crucial para entender el próximo movimiento de Bitcoin, pero por ahora no hay una dirección definitiva.
Los holders OG de Bitcoin venden sus posiciones
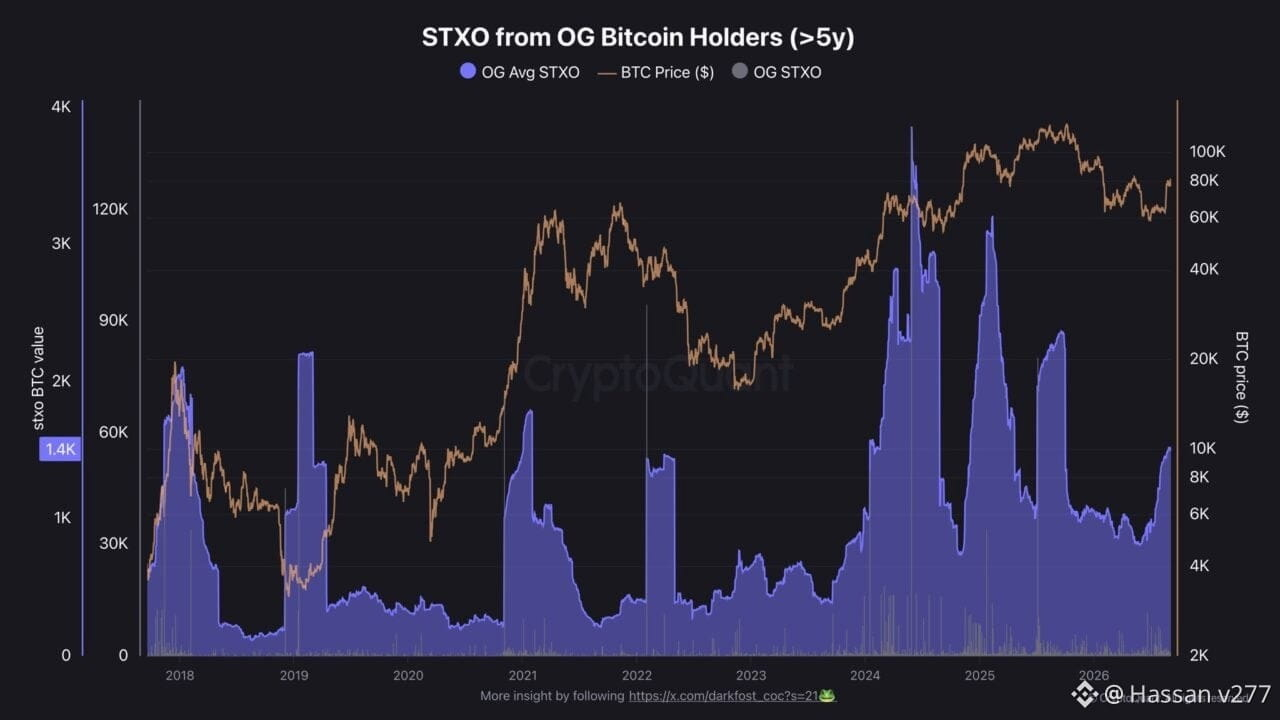
Los datos de CryptoQuant que rastrean los Bitcoin OG Spent Transaction Outputs (STXO) usando la media móvil de 90 días han registrado un fuerte repunte, alcanzando 1,500 Bitcoin.
Los OGs de Bitcoin son holders que han mantenido sus activos durante más de cinco años. Cuando gastan sus Bitcoin, a menudo indica un cambio en el sentimiento, como se ha visto recientemente.
Estos OGs han movido sus Bitcoin, lo que podría indicar presión vendedora y sugerir que su convicción se ha debilitado, especialmente a medida que $BTC alcanza nuevos máximos locales.
El analista senior de mercado pseudónimo Darkfost describió el factor que influyó en el reciente repunte, diciendo:
“Este período de consolidación parece haber introducido ciertas dudas en casi todo tipo de inversor, incluso en los más experimentados como los OGs.”
Otros factores también podrían haber desempeñado un papel en el movimiento, incluido el reciente hackeo de Coldcard, que ha llevado a los inversores a cambiar a carteras privadas.
El mercado spot se mantiene firme
Durante los últimos días, ha habido una acumulación creciente en el mercado spot, lo que muestra que ha habido una gran compra del activo.
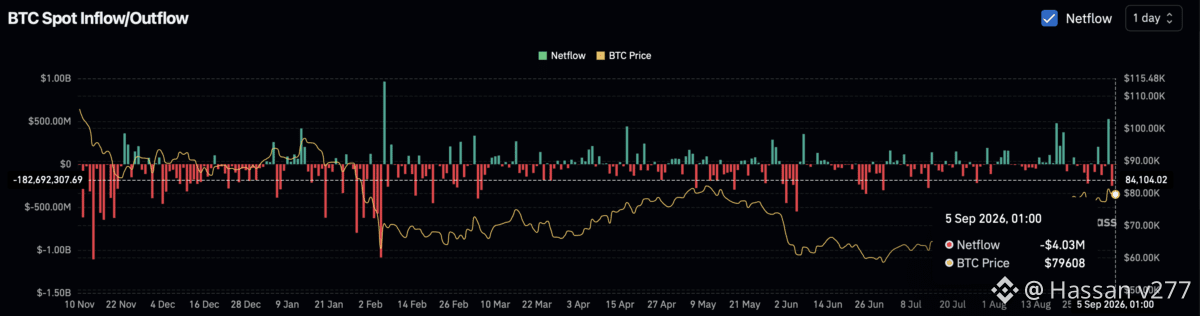
El flujo neto spot alcanzó -$252.40 millones el 4 de septiembre, tras una acumulación de $2.81 mil millones del activo en el mercado. Sin embargo, el flujo neto ha caído significativamente hasta alrededor de -$4.03 millones al mediodía del 5 de septiembre.
Por ahora, la acumulación en el mercado está aumentando, y si continúa así, podría ayudar a sostener Bitcoin.
Resumen final
Los holders OG de Bitcoin han incrementado su actividad de gasto, lo que sugiere que algunos inversores a largo plazo podrían estar tomando ganancias.
Bitcoin: ‘Este período de consolidación ha sembrado dudas en cada inversor, incluso en los OGs’
Bitcoin [$BTC] ha estado en la parte alta durante los últimos días, con el activo tanteando un posible movimiento por encima de la región de los $80,000 en el gráfico.
La cuestión es que el precio sigue oscilando alrededor de esta región sin un impulso definitivo. Lo que hagan los participantes del mercado en este nivel sigue siendo crucial para entender el próximo movimiento de Bitcoin, pero por ahora no hay una dirección definitiva.
Los holders OG de Bitcoin venden sus posiciones
Los datos de CryptoQuant que rastrean los Bitcoin OG Spent Transaction Outputs (STXO) usando la media móvil de 90 días han registrado un fuerte repunte, alcanzando 1,500 Bitcoin.
Los OGs de Bitcoin son holders que han mantenido sus activos durante más de cinco años. Cuando gastan sus Bitcoin, a menudo indica un cambio en el sentimiento, como se ha visto recientemente.
Estos OGs han movido sus Bitcoin, lo que podría indicar presión vendedora y sugerir que su convicción se ha debilitado, especialmente a medida que $BTC alcanza nuevos máximos locales.
El analista senior de mercado pseudónimo Darkfost describió el factor que influyó en el reciente repunte, diciendo:
“Este período de consolidación parece haber introducido ciertas dudas en casi todo tipo de inversor, incluso en los más experimentados como los OGs.”
Otros factores también podrían haber desempeñado un papel en el movimiento, incluido el reciente hackeo de Coldcard, que ha llevado a los inversores a cambiar a carteras privadas.
El mercado spot se mantiene firme
Durante los últimos días, ha habido una acumulación creciente en el mercado spot, lo que muestra que ha habido una gran compra del activo.
El flujo neto spot alcanzó -$252.40 millones el 4 de septiembre, tras una acumulación de $2.81 mil millones del activo en el mercado. Sin embargo, el flujo neto ha caído significativamente hasta alrededor de -$4.03 millones al mediodía del 5 de septiembre.
Por ahora, la acumulación en el mercado está aumentando, y si continúa así, podría ayudar a sostener Bitcoin.
Resumen final
Los holders OG de Bitcoin han incrementado su actividad de gasto, lo que sugiere que algunos inversores a largo plazo podrían estar tomando ganancias.
Bitcoin [$BTC] ha estado en la parte alta durante los últimos días, con el activo tanteando un posible movimiento por encima de la región de los $80,000 en el gráfico.
La cuestión es que el precio sigue oscilando alrededor de esta región sin un impulso definitivo. Lo que hagan los participantes del mercado en este nivel sigue siendo crucial para entender el próximo movimiento de Bitcoin, pero por ahora no hay una dirección definitiva.
Los holders OG de Bitcoin venden sus posiciones
Los datos de CryptoQuant que rastrean los Bitcoin OG Spent Transaction Outputs (STXO) usando la media móvil de 90 días han registrado un fuerte repunte, alcanzando 1,500 Bitcoin.
Los OGs de Bitcoin son holders que han mantenido sus activos durante más de cinco años. Cuando gastan sus Bitcoin, a menudo indica un cambio en el sentimiento, como se ha visto recientemente.
Estos OGs han movido sus Bitcoin, lo que podría indicar presión vendedora y sugerir que su convicción se ha debilitado, especialmente a medida que $BTC alcanza nuevos máximos locales.
El analista senior de mercado pseudónimo Darkfost describió el factor que influyó en el reciente repunte, diciendo:
“Este período de consolidación parece haber introducido ciertas dudas en casi todo tipo de inversor, incluso en los más experimentados como los OGs.”
Otros factores también podrían haber desempeñado un papel en el movimiento, incluido el reciente hackeo de Coldcard, que ha llevado a los inversores a cambiar a carteras privadas.
El mercado spot se mantiene firme
Durante los últimos días, ha habido una acumulación creciente en el mercado spot, lo que muestra que ha habido una gran compra del activo.
El flujo neto spot alcanzó -$252.40 millones el 4 de septiembre, tras una acumulación de $2.81 mil millones del activo en el mercado. Sin embargo, el flujo neto ha caído significativamente hasta alrededor de -$4.03 millones al mediodía del 5 de septiembre.
Por ahora, la acumulación en el mercado está aumentando, y si continúa así, podría ayudar a sostener Bitcoin.
Resumen final
Los holders OG de Bitcoin han incrementado su actividad de gasto, lo que sugiere que algunos inversores a largo plazo podrían estar tomando ganancias.

73
·
--
Alcista
De 0.5% a 23%: explicado el asalto de los perps cripto de Wall Street
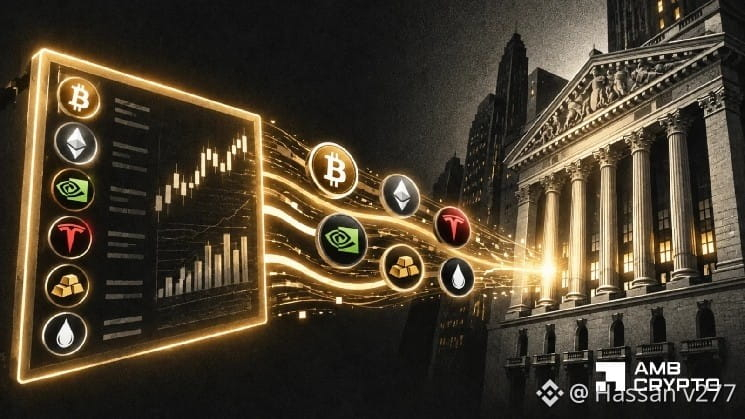
Después de mucha oposición, críticas y negación, Wall Street se está moviendo hacia los rieles cripto.
Según Bloomberg, los exchanges de criptomonedas se están expandiendo más allá de las criptomonedas hacia mercados que operan las 24 horas para acciones y materias primas. El enorme aumento del trading de “futuros perpetuos” vinculado a acciones y materias primas confirmó aún más este sentimiento.
¿Cómo cambió todo para bien en solo un mes?
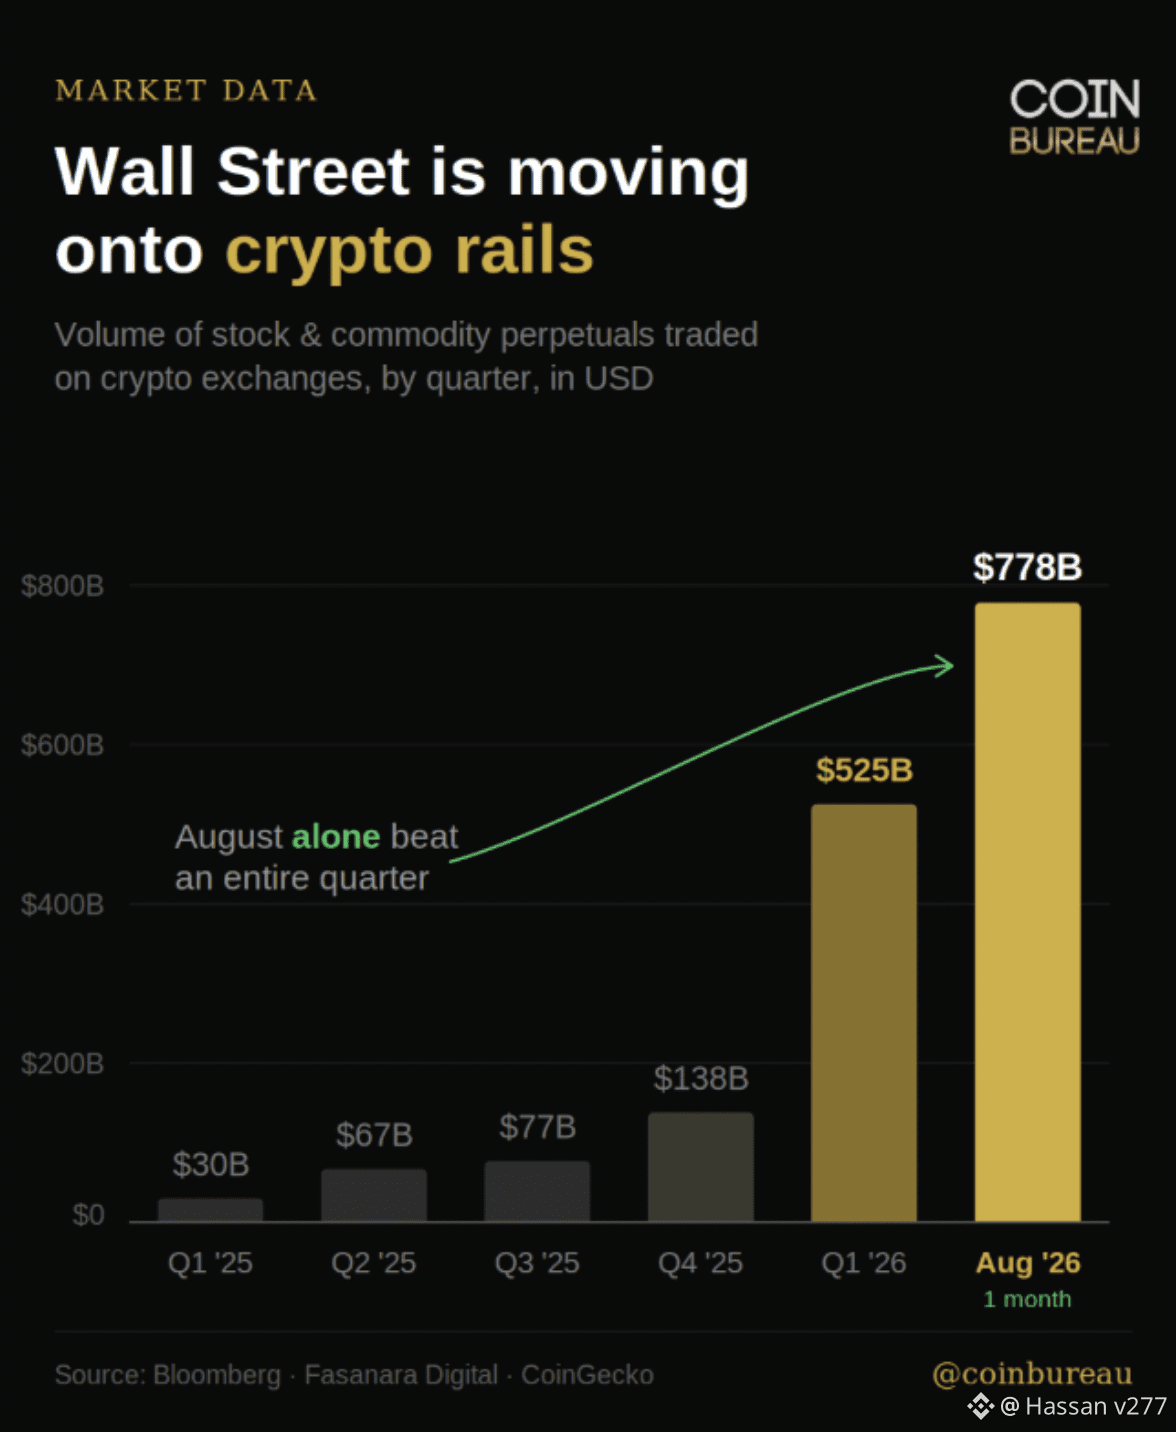
En agosto, estos contratos generaron $778 mil millones en volumen de trading en las principales plataformas cripto. Representaron el 23.48% de toda la actividad de futuros perpetuos, frente a solo 0.5% en noviembre de 2025.
Al mismo tiempo, su volumen en exchanges centralizados alcanzó $665.42 mil millones en agosto, frente a solo $11.58 mil millones en enero.
La principal razón detrás de este auge es que las plataformas cripto están atrayendo el trading de activos tradicionales porque los futuros perpetuos ofrecen acceso 24/7. Esto facilita operar acciones, ETFs y materias primas a través de la infraestructura cripto.
Por ejemplo, aunque el contrato SPCX vinculado a SpaceX es privado, los inversores pueden especular sobre su valoración sin poseer la acción real, gracias al trading de perpetuos cripto.
Esto se vio aún más respaldado por Binance, que representó alrededor de $433.4 mil millones del volumen perpetuo de TradFi, y la mayor parte provenía de contratos vinculados a acciones.
Dicho esto, la lista también incluye a Bybit y Hyperliquid, ya que incluso estos se están convirtiendo en plataformas importantes para la especulación sobre activos tradicionales.
De 0.5% a 23%: explicado el asalto de los perps cripto de Wall Street
Después de mucha oposición, críticas y negación, Wall Street se está moviendo hacia los rieles cripto.
Según Bloomberg, los exchanges de criptomonedas se están expandiendo más allá de las criptomonedas hacia mercados que operan las 24 horas para acciones y materias primas. El enorme aumento del trading de “futuros perpetuos” vinculado a acciones y materias primas confirmó aún más este sentimiento.
¿Cómo cambió todo para bien en solo un mes?
En agosto, estos contratos generaron $778 mil millones en volumen de trading en las principales plataformas cripto. Representaron el 23.48% de toda la actividad de futuros perpetuos, frente a solo 0.5% en noviembre de 2025.
Al mismo tiempo, su volumen en exchanges centralizados alcanzó $665.42 mil millones en agosto, frente a solo $11.58 mil millones en enero.
La principal razón detrás de este auge es que las plataformas cripto están atrayendo el trading de activos tradicionales porque los futuros perpetuos ofrecen acceso 24/7. Esto facilita operar acciones, ETFs y materias primas a través de la infraestructura cripto.
Por ejemplo, aunque el contrato SPCX vinculado a SpaceX es privado, los inversores pueden especular sobre su valoración sin poseer la acción real, gracias al trading de perpetuos cripto.
Esto se vio aún más respaldado por Binance, que representó alrededor de $433.4 mil millones del volumen perpetuo de TradFi, y la mayor parte provenía de contratos vinculados a acciones.
Dicho esto, la lista también incluye a Bybit y Hyperliquid, ya que incluso estos se están convirtiendo en plataformas importantes para la especulación sobre activos tradicionales.
Después de mucha oposición, críticas y negación, Wall Street se está moviendo hacia los rieles cripto.
Según Bloomberg, los exchanges de criptomonedas se están expandiendo más allá de las criptomonedas hacia mercados que operan las 24 horas para acciones y materias primas. El enorme aumento del trading de “futuros perpetuos” vinculado a acciones y materias primas confirmó aún más este sentimiento.
¿Cómo cambió todo para bien en solo un mes?
En agosto, estos contratos generaron $778 mil millones en volumen de trading en las principales plataformas cripto. Representaron el 23.48% de toda la actividad de futuros perpetuos, frente a solo 0.5% en noviembre de 2025.
Al mismo tiempo, su volumen en exchanges centralizados alcanzó $665.42 mil millones en agosto, frente a solo $11.58 mil millones en enero.
La principal razón detrás de este auge es que las plataformas cripto están atrayendo el trading de activos tradicionales porque los futuros perpetuos ofrecen acceso 24/7. Esto facilita operar acciones, ETFs y materias primas a través de la infraestructura cripto.
Por ejemplo, aunque el contrato SPCX vinculado a SpaceX es privado, los inversores pueden especular sobre su valoración sin poseer la acción real, gracias al trading de perpetuos cripto.
Esto se vio aún más respaldado por Binance, que representó alrededor de $433.4 mil millones del volumen perpetuo de TradFi, y la mayor parte provenía de contratos vinculados a acciones.
Dicho esto, la lista también incluye a Bybit y Hyperliquid, ya que incluso estos se están convirtiendo en plataformas importantes para la especulación sobre activos tradicionales.
161
·
--
Mejores criptomonedas a vigilar en septiembre de 2026
Desde la decisión de la Fed del 15 de septiembre hasta la ruptura ETH/BTC de Ether, el repunte de XRP tras el Tesoro, la victoria de Chainlink en Wyoming y la ventana de Alpenglow de Solana, esto es lo que está destacando estos cinco tokens.
Conclusiones clave
BTC, ETH y XRP experimentaron todos un fuerte resurgimiento a finales de agosto después de que el Tesoro de EE. UU. duplicara su programa de recompra de bonos.
ETH superó a BTC durante el repunte, empujando la relación ETH/BTC a su nivel más alto desde abril.
XRP fue el activo más destacado de la semana, disparándose casi un 50% en un período de siete días y tocando brevemente los $1.70.
La posición institucional de Chainlink sigue mejorando a pesar de que su precio va rezagado.
A finales de agosto se produjo el movimiento de apetito por el riesgo más pronunciado que ha visto las criptomonedas en todo el año. La decisión del Tesoro de EE. UU. de duplicar su programa de recompra de bonos a largo plazo hizo bajar los rendimientos y debilitó el dólar, lo que también provocó que BTC, ETH, XRP y SOL subieran con fuerza en cuestión de días.
La cuestión central de septiembre es la durabilidad de este histórico repunte por cobertura de cortos, enmarcado por dos fechas ya marcadas en el calendario: la decisión de la Fed del 15 al 16 de septiembre y la votación de clausura de la Ley CLARITY del Senado, programada para ese mismo día.
Mejores criptomonedas a vigilar en septiembre de 2026
Desde la decisión de la Fed del 15 de septiembre hasta la ruptura ETH/BTC de Ether, el repunte de XRP tras el Tesoro, la victoria de Chainlink en Wyoming y la ventana de Alpenglow de Solana, esto es lo que está destacando estos cinco tokens.
Conclusiones clave
BTC, ETH y XRP experimentaron todos un fuerte resurgimiento a finales de agosto después de que el Tesoro de EE. UU. duplicara su programa de recompra de bonos.
ETH superó a BTC durante el repunte, empujando la relación ETH/BTC a su nivel más alto desde abril.
XRP fue el activo más destacado de la semana, disparándose casi un 50% en un período de siete días y tocando brevemente los $1.70.
La posición institucional de Chainlink sigue mejorando a pesar de que su precio va rezagado.
A finales de agosto se produjo el movimiento de apetito por el riesgo más pronunciado que ha visto las criptomonedas en todo el año. La decisión del Tesoro de EE. UU. de duplicar su programa de recompra de bonos a largo plazo hizo bajar los rendimientos y debilitó el dólar, lo que también provocó que BTC, ETH, XRP y SOL subieran con fuerza en cuestión de días.
La cuestión central de septiembre es la durabilidad de este histórico repunte por cobertura de cortos, enmarcado por dos fechas ya marcadas en el calendario: la decisión de la Fed del 15 al 16 de septiembre y la votación de clausura de la Ley CLARITY del Senado, programada para ese mismo día.
Desde la decisión de la Fed del 15 de septiembre hasta la ruptura ETH/BTC de Ether, el repunte de XRP tras el Tesoro, la victoria de Chainlink en Wyoming y la ventana de Alpenglow de Solana, esto es lo que está destacando estos cinco tokens.
Conclusiones clave
BTC, ETH y XRP experimentaron todos un fuerte resurgimiento a finales de agosto después de que el Tesoro de EE. UU. duplicara su programa de recompra de bonos.
ETH superó a BTC durante el repunte, empujando la relación ETH/BTC a su nivel más alto desde abril.
XRP fue el activo más destacado de la semana, disparándose casi un 50% en un período de siete días y tocando brevemente los $1.70.
La posición institucional de Chainlink sigue mejorando a pesar de que su precio va rezagado.
A finales de agosto se produjo el movimiento de apetito por el riesgo más pronunciado que ha visto las criptomonedas en todo el año. La decisión del Tesoro de EE. UU. de duplicar su programa de recompra de bonos a largo plazo hizo bajar los rendimientos y debilitó el dólar, lo que también provocó que BTC, ETH, XRP y SOL subieran con fuerza en cuestión de días.
La cuestión central de septiembre es la durabilidad de este histórico repunte por cobertura de cortos, enmarcado por dos fechas ya marcadas en el calendario: la decisión de la Fed del 15 al 16 de septiembre y la votación de clausura de la Ley CLARITY del Senado, programada para ese mismo día.

103
·
--
Ver traducción
Why is crypto up today? Market adds $112B as Bitcoin reclaims $81K
The crypto market gained more than $112 billion on September 3 as Bitcoin climbed back above $81,000.
The recovery followed a fall in US government bond yields and comments from Federal Reserve Governor Christopher Waller that eased fears of an imminent interest-rate increase.
Bitcoin leads a broad crypto recovery
Bitcoin rose 4.91% from its daily opening price of approximately $77,307 to $81,100, reaching a daily high near $81,392.
Source: TradingView
But apart from Bitcoin, the total crypto market capitalization increased by 4.35% to $2.7 trillion, adding around $112.4 billion. Also, the total market capitalization, excluding stablecoins, increased by 5.05% to $2.42 trillion.
The price of Bitcoin is now approaching the $82,000 to $82,500 region that it had previously struggled to break. If it’s able to move above this area, it will see more price recovery.
The charts also showed that there has been an increase in buying activity, with market momentum moving to an elevated range for Bitcoin and the wider crypto market. This does not mean prices must fall, but there is a possibility of a pause after such a sharp daily gain that was seen.
Final Summary
The market added about $112.4 billion as Bitcoin returned above $81,000.
The recovery was aided by falling bond yields and reduced expectations of a September rate increase.
Why is crypto up today? Market adds $112B as Bitcoin reclaims $81K
The crypto market gained more than $112 billion on September 3 as Bitcoin climbed back above $81,000.
The recovery followed a fall in US government bond yields and comments from Federal Reserve Governor Christopher Waller that eased fears of an imminent interest-rate increase.
Bitcoin leads a broad crypto recovery
Bitcoin rose 4.91% from its daily opening price of approximately $77,307 to $81,100, reaching a daily high near $81,392.
Source: TradingView
But apart from Bitcoin, the total crypto market capitalization increased by 4.35% to $2.7 trillion, adding around $112.4 billion. Also, the total market capitalization, excluding stablecoins, increased by 5.05% to $2.42 trillion.
The price of Bitcoin is now approaching the $82,000 to $82,500 region that it had previously struggled to break. If it’s able to move above this area, it will see more price recovery.
The charts also showed that there has been an increase in buying activity, with market momentum moving to an elevated range for Bitcoin and the wider crypto market. This does not mean prices must fall, but there is a possibility of a pause after such a sharp daily gain that was seen.
Final Summary
The market added about $112.4 billion as Bitcoin returned above $81,000.
The recovery was aided by falling bond yields and reduced expectations of a September rate increase.
The crypto market gained more than $112 billion on September 3 as Bitcoin climbed back above $81,000.
The recovery followed a fall in US government bond yields and comments from Federal Reserve Governor Christopher Waller that eased fears of an imminent interest-rate increase.
Bitcoin leads a broad crypto recovery
Bitcoin rose 4.91% from its daily opening price of approximately $77,307 to $81,100, reaching a daily high near $81,392.
Source: TradingView
But apart from Bitcoin, the total crypto market capitalization increased by 4.35% to $2.7 trillion, adding around $112.4 billion. Also, the total market capitalization, excluding stablecoins, increased by 5.05% to $2.42 trillion.
The price of Bitcoin is now approaching the $82,000 to $82,500 region that it had previously struggled to break. If it’s able to move above this area, it will see more price recovery.
The charts also showed that there has been an increase in buying activity, with market momentum moving to an elevated range for Bitcoin and the wider crypto market. This does not mean prices must fall, but there is a possibility of a pause after such a sharp daily gain that was seen.
Final Summary
The market added about $112.4 billion as Bitcoin returned above $81,000.
The recovery was aided by falling bond yields and reduced expectations of a September rate increase.

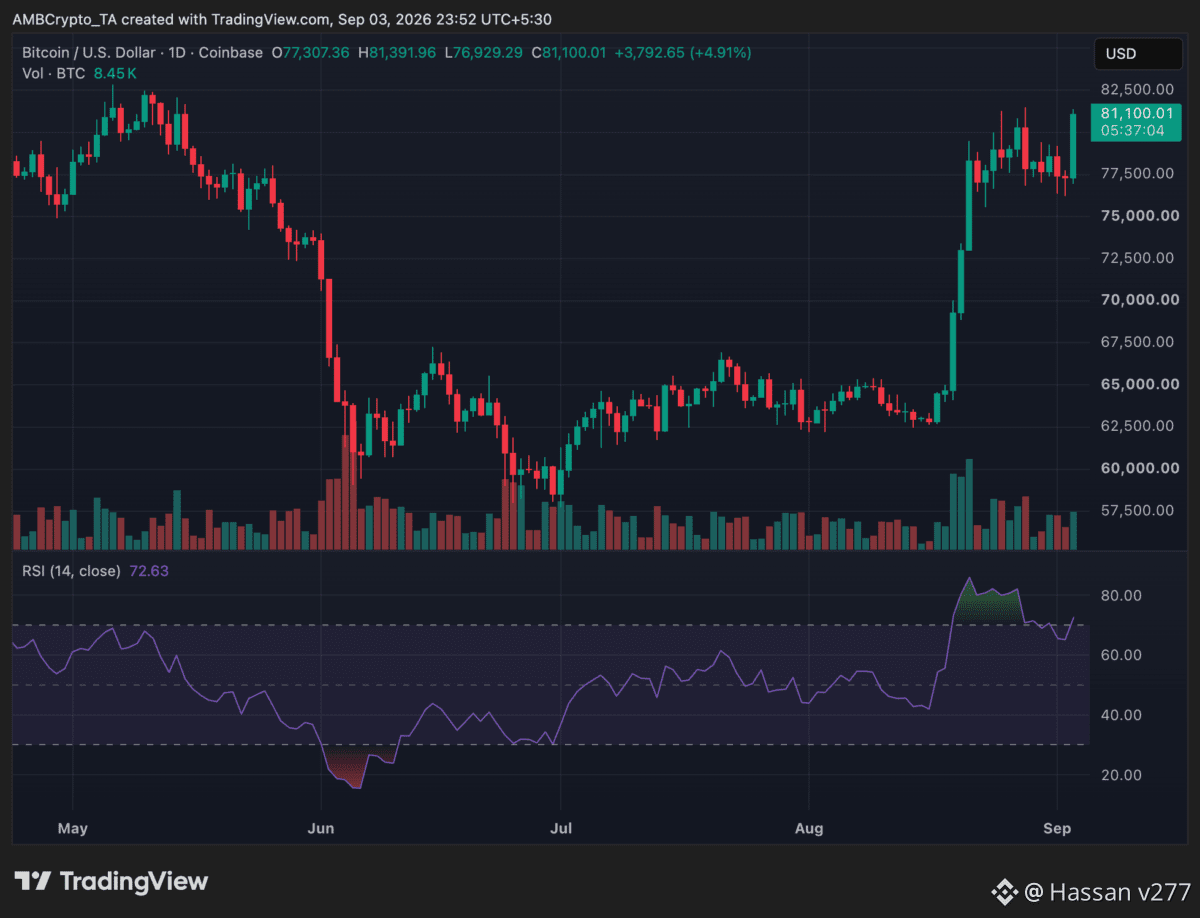
79
·
--
vaya buena captura de pantalla lol 😂😂😂
vaya buena captura de pantalla lol 😂😂😂

Sophia_Crypto
·
--
Bajista¿Cómo puedo recuperar esta pérdida😭😭
Perdí todo🥲 $SOL
Perdí todo🥲 $SOL
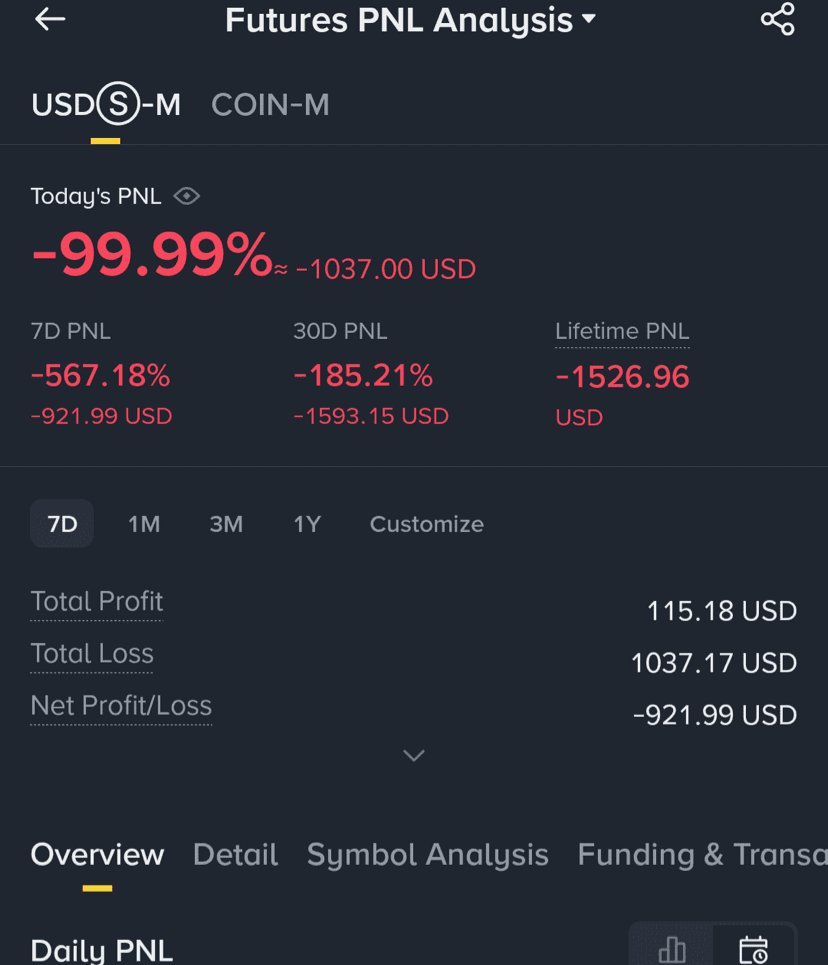
13
Inicia sesión para explorar más contenidos
Únete a usuarios globales de criptomonedas en Binance Square
⚡️ Obtén información útil y actualizada sobre criptos.
💬 Avalado por el mayor exchange de criptomonedas en el mundo.
👍 Descubre perspectivas reales de creadores verificados.
Email/número de teléfono
Temas populares
NEARSurges26%Past$3.45
3,910 vistas
54 están debatiendo
$NEAR Mây está prestando atención a NEAR no solo por el fuerte aumento de precio, sino también por un avance bastante significativo con Hyperliquid.
NEAR acaba de lanzar la negociación de Perps con el mecanismo “Confidential by Default”, orientado a ocultar información sobre la posición, el tamaño de la orden, el momento de entrada y la dirección del trade.
¿Por qué es algo destacable?
La negociación on-chain es muy transparente, pero para ballenas y organizaciones, hacer pública la posición puede hacer que se enfrenten a:
• Bots front-run (adelantamiento de órdenes)
• Que copien su estrategia
• Que los ataquen en zonas de liquidación
NEAR está probando resolver este problema combinando privacidad + velocidad de la blockchain + la liquidez de Hyperliquid.
El sistema Confidential Intents de NEAR también ha alcanzado aproximadamente 70 millones de USD de TVL según la información publicada.
Sobre el precio:
NEAR sube más de 27% en 24 horas, hasta rondar los 3,41 USD.
Mây estará atento/a a la zona de 3,00 USD.
Si se mantiene esa zona, los niveles de 3,80 – 4,00 USD podrían continuar siendo observados por el mercado.
Por el contrario, si pierde 2,80 USD, la zona de 2,57 USD será más relevante.
HYPE también sube cerca de 10%, hasta unos 86,3 USD, en el contexto de que Hyperliquid muestra más información positiva relacionada con la expansión en EE. UU.
Lo que más le preocupa a Mây en este momento no es simplemente que NEAR esté bombeando.
Sino la historia detrás:
NEAR + Hyperliquid + Privacy + Perps + AI
Este es un narrative bastante interesante para añadir a la watchlist. 👀
Recuerda seguir a Mây y unirte al grupo de chat. Cada día, el grupo reparte lì xì junto con material de aprendizaje.
Perspectiva personal, no es asesoramiento de inversión. Gestiona siempre el capital y el riesgo antes de operar. #45NgayTuDoTaiChinh #TheoDõiFOMC #NEARSurges26%Past$3.45
Mây Làm Crypto
·1 me gusta
·89 vistas
BOJHikesRatesTo31YearHigh
10,013 vistas
353 están debatiendo
ChainlinkPowersBottomlinePaymentPlatform
14,011 vistas
392 están debatiendo