Binance Square
Cryptomaven01
1.2k Publicaciones

Cryptomaven01

Crypto enthusiast with expertise in blockchain, digital assets, and a passion for driving decentralized finance and Web3 adoption. KOL on CMC
23 Siguiendo
1.8K+ Seguidores
1.8K+ Me gusta
Publicaciones
PINNED
·
--
Artículo
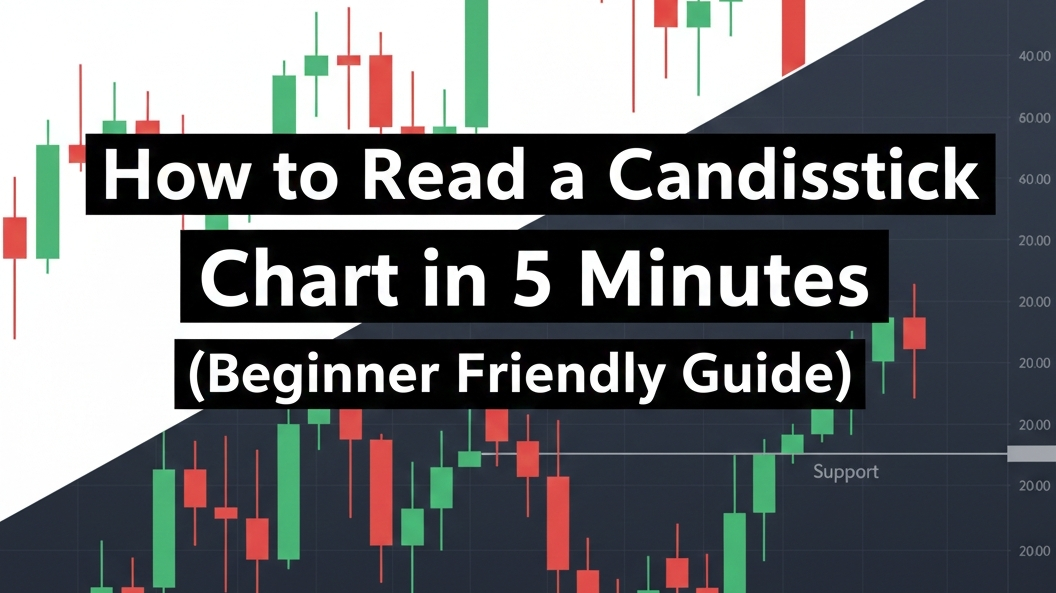
How to read a candlestick chart in 5 minutes (Beginner Friendly Guide)If you open a crypto or forex chart for the first time, it looks confusing. Red and green candles everywhere. Wicks up and down. Price moving fast. But the truth is simple: every candlestick is just a story of what price did during a period of time. Once you understand one candle, the whole chart starts to make sense. A candlestick shows four things: Where price opened Where price closed The highest price it reached The lowest price it reached That’s it. Nothing complicated. Each candle represents a timeframe. It could be 1 minute, 5 minutes, 1 hour, 1 day. The only difference is how long that candle took to form. Now let’s break the candle into parts. The thick part of the candle is called the body. The thin lines above and below are called the wicks (or shadows). The body shows the distance between the open and the close. The wicks show how far price went before coming back. If the candle is green (bullish), it means price closed higher than it opened. Buyers were in control. If the candle is red (bearish), it means price closed lower than it opened. Sellers were in control. This alone already tells you who won the battle during that timeframe. But the real insight comes from the wicks. A long upper wick means price tried to go up but was pushed back down. Sellers stepped in. A long lower wick means price tried to go down but was pushed back up. Buyers stepped in. This is how you start seeing rejection and pressure in the market. For example, if you see a candle with a small body and a long lower wick at support, it often means buyers are defending that level. If you see a candle with a long upper wick at resistance, it often means sellers are defending that area. This is how candles help you read market behavior without any indicator. Another important thing beginners miss is candle sequence. One candle means little. Multiple candles together tell a story. Many green candles in a row show strong momentum. Many red candles in a row show strong selling pressure. But if you start seeing small candles after a big move, it means momentum is slowing down. The market may be preparing to reverse or range. This is why experienced traders don’t just look at one candle. They look at the pattern being formed. Some common patterns beginners should know: A bullish engulfing candle: a big green candle that covers the previous red candle. This shows buyers took control. A bearish engulfing candle: a big red candle that covers the previous green candle. This shows sellers took control. A doji: a candle with a very small body and long wicks. This shows indecision in the market. These patterns are powerful when they appear at support or resistance. Timeframe also matters. A pattern on the 1-minute chart is weak. The same pattern on the 1-hour or 4-hour chart is much stronger. This is why higher timeframes are more reliable for beginners. When you look at a chart after learning this, stop seeing candles as colors. Start seeing them as actions. Ask yourself: Who is in control here, buyers or sellers? Is price being rejected from this level? Is momentum increasing or slowing down? These questions will teach you more than any indicator. Candlesticks are the language of the market. Indicators only interpret what candles already show. If you can read candles, you can read the chart. And once you can read the chart, trading stops feeling like gambling and starts feeling like analysis. If you learned something from this, follow me. I share beginner friendly crypto and forex lessons daily. #Beginnersguide #CryptocurrencyWealth

How to read a candlestick chart in 5 minutes (Beginner Friendly Guide)

If you open a crypto or forex chart for the first time, it looks confusing.
Red and green candles everywhere. Wicks up and down. Price moving fast.
But the truth is simple: every candlestick is just a story of what price did during a period of time.
Once you understand one candle, the whole chart starts to make sense.
A candlestick shows four things:
Where price opened
Where price closed
The highest price it reached
The lowest price it reached
That’s it. Nothing complicated.
Each candle represents a timeframe. It could be 1 minute, 5 minutes, 1 hour, 1 day. The only difference is how long that candle took to form.
Now let’s break the candle into parts.
The thick part of the candle is called the body.
The thin lines above and below are called the wicks (or shadows).
The body shows the distance between the open and the close.
The wicks show how far price went before coming back.
If the candle is green (bullish), it means price closed higher than it opened. Buyers were in control.
If the candle is red (bearish), it means price closed lower than it opened. Sellers were in control.
This alone already tells you who won the battle during that timeframe.
But the real insight comes from the wicks.
A long upper wick means price tried to go up but was pushed back down. Sellers stepped in.
A long lower wick means price tried to go down but was pushed back up. Buyers stepped in.
This is how you start seeing rejection and pressure in the market.
For example, if you see a candle with a small body and a long lower wick at support, it often means buyers are defending that level.
If you see a candle with a long upper wick at resistance, it often means sellers are defending that area.
This is how candles help you read market behavior without any indicator.
Another important thing beginners miss is candle sequence.
One candle means little. Multiple candles together tell a story.
Many green candles in a row show strong momentum.
Many red candles in a row show strong selling pressure.
But if you start seeing small candles after a big move, it means momentum is slowing down. The market may be preparing to reverse or range.
This is why experienced traders don’t just look at one candle. They look at the pattern being formed.
Some common patterns beginners should know:
A bullish engulfing candle: a big green candle that covers the previous red candle. This shows buyers took control.
A bearish engulfing candle: a big red candle that covers the previous green candle. This shows sellers took control.
A doji: a candle with a very small body and long wicks. This shows indecision in the market.
These patterns are powerful when they appear at support or resistance.
Timeframe also matters.
A pattern on the 1-minute chart is weak.
The same pattern on the 1-hour or 4-hour chart is much stronger.
This is why higher timeframes are more reliable for beginners.
When you look at a chart after learning this, stop seeing candles as colors. Start seeing them as actions.
Ask yourself:
Who is in control here, buyers or sellers?
Is price being rejected from this level?
Is momentum increasing or slowing down?
These questions will teach you more than any indicator.
Candlesticks are the language of the market. Indicators only interpret what candles already show.
If you can read candles, you can read the chart.
And once you can read the chart, trading stops feeling like gambling and starts feeling like analysis.
If you learned something from this, follow me. I share beginner friendly crypto and forex lessons daily.
#Beginnersguide #CryptocurrencyWealth
$BOME just hit 2 of my production targets. The move has played out nicely so far, but I am watching to see if buyers can keep the momentum going from here. If you entered around the retest zone I mentioned earlier, you are already seeing why I prefer waiting for confirmation instead of chasing green candles. Did you enter the $BOME trade?
$BOME just hit 2 of my production targets.

The move has played out nicely so far, but I am watching to see if buyers can keep the momentum going from here.

If you entered around the retest zone I mentioned earlier, you are already seeing why I prefer waiting for confirmation instead of chasing green candles.

Did you enter the $BOME trade?
Cryptomaven01
·
--
$BOME is showing full bullish momentum 🚀

price now approaching the key $0.00140 resistance zone.

If buyers can break and sustain above this level, the next expansion could be $0.00160 → $0.00180

For those looking to take a long, I wouldn't recommend chasing the current candle.

A pullback/retest toward $0.00110 – $0.00120 could offer a better entry opportunity if buyers step in again.

🛑 SL: $0.00104

As long as the structure remains above the retest zone, the bullish momentum stays intact.

Break $0.00140 → $0.00160 → $0.00180 🚀

But after such a strong run, expect sharp pullbacks and volatility. Trade the retest rather than blindly chasing.
BIG MONEY JUST DROPPED THE ONLY PRICE MAP ON EARTH — 99% OF YOU ARE STILL DEAD ASLEEP AND WILL REGRET THIS FOREVER $BTC → $95k – $150k $ETH → $3,800 – $7,500 $SOL → $180 – $320 $LINK → $18 – $45 $ONDO → $1.40 – $4.50 $AAVE → $220 – $580 $HYPE → $120 – $310 $SUI → $5.50 – $17 $TAO → $450 – $1,600 $RENDER → $11 – $36 Standard Chartered. Bernstein. The actual institutions just locked these numbers. ETF money is flooding. RWA is going parabolic. Real capital is already rotating HARD into the only bags with cash flow, oracle demand and institutional rails. This is the cleanest, most ruthless quality rotation of the entire cycle. Next red candle is free money. Miss it and you will buy these same names 80-150% higher while the smart money cashes out on you. Which one are you stacking the heaviest RIGHT NOW while 99% are still sleeping? Drop it below or stay poor forever. NFA • DYOR
BIG MONEY JUST DROPPED THE ONLY PRICE MAP ON EARTH — 99% OF YOU ARE STILL DEAD ASLEEP AND WILL REGRET THIS FOREVER

$BTC → $95k – $150k
$ETH → $3,800 – $7,500
$SOL → $180 – $320
$LINK → $18 – $45
$ONDO → $1.40 – $4.50
$AAVE → $220 – $580
$HYPE → $120 – $310
$SUI → $5.50 – $17
$TAO → $450 – $1,600
$RENDER → $11 – $36

Standard Chartered. Bernstein. The actual institutions just locked these numbers.

ETF money is flooding.
RWA is going parabolic.
Real capital is already rotating HARD into the only bags with cash flow, oracle demand and institutional rails.

This is the cleanest, most ruthless quality rotation of the entire cycle.
Next red candle is free money.
Miss it and you will buy these same names 80-150% higher while the smart money cashes out on you.

Which one are you stacking the heaviest RIGHT NOW while 99% are still sleeping?

Drop it below or stay poor forever.

NFA • DYOR
$BOME is showing full bullish momentum 🚀 price now approaching the key $0.00140 resistance zone. If buyers can break and sustain above this level, the next expansion could be $0.00160 → $0.00180 For those looking to take a long, I wouldn't recommend chasing the current candle. A pullback/retest toward $0.00110 – $0.00120 could offer a better entry opportunity if buyers step in again. 🛑 SL: $0.00104 As long as the structure remains above the retest zone, the bullish momentum stays intact. Break $0.00140 → $0.00160 → $0.00180 🚀 But after such a strong run, expect sharp pullbacks and volatility. Trade the retest rather than blindly chasing. {future}(BOMEUSDT)
$BOME is showing full bullish momentum 🚀

price now approaching the key $0.00140 resistance zone.

If buyers can break and sustain above this level, the next expansion could be $0.00160 → $0.00180

For those looking to take a long, I wouldn't recommend chasing the current candle.

A pullback/retest toward $0.00110 – $0.00120 could offer a better entry opportunity if buyers step in again.

🛑 SL: $0.00104

As long as the structure remains above the retest zone, the bullish momentum stays intact.

Break $0.00140 → $0.00160 → $0.00180 🚀

But after such a strong run, expect sharp pullbacks and volatility. Trade the retest rather than blindly chasing.
·
--
Alcista
$SENT ...... Long Setup {spot}(SENTUSDT) #SENT is showing a recovery after a sharp decline, with price currently around 0.01196. Buyers are attempting to build a base near the 0.01154 support zone, giving a possible reversal setup. A move above 0.01296 can open the way toward 0.01364 and 0.01398. The setup remains valid while 0.01154 holds as support. I’m watching for confirmation above the first target zone before expecting a stronger recovery. Buy & Trade $SENT
$SENT ...... Long Setup


#SENT is showing a recovery after a sharp decline, with price currently around 0.01196. Buyers are attempting to build a base near the 0.01154 support zone, giving a possible reversal setup.

A move above 0.01296 can open the way toward 0.01364 and 0.01398. The setup remains valid while 0.01154 holds as support.

I’m watching for confirmation above the first target zone before expecting a stronger recovery.

Buy & Trade $SENT
🔥 $ON BOTTOM-SWEEP & RELIEF RECOVERY SETUP PAIR: $ON /USDT 📈 DIRECTION: LONG (BUY) ⚡ LEVERAGE: 3x - 5x 📊 ENTRY ZONE: 👉 0.2500 - 0.2650 🎯 TARGETS: 1️⃣ 0.3000 2️⃣ 0.3400 3️⃣ 0.3800 4️⃣ 0.4200 5️⃣ 0.4600+ 🛑 STOP LOSS: ❌ 0.2280 {future}(ONUSDT)
🔥 $ON BOTTOM-SWEEP & RELIEF RECOVERY SETUP

PAIR: $ON /USDT

📈 DIRECTION: LONG (BUY) ⚡ LEVERAGE: 3x - 5x

📊 ENTRY ZONE: 👉 0.2500 - 0.2650

🎯 TARGETS:
1️⃣ 0.3000
2️⃣ 0.3400
3️⃣ 0.3800
4️⃣ 0.4200
5️⃣ 0.4600+

🛑 STOP LOSS: ❌ 0.2280
📉 $ONDO Recovery Fizzles, Grinding Back Toward the Lows Following up on ONDO's earlier bounce attempt off 0.3255 that recovery has since fully rolled over. Price pushed up toward 0.38 before rejecting hard, and it's now grinding steadily back down to 0.3239, right near the same low that sparked the original bounce. The "early, unconfirmed reversal" flagged has failed to hold, and the broader downtrend from the 0.39 highs has clearly reasserted itself this is now a lower-high, lower-low structure testing critical support again. Pair: $ONDO /USDT Direction: SHORT Leverage: 5x Entry Zone: 0.3220 – 0.3280 Take Profit Targets: - TP1: 0.3080 +37.0% - TP2: 0.2950 +72.2% - TP3: 0.2800 +110.3% Stop Loss: 0.3380 {future}(ONDOUSDT)
📉 $ONDO Recovery Fizzles, Grinding Back Toward the Lows

Following up on ONDO's earlier bounce attempt off 0.3255 that recovery has since fully rolled over. Price pushed up toward 0.38 before rejecting hard, and it's now grinding steadily back down to 0.3239, right near the same low that sparked the original bounce. The "early, unconfirmed reversal" flagged has failed to hold, and the broader downtrend from the 0.39 highs has clearly reasserted itself this is now a lower-high, lower-low structure testing critical support again.

Pair: $ONDO /USDT

Direction: SHORT
Leverage: 5x

Entry Zone: 0.3220 – 0.3280

Take Profit Targets:
- TP1: 0.3080 +37.0%
- TP2: 0.2950 +72.2%
- TP3: 0.2800 +110.3%

Stop Loss: 0.3380
$BR – Price holds near a key support, poised for a pull‑back rally $BR LONG Entry: 0.21355 – 0.21419 Stop Loss: 0.20362 TP: 0.21797 - 0.22925 - 0.23642 Plan & Logic The market shows a mature strong regime with the pull‑back confirmed on the daily profile, aligning with the higher‑timeframe trend. Price action is reacting near an important level, so risk management matters here. The setup depends on confirmation around the entry zone and follow-through after the move. {future}(BRUSDT)
$BR – Price holds near a key support, poised for a pull‑back rally

$BR LONG

Entry: 0.21355 – 0.21419
Stop Loss: 0.20362
TP: 0.21797 - 0.22925 - 0.23642

Plan & Logic
The market shows a mature strong regime with the pull‑back confirmed on the daily profile, aligning with the higher‑timeframe trend. Price action is reacting near an important level, so risk management matters here. The setup depends on confirmation around the entry zone and follow-through after the move.
⚡ $BTC Bouncing off Major $63,235 Support Level! ⚡ Bitcoin is showing resilience, holding firm above strong horizontal support at $63,235 and stabilizing at $64,303. The 4H KDJ line is beginning its bullish turn from oversold territory (K: 30.72, J: 24.08), signaling that sellers are losing momentum. Expect a relief rally toward upper EMA resistance as buying pressure builds {spot}(BTCUSDT)
$BTC Bouncing off Major $63,235 Support Level! ⚡
Bitcoin is showing resilience, holding firm above strong horizontal support at $63,235 and stabilizing at $64,303.

The 4H KDJ line is beginning its bullish turn from oversold territory (K: 30.72, J: 24.08), signaling that sellers are losing momentum. Expect a relief rally toward upper EMA resistance as buying pressure builds
🚀 $ACE /USDT BULLISH MOMENTUM CONTINUATION! SECOND WAVE PUMP LOADING PAIR: $ACE /USDT 📈 DIRECTION: LONG (BUY) ⚡ LEVERAGE: 3x - 5x 📊 ENTRY ZONE: 👉 0.2150 - 0.2280 🎯 TARGETS: 1️⃣ 0.2480 2️⃣ 0.2800 3️⃣ 0.3200 4️⃣ 0.3650 5️⃣ 0.4000+ 🛑 STOP LOSS: ❌ 0.1880 {future}(ACEUSDT)
🚀 $ACE /USDT BULLISH MOMENTUM CONTINUATION! SECOND WAVE PUMP LOADING

PAIR: $ACE /USDT

📈 DIRECTION: LONG (BUY) ⚡ LEVERAGE: 3x - 5x

📊 ENTRY ZONE: 👉 0.2150 - 0.2280

🎯 TARGETS:
1️⃣ 0.2480
2️⃣ 0.2800
3️⃣ 0.3200
4️⃣ 0.3650
5️⃣ 0.4000+

🛑 STOP LOSS: ❌ 0.1880
TP1 of my $XAUT analysis hit Always take profit and move your SL to TP1
TP1 of my $XAUT analysis hit
Always take profit and move your SL to TP1
Cryptomaven01
·
--
$XAUT remains bullish after breaking out of its previous descending structure and forming an ascending channel.

🔹 Resistance: 4,450
🔹 Buyer Zone: 4,370
🔹 Bias: Bullish above 4,370
🎯 TP1: 4,430
🎯 TP2: 4,450

A pullback could offer another opportunity for buyers. As long as price holds above 4,370 and respects the ascending support line, the bullish setup remains valid.

⚠️ A break below 4,370 would weaken the bullish outlook.

What’s your view on XAUUSD?

$XAUT remains bullish after breaking out of its previous descending structure and forming an ascending channel. 🔹 Resistance: 4,450 🔹 Buyer Zone: 4,370 🔹 Bias: Bullish above 4,370 🎯 TP1: 4,430 🎯 TP2: 4,450 A pullback could offer another opportunity for buyers. As long as price holds above 4,370 and respects the ascending support line, the bullish setup remains valid. ⚠️ A break below 4,370 would weaken the bullish outlook. What’s your view on XAUUSD? {spot}(XAUTUSDT)
$XAUT remains bullish after breaking out of its previous descending structure and forming an ascending channel.

🔹 Resistance: 4,450
🔹 Buyer Zone: 4,370
🔹 Bias: Bullish above 4,370
🎯 TP1: 4,430
🎯 TP2: 4,450

A pullback could offer another opportunity for buyers. As long as price holds above 4,370 and respects the ascending support line, the bullish setup remains valid.

⚠️ A break below 4,370 would weaken the bullish outlook.

What’s your view on XAUUSD?
BTCUSDT 2H Outlook $BTC is trading between key levels: 🔴 64,600 — Seller Zone 🟢 62,700 — Buyer Zone / TP Rejection from 64,600 and the recent range breakdown suggest bearish momentum could continue while price stays below 64,600. ⚠️ A breakout above 64,600 would weaken the bearish setup. {spot}(BTCUSDT)
BTCUSDT 2H Outlook

$BTC is trading between key levels:

🔴 64,600 — Seller Zone
🟢 62,700 — Buyer Zone / TP

Rejection from 64,600 and the recent range breakdown suggest bearish momentum could continue while price stays below 64,600.

⚠️ A breakout above 64,600 would weaken the bearish setup.
$BNB has broken below its consolidation range on the 15-minute chart, signaling a potential bearish continuation. The Crypto Signals indicator generated a SELL signal with a predefined Entry, Stop Loss and three Take Profit levels to help manage risk. If bearish momentum continues, the downside targets remain in focus. Always wait for confirmation and apply proper risk management before entering a trade. {spot}(BNBUSDT)
$BNB has broken below its consolidation range on the 15-minute chart, signaling a potential bearish continuation.

The Crypto Signals indicator generated a SELL signal with a predefined Entry, Stop Loss and three Take Profit levels to help manage risk.

If bearish momentum continues, the downside targets remain in focus. Always wait for confirmation and apply proper risk management before entering a trade.
🟢 $BTC /USD Buy Setup Bitcoin has reacted perfectly from a key Bullish Order Block in the discount zone after sweeping liquidity, signaling that buyers are defending this area. The recent pullback appears to be a healthy retracement rather than a shift in market structure. As long as price holds above this demand zone, the focus remains on reclaiming the descending trendline and pushing toward higher liquidity. 💰 Entry: 64,400–64,560 🎯 TP1: 64,700 🎯 TP2: 64,850 🎯 TP3: 65,000 🛑 SL: 64,390 Patience, discipline and proper risk management win in the long run. {spot}(BTCUSDT)
🟢 $BTC /USD Buy Setup

Bitcoin has reacted perfectly from a key Bullish Order Block in the discount zone after sweeping liquidity, signaling that buyers are defending this area. The recent pullback appears to be a healthy retracement rather than a shift in market structure.

As long as price holds above this demand zone, the focus remains on reclaiming the descending trendline and pushing toward higher liquidity.

💰 Entry: 64,400–64,560
🎯 TP1: 64,700
🎯 TP2: 64,850
🎯 TP3: 65,000
🛑 SL: 64,390

Patience, discipline and proper risk management win in the long run.
$SPCX first earnings as a public company delivered a classic growth vs. profitability story. 🚀 Revenue: $7.8B (+92% YoY), beating expectations. 📉 Losses: Much smaller than forecast. 💰 AI CapEx: Nearly $16B this quarter and staying elevated. Elon Musk is betting big on orbital AI data centers, scaling compute capacity to ~10GW by 2027, powered by Nvidia chips, while targeting an eye popping $1T annual revenue by 2030. Yet despite the strong numbers, the stock fell as much as 8% after hours. The market isn't questioning today's execution, it's questioning whether tomorrow's massive AI investments will generate the cash flows needed to justify a $1.65T valuation. Great quarter. Bigger ambitions. Even bigger expectations {future}(SPCXUSDT)
$SPCX first earnings as a public company delivered a classic growth vs. profitability story.

🚀 Revenue: $7.8B (+92% YoY), beating expectations.
📉 Losses: Much smaller than forecast.
💰 AI CapEx: Nearly $16B this quarter and staying elevated.

Elon Musk is betting big on orbital AI data centers, scaling compute capacity to ~10GW by 2027, powered by Nvidia chips, while targeting an eye popping $1T annual revenue by 2030.

Yet despite the strong numbers, the stock fell as much as 8% after hours.

The market isn't questioning today's execution, it's questioning whether tomorrow's massive AI investments will generate the cash flows needed to justify a $1.65T valuation.

Great quarter. Bigger ambitions. Even bigger expectations
$BTC is coiling and the next move could set the tone for the weeks ahead. Bulls have defended every recent dip, gradually reclaiming ground as BTC pushes toward the midpoint of its range. The $65K Golden Zone is the key level to watch. 🟢 A decisive break above $65K could open the door to $66.9K–$68.5K, where major supply awaits. 🔴 Failure to break higher could send BTC back toward $62.2K. If that support gives way, the $57K–$58K demand zone becomes the next critical area. Price is compressing beneath resistance, a setup that often precedes a powerful expansion. The breakout direction will likely define the next major trend. {spot}(BTCUSDT) Stay patient. The market is getting ready to choose a side
$BTC is coiling and the next move could set the tone for the weeks ahead.

Bulls have defended every recent dip, gradually reclaiming ground as BTC pushes toward the midpoint of its range. The $65K Golden Zone is the key level to watch.

🟢 A decisive break above $65K could open the door to $66.9K–$68.5K, where major supply awaits.

🔴 Failure to break higher could send BTC back toward $62.2K. If that support gives way, the $57K–$58K demand zone becomes the next critical area.

Price is compressing beneath resistance, a setup that often precedes a powerful expansion. The breakout direction will likely define the next major trend.


Stay patient. The market is getting ready to choose a side
$SPCX BULLISH Setup Price within consolidation box but ready to fly TP at consolidation top, trail SL New entry after breakout of consolidation box. Continue for further ride {future}(SPCXUSDT) Manage your risk.
$SPCX BULLISH Setup

Price within consolidation box but ready to fly

TP at consolidation top, trail SL
New entry after breakout of consolidation box. Continue for further ride


Manage your risk.
·
--
Alcista
$ETH USD remains structurally bullish. Buyers continue to defend the 1,850–1,800 demand zone, keeping the higher-high / higher-low structure intact. Current consolidation below 1,980–2,000 resistance looks more like accumulation than distribution. 👀 Key level: 2,000 Break above → buy-side liquidity opens Bullish momentum strengthens Next target: 2,100 As long as 1,850–1,800 holds, the broader bullish outlook remains valid. Patience for confirmation is better than chasing price. {future}(ETHUSDT)
$ETH USD remains structurally bullish.

Buyers continue to defend the 1,850–1,800 demand zone, keeping the higher-high / higher-low structure intact. Current consolidation below 1,980–2,000 resistance looks more like accumulation than distribution.

👀 Key level: 2,000

Break above → buy-side liquidity opens

Bullish momentum strengthens

Next target: 2,100

As long as 1,850–1,800 holds, the broader bullish outlook remains valid. Patience for confirmation is better than chasing price.
$XAU has delivered a textbook Smart Money Concepts expansion. After sweeping sell side liquidity, price broke above the major bearish trendline and shifted into a bullish market structure, printing higher highs. The retracement into the 4010–4020 Institutional Demand zone was successfully defended with a double-bottom liquidity sweep, confirming strong buyer interest. Following the mitigation of internal FVGs and acceptance above the 4070–4080 rebalance zone, price exploded through the 4110–4120 HTF Buy-Side Liquidity, confirming institutional strength and full bullish control. ⚠️ Trade Plan • Bias: Bullish • Don't chase the current rally. • Watch for a healthy pullback into 4110–4120, where the broken liquidity zone may flip into support. • Wait for a lower-timeframe CHoCH/BOS confirmation before considering long entries. 🎯 Bullish Target: 4180+ Patience and confirmation separate high-probability trades from emotional entries.
$XAU has delivered a textbook Smart Money Concepts expansion.

After sweeping sell side liquidity, price broke above the major bearish trendline and shifted into a bullish market structure, printing higher highs. The retracement into the 4010–4020 Institutional Demand zone was successfully defended with a double-bottom liquidity sweep, confirming strong buyer interest.

Following the mitigation of internal FVGs and acceptance above the 4070–4080 rebalance zone, price exploded through the 4110–4120 HTF Buy-Side Liquidity, confirming institutional strength and full bullish control.

⚠️ Trade Plan
• Bias: Bullish
• Don't chase the current rally.
• Watch for a healthy pullback into 4110–4120, where the broken liquidity zone may flip into support.
• Wait for a lower-timeframe CHoCH/BOS confirmation before considering long entries.

🎯 Bullish Target: 4180+

Patience and confirmation separate high-probability trades from emotional entries.
Inicia sesión para explorar más contenidos
Únete a usuarios globales de criptomonedas en Binance Square
⚡️ Obtén información útil y actualizada sobre criptos.
💬 Avalado por el mayor exchange de criptomonedas en el mundo.
👍 Descubre perspectivas reales de creadores verificados.
Email/número de teléfono
Mapa del sitio
Preferencias de cookies
Términos y condiciones de la plataforma