

CoinAdvisor
726 Publicaciones

CoinAdvisor
Denunciar
Bloquear usuario
Professional trader & market researcher. My own scanner watches the whole futures board 24/7. I publish measurements - plus a weekly scorecard with misses.
8 Siguiendo
705 Seguidores
1.2K+ Me gusta
Publicaciones
·
--
Ver traducción
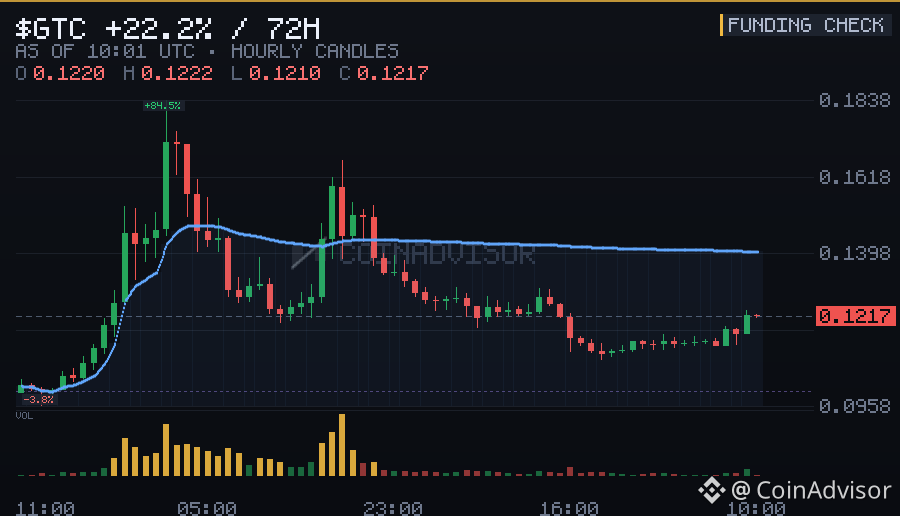
🌡️ Who’s paying to hold, right now:
GTC -0.69% per 8h → shorts pay, crowd is short
PUMPBTC +0.28% per 8h → longs pay, crowd is long
SIREN +0.25% per 8h → longs pay, crowd is long
Current funding rates. Measured 10:01 UTC.
Paying a premium to stay in a position is conviction — until it becomes the exit stampede.
$GTC $PUMPBTC $SIREN #Write2Earn
🌡️ Who’s paying to hold, right now:
GTC -0.69% per 8h → shorts pay, crowd is short
PUMPBTC +0.28% per 8h → longs pay, crowd is long
SIREN +0.25% per 8h → longs pay, crowd is long
Current funding rates. Measured 10:01 UTC.
Paying a premium to stay in a position is conviction — until it becomes the exit stampede.
$GTC $PUMPBTC $SIREN #Write2Earn
GTC -0.69% per 8h → shorts pay, crowd is short
PUMPBTC +0.28% per 8h → longs pay, crowd is long
SIREN +0.25% per 8h → longs pay, crowd is long
Current funding rates. Measured 10:01 UTC.
Paying a premium to stay in a position is conviction — until it becomes the exit stampede.
$GTC $PUMPBTC $SIREN #Write2Earn
77
·
--
Artículo
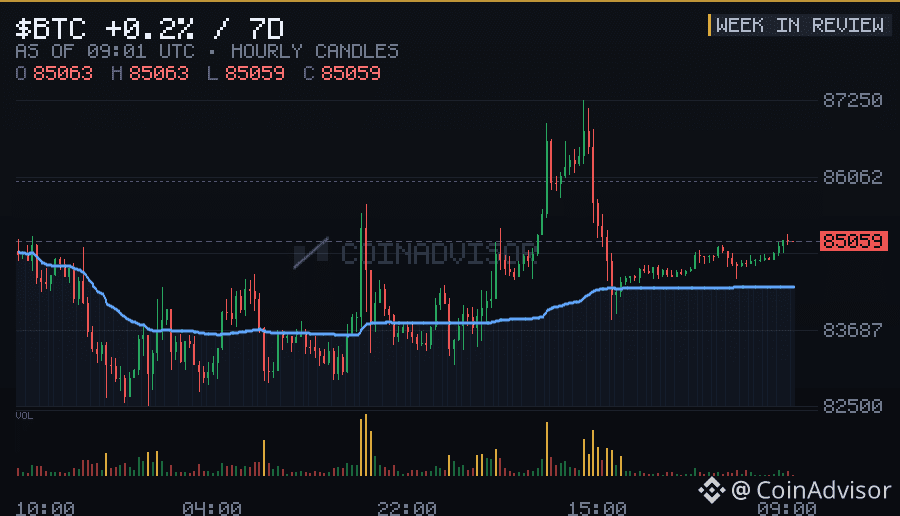
Revisión de la semana en Binance Futures: 108 señales de bombeoEsta semana, Binance Futures registró 108 movimientos de +8% por hora o más.
Las mayores corridas desde la detección:
- Langosta: pico +211%, mínimo después de -7%
- EE. UU.: pico +91%, mínimo después de 0%
- MOVR: pico +74%, mínimo después de -3%
- Langosta: pico +74%, mínimo después de -2%
- SAND: pico +64%, mínimo después de -2%
Las liquidaciones en monedas impulsadas totalizaron ~$62.2M (cota inferior).
Siete días de vigilancia completa se condensaron: se midió cada número anterior; ninguna era una vibra.
$Langosta $US $MOVR #Write2Earn
Revisión de la semana en Binance Futures: 108 señales de bombeo
Esta semana, Binance Futures registró 108 movimientos de +8% por hora o más.
Las mayores corridas desde la detección:
- Langosta: pico +211%, mínimo después de -7%
- EE. UU.: pico +91%, mínimo después de 0%
- MOVR: pico +74%, mínimo después de -3%
- Langosta: pico +74%, mínimo después de -2%
- SAND: pico +64%, mínimo después de -2%
Las liquidaciones en monedas impulsadas totalizaron ~$62.2M (cota inferior).
Siete días de vigilancia completa se condensaron: se midió cada número anterior; ninguna era una vibra.
$Langosta $US $MOVR #Write2Earn
Las mayores corridas desde la detección:
- Langosta: pico +211%, mínimo después de -7%
- EE. UU.: pico +91%, mínimo después de 0%
- MOVR: pico +74%, mínimo después de -3%
- Langosta: pico +74%, mínimo después de -2%
- SAND: pico +64%, mínimo después de -2%
Las liquidaciones en monedas impulsadas totalizaron ~$62.2M (cota inferior).
Siete días de vigilancia completa se condensaron: se midió cada número anterior; ninguna era una vibra.
$Langosta $US $MOVR #Write2Earn
103
·
--
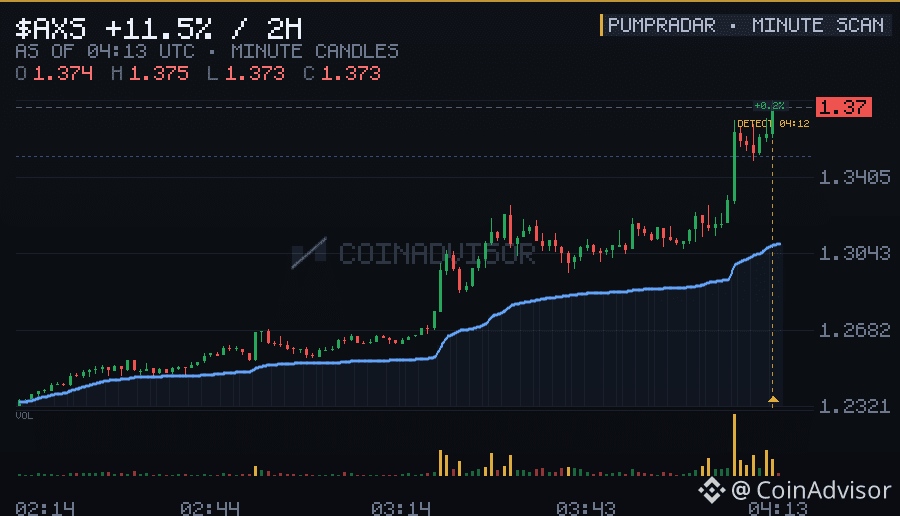
⚡ La cinta se está moviendo — líderes por horas en Binance Futures:
AXS +8.8% (1h) → $40M volumen 24h
Movimientos por hora desde las velas de 1 minuto de Binance. Medido a las 04:13 UTC.
Clasificado por calor, no por bombo: la lista completa de futuros, minuto a minuto.
$AXS #Write2Earn
⚡ La cinta se está moviendo — líderes por horas en Binance Futures:
AXS +8.8% (1h) → $40M volumen 24h
Movimientos por hora desde las velas de 1 minuto de Binance. Medido a las 04:13 UTC.
Clasificado por calor, no por bombo: la lista completa de futuros, minuto a minuto.
$AXS #Write2Earn
AXS +8.8% (1h) → $40M volumen 24h
Movimientos por hora desde las velas de 1 minuto de Binance. Medido a las 04:13 UTC.
Clasificado por calor, no por bombo: la lista completa de futuros, minuto a minuto.
$AXS #Write2Earn
102
·
--
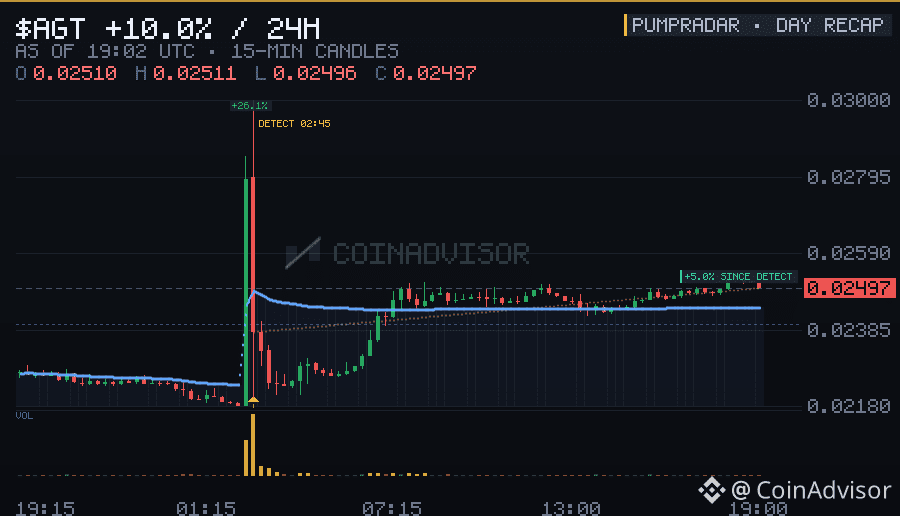
📊 Cerrando el libro sobre 24 horas de cinta de futuros: 15 monedas se dispararon en una sola hora.
Picos horarios más fuertes:
AGT +31.1% en una hora → $11M volumen 24h
AIN +27.1% en una hora → $220M volumen 24h
PUMPBTC +18.4% en una hora → $37M volumen 24h
Ventana móvil de 24 horas. Medido a las 19:02 UTC.
Compilado por PumpRadar a partir de un día completo de cinta minuto a minuto.
$AGT $AIN $PUMPBTC #Write2Earn
📊 Cerrando el libro sobre 24 horas de cinta de futuros: 15 monedas se dispararon en una sola hora.
Picos horarios más fuertes:
AGT +31.1% en una hora → $11M volumen 24h
AIN +27.1% en una hora → $220M volumen 24h
PUMPBTC +18.4% en una hora → $37M volumen 24h
Ventana móvil de 24 horas. Medido a las 19:02 UTC.
Compilado por PumpRadar a partir de un día completo de cinta minuto a minuto.
$AGT $AIN $PUMPBTC #Write2Earn
Picos horarios más fuertes:
AGT +31.1% en una hora → $11M volumen 24h
AIN +27.1% en una hora → $220M volumen 24h
PUMPBTC +18.4% en una hora → $37M volumen 24h
Ventana móvil de 24 horas. Medido a las 19:02 UTC.
Compilado por PumpRadar a partir de un día completo de cinta minuto a minuto.
$AGT $AIN $PUMPBTC #Write2Earn
125
·
--
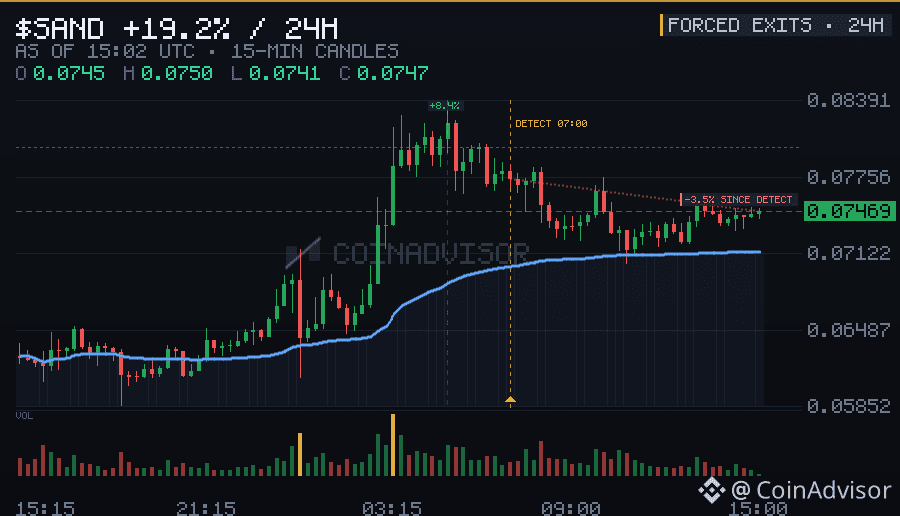
🩸 Salidas forzadas del día, bombeando monedas:
SAND → $874K borrado (principalmente largos)
MAGMA → $697K borrado (principalmente largos)
QNT → $197K borrado (principalmente cortos)
Ventana móvil de 24 h. Medido a las 15:02 UTC.
Mira el lado que está siendo borrado, no el total: ahí es donde está el combustible para el próximo movimiento.
$SAND $MAGMA $QNT #Escribe2Gana
🩸 Salidas forzadas del día, bombeando monedas:
SAND → $874K borrado (principalmente largos)
MAGMA → $697K borrado (principalmente largos)
QNT → $197K borrado (principalmente cortos)
Ventana móvil de 24 h. Medido a las 15:02 UTC.
Mira el lado que está siendo borrado, no el total: ahí es donde está el combustible para el próximo movimiento.
$SAND $MAGMA $QNT #Escribe2Gana
SAND → $874K borrado (principalmente largos)
MAGMA → $697K borrado (principalmente largos)
QNT → $197K borrado (principalmente cortos)
Ventana móvil de 24 h. Medido a las 15:02 UTC.
Mira el lado que está siendo borrado, no el total: ahí es donde está el combustible para el próximo movimiento.
$SAND $MAGMA $QNT #Escribe2Gana
165
·
--
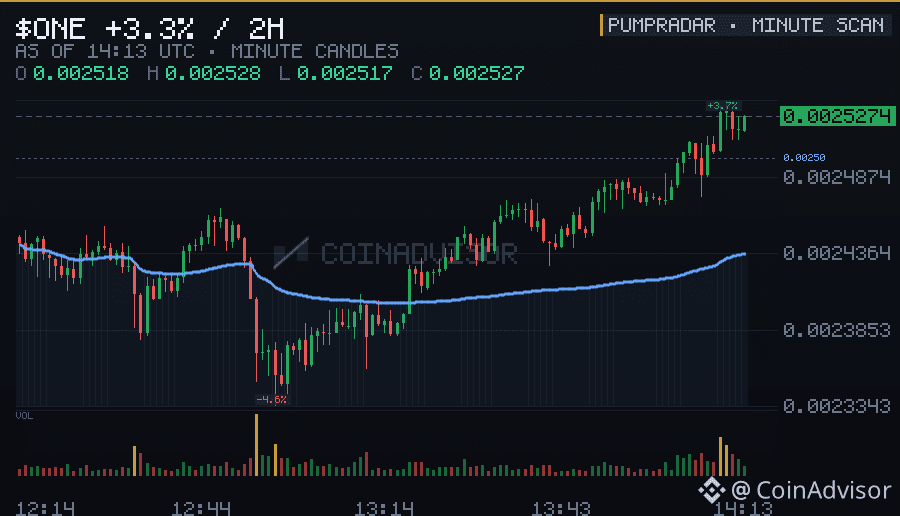
⚡ Ahora mismo, estas parejas de futuros están en marcha:
ONE +5.9% (1h) → $111M volumen 24h
↳ interés abierto ×1.37 desde la detección — acumulación de apalancamiento
MOVR +5.3% (1h) → $203M volumen 24h
↳ 11.ª subida de este mes
Movimientos por hora desde velas de 1 minuto de Binance. Medido a las 14:13 UTC.
El tablero nunca duerme y el escaneo tampoco: cada par, cada minuto, sin lista de seguimiento.
$ONE $MOVR #Write2Earn
⚡ Ahora mismo, estas parejas de futuros están en marcha:
ONE +5.9% (1h) → $111M volumen 24h
↳ interés abierto ×1.37 desde la detección — acumulación de apalancamiento
MOVR +5.3% (1h) → $203M volumen 24h
↳ 11.ª subida de este mes
Movimientos por hora desde velas de 1 minuto de Binance. Medido a las 14:13 UTC.
El tablero nunca duerme y el escaneo tampoco: cada par, cada minuto, sin lista de seguimiento.
$ONE $MOVR #Write2Earn
ONE +5.9% (1h) → $111M volumen 24h
↳ interés abierto ×1.37 desde la detección — acumulación de apalancamiento
MOVR +5.3% (1h) → $203M volumen 24h
↳ 11.ª subida de este mes
Movimientos por hora desde velas de 1 minuto de Binance. Medido a las 14:13 UTC.
El tablero nunca duerme y el escaneo tampoco: cada par, cada minuto, sin lista de seguimiento.
$ONE $MOVR #Write2Earn
176
·
--
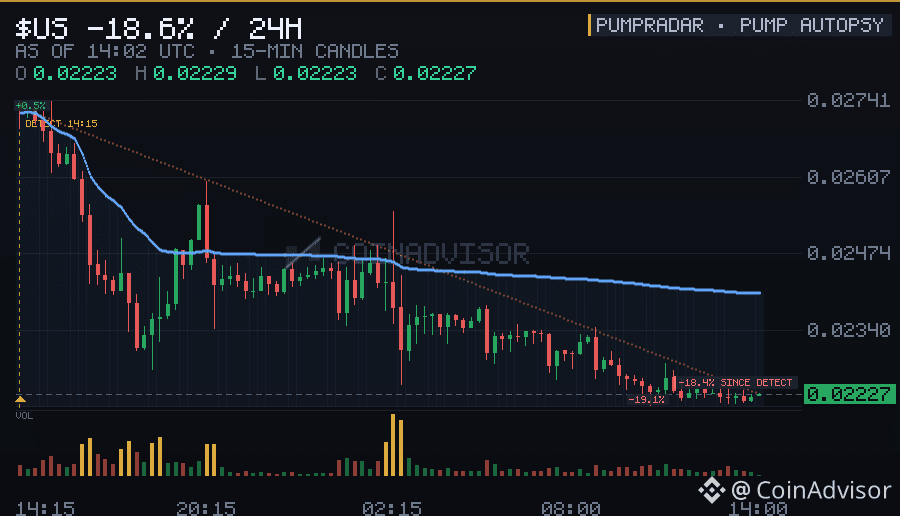
🧪 Caso práctico del tramo: EE. UU.
Detectado a +8.5%/1h sobre un volumen diario de $147M en el momento de la detección.
Pico: +91% (840 min después de la detección). Bajo después: 0%.
El interés abierto creció ×2.23 durante el movimiento: entró el apalancamiento.
Liquidaciones en el camino: $467,731 en shorts vs $415,151 en long.
Secuencia de libro de texto: pico, entrada masiva, agotamiento. Cada minuto de ello estuvo en PumpRadar.
$US #Write2Earn
🧪 Caso práctico del tramo: EE. UU.
Detectado a +8.5%/1h sobre un volumen diario de $147M en el momento de la detección.
Pico: +91% (840 min después de la detección). Bajo después: 0%.
El interés abierto creció ×2.23 durante el movimiento: entró el apalancamiento.
Liquidaciones en el camino: $467,731 en shorts vs $415,151 en long.
Secuencia de libro de texto: pico, entrada masiva, agotamiento. Cada minuto de ello estuvo en PumpRadar.
$US #Write2Earn
Detectado a +8.5%/1h sobre un volumen diario de $147M en el momento de la detección.
Pico: +91% (840 min después de la detección). Bajo después: 0%.
El interés abierto creció ×2.23 durante el movimiento: entró el apalancamiento.
Liquidaciones en el camino: $467,731 en shorts vs $415,151 en long.
Secuencia de libro de texto: pico, entrada masiva, agotamiento. Cada minuto de ello estuvo en PumpRadar.
$US #Write2Earn
46
·
--
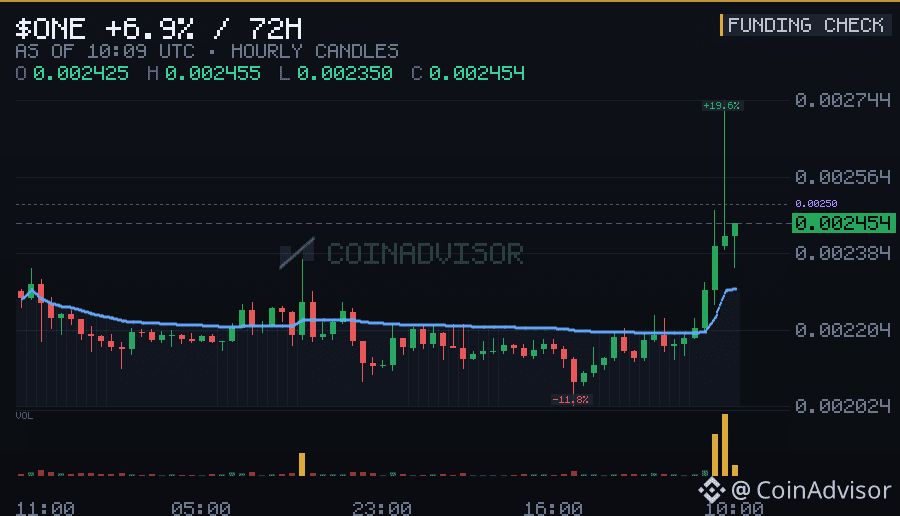
⚖️ censo de la multitud mediante financiación, esta hora:
UNO -1.69% cada 8 h → los shorts pagan, la multitud está en short
1000000BOB +0.38% cada 8 h → los longs pagan, la multitud está en long
2Z -0.37% cada 8 h → los shorts pagan, la multitud está en short
Tasas de financiación actuales. Medido a las 10:09 UTC.
Pagar una prima por permanecer en una posición es convicción: hasta que se convierte en la estampida de salida.
$ONE $1000000BOB $2Z #Write2Earn
⚖️ censo de la multitud mediante financiación, esta hora:
UNO -1.69% cada 8 h → los shorts pagan, la multitud está en short
1000000BOB +0.38% cada 8 h → los longs pagan, la multitud está en long
2Z -0.37% cada 8 h → los shorts pagan, la multitud está en short
Tasas de financiación actuales. Medido a las 10:09 UTC.
Pagar una prima por permanecer en una posición es convicción: hasta que se convierte en la estampida de salida.
$ONE $1000000BOB $2Z #Write2Earn
UNO -1.69% cada 8 h → los shorts pagan, la multitud está en short
1000000BOB +0.38% cada 8 h → los longs pagan, la multitud está en long
2Z -0.37% cada 8 h → los shorts pagan, la multitud está en short
Tasas de financiación actuales. Medido a las 10:09 UTC.
Pagar una prima por permanecer en una posición es convicción: hasta que se convierte en la estampida de salida.
$ONE $1000000BOB $2Z #Write2Earn
128
·
--
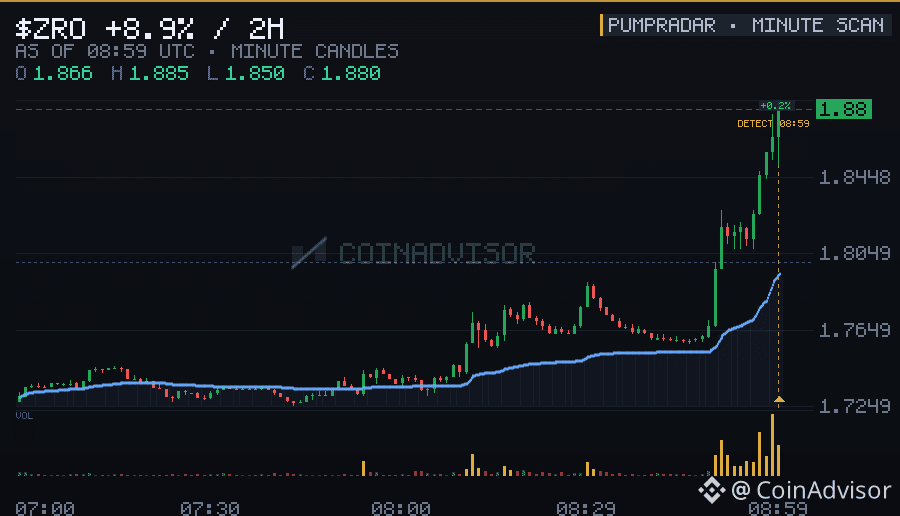
📡 Contacto de radar — los movimientos horarios más fuertes:
ZRO +8.2% (1h) → $89M volumen 24h
↳ 10.º pico de este mes
AR +7.8% (1h) → $18M volumen 24h
↳ 11.º pico de este mes
VELVET +7.2% (1h) → $105M volumen 24h
↳ 11.º pico de este mes
Movimientos por hora desde velas de 1 minuto de Binance. Medido a las 08:59 UTC.
El tablero nunca duerme y el escaneo tampoco: cada par, cada minuto, sin lista de seguimiento.
$ZRO $AR $VELVET #Write2Earn
📡 Contacto de radar — los movimientos horarios más fuertes:
ZRO +8.2% (1h) → $89M volumen 24h
↳ 10.º pico de este mes
AR +7.8% (1h) → $18M volumen 24h
↳ 11.º pico de este mes
VELVET +7.2% (1h) → $105M volumen 24h
↳ 11.º pico de este mes
Movimientos por hora desde velas de 1 minuto de Binance. Medido a las 08:59 UTC.
El tablero nunca duerme y el escaneo tampoco: cada par, cada minuto, sin lista de seguimiento.
$ZRO $AR $VELVET #Write2Earn
ZRO +8.2% (1h) → $89M volumen 24h
↳ 10.º pico de este mes
AR +7.8% (1h) → $18M volumen 24h
↳ 11.º pico de este mes
VELVET +7.2% (1h) → $105M volumen 24h
↳ 11.º pico de este mes
Movimientos por hora desde velas de 1 minuto de Binance. Medido a las 08:59 UTC.
El tablero nunca duerme y el escaneo tampoco: cada par, cada minuto, sin lista de seguimiento.
$ZRO $AR $VELVET #Write2Earn
54
·
--
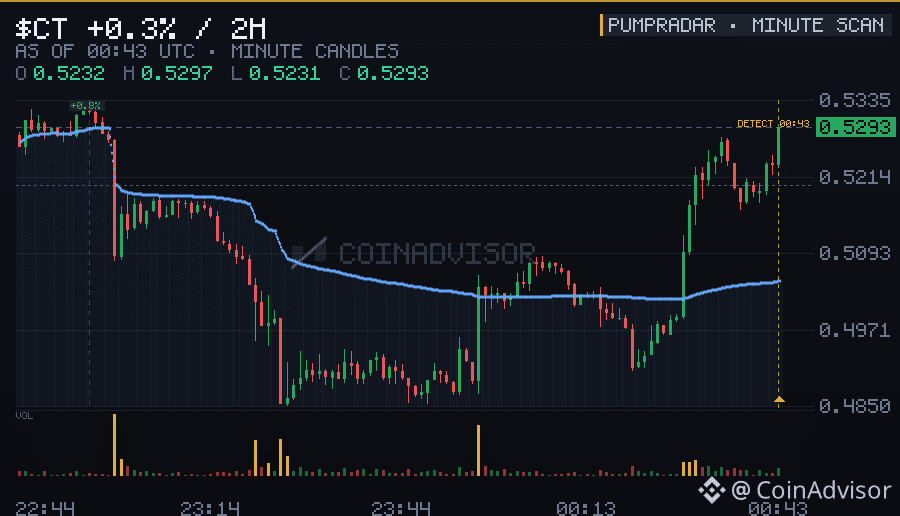
🔥 El tablero acaba de encenderse. Líderes de la hora:
CT +7.9% (1h) → $222M volumen 24h · listado hace 1d
↳ 4º pico de este mes
Movimientos por hora desde velas de 1 minuto de Binance. Medido a las 00:43 UTC.
Para cuando un movimiento se vuelve tendencia en redes sociales, el flujo ya le había dicho a PumpRadar. Nivel minuto, tablero completo.
$CT #Write2Earn
🔥 El tablero acaba de encenderse. Líderes de la hora:
CT +7.9% (1h) → $222M volumen 24h · listado hace 1d
↳ 4º pico de este mes
Movimientos por hora desde velas de 1 minuto de Binance. Medido a las 00:43 UTC.
Para cuando un movimiento se vuelve tendencia en redes sociales, el flujo ya le había dicho a PumpRadar. Nivel minuto, tablero completo.
$CT #Write2Earn
CT +7.9% (1h) → $222M volumen 24h · listado hace 1d
↳ 4º pico de este mes
Movimientos por hora desde velas de 1 minuto de Binance. Medido a las 00:43 UTC.
Para cuando un movimiento se vuelve tendencia en redes sociales, el flujo ya le había dicho a PumpRadar. Nivel minuto, tablero completo.
$CT #Write2Earn
115
·
--
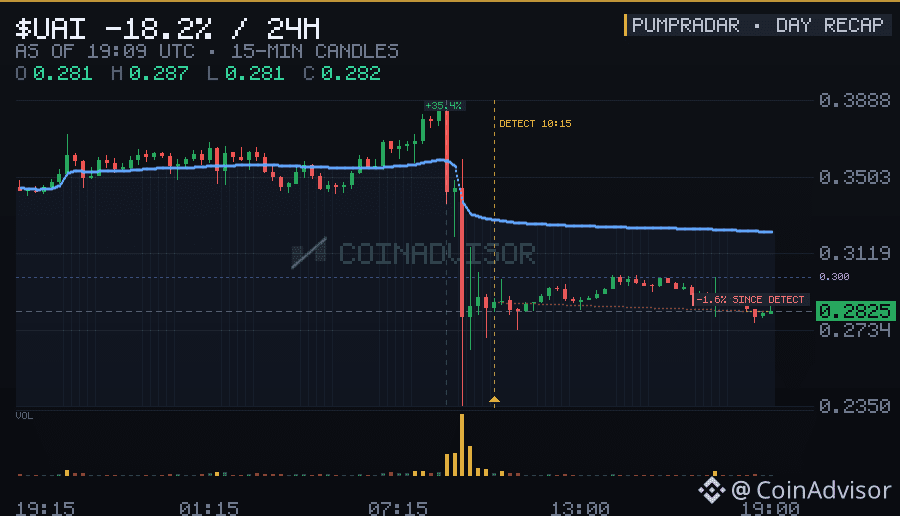
🗞️ Resumen del día de futuros: 14 monedas alcanzaron la velocidad de escape en la hora.
Las mayores subidas por hora:
UAI +14.0% en una hora → $59M de volumen en 24h
SCR +12.0% en una hora → $74M de volumen en 24h
龙虾 +10.5% en una hora → $786M de volumen en 24h
Ventana móvil de 24h. Medido a las 19:09 UTC.
El mismo análisis, todos los días: la tabla completa de futuros, minuto a minuto — ganadores y decepciones por igual.
$UAI $SCR $龙虾 #Write2Earn
🗞️ Resumen del día de futuros: 14 monedas alcanzaron la velocidad de escape en la hora.
Las mayores subidas por hora:
UAI +14.0% en una hora → $59M de volumen en 24h
SCR +12.0% en una hora → $74M de volumen en 24h
龙虾 +10.5% en una hora → $786M de volumen en 24h
Ventana móvil de 24h. Medido a las 19:09 UTC.
El mismo análisis, todos los días: la tabla completa de futuros, minuto a minuto — ganadores y decepciones por igual.
$UAI $SCR $龙虾 #Write2Earn
Las mayores subidas por hora:
UAI +14.0% en una hora → $59M de volumen en 24h
SCR +12.0% en una hora → $74M de volumen en 24h
龙虾 +10.5% en una hora → $786M de volumen en 24h
Ventana móvil de 24h. Medido a las 19:09 UTC.
El mismo análisis, todos los días: la tabla completa de futuros, minuto a minuto — ganadores y decepciones por igual.
$UAI $SCR $龙虾 #Write2Earn
21
·
--
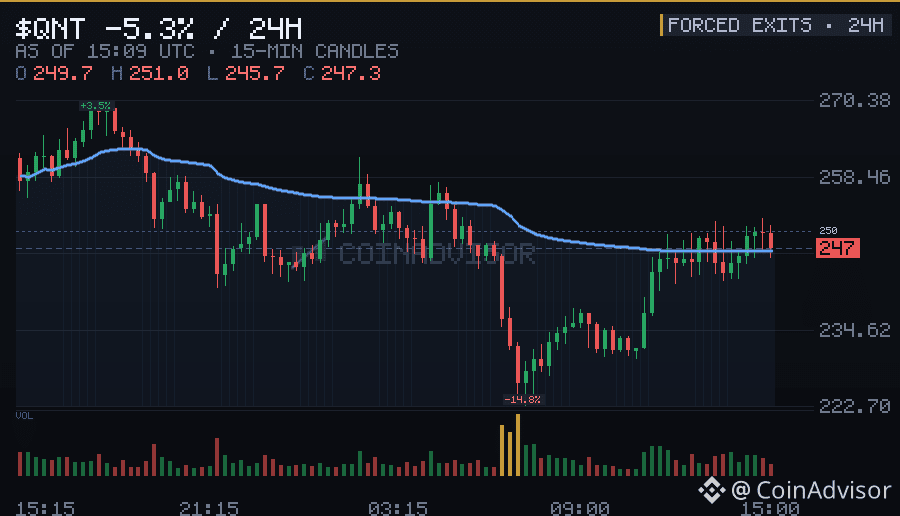
🧨 Donde llegaron hoy las llamadas de margen:
龙虾 → $2.2M borrados (principalmente largos)
QNT → $206K borrados (principalmente cortos)
UAI → $176K borrados (principalmente largos)
CT → $117K borrados (principalmente largos)
Ventana móvil de 24 h. Medido a las 15:09 UTC.
Nadie planea una liquidación — y justo por eso mueven el precio de forma más “honesta” que cualquier orden.
$龙虾 $QNT $UAI #Write2Earn
🧨 Donde llegaron hoy las llamadas de margen:
龙虾 → $2.2M borrados (principalmente largos)
QNT → $206K borrados (principalmente cortos)
UAI → $176K borrados (principalmente largos)
CT → $117K borrados (principalmente largos)
Ventana móvil de 24 h. Medido a las 15:09 UTC.
Nadie planea una liquidación — y justo por eso mueven el precio de forma más “honesta” que cualquier orden.
$龙虾 $QNT $UAI #Write2Earn
龙虾 → $2.2M borrados (principalmente largos)
QNT → $206K borrados (principalmente cortos)
UAI → $176K borrados (principalmente largos)
CT → $117K borrados (principalmente largos)
Ventana móvil de 24 h. Medido a las 15:09 UTC.
Nadie planea una liquidación — y justo por eso mueven el precio de forma más “honesta” que cualquier orden.
$龙虾 $QNT $UAI #Write2Earn
189
·
--
⚡ Ciclo completo, minuto a minuto: 龙虾
Detectado con +11,9%/1 h en un volumen diario de 139 M de $ en el momento de la detección.
Pico: +211% (1328 min después de la detección). Mínimo después: -7%.
El interés abierto creció ×4,04 durante el movimiento: se acumuló el apalancamiento.
Liquidaciones en el camino: 1.157.744 $ en shorts vs 494.004 $ en longs.
Cada impulso cree que es especial. Los datos por minuto dicen lo contrario: el patrón se repitió.
$龙虾 #Write2Earn
⚡ Ciclo completo, minuto a minuto: 龙虾
Detectado con +11,9%/1 h en un volumen diario de 139 M de $ en el momento de la detección.
Pico: +211% (1328 min después de la detección). Mínimo después: -7%.
El interés abierto creció ×4,04 durante el movimiento: se acumuló el apalancamiento.
Liquidaciones en el camino: 1.157.744 $ en shorts vs 494.004 $ en longs.
Cada impulso cree que es especial. Los datos por minuto dicen lo contrario: el patrón se repitió.
$龙虾 #Write2Earn
Detectado con +11,9%/1 h en un volumen diario de 139 M de $ en el momento de la detección.
Pico: +211% (1328 min después de la detección). Mínimo después: -7%.
El interés abierto creció ×4,04 durante el movimiento: se acumuló el apalancamiento.
Liquidaciones en el camino: 1.157.744 $ en shorts vs 494.004 $ en longs.
Cada impulso cree que es especial. Los datos por minuto dicen lo contrario: el patrón se repitió.
$龙虾 #Write2Earn
255
·
--
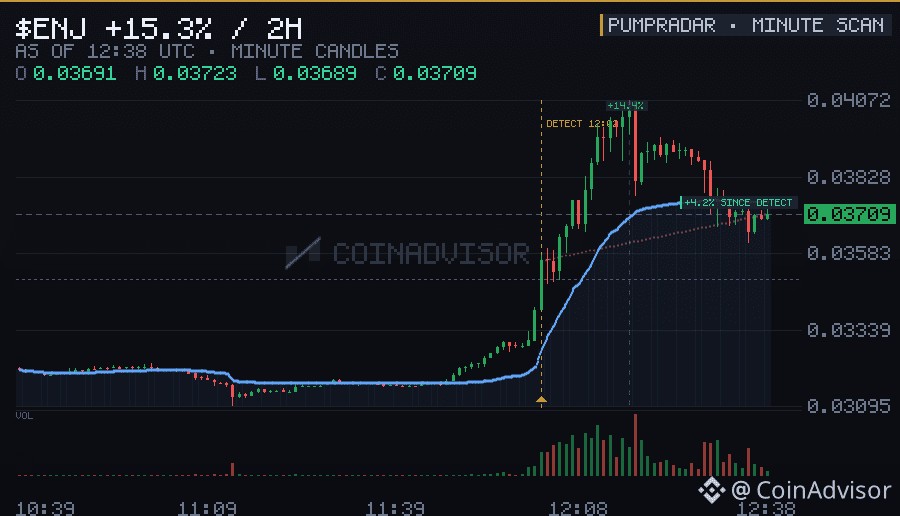
📡 Contacto de radar — los movimientos más fuertes por hora:
ENJ +17,4% (1h) → $47M volumen 24h
↳ open interest ×1,73 desde la detección — acumulación de apalancamiento
龙虾 +11,4% (1h) → $766M volumen 24h
↳ 41º pico de este mes
APE +7,8% (1h) → $12M volumen 24h
GALA +5,3% (1h) → $39M volumen 24h
Movimientos por hora a partir de velas de 1 minuto de Binance. Medido a las 12:38 UTC.
El panel nunca duerme y el escaneo tampoco: cada par, cada minuto, sin lista de seguimiento.
$ENJ $龙虾 $APE #Write2Earn
📡 Contacto de radar — los movimientos más fuertes por hora:
ENJ +17,4% (1h) → $47M volumen 24h
↳ open interest ×1,73 desde la detección — acumulación de apalancamiento
龙虾 +11,4% (1h) → $766M volumen 24h
↳ 41º pico de este mes
APE +7,8% (1h) → $12M volumen 24h
GALA +5,3% (1h) → $39M volumen 24h
Movimientos por hora a partir de velas de 1 minuto de Binance. Medido a las 12:38 UTC.
El panel nunca duerme y el escaneo tampoco: cada par, cada minuto, sin lista de seguimiento.
$ENJ $龙虾 $APE #Write2Earn
ENJ +17,4% (1h) → $47M volumen 24h
↳ open interest ×1,73 desde la detección — acumulación de apalancamiento
龙虾 +11,4% (1h) → $766M volumen 24h
↳ 41º pico de este mes
APE +7,8% (1h) → $12M volumen 24h
GALA +5,3% (1h) → $39M volumen 24h
Movimientos por hora a partir de velas de 1 minuto de Binance. Medido a las 12:38 UTC.
El panel nunca duerme y el escaneo tampoco: cada par, cada minuto, sin lista de seguimiento.
$ENJ $龙虾 $APE #Write2Earn
165
·
--
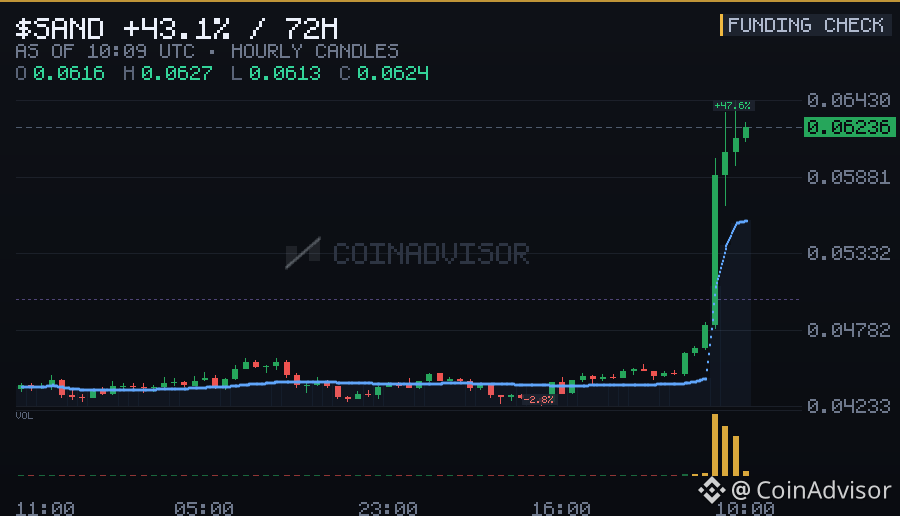
🌡️ El informe de alquiler: estas posiciones pagan por existir:
SAND -1.52% por 8h → pagan los shorts, la multitud está corta
BWET -0.40% por 8h → pagan los shorts, la multitud está corta
MANA -0.37% por 8h → pagan los shorts, la multitud está corta
GTC -0.37% por 8h → pagan los shorts, la multitud está corta
Tasas de financiación actuales. Medido a las 10:09 UTC.
Los libros equilibrados se mueven lentamente; los desbalanceados se rompen. Estas son las desbalanceadas.
$SAND $BWET $MANA #Write2Earn
🌡️ El informe de alquiler: estas posiciones pagan por existir:
SAND -1.52% por 8h → pagan los shorts, la multitud está corta
BWET -0.40% por 8h → pagan los shorts, la multitud está corta
MANA -0.37% por 8h → pagan los shorts, la multitud está corta
GTC -0.37% por 8h → pagan los shorts, la multitud está corta
Tasas de financiación actuales. Medido a las 10:09 UTC.
Los libros equilibrados se mueven lentamente; los desbalanceados se rompen. Estas son las desbalanceadas.
$SAND $BWET $MANA #Write2Earn
SAND -1.52% por 8h → pagan los shorts, la multitud está corta
BWET -0.40% por 8h → pagan los shorts, la multitud está corta
MANA -0.37% por 8h → pagan los shorts, la multitud está corta
GTC -0.37% por 8h → pagan los shorts, la multitud está corta
Tasas de financiación actuales. Medido a las 10:09 UTC.
Los libros equilibrados se mueven lentamente; los desbalanceados se rompen. Estas son las desbalanceadas.
$SAND $BWET $MANA #Write2Earn
126
·
--
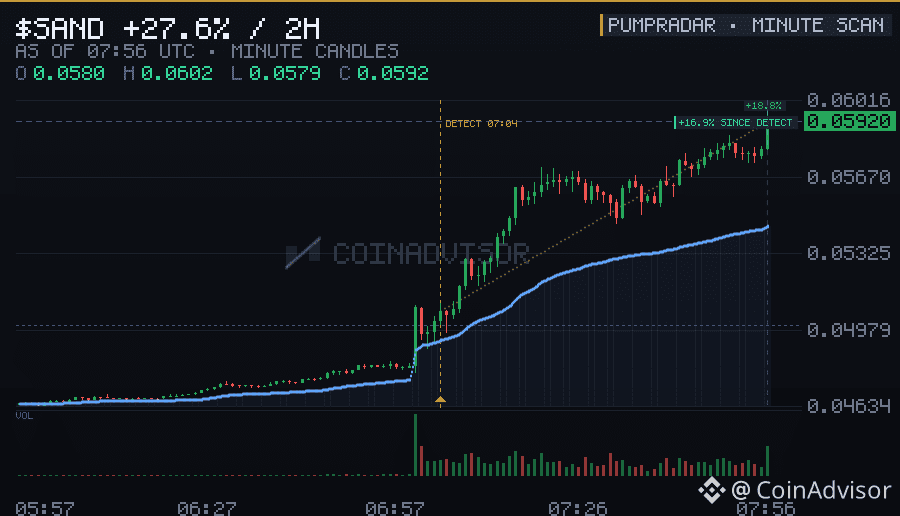
🔥 ¿Qué está impulsando esta hora:
SAND +22,8% (1h) → $75M volumen 24h
↳ interés abierto ×1,74 desde la detección — acumulación de apalancamiento
MANA +11,8% (1h) → $14M volumen 24h
CT +11,1% (1h) → $181M volumen 24h · listado hace 0d
↳ catalizador: un titular de cotización hace 3h
NIGHT +8,9% (1h) → $81M volumen 24h
龙虾 +5,5% (1h) → $837M volumen 24h
Movimientos por hora desde velas de 1 minuto de Binance. Medido a las 07:56 UTC.
Ordenado por calor, no por hype: toda la tabla de futuros, minuto a minuto.
$SAND $MANA $CT #Write2Earn
🔥 ¿Qué está impulsando esta hora:
SAND +22,8% (1h) → $75M volumen 24h
↳ interés abierto ×1,74 desde la detección — acumulación de apalancamiento
MANA +11,8% (1h) → $14M volumen 24h
CT +11,1% (1h) → $181M volumen 24h · listado hace 0d
↳ catalizador: un titular de cotización hace 3h
NIGHT +8,9% (1h) → $81M volumen 24h
龙虾 +5,5% (1h) → $837M volumen 24h
Movimientos por hora desde velas de 1 minuto de Binance. Medido a las 07:56 UTC.
Ordenado por calor, no por hype: toda la tabla de futuros, minuto a minuto.
$SAND $MANA $CT #Write2Earn
SAND +22,8% (1h) → $75M volumen 24h
↳ interés abierto ×1,74 desde la detección — acumulación de apalancamiento
MANA +11,8% (1h) → $14M volumen 24h
CT +11,1% (1h) → $181M volumen 24h · listado hace 0d
↳ catalizador: un titular de cotización hace 3h
NIGHT +8,9% (1h) → $81M volumen 24h
龙虾 +5,5% (1h) → $837M volumen 24h
Movimientos por hora desde velas de 1 minuto de Binance. Medido a las 07:56 UTC.
Ordenado por calor, no por hype: toda la tabla de futuros, minuto a minuto.
$SAND $MANA $CT #Write2Earn
261
·
--
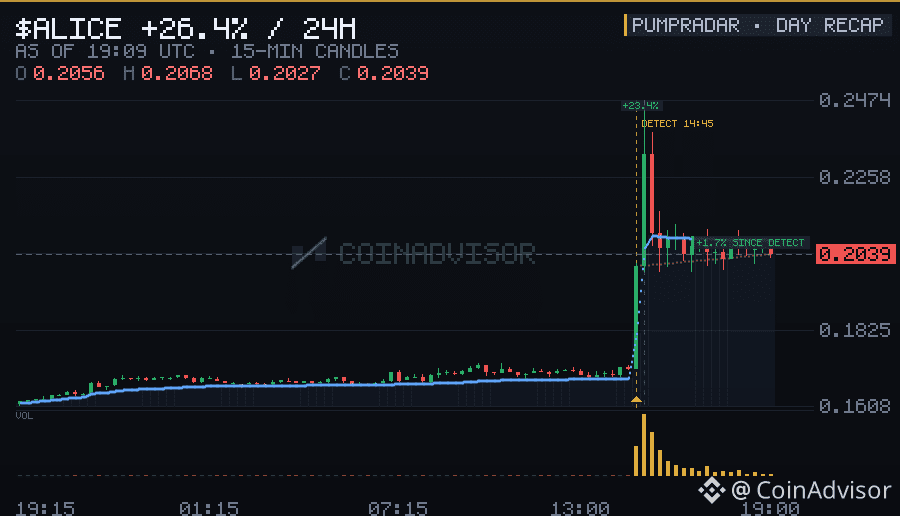
📊 El día en Binance Futures, en números: 14 monedas entraron en territorio de velocidad de subida (pump-velocity).
Las mayores subidas por hora:
ALICE +15.4% en una hora → $65M de volumen 24h
MAGMA +13.9% en una hora → $21M de volumen 24h
龙虾 +11.9% en una hora → $469M de volumen 24h
Ventana móvil de 24 horas. Medido a las 19:09 UTC.
Compilado por PumpRadar a partir de un día completo de cinta minuto a minuto.
$ALICE $MAGMA $龙虾 #Write2Earn
📊 El día en Binance Futures, en números: 14 monedas entraron en territorio de velocidad de subida (pump-velocity).
Las mayores subidas por hora:
ALICE +15.4% en una hora → $65M de volumen 24h
MAGMA +13.9% en una hora → $21M de volumen 24h
龙虾 +11.9% en una hora → $469M de volumen 24h
Ventana móvil de 24 horas. Medido a las 19:09 UTC.
Compilado por PumpRadar a partir de un día completo de cinta minuto a minuto.
$ALICE $MAGMA $龙虾 #Write2Earn
Las mayores subidas por hora:
ALICE +15.4% en una hora → $65M de volumen 24h
MAGMA +13.9% en una hora → $21M de volumen 24h
龙虾 +11.9% en una hora → $469M de volumen 24h
Ventana móvil de 24 horas. Medido a las 19:09 UTC.
Compilado por PumpRadar a partir de un día completo de cinta minuto a minuto.
$ALICE $MAGMA $龙虾 #Write2Earn
5
·
--
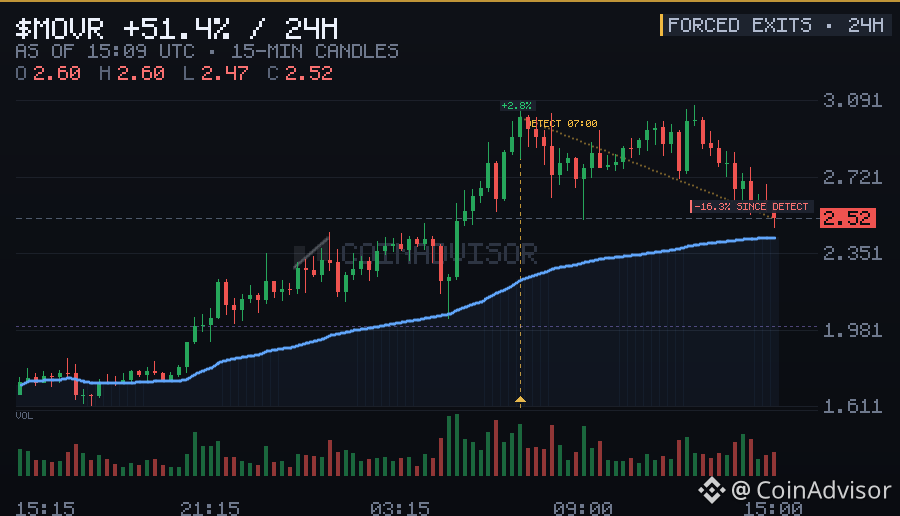
🩸 Marcador de salidas forzadas de hoy:
MOVR → $2.6M borrados (principalmente shorts)
龙虾 → $510K borrados (principalmente longs)
US → $218K borrados (principalmente longs)
STX → $208K borrados (principalmente longs)
Ventana móvil de 24 h. Medido a las 15:09 UTC.
Lectura de las liquidaciones: liquidaciones cortas (shorts) fuertes = combustible para el squeeze; liquidaciones largas (longs) fuertes = cuchillo cayendo. El feed de la bolsa limita a una orden/segundo por símbolo, así que los totales reales son más altos.
$MOVR $龙虾 $US #Write2Earn
🩸 Marcador de salidas forzadas de hoy:
MOVR → $2.6M borrados (principalmente shorts)
龙虾 → $510K borrados (principalmente longs)
US → $218K borrados (principalmente longs)
STX → $208K borrados (principalmente longs)
Ventana móvil de 24 h. Medido a las 15:09 UTC.
Lectura de las liquidaciones: liquidaciones cortas (shorts) fuertes = combustible para el squeeze; liquidaciones largas (longs) fuertes = cuchillo cayendo. El feed de la bolsa limita a una orden/segundo por símbolo, así que los totales reales son más altos.
$MOVR $龙虾 $US #Write2Earn
MOVR → $2.6M borrados (principalmente shorts)
龙虾 → $510K borrados (principalmente longs)
US → $218K borrados (principalmente longs)
STX → $208K borrados (principalmente longs)
Ventana móvil de 24 h. Medido a las 15:09 UTC.
Lectura de las liquidaciones: liquidaciones cortas (shorts) fuertes = combustible para el squeeze; liquidaciones largas (longs) fuertes = cuchillo cayendo. El feed de la bolsa limita a una orden/segundo por símbolo, así que los totales reales son más altos.
$MOVR $龙虾 $US #Write2Earn
146
·
--
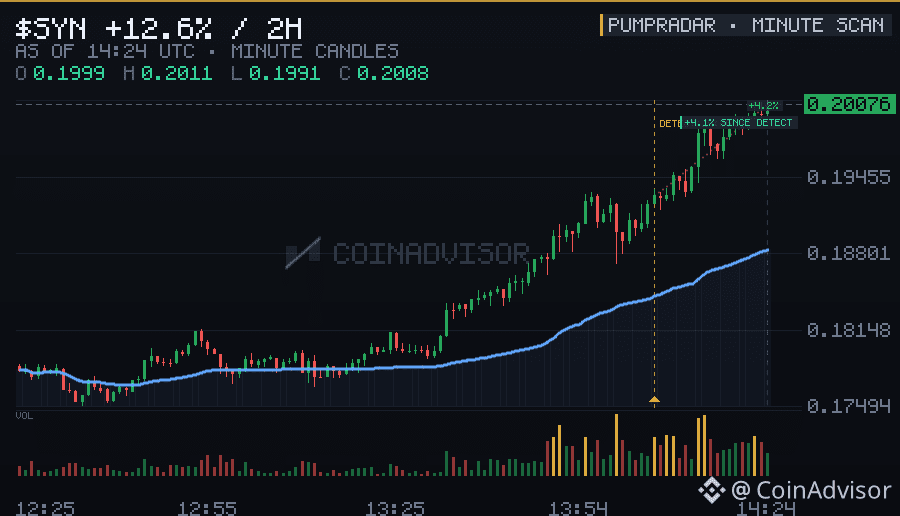
🔥 Revisión de calor, Binance Futures:
SYN +10.8% (1h) → $17M volumen 24h
↳ 14º pico de este mes
US +8.1% (1h) → $147M volumen 24h
↳ 10º pico de este mes
LYN +5.9% (1h) → $72M volumen 24h
↳ 7º pico de este mes
Movimientos por hora a partir de velas de 1 minuto de Binance. Medido a las 14:24 UTC.
Para cuando un impulsor se vuelve tendencia en redes sociales, el flujo ya le dijo a PumpRadar. Nivel por minuto, tablero completo.
$SYN $US $LYN #Write2Earn
🔥 Revisión de calor, Binance Futures:
SYN +10.8% (1h) → $17M volumen 24h
↳ 14º pico de este mes
US +8.1% (1h) → $147M volumen 24h
↳ 10º pico de este mes
LYN +5.9% (1h) → $72M volumen 24h
↳ 7º pico de este mes
Movimientos por hora a partir de velas de 1 minuto de Binance. Medido a las 14:24 UTC.
Para cuando un impulsor se vuelve tendencia en redes sociales, el flujo ya le dijo a PumpRadar. Nivel por minuto, tablero completo.
$SYN $US $LYN #Write2Earn
SYN +10.8% (1h) → $17M volumen 24h
↳ 14º pico de este mes
US +8.1% (1h) → $147M volumen 24h
↳ 10º pico de este mes
LYN +5.9% (1h) → $72M volumen 24h
↳ 7º pico de este mes
Movimientos por hora a partir de velas de 1 minuto de Binance. Medido a las 14:24 UTC.
Para cuando un impulsor se vuelve tendencia en redes sociales, el flujo ya le dijo a PumpRadar. Nivel por minuto, tablero completo.
$SYN $US $LYN #Write2Earn
96
·
--
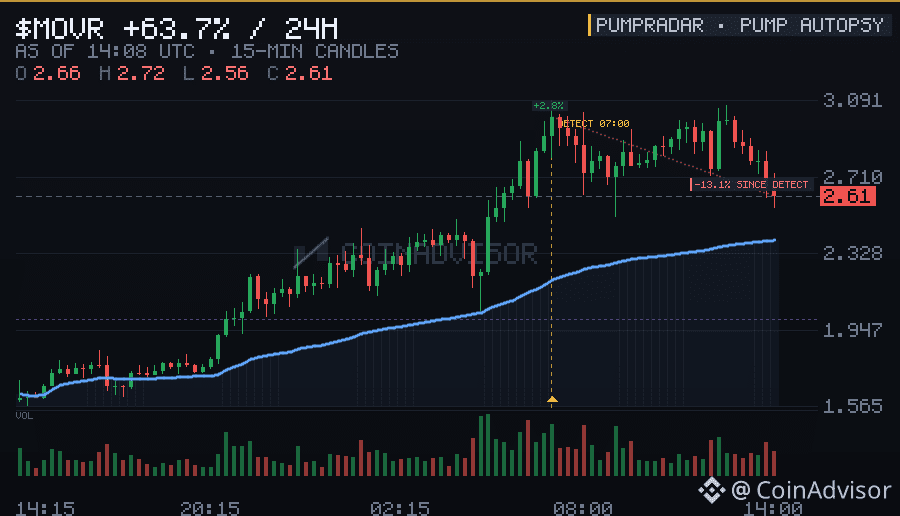
⚡ Anatomía de una bomba: MOVR
Detectada con +9.1%/1h sobre un volumen diario de $10M en el momento de la detección.
Pico: +74% (874 min después de la detección). Bajo después: -3%.
El interés abierto creció ×4.79 durante el movimiento: el apalancamiento se acumuló.
Liquidaciones en el camino: $1,245,350 en cortos vs $707,970 en largos.
Cada bomba cree que es especial. El minuto de datos dice lo contrario: el patrón se repitió.
$MOVR #Write2Earn
⚡ Anatomía de una bomba: MOVR
Detectada con +9.1%/1h sobre un volumen diario de $10M en el momento de la detección.
Pico: +74% (874 min después de la detección). Bajo después: -3%.
El interés abierto creció ×4.79 durante el movimiento: el apalancamiento se acumuló.
Liquidaciones en el camino: $1,245,350 en cortos vs $707,970 en largos.
Cada bomba cree que es especial. El minuto de datos dice lo contrario: el patrón se repitió.
$MOVR #Write2Earn
Detectada con +9.1%/1h sobre un volumen diario de $10M en el momento de la detección.
Pico: +74% (874 min después de la detección). Bajo después: -3%.
El interés abierto creció ×4.79 durante el movimiento: el apalancamiento se acumuló.
Liquidaciones en el camino: $1,245,350 en cortos vs $707,970 en largos.
Cada bomba cree que es especial. El minuto de datos dice lo contrario: el patrón se repitió.
$MOVR #Write2Earn
244
Inicia sesión para explorar más contenidos
Únete a usuarios globales de criptomonedas en Binance Square
⚡️ Obtén información útil y actualizada sobre criptos.
💬 Avalado por el mayor exchange de criptomonedas en el mundo.
👍 Descubre perspectivas reales de creadores verificados.
Email/número de teléfono