
LeeTFx
9 Publicaciones

LeeTFx
Denunciar
Bloquear usuario
7 Siguiendo
19 Seguidores
21 Me gusta
Publicaciones
·
--
Alcista
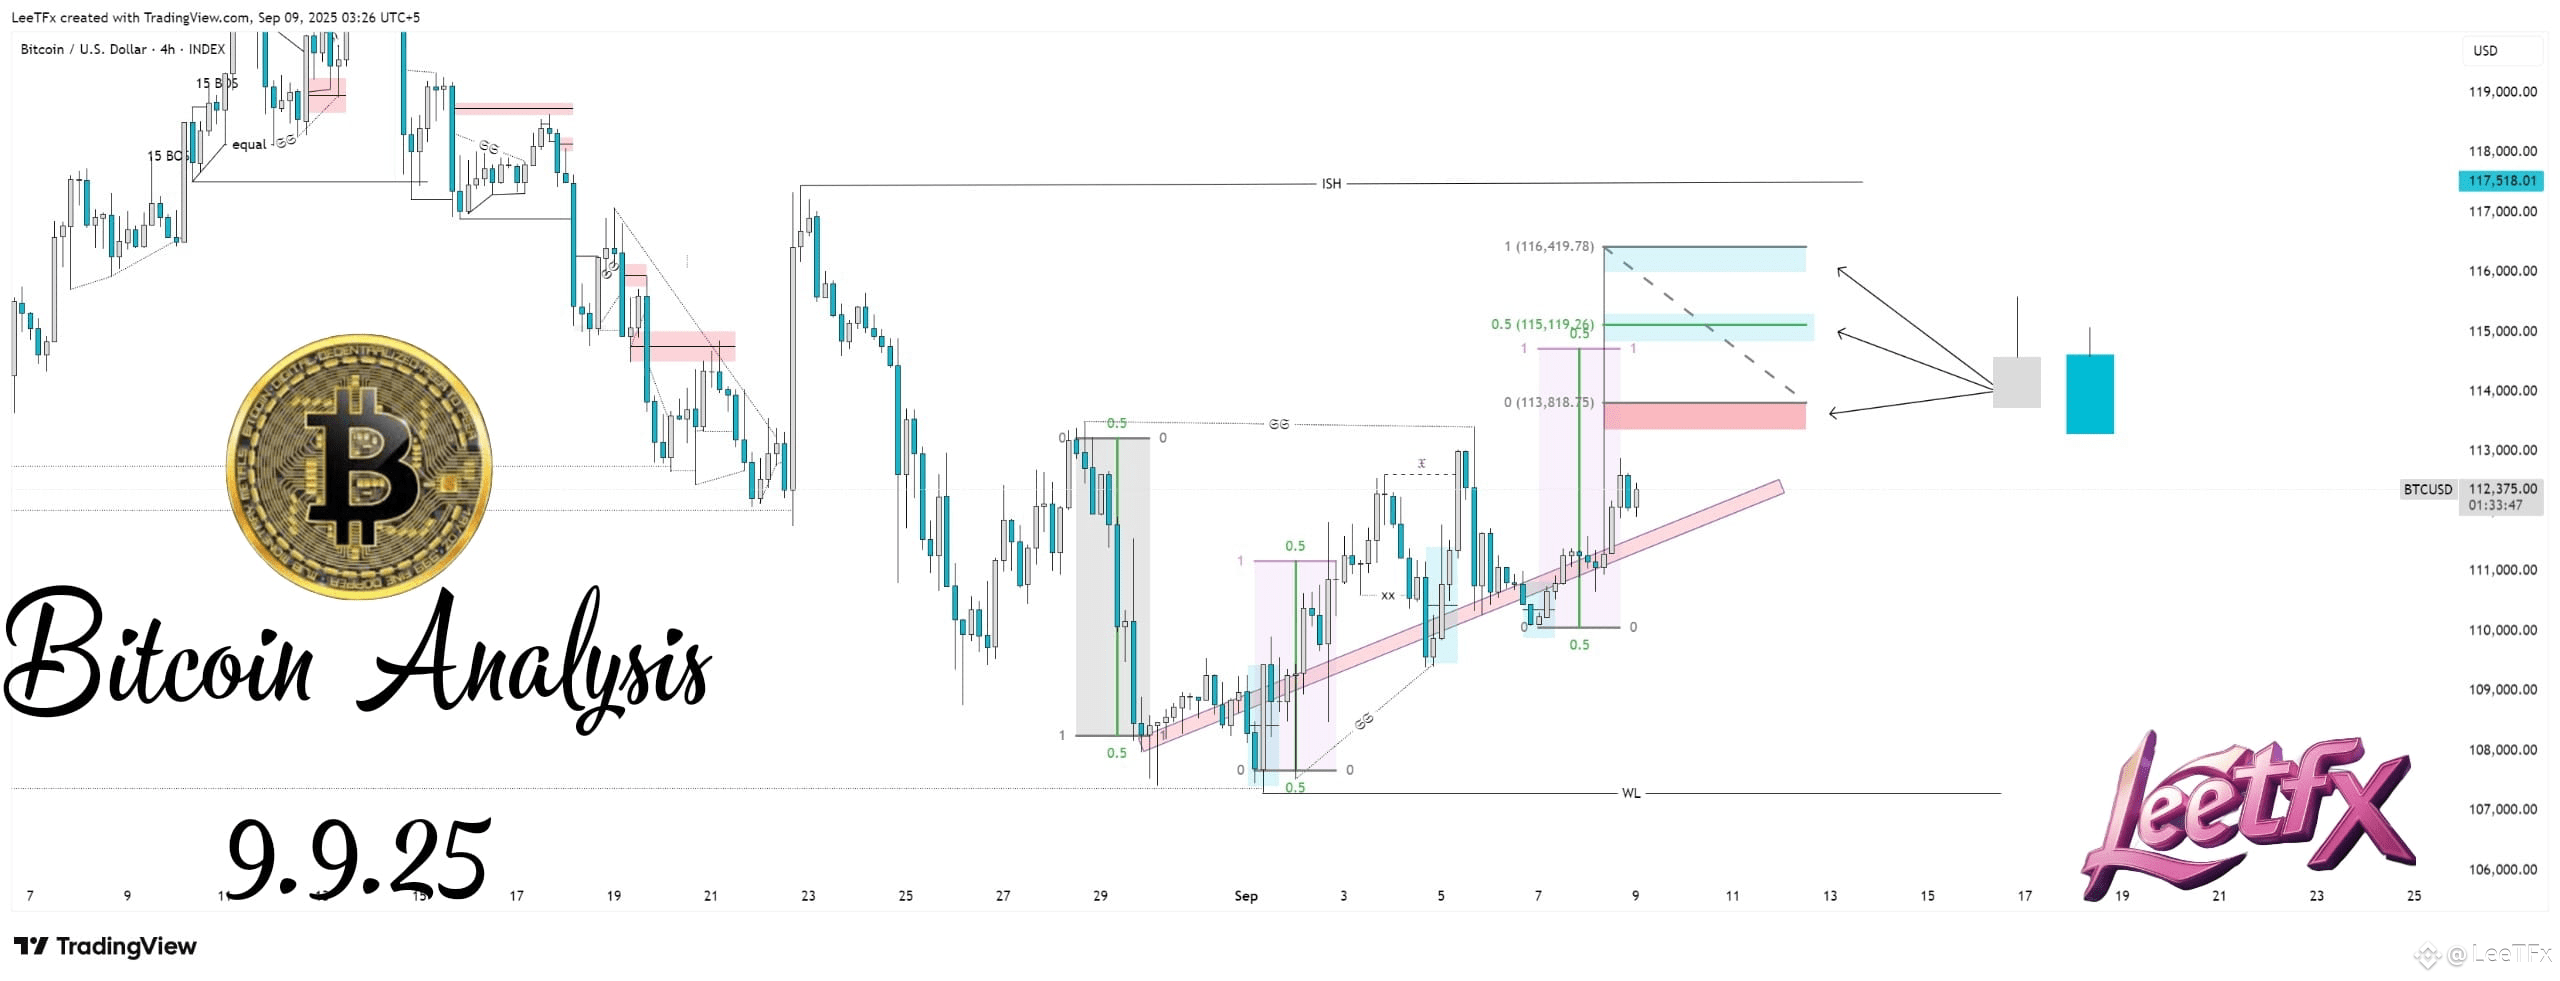
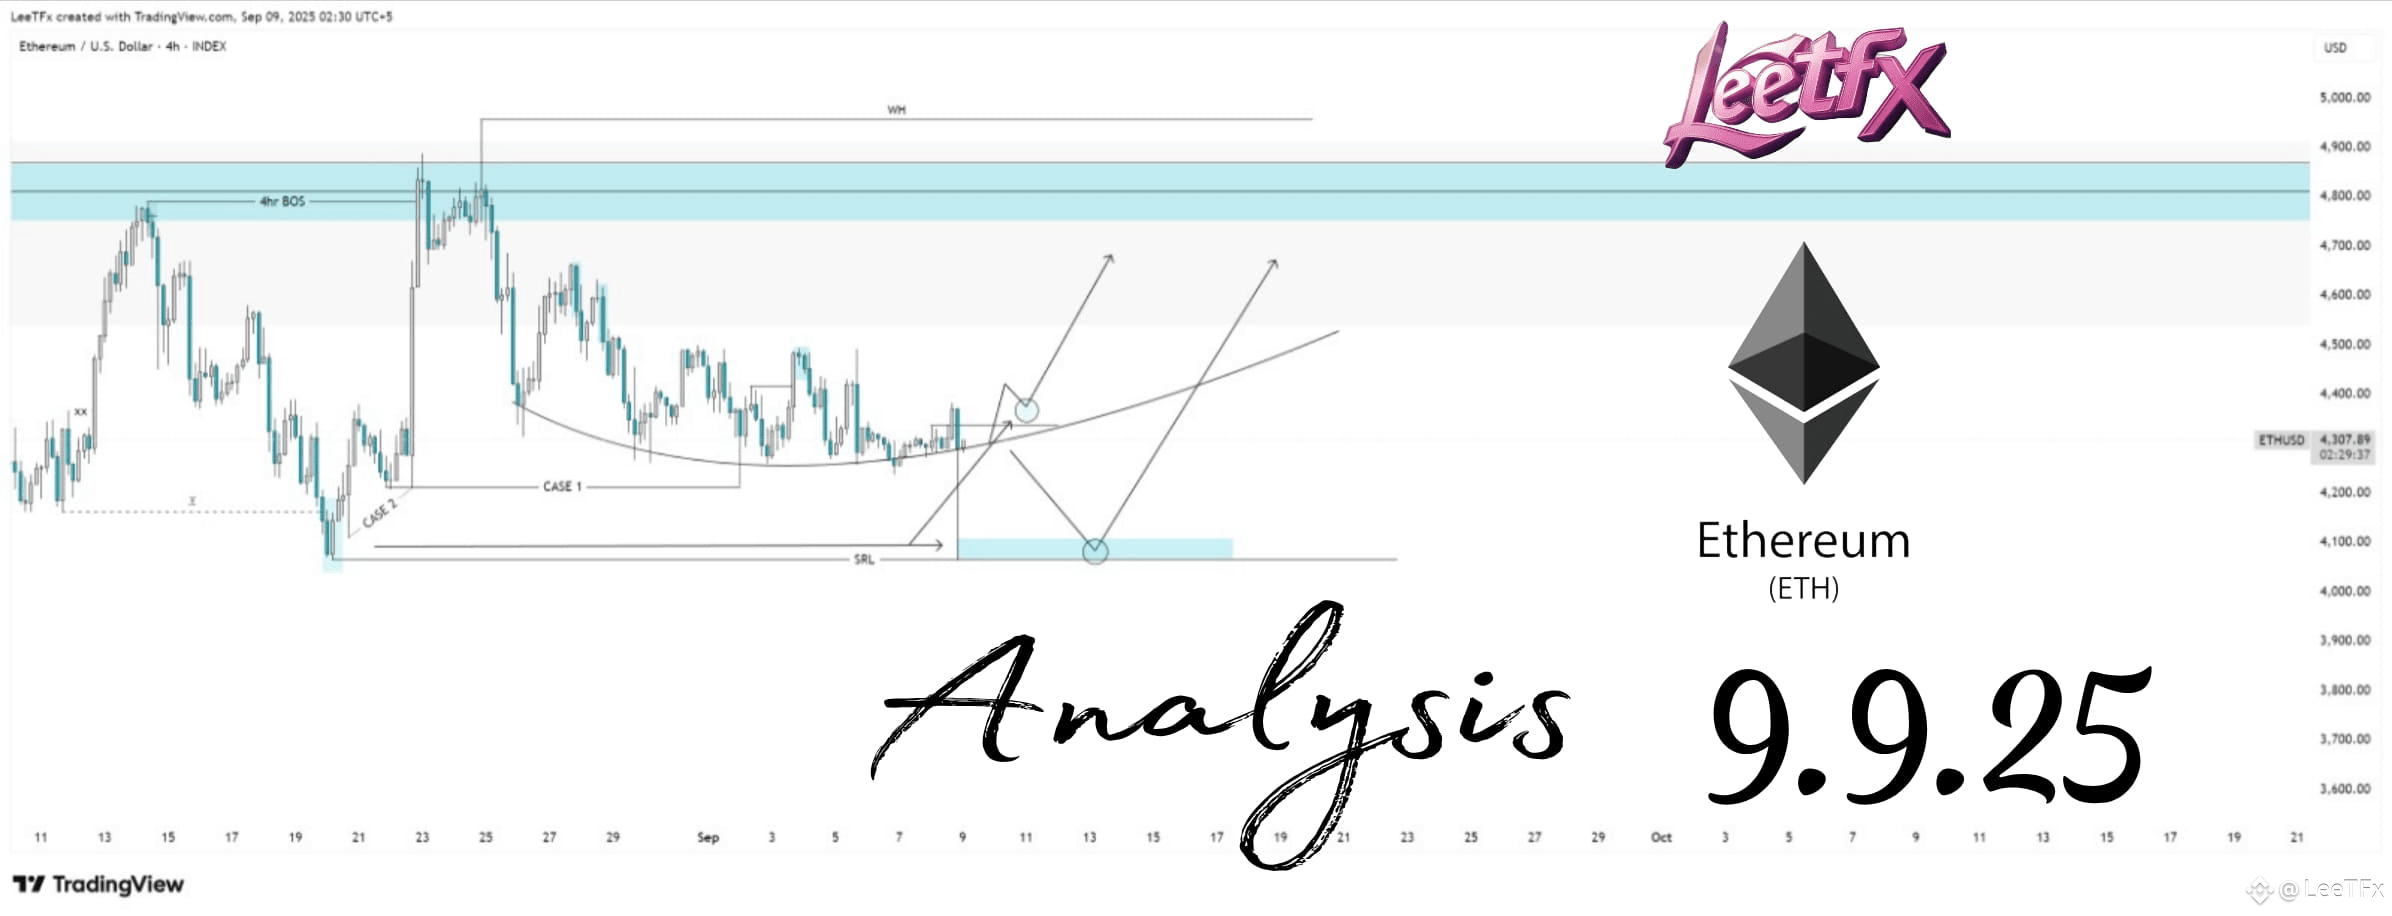
$BTC mis dos predicciones son precisas, somos analistas. Capturamos los movimientos futuros
$BTC mis dos predicciones son precisas, somos analistas. Capturamos los movimientos futuros
1
411
·
--
Alcista
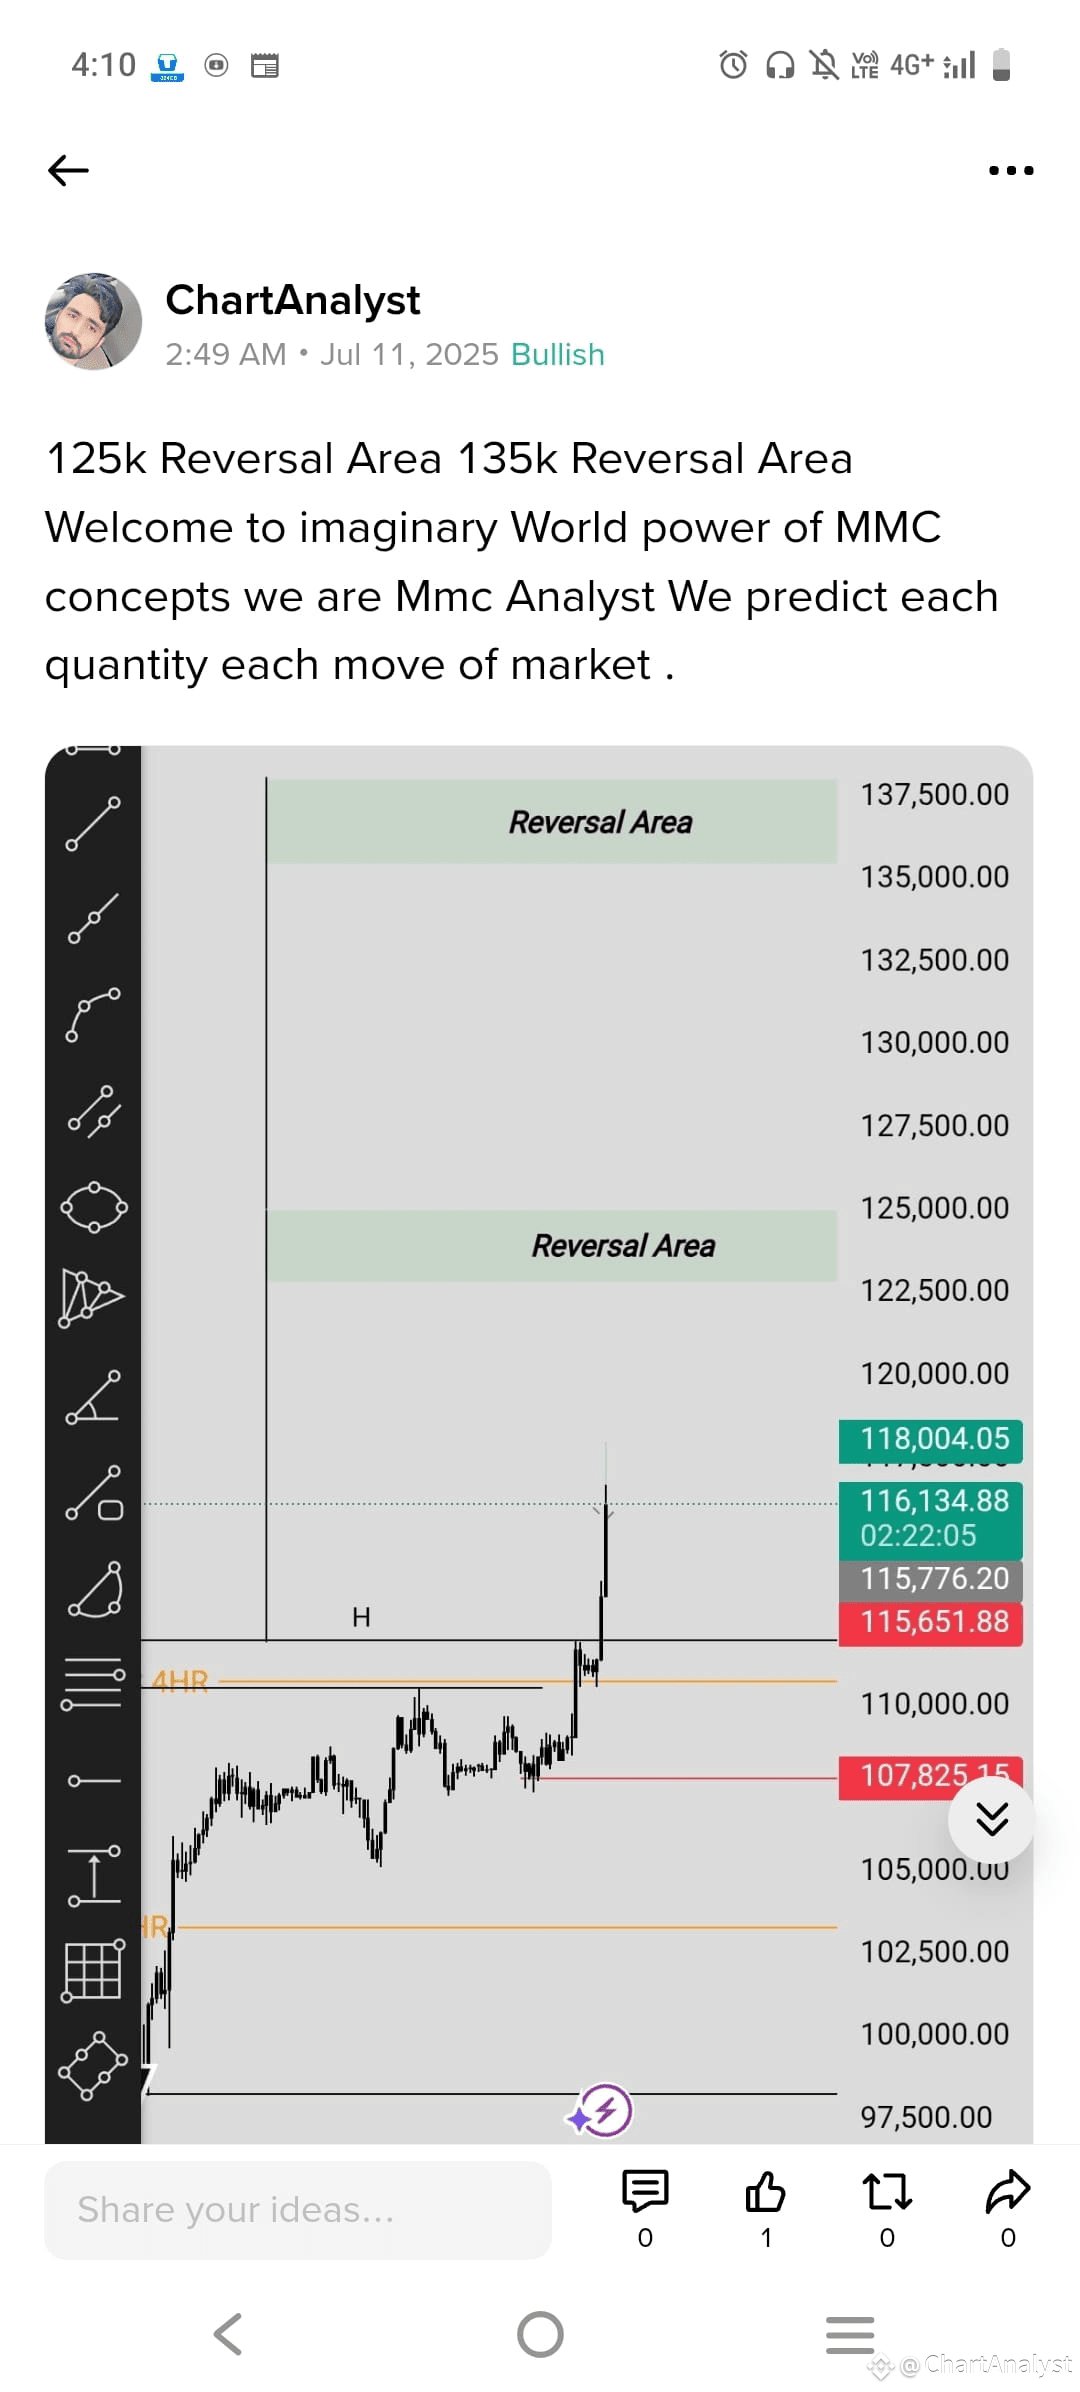
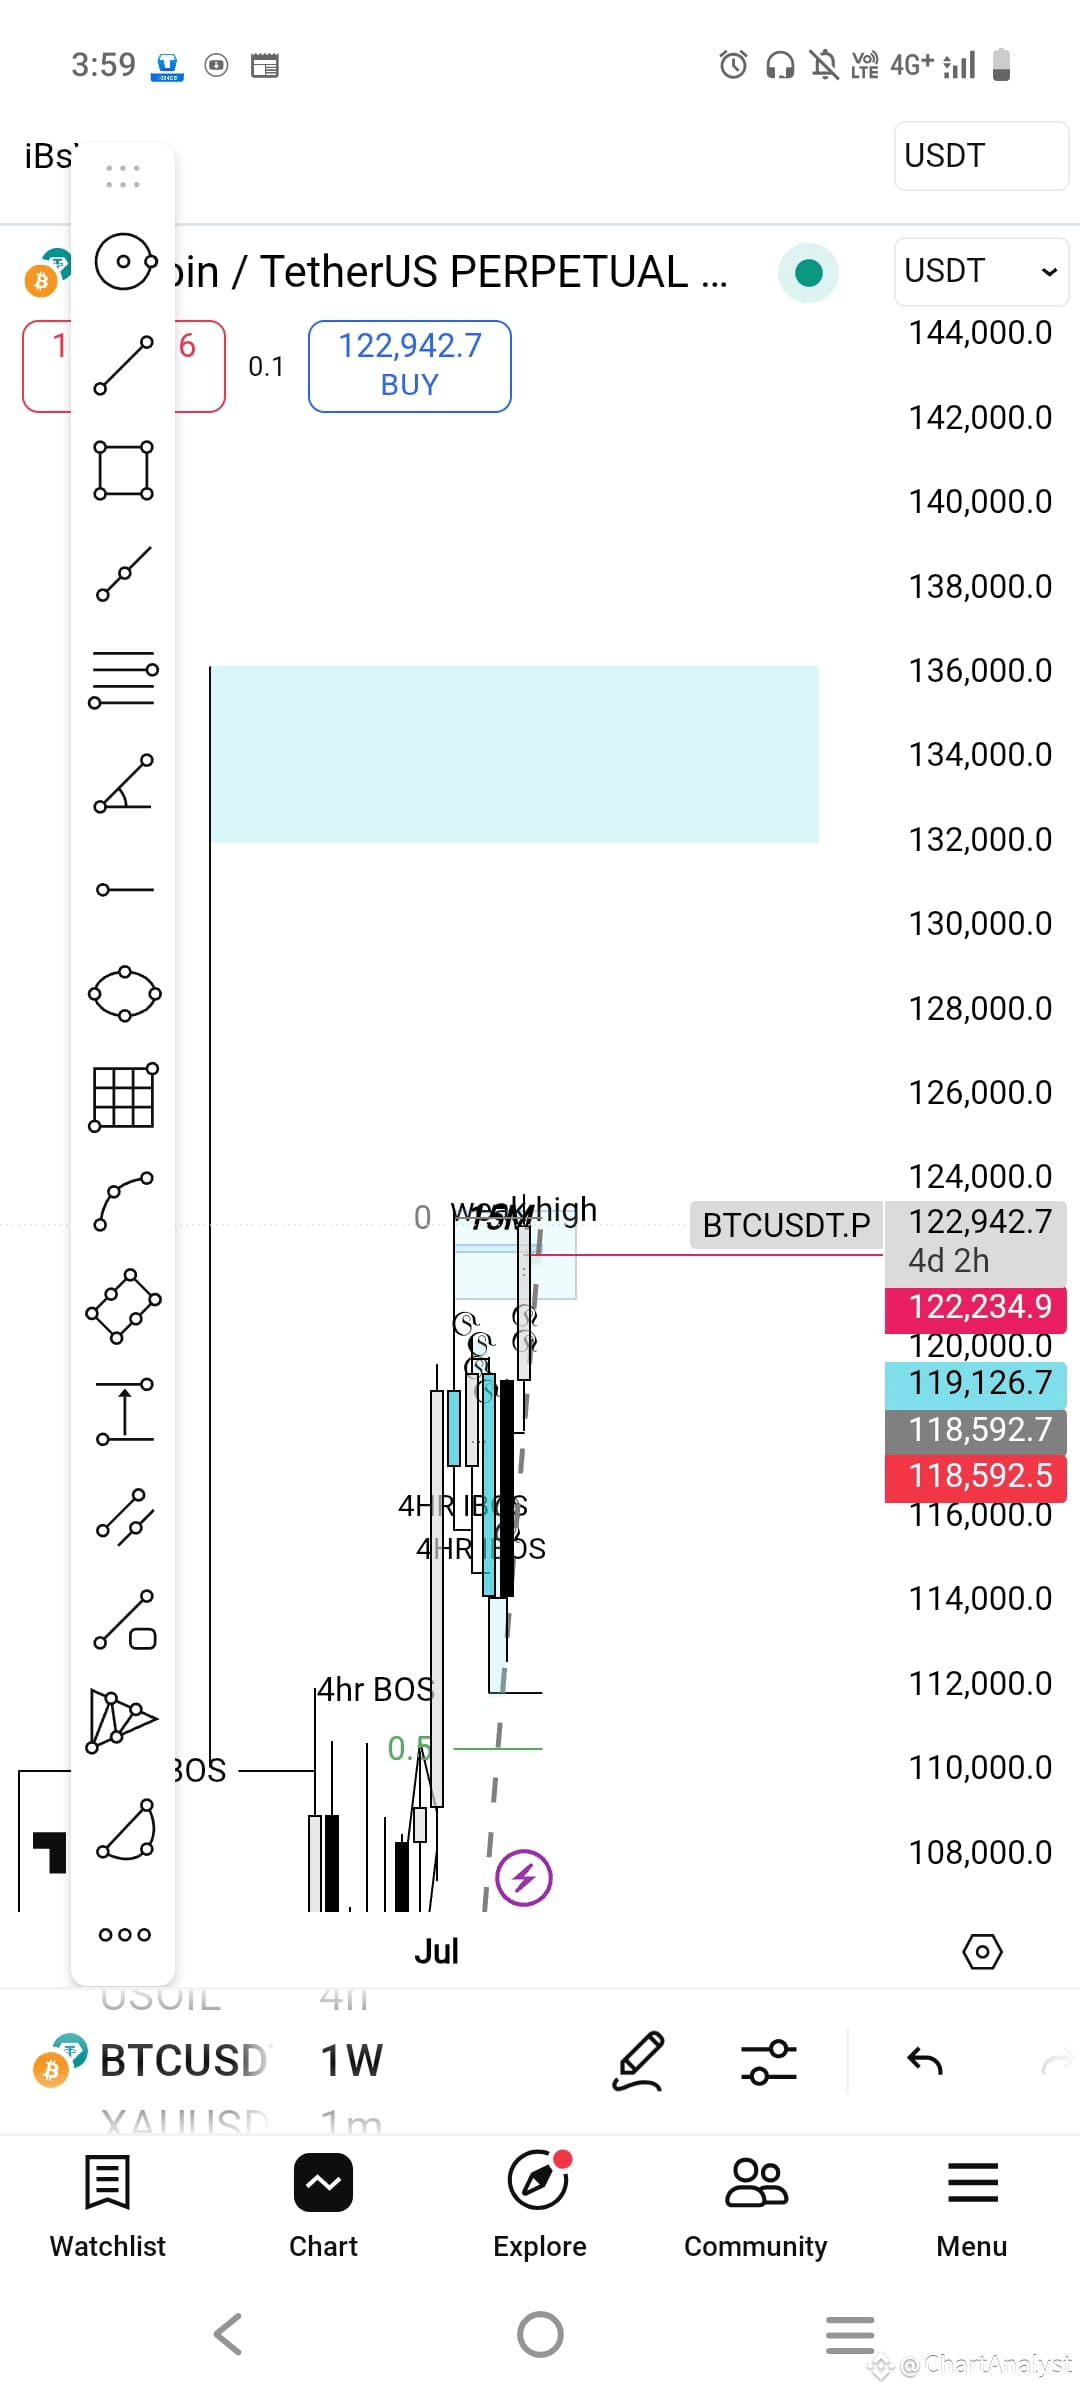
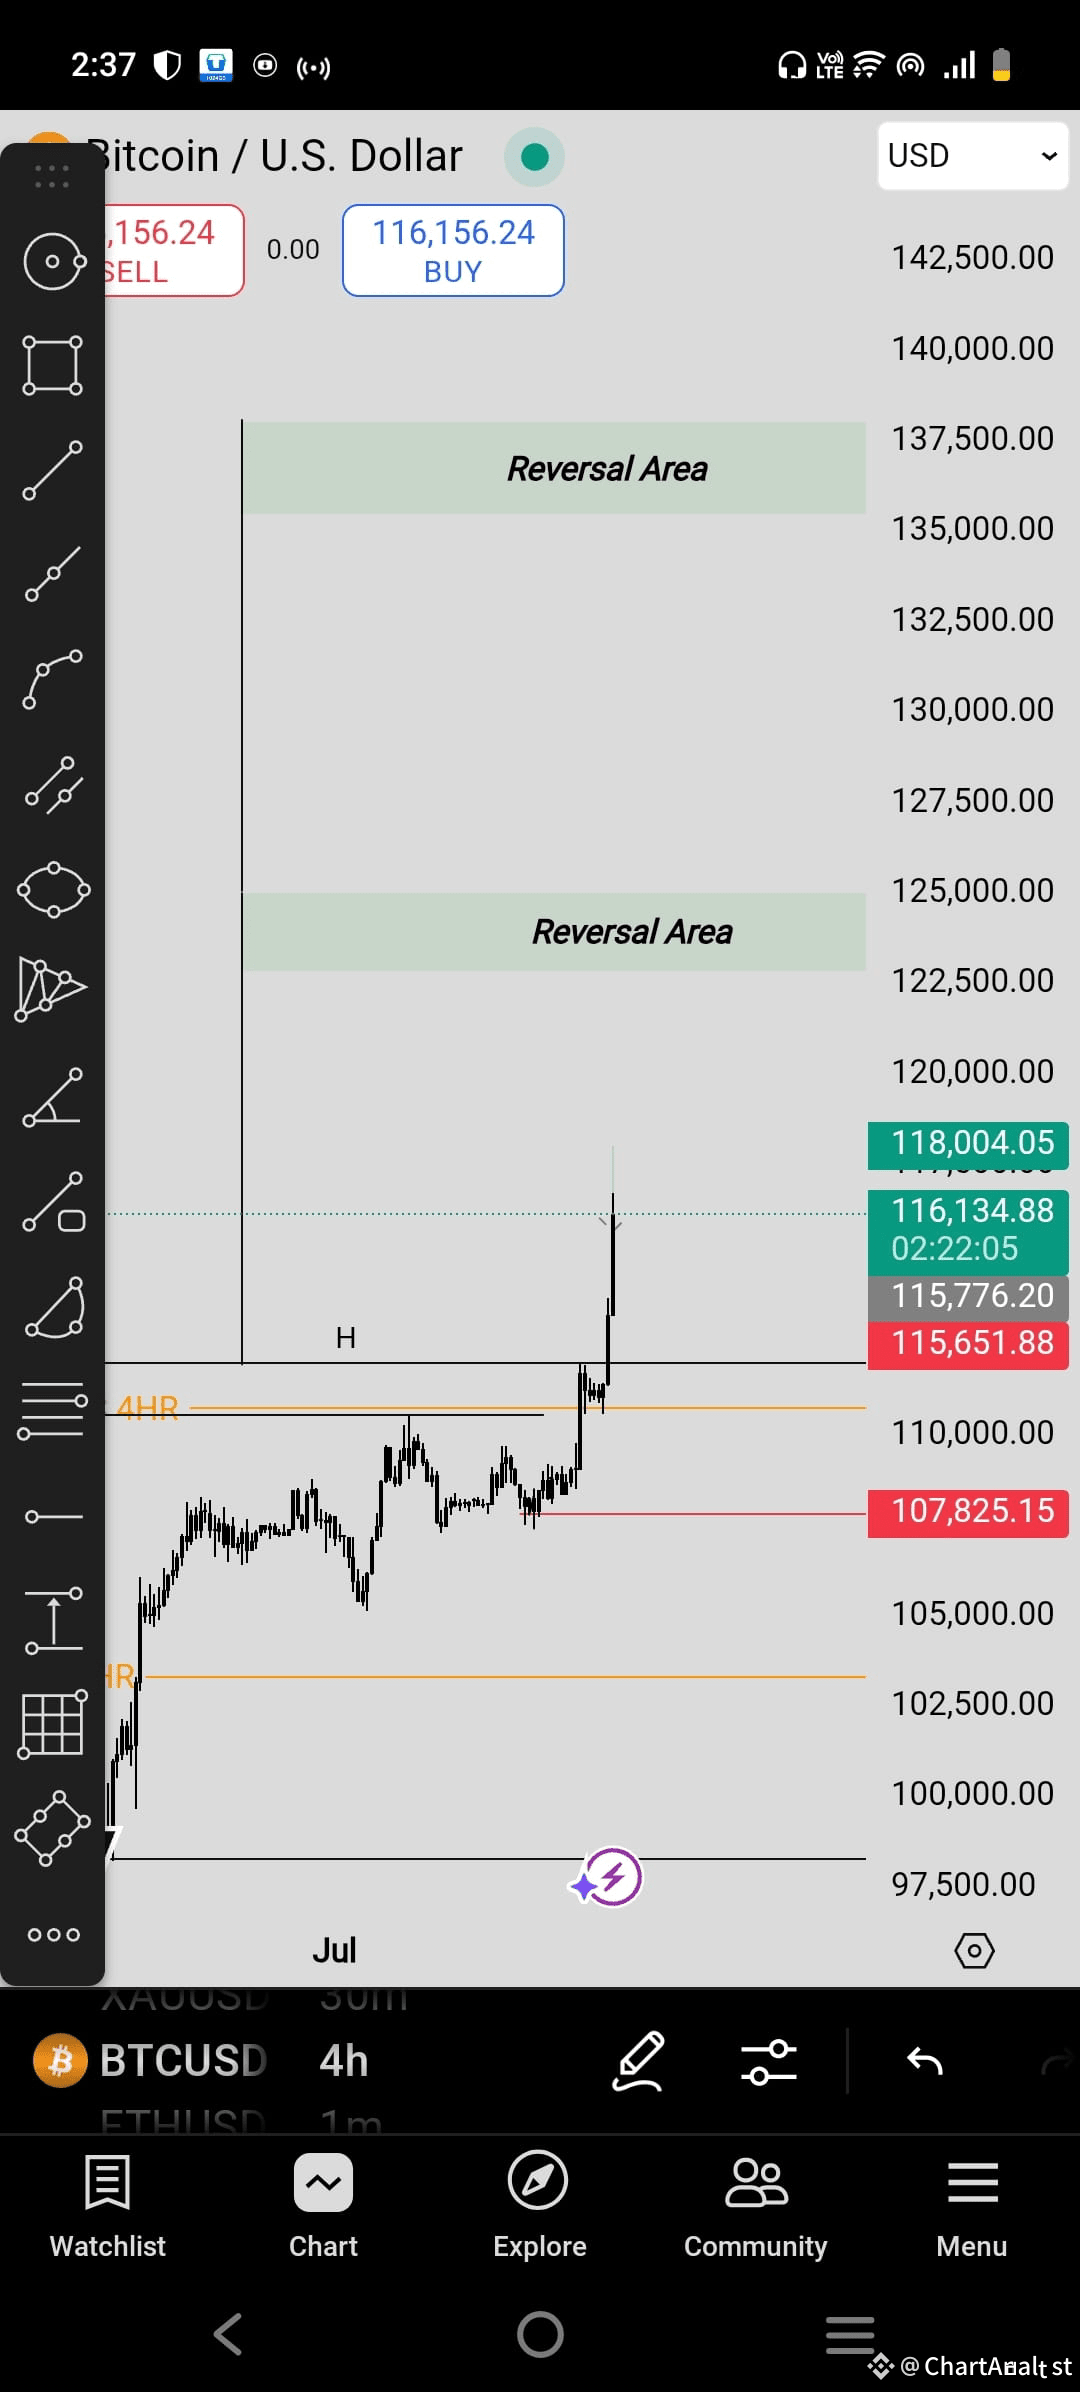
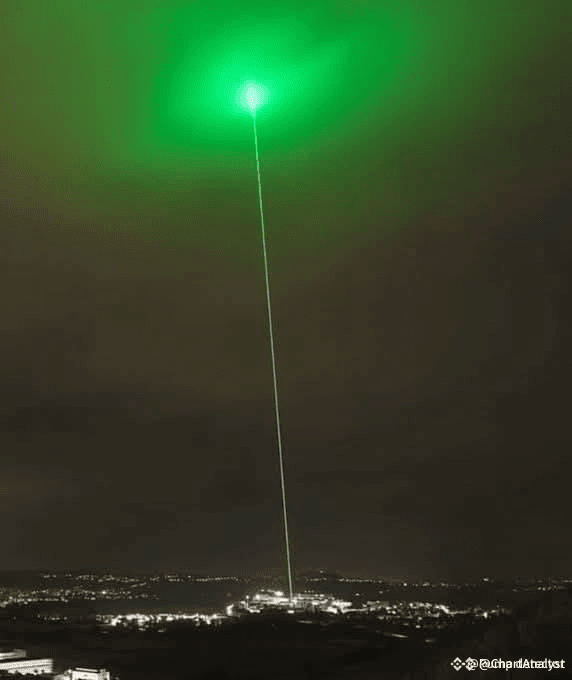
Área de Reversión de 125k Área de Reversión de 135k Bienvenido al Mundo Imaginario poder de los conceptos de MMC somos Analistas de Mmc Predicimos cada cantidad cada movimiento del mercado.
Área de Reversión de 125k Área de Reversión de 135k Bienvenido al Mundo Imaginario poder de los conceptos de MMC somos Analistas de Mmc Predicimos cada cantidad cada movimiento del mercado.
1
96
·
--
Hazte un indicador en lugar de usar indicadores, dedica tu tiempo a los gráficos, resuelve los misterios detrás de ellos, observa la magia para volverte rentable #SaylorBTCPurchase #TRXETF #BNBChainMeme #PowellRemarks
Hazte un indicador en lugar de usar indicadores, dedica tu tiempo a los gráficos, resuelve los misterios detrás de ellos, observa la magia para volverte rentable #SaylorBTCPurchase #TRXETF #BNBChainMeme #PowellRemarks
7
·
--
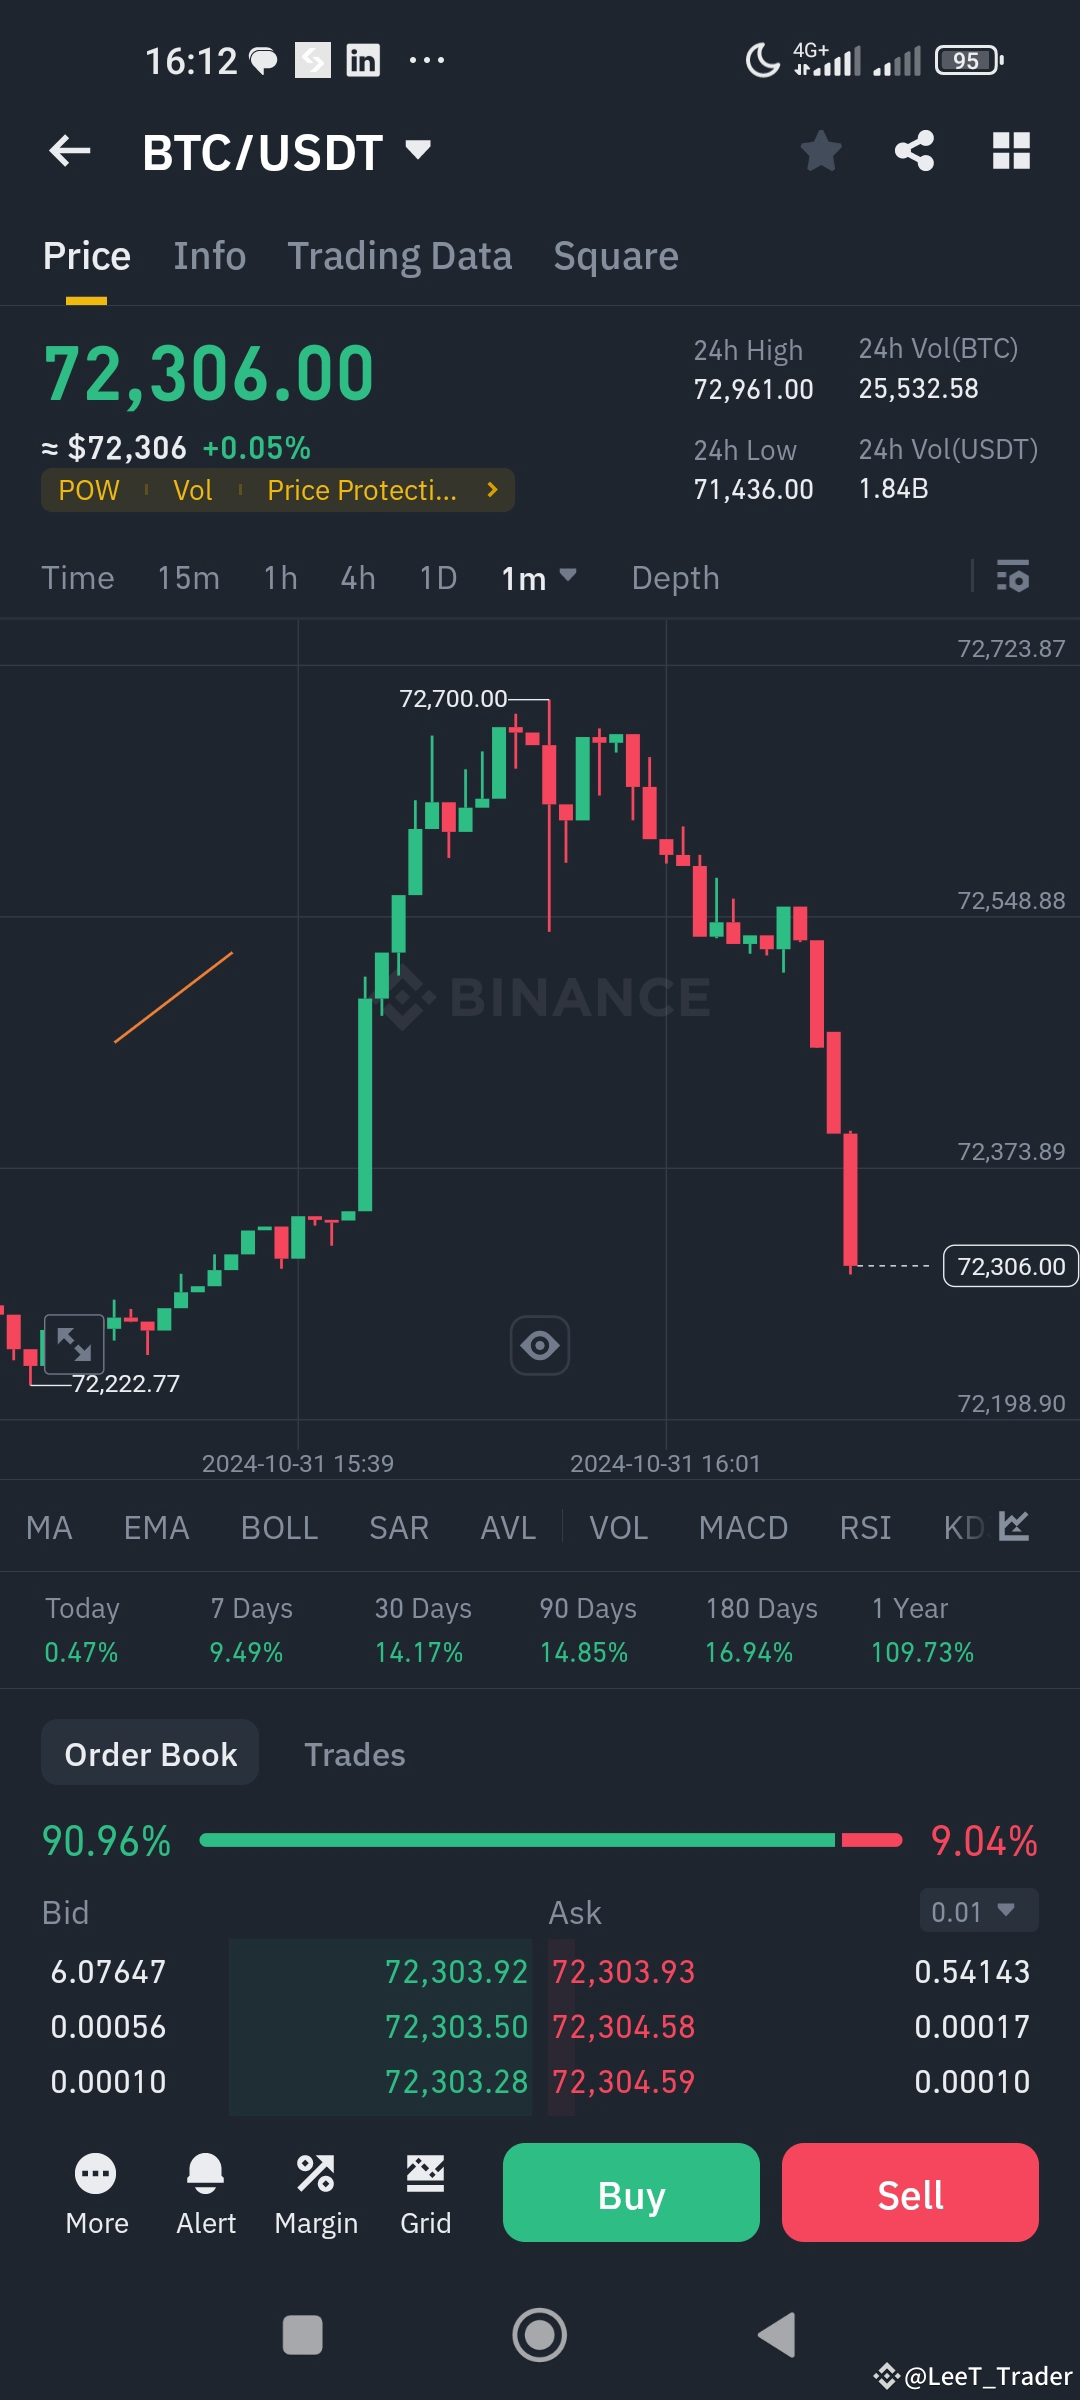
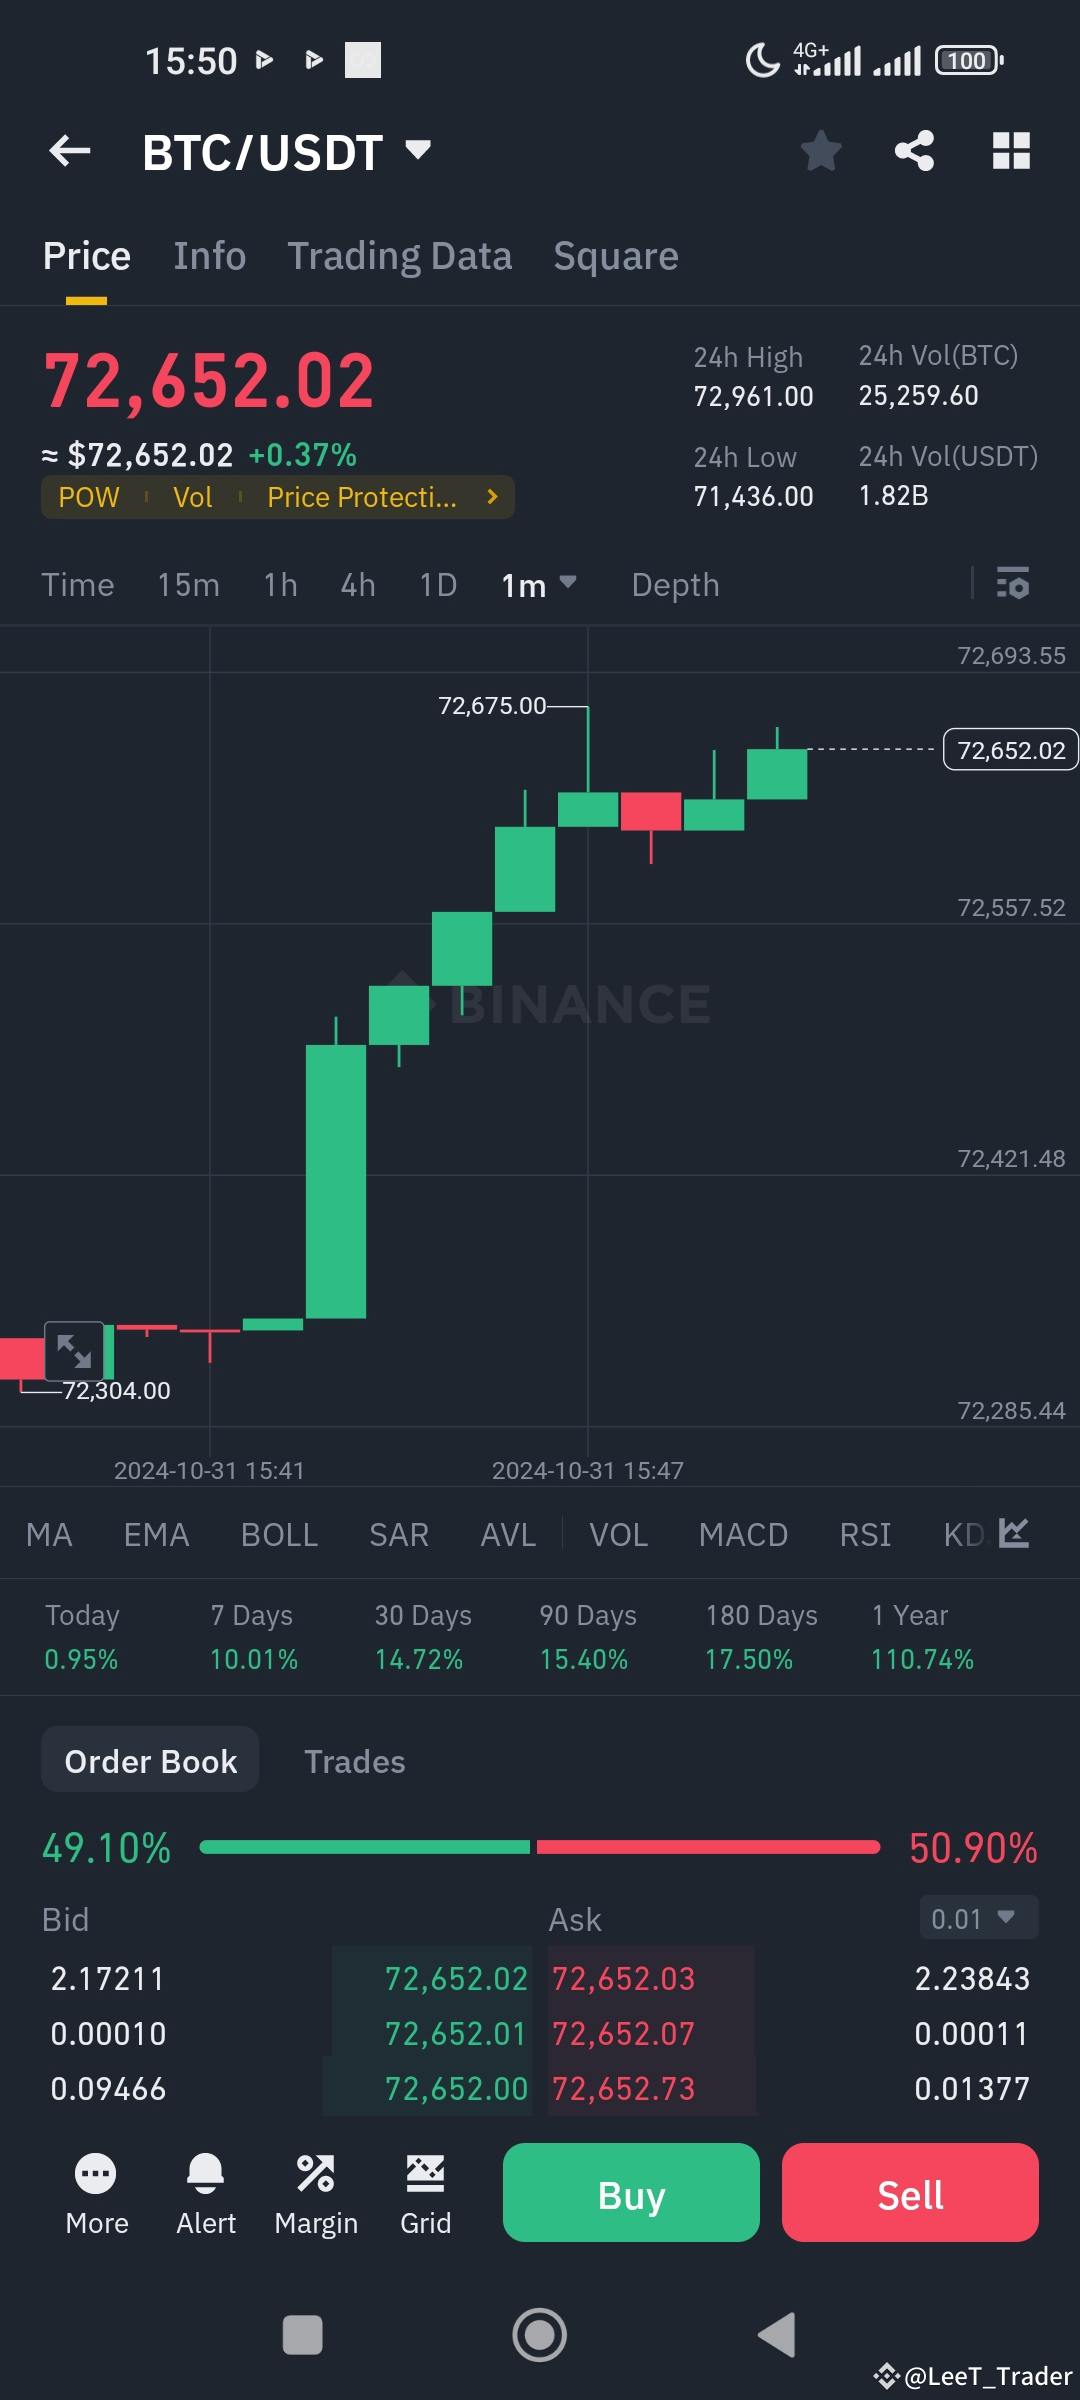
Como di señal de venta BTC/USD Éxito Objetivo 🎯 Alcanzado. sigue para más señales de análisis real ☕
Como di señal de venta BTC/USD Éxito Objetivo 🎯 Alcanzado. sigue para más señales de análisis real ☕
629
·
--
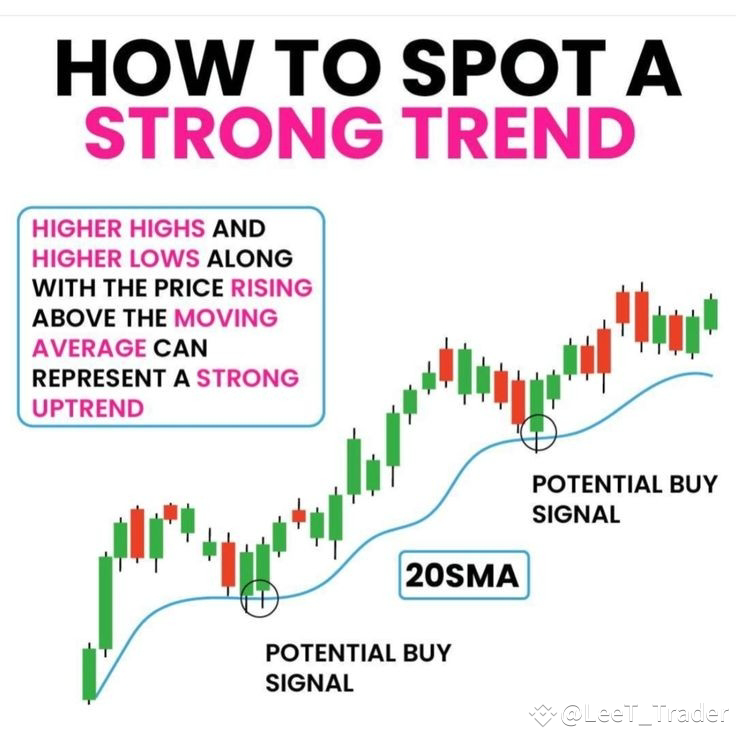
Cómo detectar una tendencia fuerte con la media móvil simple de 20 días
Explicado .
La media móvil simple de 20 días es una línea en un gráfico que representa el precio de cierre promedio de un activo durante los últimos 20 días de negociación. Suaviza las fluctuaciones de precios, lo que facilita la identificación de tendencias.
Identificación de tendencias alcistas
Precio por encima de la media móvil simple de 20 días: cuando el precio de un activo se encuentra constantemente por encima de la media móvil simple de 20 días, indica una tendencia alcista.
Pendiente pronunciada de la media móvil simple de 20 días: una media móvil simple de 20 días con una pendiente pronunciada sugiere una tendencia alcista fuerte y acelerada.
Retrocesos de precios hasta la media móvil simple de 20 días: durante las tendencias alcistas, el precio puede retroceder hasta la media móvil simple de 20 días y luego rebotar hacia arriba, lo que confirma la fuerza de la tendencia.
Identificación de tendencias bajistas
Precio por debajo de la media móvil simple de 20 días: cuando el precio de un activo se encuentra constantemente por debajo de la media móvil simple de 20 días, indica una tendencia bajista.
SMA de 20 días con pendiente descendente pronunciada: una SMA de 20 días con pendiente descendente pronunciada sugiere una tendencia bajista fuerte y acelerada.
El precio sube hasta la SMA de 20 días: durante las tendencias bajistas, el precio puede subir hasta la SMA de 20 días y luego volver a caer, lo que confirma la fortaleza de la tendencia.
Cómo detectar una tendencia fuerte con la media móvil simple de 20 días
Explicado .
La media móvil simple de 20 días es una línea en un gráfico que representa el precio de cierre promedio de un activo durante los últimos 20 días de negociación. Suaviza las fluctuaciones de precios, lo que facilita la identificación de tendencias.
Identificación de tendencias alcistas
Precio por encima de la media móvil simple de 20 días: cuando el precio de un activo se encuentra constantemente por encima de la media móvil simple de 20 días, indica una tendencia alcista.
Pendiente pronunciada de la media móvil simple de 20 días: una media móvil simple de 20 días con una pendiente pronunciada sugiere una tendencia alcista fuerte y acelerada.
Retrocesos de precios hasta la media móvil simple de 20 días: durante las tendencias alcistas, el precio puede retroceder hasta la media móvil simple de 20 días y luego rebotar hacia arriba, lo que confirma la fuerza de la tendencia.
Identificación de tendencias bajistas
Precio por debajo de la media móvil simple de 20 días: cuando el precio de un activo se encuentra constantemente por debajo de la media móvil simple de 20 días, indica una tendencia bajista.
SMA de 20 días con pendiente descendente pronunciada: una SMA de 20 días con pendiente descendente pronunciada sugiere una tendencia bajista fuerte y acelerada.
El precio sube hasta la SMA de 20 días: durante las tendencias bajistas, el precio puede subir hasta la SMA de 20 días y luego volver a caer, lo que confirma la fortaleza de la tendencia.
Explicado .
La media móvil simple de 20 días es una línea en un gráfico que representa el precio de cierre promedio de un activo durante los últimos 20 días de negociación. Suaviza las fluctuaciones de precios, lo que facilita la identificación de tendencias.
Identificación de tendencias alcistas
Precio por encima de la media móvil simple de 20 días: cuando el precio de un activo se encuentra constantemente por encima de la media móvil simple de 20 días, indica una tendencia alcista.
Pendiente pronunciada de la media móvil simple de 20 días: una media móvil simple de 20 días con una pendiente pronunciada sugiere una tendencia alcista fuerte y acelerada.
Retrocesos de precios hasta la media móvil simple de 20 días: durante las tendencias alcistas, el precio puede retroceder hasta la media móvil simple de 20 días y luego rebotar hacia arriba, lo que confirma la fuerza de la tendencia.
Identificación de tendencias bajistas
Precio por debajo de la media móvil simple de 20 días: cuando el precio de un activo se encuentra constantemente por debajo de la media móvil simple de 20 días, indica una tendencia bajista.
SMA de 20 días con pendiente descendente pronunciada: una SMA de 20 días con pendiente descendente pronunciada sugiere una tendencia bajista fuerte y acelerada.
El precio sube hasta la SMA de 20 días: durante las tendencias bajistas, el precio puede subir hasta la SMA de 20 días y luego volver a caer, lo que confirma la fortaleza de la tendencia.
7
1.8k
Inicia sesión para explorar más contenidos
Únete a usuarios globales de criptomonedas en Binance Square
⚡️ Obtén información útil y actualizada sobre criptos.
💬 Avalado por el mayor exchange de criptomonedas en el mundo.
👍 Descubre perspectivas reales de creadores verificados.
Email/número de teléfono
Temas populares
AppleDebutsFoldablePhone
24,900 vistas
530 están debatiendo
Apple acaba de lanzar el iPhone plegable — y el mercado está prestando atención. Esto no es solo otro ciclo de productos; es una nueva categoría de producto, un nuevo CEO en el escenario y una etiqueta de precio de 1,999 dólares que empuja $AAPL aún más hacia el territorio ultra premium. Los plegables son la historia, y Apple ahora es el titular.
#appledebutsfoldablephone #EUExtendsCentralContactPointToCASPs #US10YTreasuryYieldHitsHighestSinceNov2023 #BrentCrudeTops$100 #USTreasuryToBuyBackUpTo$6BLongDatedDebt
KimHotbae
·2 me gusta
·2.7k vistas
TSMCAugustRevenueUp53.3%YoY
135 vistas
42 están debatiendo
IranSaysReadyToEscalateWarWithUS
2,580 vistas
104 están debatiendo