
Bykaranteli
15k Publicaciones

Bykaranteli
Denunciar
Bloquear usuario
All Social Media @Bykaranteli
Trader frecuente
5.7 año(s)
6 Siguiendo
10.2K+ Seguidores
31.6K+ Me gusta
Publicaciones
Todo
Citas
Videos
Live
PINNED
·
--
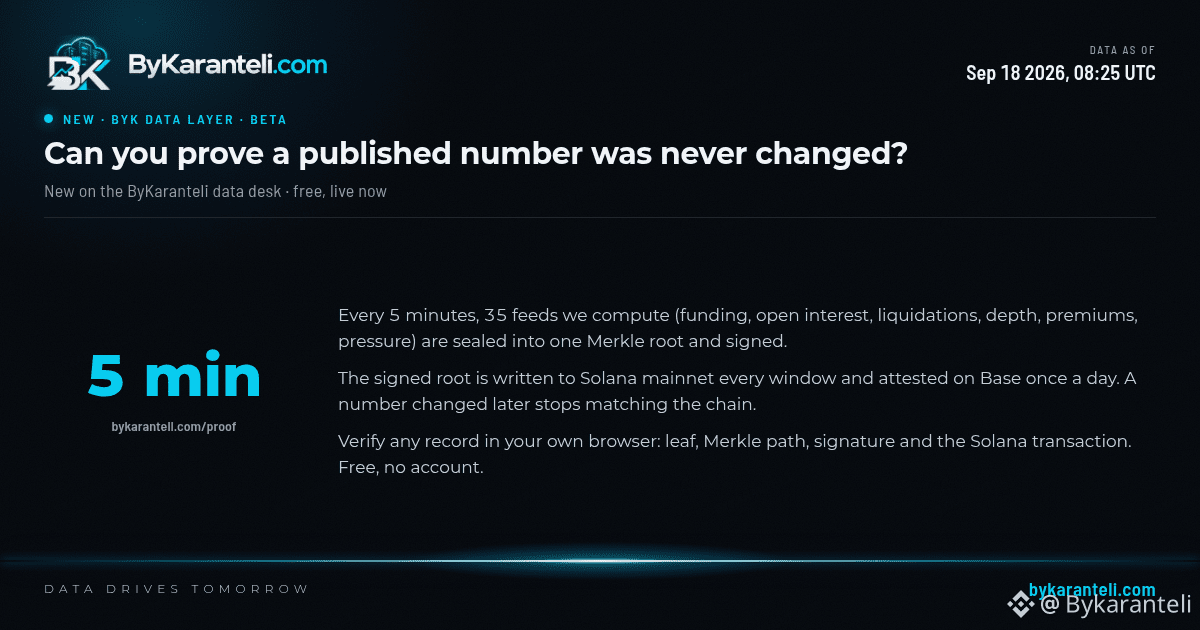
Nuestros datos ahora dejan un recibo en blockchains públicas. Cada 5 minutos, 35 feeds que calculamos (financiamiento, interés abierto, liquidaciones, profundidad del libro de órdenes, primas y puntuaciones de presión para $BTC, $ETH, $SOL y más) se sellan en una sola raíz de Merkle, se firman con una clave aislada y se escriben en Solana mainnet, con una atestación diaria en Base. Si alguien, incluyendo nosotros, cambiara uno de esos números después, dejaría de coincidir con la cadena. No tienes que confiar en nuestra palabra: el verificador en la página de nuestra prueba reconstruye un registro, comprueba su firma y lee el anclaje directamente desde Solana en tu propio navegador. Beta, en mainnet desde el 18 de septiembre. Gratis, no se necesita cuenta.
Nuestros datos ahora dejan un recibo en blockchains públicas. Cada 5 minutos, 35 feeds que calculamos (financiamiento, interés abierto, liquidaciones, profundidad del libro de órdenes, primas y puntuaciones de presión para $BTC , $ETH , $SOL y más) se sellan en una sola raíz de Merkle, se firman con una clave aislada y se escriben en Solana mainnet, con una atestación diaria en Base. Si alguien, incluyendo nosotros, cambiara uno de esos números después, dejaría de coincidir con la cadena. No tienes que confiar en nuestra palabra: el verificador en la página de nuestra prueba reconstruye un registro, comprueba su firma y lee el anclaje directamente desde Solana en tu propio navegador. Beta, en mainnet desde el 18 de septiembre. Gratis, no se necesita cuenta.
1
3
63
·
--
Ver traducción
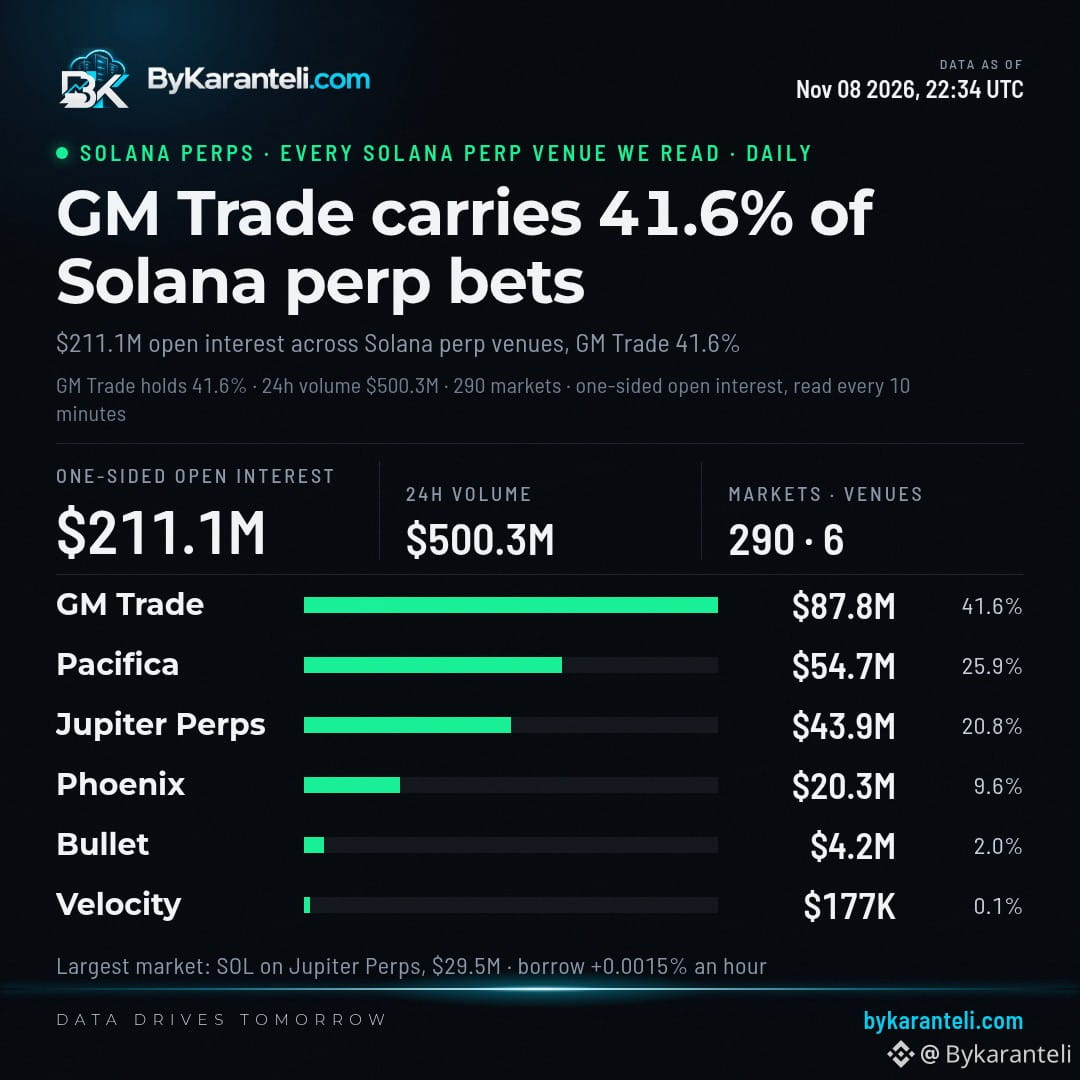
GM Trade carries the biggest slice of leveraged bets on Solana's perpetual venues on Nov 8, with $87.8M held open, or 41.6% of the $211.1M across six venues and 290 markets.
Pacifica follows at $54.7M (25.9%), then Jupiter Perps at $43.9M (20.8%) and Phoenix at $20.3M (9.6%). Bullet ($4.2M) and Velocity ($177K) trail far behind.
The largest single book is $SOL on Jupiter Perps at $29.5M, where traders pay an hourly borrow fee of +0.0015% to keep their leverage open. Trading across all six venues came to $500.3M over 24 hours.
GM Trade carries the biggest slice of leveraged bets on Solana's perpetual venues on Nov 8, with $87.8M held open, or 41.6% of the $211.1M across six venues and 290 markets.
Pacifica follows at $54.7M (25.9%), then Jupiter Perps at $43.9M (20.8%) and Phoenix at $20.3M (9.6%). Bullet ($4.2M) and Velocity ($177K) trail far behind.
The largest single book is $SOL on Jupiter Perps at $29.5M, where traders pay an hourly borrow fee of +0.0015% to keep their leverage open. Trading across all six venues came to $500.3M over 24 hours.
Pacifica follows at $54.7M (25.9%), then Jupiter Perps at $43.9M (20.8%) and Phoenix at $20.3M (9.6%). Bullet ($4.2M) and Velocity ($177K) trail far behind.
The largest single book is $SOL on Jupiter Perps at $29.5M, where traders pay an hourly borrow fee of +0.0015% to keep their leverage open. Trading across all six venues came to $500.3M over 24 hours.
·
--
Ver traducción
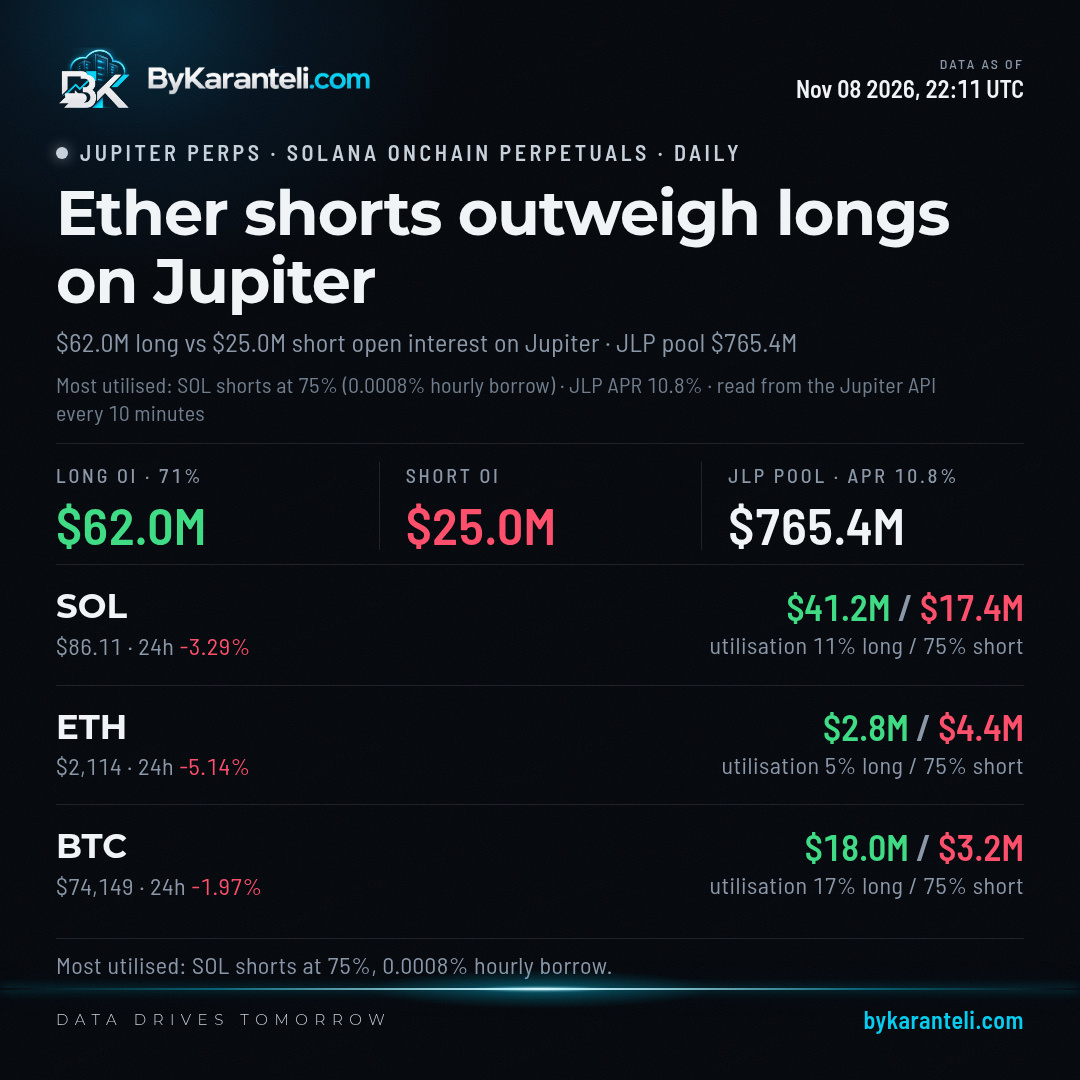
Ether is the one market on Jupiter Perps where bets on a fall outweigh bets on a rise. $ETH shorts total $4.4M against $2.8M in longs, with the price down 5.14% over 24 hours at $2.1K.
Across the venue the balance runs the other way. Longs hold $62.0M against $25.0M in shorts, 71.3% of open bets, with $SOL carrying $41.2M of the long side and $BTC $18.0M.
The tightest spot is short capacity. Shorts on $SOL use 74.5% of what the pool sets aside for them, against 11% on the long side. The JLP pool, the liquidity traders borrow from, holds $765.4M and pays 10.78% a year.
Ether is the one market on Jupiter Perps where bets on a fall outweigh bets on a rise. $ETH shorts total $4.4M against $2.8M in longs, with the price down 5.14% over 24 hours at $2.1K.
Across the venue the balance runs the other way. Longs hold $62.0M against $25.0M in shorts, 71.3% of open bets, with $SOL carrying $41.2M of the long side and $BTC $18.0M.
The tightest spot is short capacity. Shorts on $SOL use 74.5% of what the pool sets aside for them, against 11% on the long side. The JLP pool, the liquidity traders borrow from, holds $765.4M and pays 10.78% a year.
Across the venue the balance runs the other way. Longs hold $62.0M against $25.0M in shorts, 71.3% of open bets, with $SOL carrying $41.2M of the long side and $BTC $18.0M.
The tightest spot is short capacity. Shorts on $SOL use 74.5% of what the pool sets aside for them, against 11% on the long side. The JLP pool, the liquidity traders borrow from, holds $765.4M and pays 10.78% a year.
·
--
Ver traducción
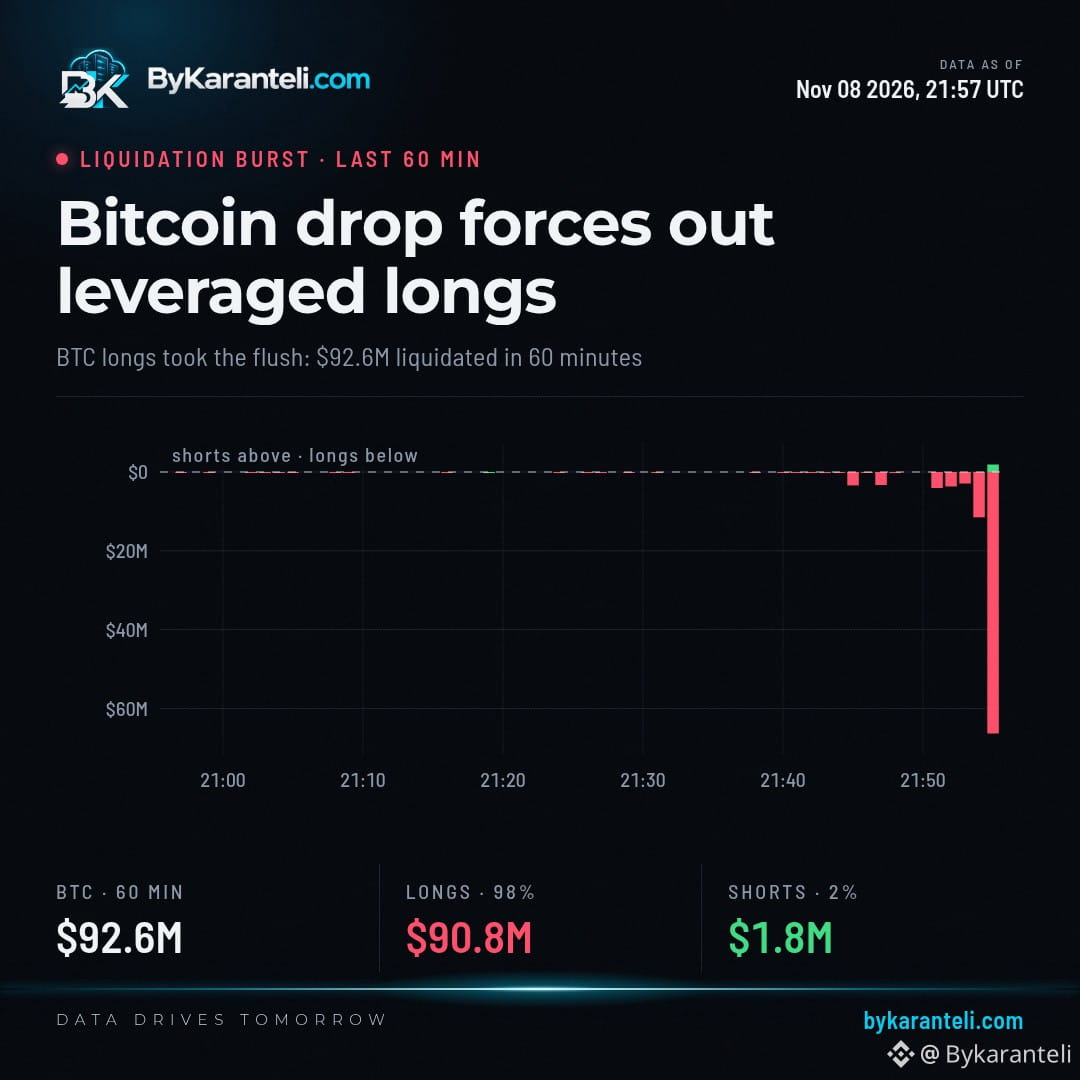
Bitcoin just dropped 2.89% in roughly the last hour to $73,704, leaving it 2.58% lower over 24 hours.
The move hit one side almost entirely. In the last 60 minutes our streams recorded $90.8M of leveraged long positions forced shut, against $1.8M on the short side. Those are recorded figures from our collectors, a floor rather than the whole market.
Funding, the fee long holders pay shorts to keep positions open, was +0.004% per interval, close to flat.
Bitcoin just dropped 2.89% in roughly the last hour to $73,704, leaving it 2.58% lower over 24 hours.
The move hit one side almost entirely. In the last 60 minutes our streams recorded $90.8M of leveraged long positions forced shut, against $1.8M on the short side. Those are recorded figures from our collectors, a floor rather than the whole market.
Funding, the fee long holders pay shorts to keep positions open, was +0.004% per interval, close to flat.
The move hit one side almost entirely. In the last 60 minutes our streams recorded $90.8M of leveraged long positions forced shut, against $1.8M on the short side. Those are recorded figures from our collectors, a floor rather than the whole market.
Funding, the fee long holders pay shorts to keep positions open, was +0.004% per interval, close to flat.
·
--
Ver traducción
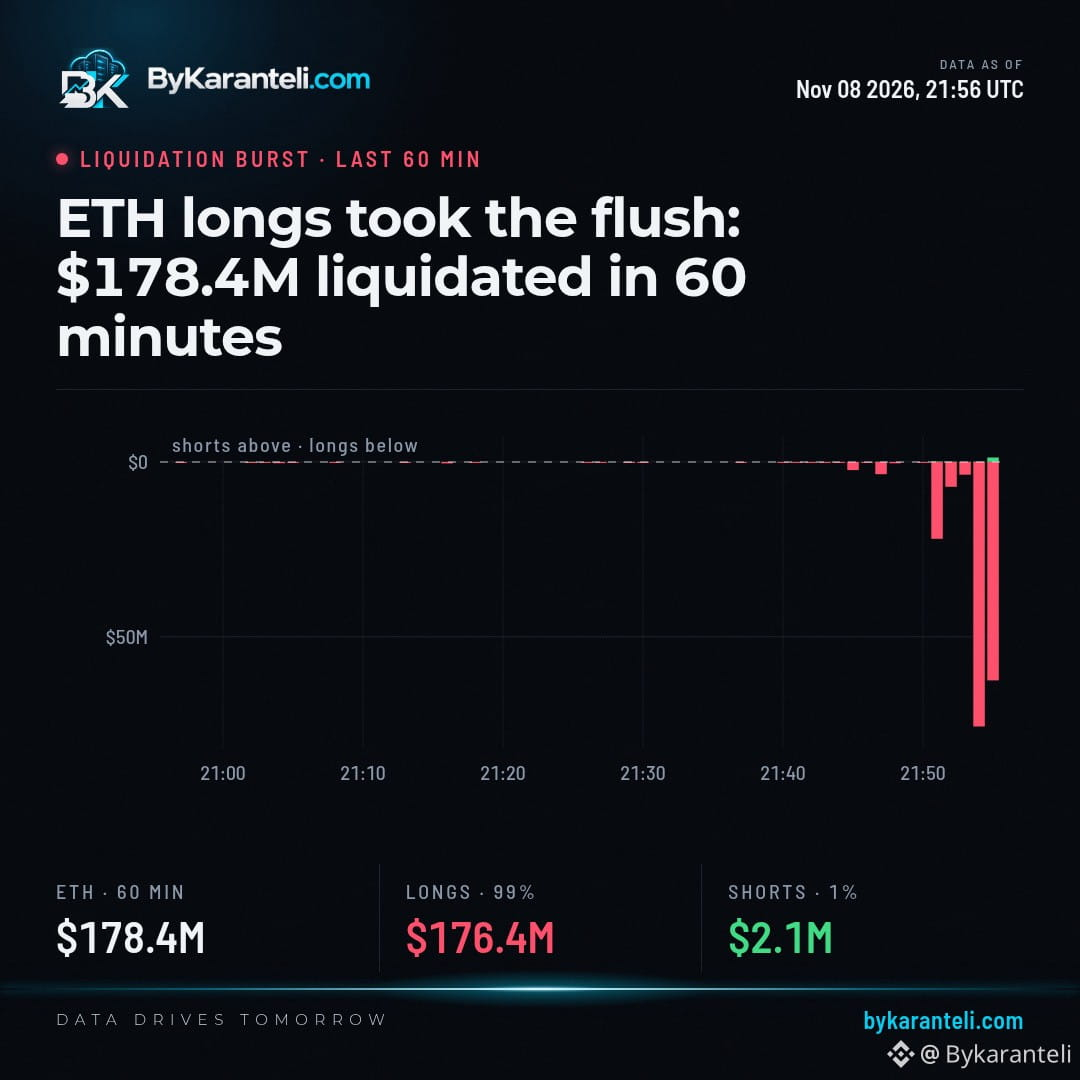
ETH is down 4.6% in the last hour at 2,128. 176.4M longs vs 2.1M shorts were liquidated and funding at +0.002% per interval shows longs were the crowded side getting flushed.
ETH is down 4.6% in the last hour at 2,128. 176.4M longs vs 2.1M shorts were liquidated and funding at +0.002% per interval shows longs were the crowded side getting flushed.
·
--
Ver traducción
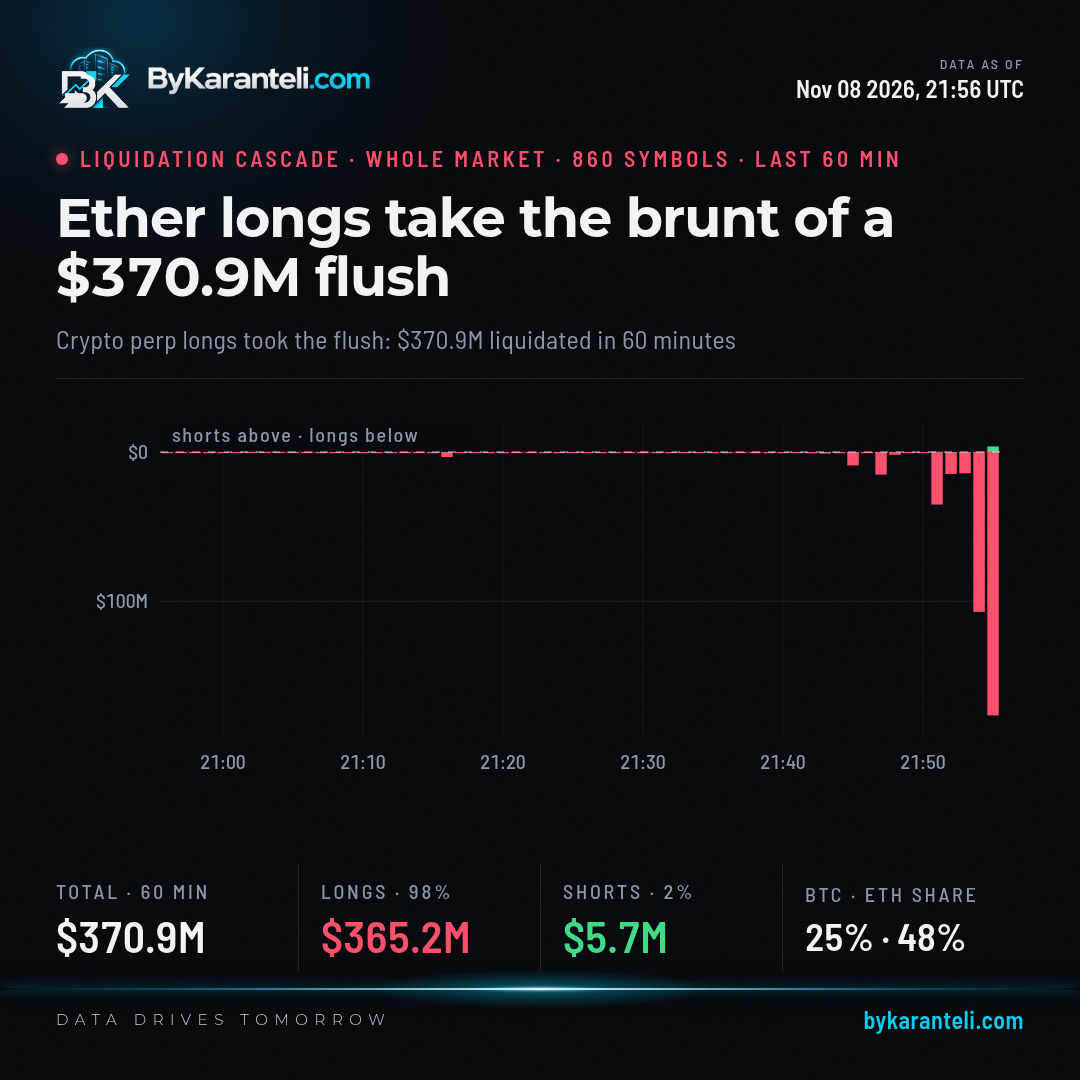
Ether longs took the worst of a sharp flush. In the last 60 minutes, $370.9M of leveraged positions were forced closed across 860 coins on the major venues, and 98% of it was traders betting on a rise. $364.7M of that hit in the last 30 minutes.
$ETH longs lost $176.4M against $2.1M on the short side. The two largest single liquidations were both Ether longs on Binance at 21:54 UTC, $17.6M near $2,158 and $12.2M near $2,162. Ether trades at $2,122, down 4.85% over 24 hours.
$BTC longs lost $90.8M. Bitcoin is at $73,895, down 2.36% on the day, after a session low of $73,333.
Ether longs took the worst of a sharp flush. In the last 60 minutes, $370.9M of leveraged positions were forced closed across 860 coins on the major venues, and 98% of it was traders betting on a rise. $364.7M of that hit in the last 30 minutes.
$ETH longs lost $176.4M against $2.1M on the short side. The two largest single liquidations were both Ether longs on Binance at 21:54 UTC, $17.6M near $2,158 and $12.2M near $2,162. Ether trades at $2,122, down 4.85% over 24 hours.
$BTC longs lost $90.8M. Bitcoin is at $73,895, down 2.36% on the day, after a session low of $73,333.
$ETH longs lost $176.4M against $2.1M on the short side. The two largest single liquidations were both Ether longs on Binance at 21:54 UTC, $17.6M near $2,158 and $12.2M near $2,162. Ether trades at $2,122, down 4.85% over 24 hours.
$BTC longs lost $90.8M. Bitcoin is at $73,895, down 2.36% on the day, after a session low of $73,333.
·
--
Ver traducción
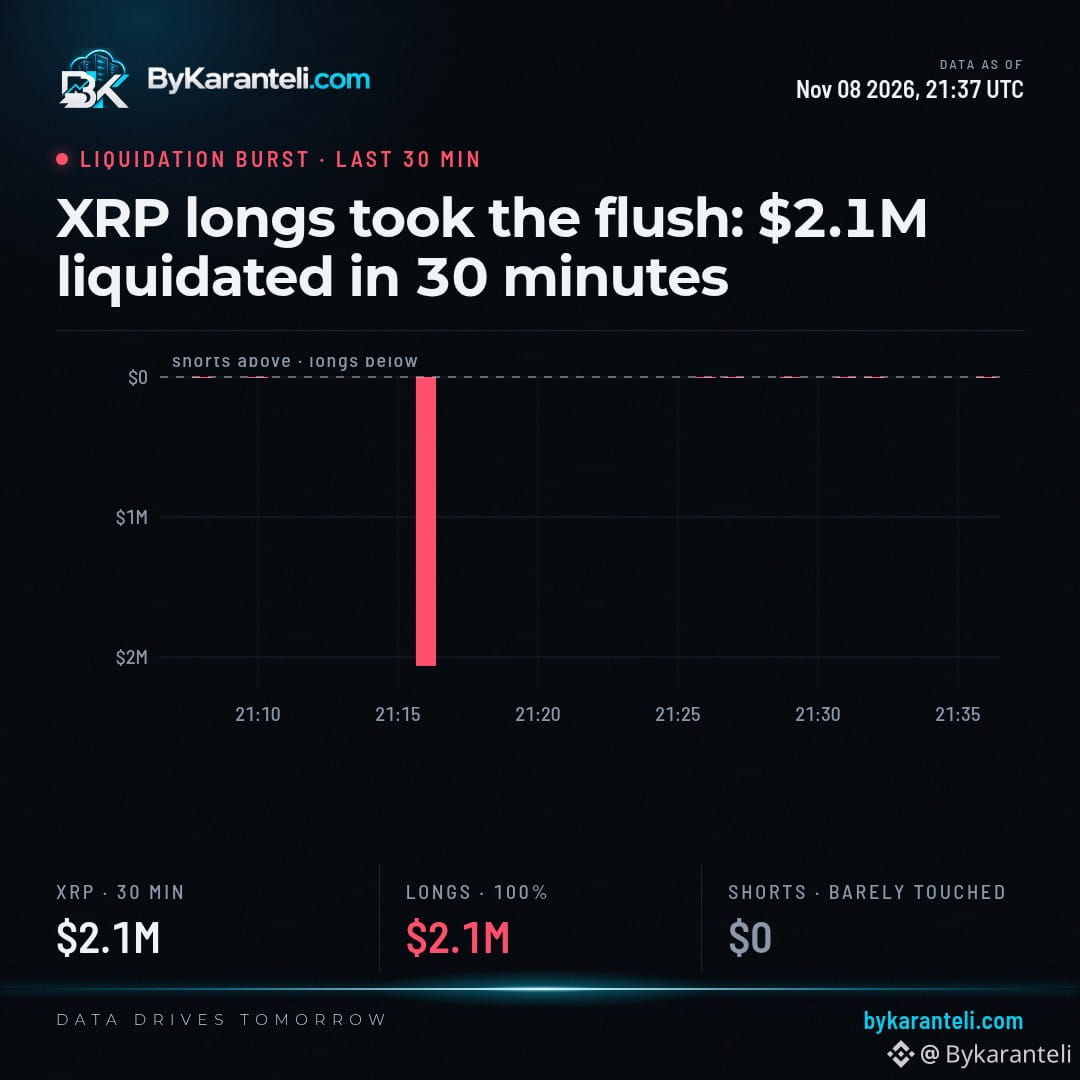
$2.1M of XRP longs were liquidated across major venues in the last 30 minutes, while shorts were barely touched. Historically, this kind of one sided long flush has often coincided with short term downside pressure, though that is not a prediction.
$2.1M of XRP longs were liquidated across major venues in the last 30 minutes, while shorts were barely touched. Historically, this kind of one sided long flush has often coincided with short term downside pressure, though that is not a prediction.
·
--
Ver traducción
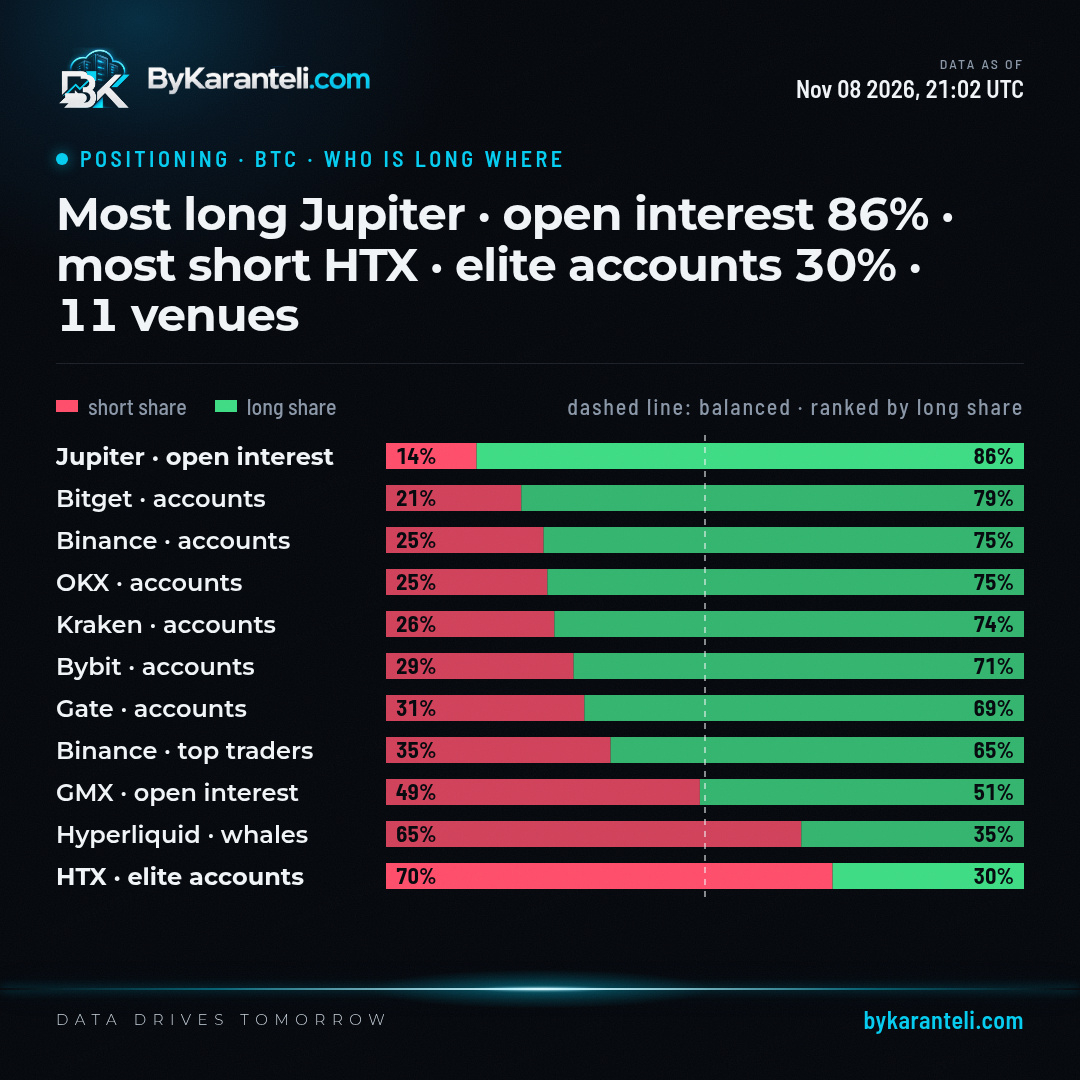
On $BTC, Jupiter · open interest shows the highest long share at 86% against HTX · elite accounts at 30%, a gap of 56 points. Bitget · accounts stands at 79% on accounts, while Hyperliquid · whales is at 35% on whale notional.
On $BTC , Jupiter · open interest shows the highest long share at 86% against HTX · elite accounts at 30%, a gap of 56 points. Bitget · accounts stands at 79% on accounts, while Hyperliquid · whales is at 35% on whale notional.
·
--
Ver traducción
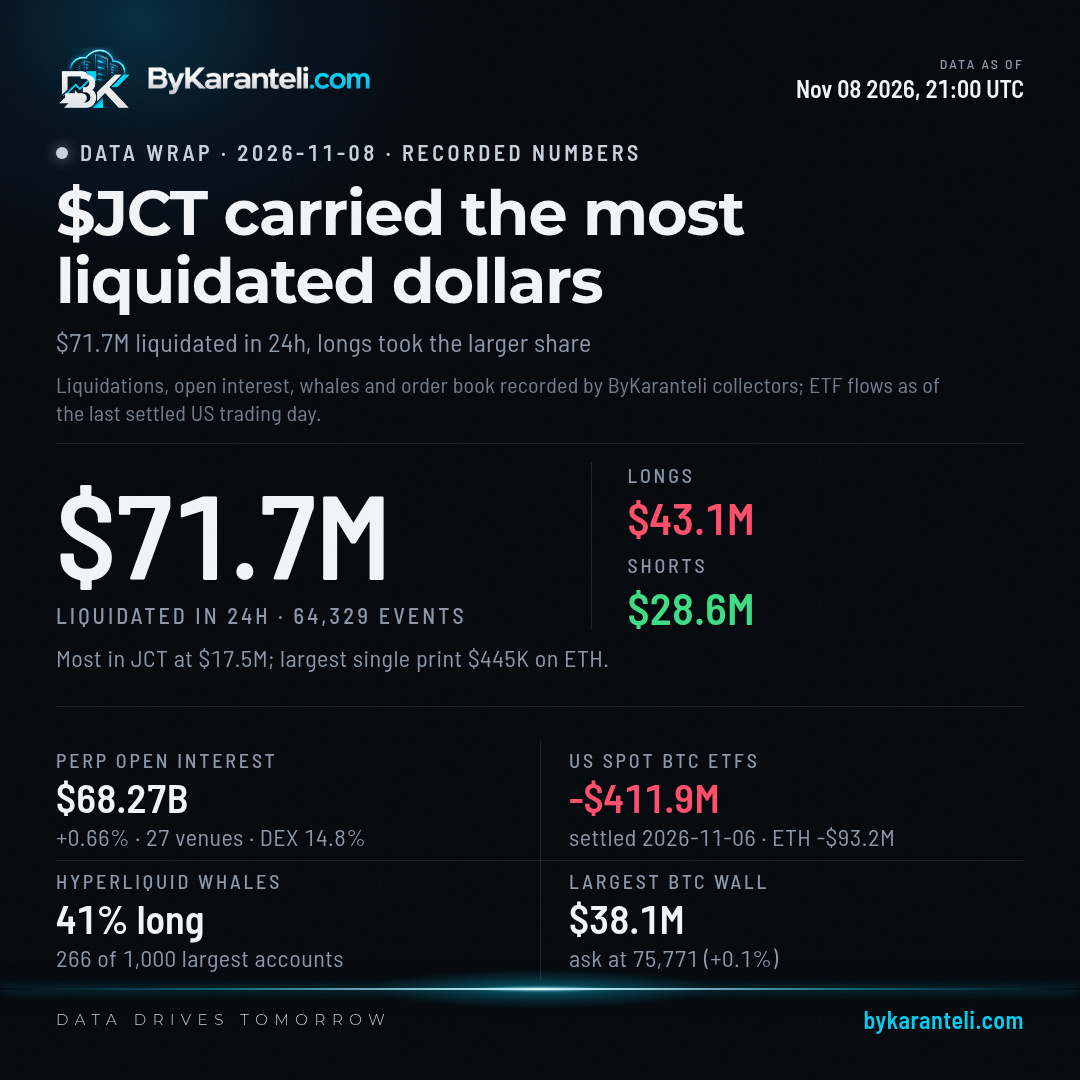
$JCT, not Bitcoin or Ether, carried the most liquidated dollars in the 24 hours to Nov 8, $17.5M of the $71.7M our collectors recorded. Leveraged longs lost $43.1M of that and shorts $28.6M, across 64,329 events.
Open perpetual futures bets across 27 venues came to $68.27B, up 0.66% on a day earlier, with 14.8% of it held on decentralized venues.
US spot BTC ETFs settled Nov 6 at -$411.9M net, ETH funds at -$93.2M. Hyperliquid's largest accounts by equity hold 41.1% of their open notional long. The biggest $BTC resting wall is a $36.3M ask at $75.8K, 0.05% above mid.
$JCT , not Bitcoin or Ether, carried the most liquidated dollars in the 24 hours to Nov 8, $17.5M of the $71.7M our collectors recorded. Leveraged longs lost $43.1M of that and shorts $28.6M, across 64,329 events.
Open perpetual futures bets across 27 venues came to $68.27B, up 0.66% on a day earlier, with 14.8% of it held on decentralized venues.
US spot BTC ETFs settled Nov 6 at -$411.9M net, ETH funds at -$93.2M. Hyperliquid's largest accounts by equity hold 41.1% of their open notional long. The biggest $BTC resting wall is a $36.3M ask at $75.8K, 0.05% above mid.
Open perpetual futures bets across 27 venues came to $68.27B, up 0.66% on a day earlier, with 14.8% of it held on decentralized venues.
US spot BTC ETFs settled Nov 6 at -$411.9M net, ETH funds at -$93.2M. Hyperliquid's largest accounts by equity hold 41.1% of their open notional long. The biggest $BTC resting wall is a $36.3M ask at $75.8K, 0.05% above mid.
·
--
Ver traducción
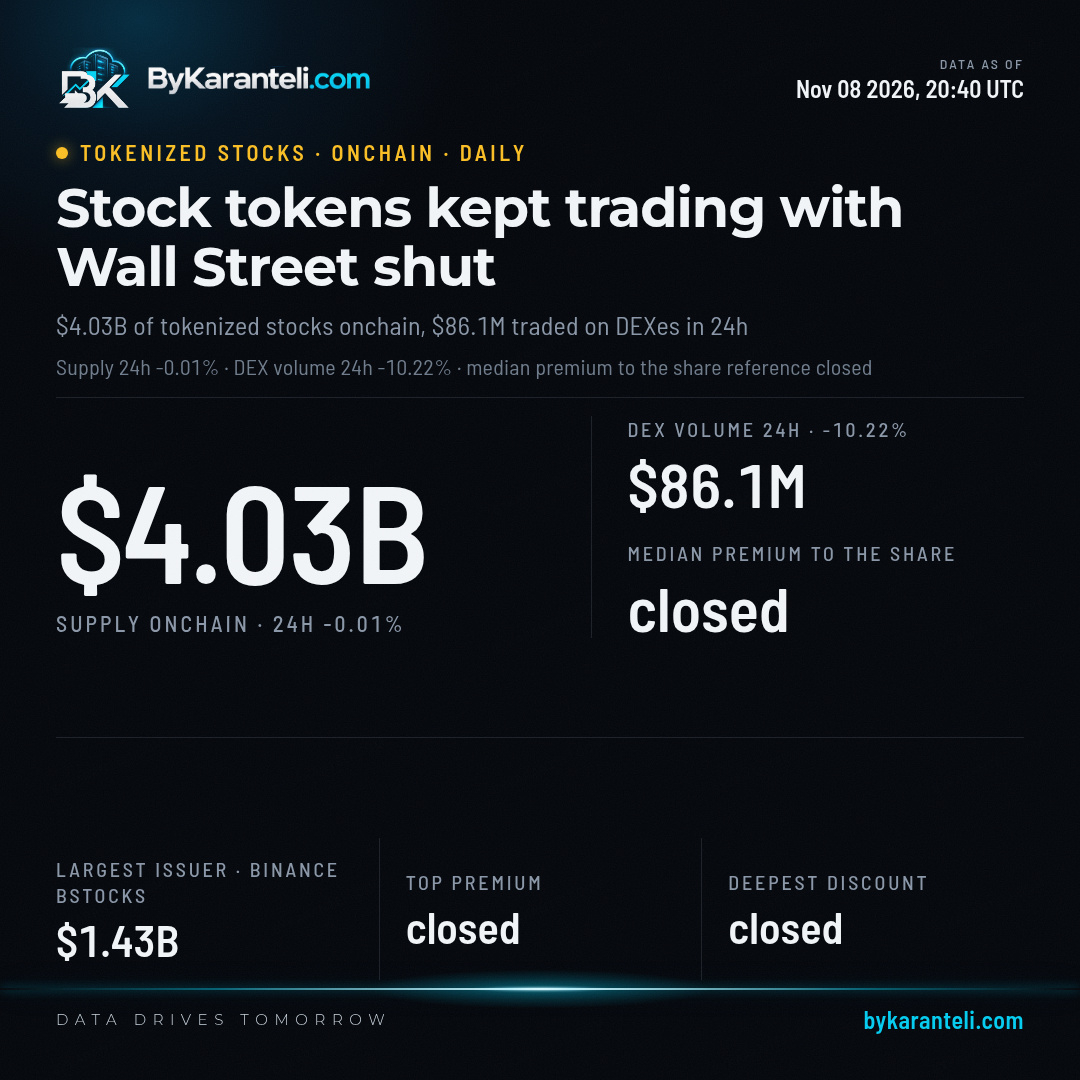
The share market was closed on Nov 8, so there was no live stock price to measure the tokens against and no premium or discount reading for the day. The tokens kept trading on chain anyway.
Volume on decentralized exchanges was $86.1M, -10.22% on the day. Supply valued at share prices stood at $4.03B, -0.01% since the last recorded day.
Binance bStocks is the largest issuer at $1.43B. Each of these tokens tracks one listed share held by a custodian.
The share market was closed on Nov 8, so there was no live stock price to measure the tokens against and no premium or discount reading for the day. The tokens kept trading on chain anyway.
Volume on decentralized exchanges was $86.1M, -10.22% on the day. Supply valued at share prices stood at $4.03B, -0.01% since the last recorded day.
Binance bStocks is the largest issuer at $1.43B. Each of these tokens tracks one listed share held by a custodian.
Volume on decentralized exchanges was $86.1M, -10.22% on the day. Supply valued at share prices stood at $4.03B, -0.01% since the last recorded day.
Binance bStocks is the largest issuer at $1.43B. Each of these tokens tracks one listed share held by a custodian.
·
--
Ver traducción
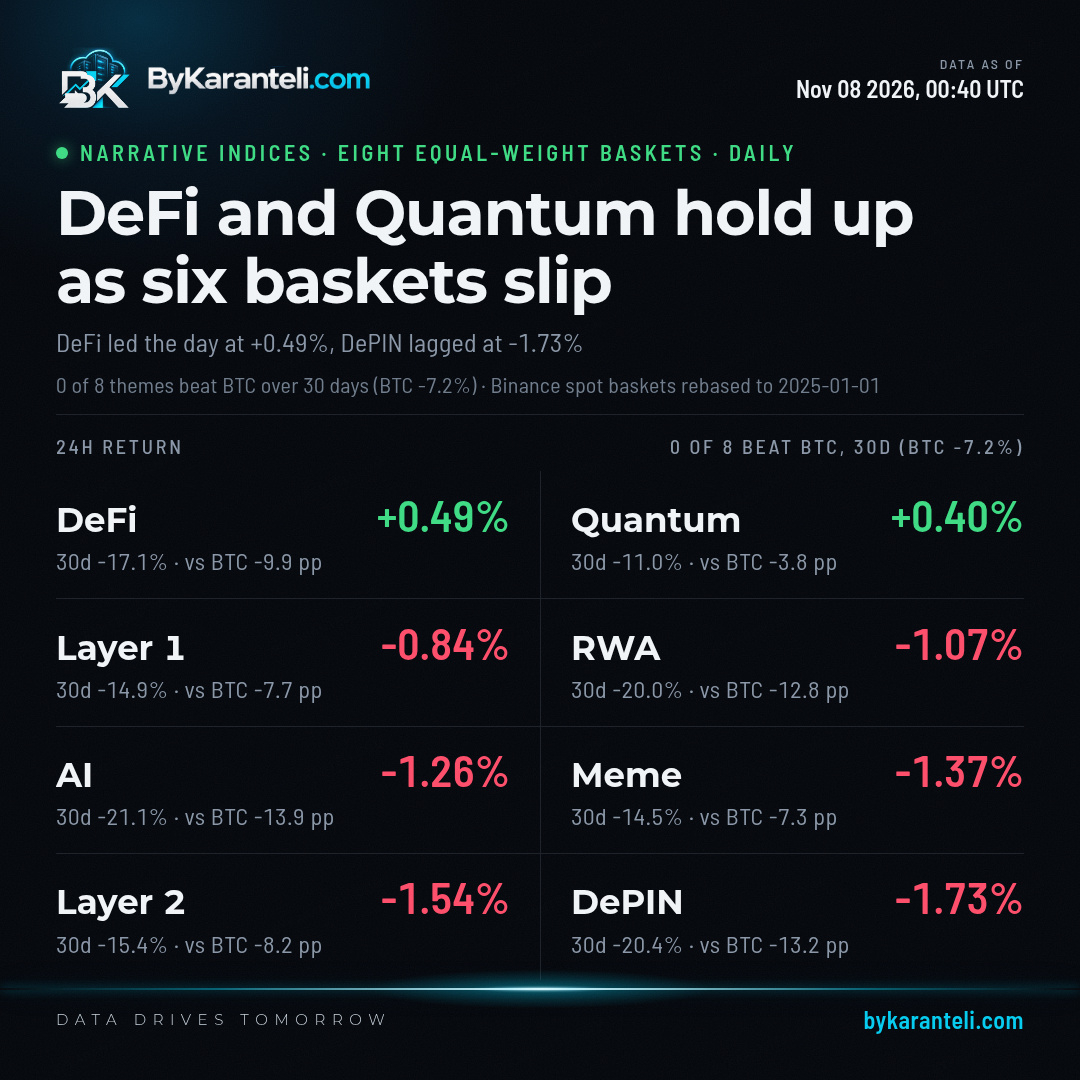
DeFi and Quantum were the only theme baskets to finish green over the 24 hours to Nov 8, at +0.49% and 0.4%. The other six closed lower, with DePIN taking the biggest hit at -1.73%.
The month tells a different story. None of the eight kept pace with $BTC over 30 days, and Bitcoin itself returned -7.2%. Quantum came closest at -11%, 3.8 percentage points behind. AI trailed furthest at -21.1%, 13.9 points short, and DePIN at -20.4% and RWA at -20% were not far ahead of it.
Each theme is an equal weight basket of Binance spot pairs, so one coin cannot carry the whole group.
DeFi and Quantum were the only theme baskets to finish green over the 24 hours to Nov 8, at +0.49% and 0.4%. The other six closed lower, with DePIN taking the biggest hit at -1.73%.
The month tells a different story. None of the eight kept pace with $BTC over 30 days, and Bitcoin itself returned -7.2%. Quantum came closest at -11%, 3.8 percentage points behind. AI trailed furthest at -21.1%, 13.9 points short, and DePIN at -20.4% and RWA at -20% were not far ahead of it.
Each theme is an equal weight basket of Binance spot pairs, so one coin cannot carry the whole group.
The month tells a different story. None of the eight kept pace with $BTC over 30 days, and Bitcoin itself returned -7.2%. Quantum came closest at -11%, 3.8 percentage points behind. AI trailed furthest at -21.1%, 13.9 points short, and DePIN at -20.4% and RWA at -20% were not far ahead of it.
Each theme is an equal weight basket of Binance spot pairs, so one coin cannot carry the whole group.
·
--
Ver traducción
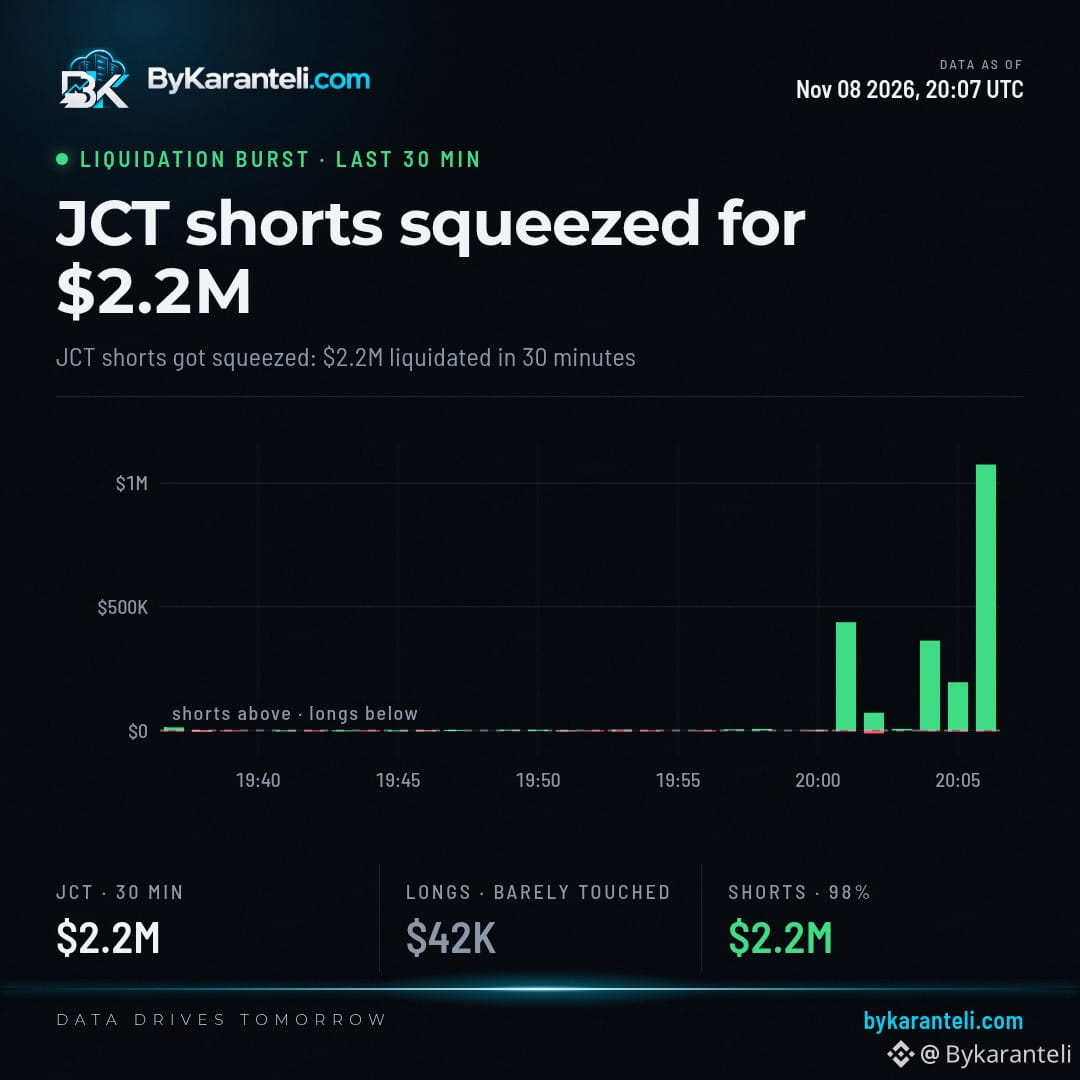
A sharp squeeze just hit traders betting against JCT. In the last 30 minutes, $2.2M of leveraged $JCT short positions were liquidated across the major venues, meaning exchanges closed them by force once losses ate through the collateral behind them.
The other side barely felt it. Leveraged longs, the traders positioned for a higher price, lost $41.7K over the same window.
The figures come from the raw liquidation streams of the major venues.
A sharp squeeze just hit traders betting against JCT. In the last 30 minutes, $2.2M of leveraged $JCT short positions were liquidated across the major venues, meaning exchanges closed them by force once losses ate through the collateral behind them.
The other side barely felt it. Leveraged longs, the traders positioned for a higher price, lost $41.7K over the same window.
The figures come from the raw liquidation streams of the major venues.
The other side barely felt it. Leveraged longs, the traders positioned for a higher price, lost $41.7K over the same window.
The figures come from the raw liquidation streams of the major venues.
·
--
Ver traducción
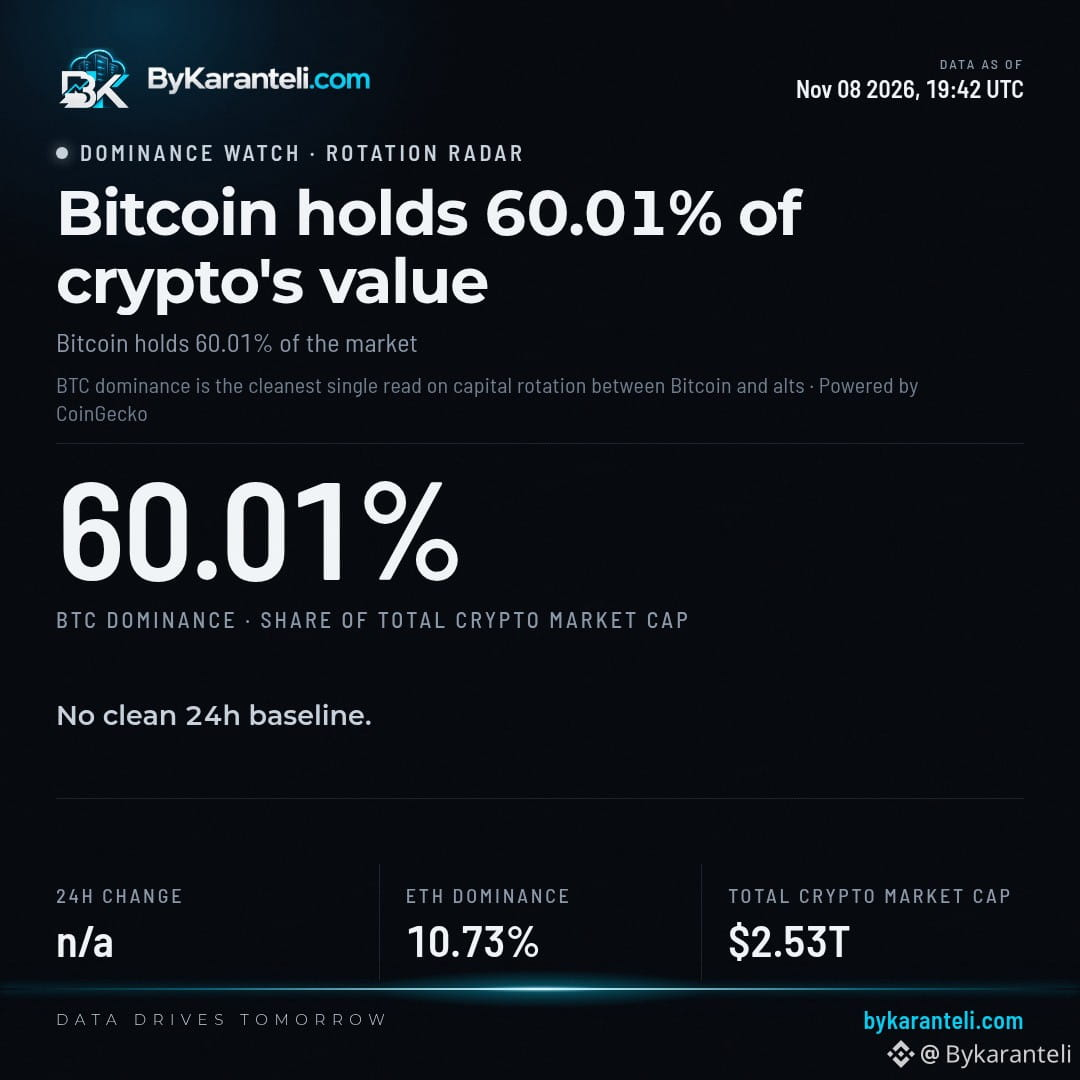
Ether, the second largest coin, holds 10.73% of crypto's total value. Bitcoin holds 60.01%, in a market worth $2.53T at 19:42 UTC on Nov 8.
That leaves everything outside $BTC and $ETH to share what remains. Every other token, from the large caps down to the smallest listings, competes for that slice.
One reading shows where the money sits, not which way it is moving. Any shift toward the rest of the market would have to appear in Bitcoin's share across several days, not in a single snapshot.
Ether, the second largest coin, holds 10.73% of crypto's total value. Bitcoin holds 60.01%, in a market worth $2.53T at 19:42 UTC on Nov 8.
That leaves everything outside $BTC and $ETH to share what remains. Every other token, from the large caps down to the smallest listings, competes for that slice.
One reading shows where the money sits, not which way it is moving. Any shift toward the rest of the market would have to appear in Bitcoin's share across several days, not in a single snapshot.
That leaves everything outside $BTC and $ETH to share what remains. Every other token, from the large caps down to the smallest listings, competes for that slice.
One reading shows where the money sits, not which way it is moving. Any shift toward the rest of the market would have to appear in Bitcoin's share across several days, not in a single snapshot.
·
--
Ver traducción
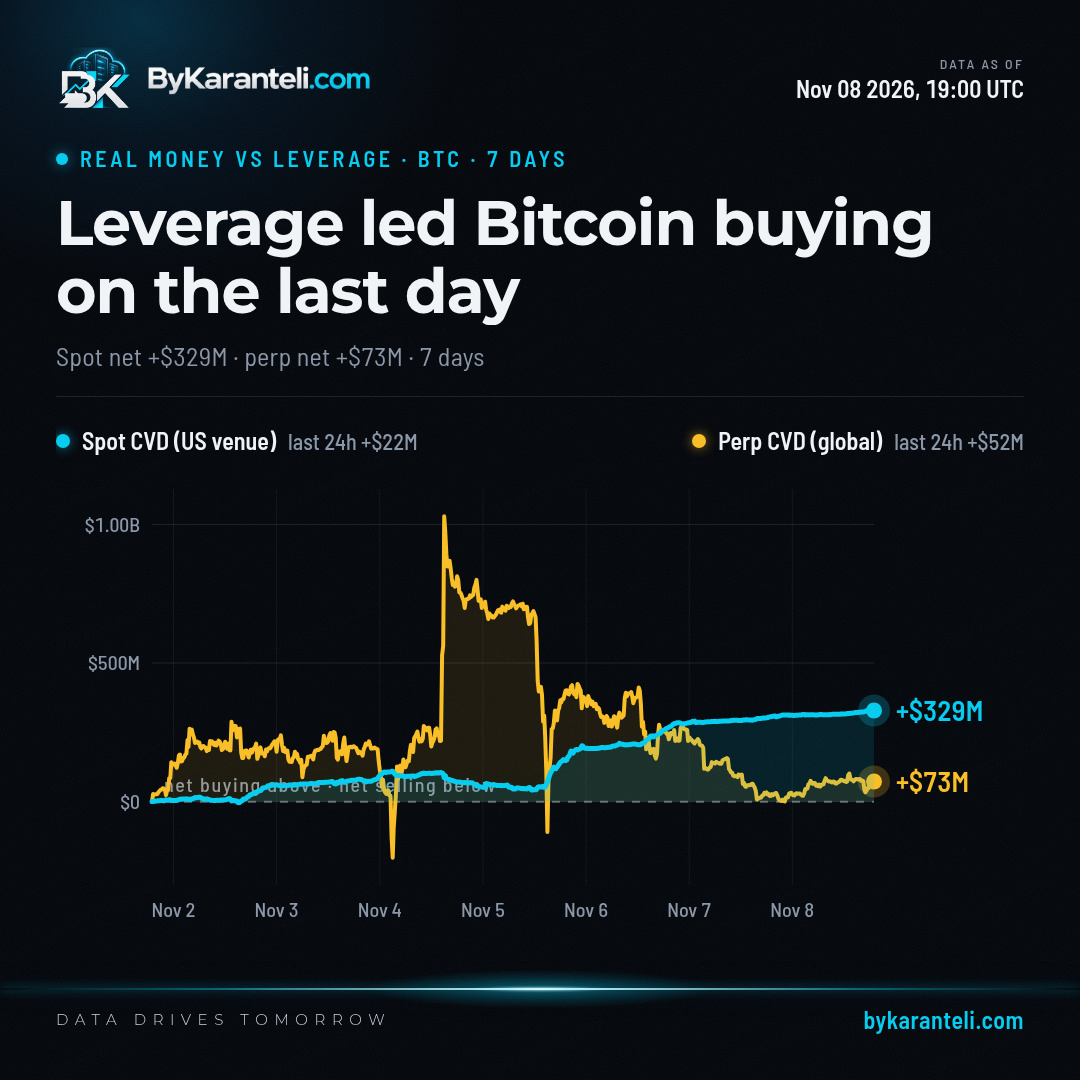
Bitcoin had buyers on both sides of the market this week, but they didn't carry equal weight. Over the seven days to Nov 8, 19:00 UTC, buyers paying the asking price on the US spot venue outweighed sellers by +$329M. On the global perp market, where traders use leverage, the net was a smaller +$76M.
The final 24 hours ran the other way round. Perp buyers came out ahead by +$55M, more than double the +$22M on the spot side.
So the week's base came from people buying the coin outright. The latest day's buying came mostly from leveraged positions.
Bitcoin had buyers on both sides of the market this week, but they didn't carry equal weight. Over the seven days to Nov 8, 19:00 UTC, buyers paying the asking price on the US spot venue outweighed sellers by +$329M. On the global perp market, where traders use leverage, the net was a smaller +$76M.
The final 24 hours ran the other way round. Perp buyers came out ahead by +$55M, more than double the +$22M on the spot side.
So the week's base came from people buying the coin outright. The latest day's buying came mostly from leveraged positions.
The final 24 hours ran the other way round. Perp buyers came out ahead by +$55M, more than double the +$22M on the spot side.
So the week's base came from people buying the coin outright. The latest day's buying came mostly from leveraged positions.
·
--
Ver traducción
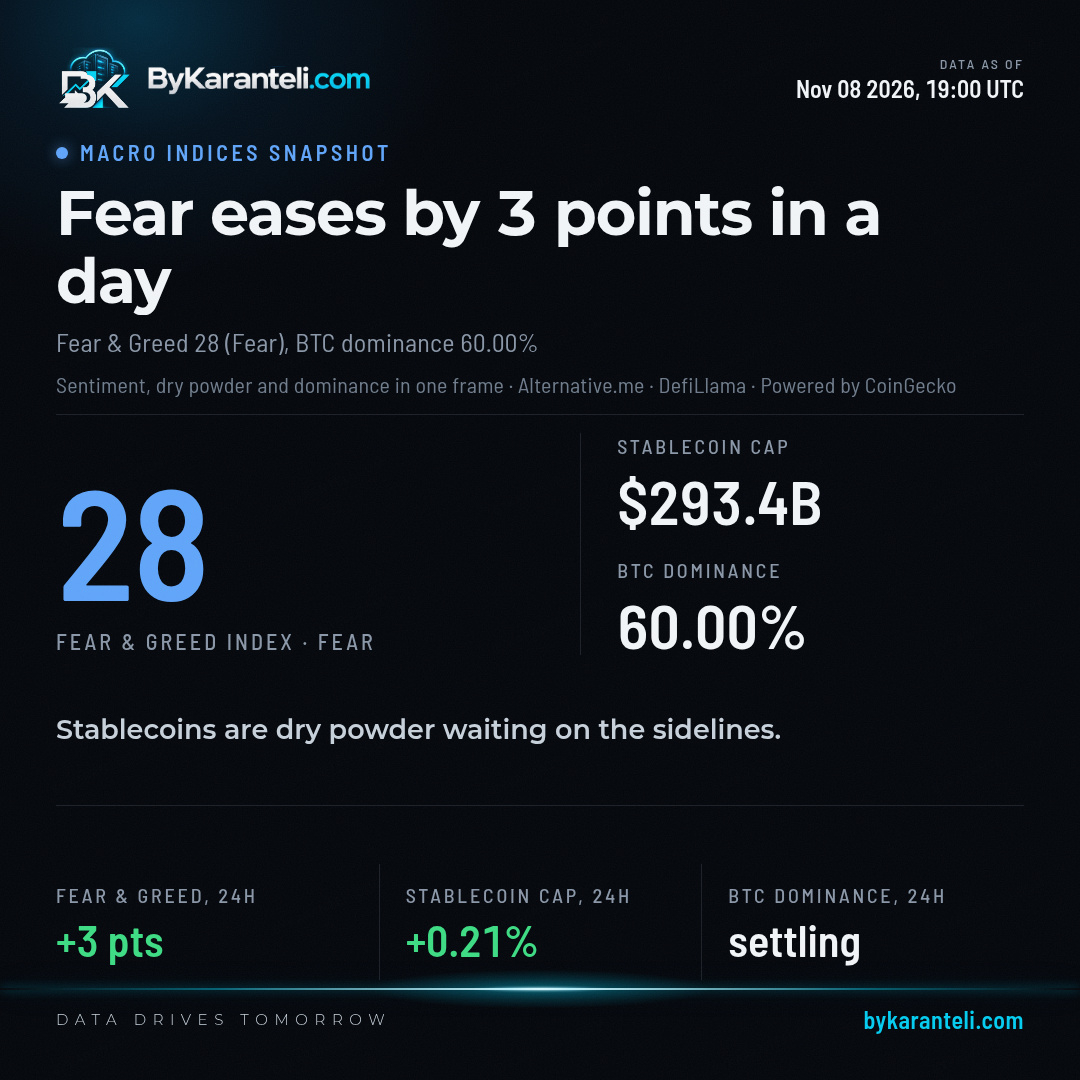
Fear eased by 3 points over the 24 hours to 19:00 UTC on Nov 8. The Fear and Greed index, a single score for how nervous or bold traders feel, read 28, a reading still labelled fear.
The pool of dollars parked on crypto rails grew over the same day. Total stablecoin supply rose 0.21% to $293.40B.
Bitcoin's share of the whole crypto market stood at 60% at the same hour, so $BTC still carries most of the market's value.
Fear eased by 3 points over the 24 hours to 19:00 UTC on Nov 8. The Fear and Greed index, a single score for how nervous or bold traders feel, read 28, a reading still labelled fear.
The pool of dollars parked on crypto rails grew over the same day. Total stablecoin supply rose 0.21% to $293.40B.
Bitcoin's share of the whole crypto market stood at 60% at the same hour, so $BTC still carries most of the market's value.
The pool of dollars parked on crypto rails grew over the same day. Total stablecoin supply rose 0.21% to $293.40B.
Bitcoin's share of the whole crypto market stood at 60% at the same hour, so $BTC still carries most of the market's value.
·
--
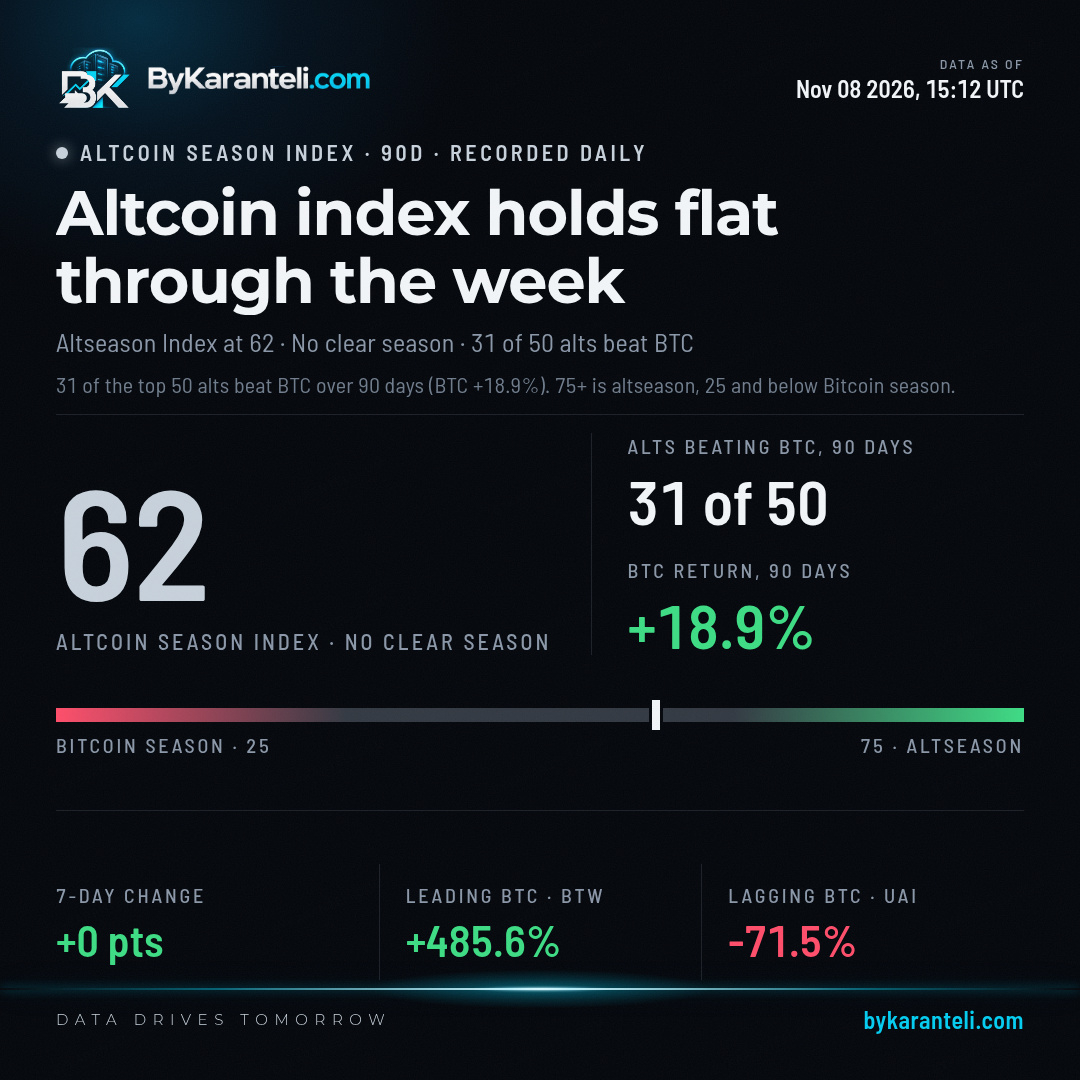
Pasó una semana completa sin que se moviera el Índice de Temporada de Altcoins, que se mantuvo en 62 el 8 de noviembre. Esto deja al mercado sin una temporada claramente definida: por debajo del nivel de 75 donde comienza la temporada de altcoins y muy por encima de la línea de 25 que marca la temporada de Bitcoin.
La diferencia dentro de la muestra es amplia. $BTW lidera con un +485,6 % en 90 días y $UAI queda a la zaga con un -71,5 %, frente a una ganancia del 18,9 % para $BTC en el mismo período.
En total, 31 de las 50 altcoins que seguimos han superado a Bitcoin en esos 90 días.
Pasó una semana completa sin que se moviera el Índice de Temporada de Altcoins, que se mantuvo en 62 el 8 de noviembre. Esto deja al mercado sin una temporada claramente definida: por debajo del nivel de 75 donde comienza la temporada de altcoins y muy por encima de la línea de 25 que marca la temporada de Bitcoin.
La diferencia dentro de la muestra es amplia. $BTW lidera con un +485,6 % en 90 días y $UAI queda a la zaga con un -71,5 %, frente a una ganancia del 18,9 % para $BTC en el mismo período.
En total, 31 de las 50 altcoins que seguimos han superado a Bitcoin en esos 90 días.
La diferencia dentro de la muestra es amplia. $BTW lidera con un +485,6 % en 90 días y $UAI queda a la zaga con un -71,5 %, frente a una ganancia del 18,9 % para $BTC en el mismo período.
En total, 31 de las 50 altcoins que seguimos han superado a Bitcoin en esos 90 días.
·
--
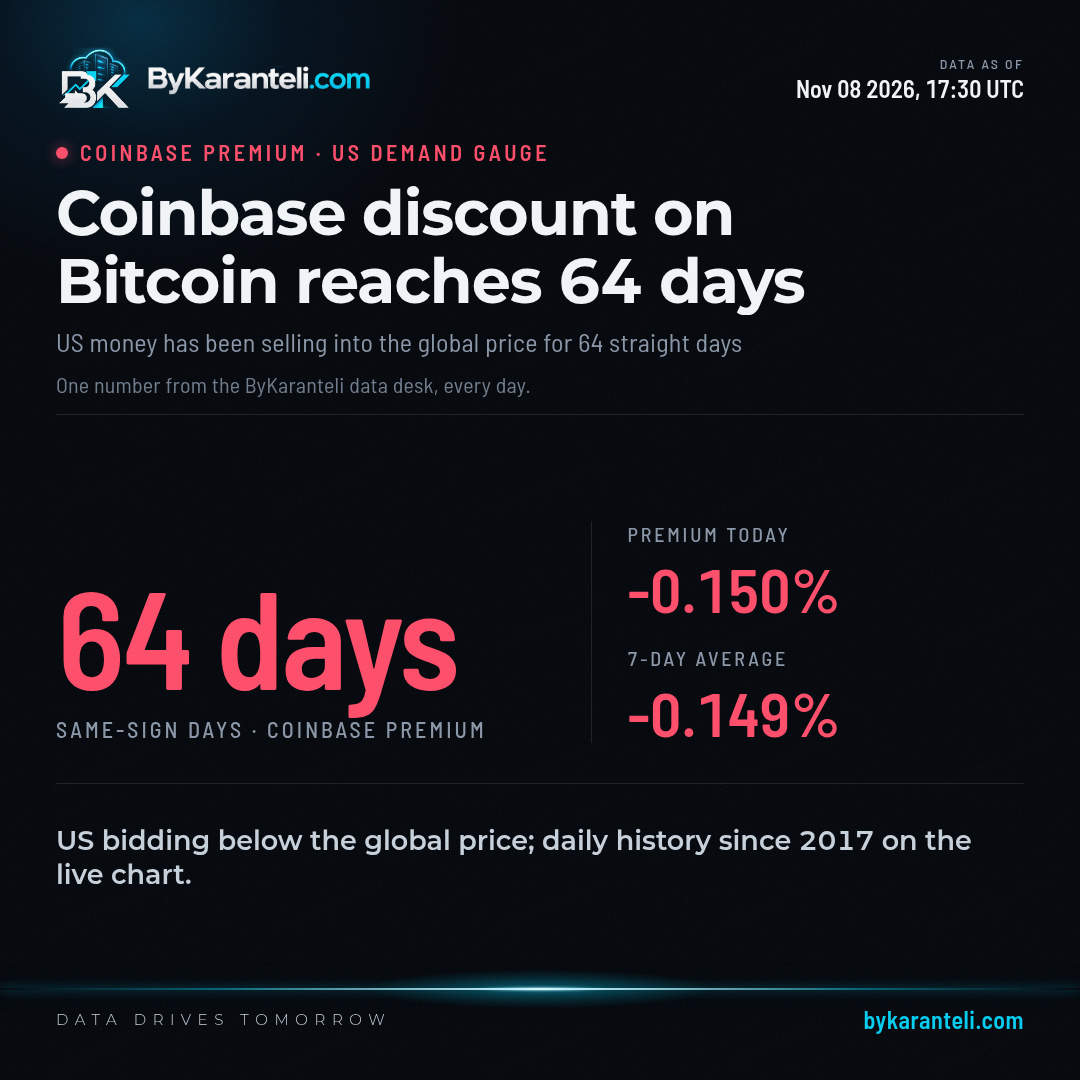
Los compradores estadounidenses en Coinbase han pagado $BTC por debajo del mercado global durante 64 días seguidos. Durante todo ese período, la principal plataforma estadounidense de compraventa al contado ha cotizado el Bitcoin por debajo de las grandes bolsas extranjeras.
La diferencia diaria más reciente es de -0,150%, frente a un promedio de siete días de -0,149%. La última lectura está prácticamente en línea con la media semanal, por lo que el descuento se mantiene estable en su nivel reciente.
La diferencia compara los precios al contado de EE. UU. con los del resto del mercado. Mide dónde se fija el precio de la demanda según la plataforma, no hacia dónde se moverá el Bitcoin a continuación.
Los compradores estadounidenses en Coinbase han pagado $BTC por debajo del mercado global durante 64 días seguidos. Durante todo ese período, la principal plataforma estadounidense de compraventa al contado ha cotizado el Bitcoin por debajo de las grandes bolsas extranjeras.
La diferencia diaria más reciente es de -0,150%, frente a un promedio de siete días de -0,149%. La última lectura está prácticamente en línea con la media semanal, por lo que el descuento se mantiene estable en su nivel reciente.
La diferencia compara los precios al contado de EE. UU. con los del resto del mercado. Mide dónde se fija el precio de la demanda según la plataforma, no hacia dónde se moverá el Bitcoin a continuación.
La diferencia diaria más reciente es de -0,150%, frente a un promedio de siete días de -0,149%. La última lectura está prácticamente en línea con la media semanal, por lo que el descuento se mantiene estable en su nivel reciente.
La diferencia compara los precios al contado de EE. UU. con los del resto del mercado. Mide dónde se fija el precio de la demanda según la plataforma, no hacia dónde se moverá el Bitcoin a continuación.
1
1
·
--
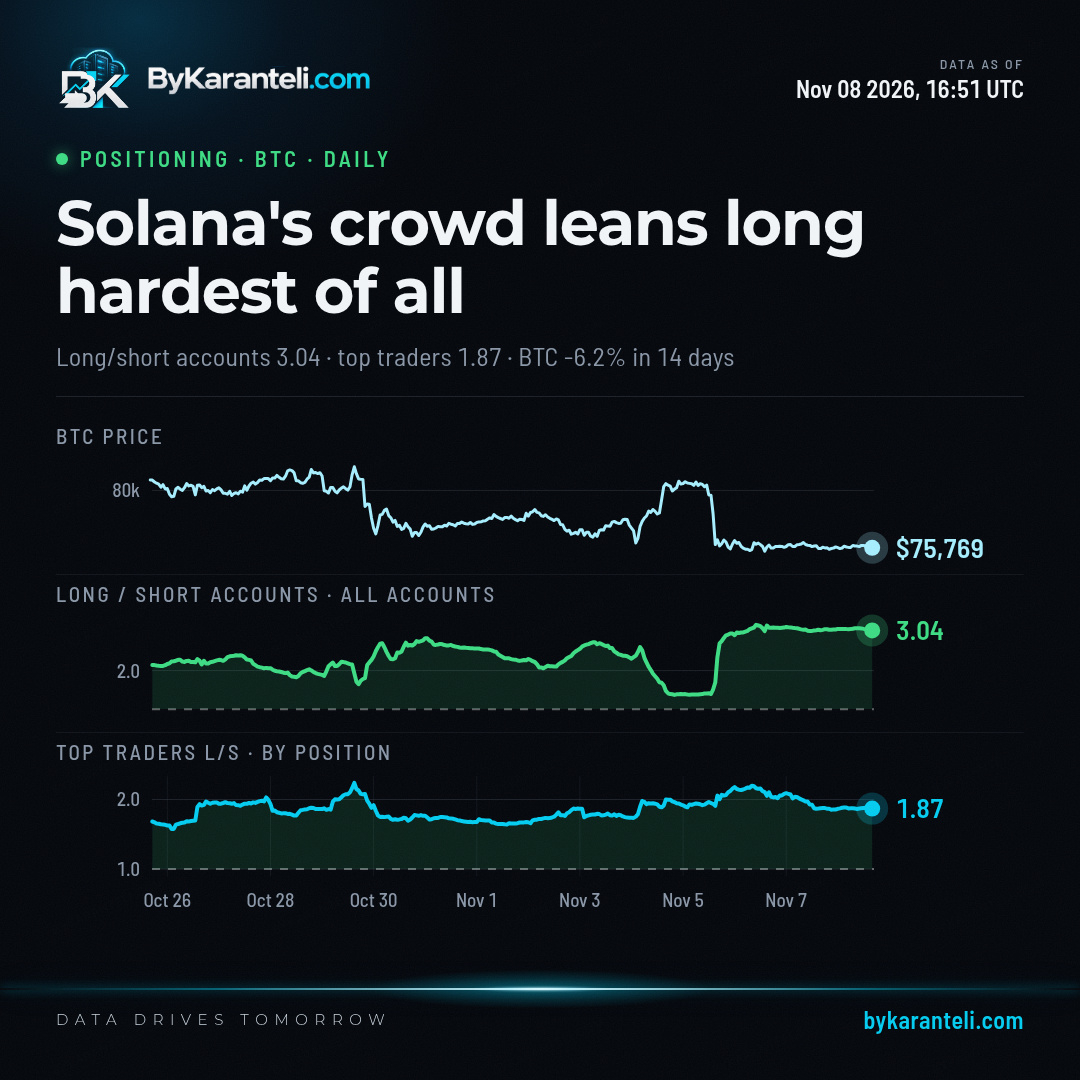
Solana tiene el sesgo más pronunciado entre las 30 monedas que seguimos. En el conjunto de todas las cuentas, 3.63 mantienen posiciones largas por cada una que mantiene una posición corta, la mayor desviación del equilibrio de todas las monedas.
El sentimiento en Bitcoin no se queda muy atrás, con 3.04, cerca del extremo superior de su rango de 14 días, de 1.37 a 3.19, incluso con una caída del precio del 6.19% durante ese período, hasta los $75,769. Los compradores agresivos compraron +794 BTC más de los que vendieron en 24 horas.
Los principales traders, según el número de cuentas, están en 3.27, pero al ponderarlos por el tamaño de sus posiciones, la cifra es de 1.87; por tanto, las carteras más grandes se inclinan mucho menos hacia posiciones largas que lo que sugiere el recuento de cuentas.
Solana tiene el sesgo más pronunciado entre las 30 monedas que seguimos. En el conjunto de todas las cuentas, 3.63 mantienen posiciones largas por cada una que mantiene una posición corta, la mayor desviación del equilibrio de todas las monedas.
El sentimiento en Bitcoin no se queda muy atrás, con 3.04, cerca del extremo superior de su rango de 14 días, de 1.37 a 3.19, incluso con una caída del precio del 6.19% durante ese período, hasta los $75,769. Los compradores agresivos compraron +794 BTC más de los que vendieron en 24 horas.
Los principales traders, según el número de cuentas, están en 3.27, pero al ponderarlos por el tamaño de sus posiciones, la cifra es de 1.87; por tanto, las carteras más grandes se inclinan mucho menos hacia posiciones largas que lo que sugiere el recuento de cuentas.
El sentimiento en Bitcoin no se queda muy atrás, con 3.04, cerca del extremo superior de su rango de 14 días, de 1.37 a 3.19, incluso con una caída del precio del 6.19% durante ese período, hasta los $75,769. Los compradores agresivos compraron +794 BTC más de los que vendieron en 24 horas.
Los principales traders, según el número de cuentas, están en 3.27, pero al ponderarlos por el tamaño de sus posiciones, la cifra es de 1.87; por tanto, las carteras más grandes se inclinan mucho menos hacia posiciones largas que lo que sugiere el recuento de cuentas.
·
--
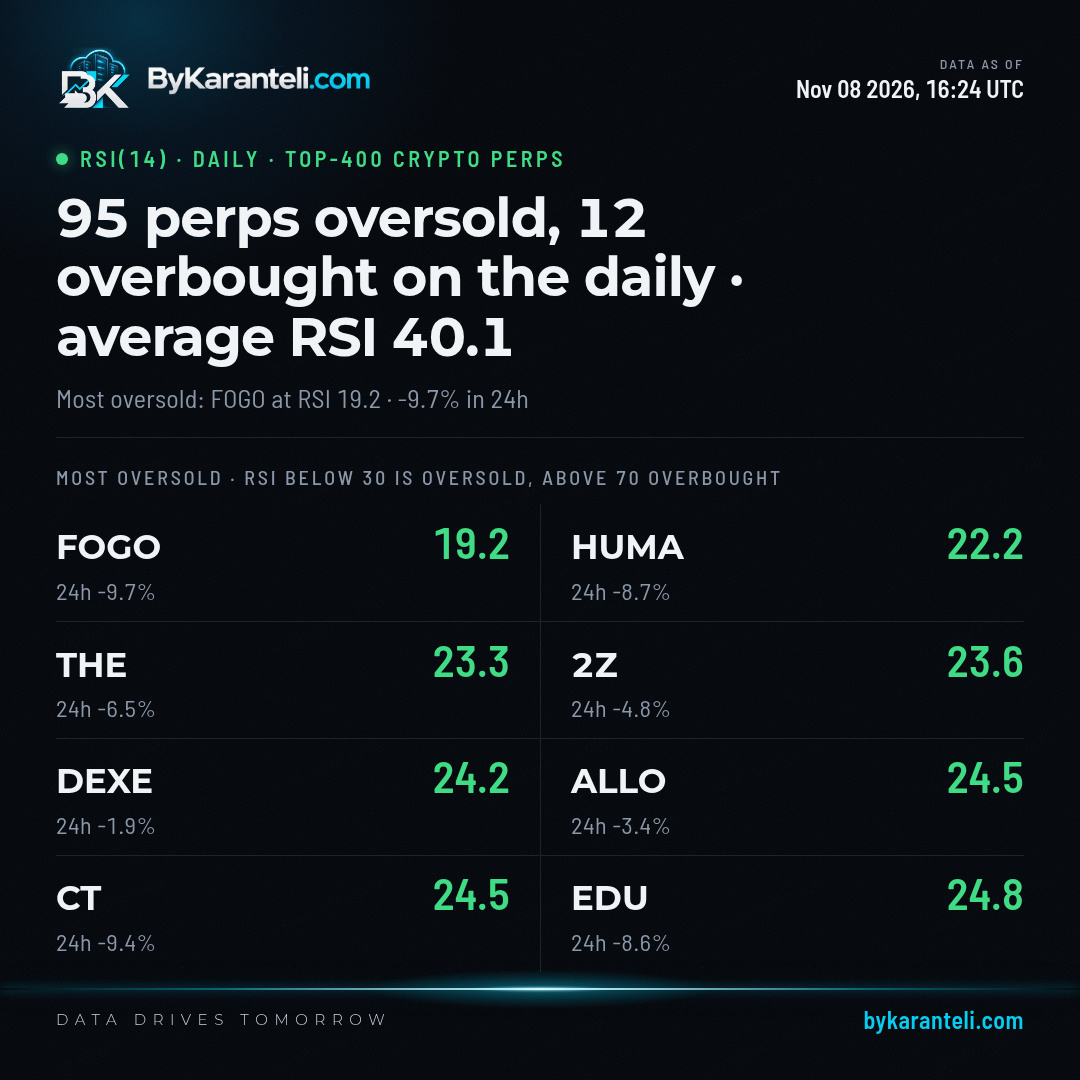
95 de 400 contratos perpetuos de criptomonedas están sobrevendidos en el gráfico diario y 12 están sobrecomprados; $FOGO es el más sobrevendido, con un RSI de 19.2. Le siguen $HUMA , con un RSI de 22.2 y una variación en 24 h de -8.7%, y $THE , con un RSI de 23.3 y una variación en 24 h de -6.5%. El mapa de calor muestra los mismos contratos en ocho intervalos.
95 de 400 contratos perpetuos de criptomonedas están sobrevendidos en el gráfico diario y 12 están sobrecomprados; $FOGO es el más sobrevendido, con un RSI de 19.2. Le siguen $HUMA , con un RSI de 22.2 y una variación en 24 h de -8.7%, y $THE , con un RSI de 23.3 y una variación en 24 h de -6.5%. El mapa de calor muestra los mismos contratos en ocho intervalos.
·
--
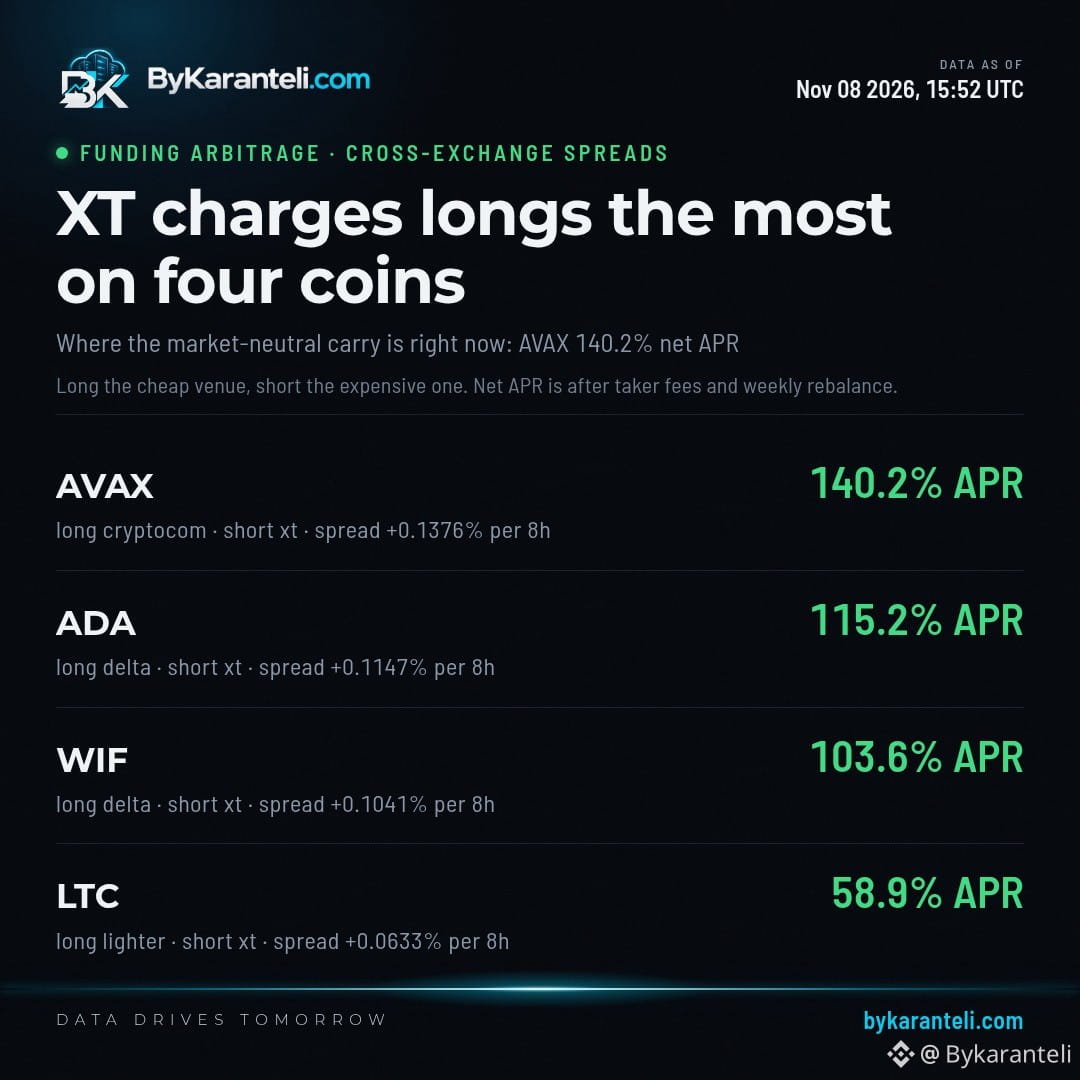
XT fue la plataforma más cara para mantener una posición larga en todas las monedas de la lista de financiación del 8 de noviembre. La financiación es el pago periódico entre posiciones largas y cortas en futuros perpetuos, y en XT las posiciones largas pagaron la tasa más alta en $AVAX, $ADA, $WIF y Litecoin.
$AVAX muestra la mayor diferencia: un 0,14 % cada 8 horas entre XT y la plataforma más barata. Le sigue $ADA con un 0,11 % y $WIF con un 0,1 %; Delta cobra menos a las posiciones largas en ambos casos. La diferencia de Litecoin es del 0,06 %, y Lighter es la plataforma más barata.
Si la diferencia de $AVAX se mantuviera sin cambios durante todo el año, equivaldría a una tasa anualizada del 140,25 % después de comisiones. Es una estimación basada en las tasas de un solo día, no en un rendimiento registrado.
XT fue la plataforma más cara para mantener una posición larga en todas las monedas de la lista de financiación del 8 de noviembre. La financiación es el pago periódico entre posiciones largas y cortas en futuros perpetuos, y en XT las posiciones largas pagaron la tasa más alta en $AVAX , $ADA , $WIF y Litecoin.
$AVAX muestra la mayor diferencia: un 0,14 % cada 8 horas entre XT y la plataforma más barata. Le sigue $ADA con un 0,11 % y $WIF con un 0,1 %; Delta cobra menos a las posiciones largas en ambos casos. La diferencia de Litecoin es del 0,06 %, y Lighter es la plataforma más barata.
Si la diferencia de $AVAX se mantuviera sin cambios durante todo el año, equivaldría a una tasa anualizada del 140,25 % después de comisiones. Es una estimación basada en las tasas de un solo día, no en un rendimiento registrado.
$AVAX muestra la mayor diferencia: un 0,14 % cada 8 horas entre XT y la plataforma más barata. Le sigue $ADA con un 0,11 % y $WIF con un 0,1 %; Delta cobra menos a las posiciones largas en ambos casos. La diferencia de Litecoin es del 0,06 %, y Lighter es la plataforma más barata.
Si la diferencia de $AVAX se mantuviera sin cambios durante todo el año, equivaldría a una tasa anualizada del 140,25 % después de comisiones. Es una estimación basada en las tasas de un solo día, no en un rendimiento registrado.
Inicia sesión para explorar más contenidos
Únete a usuarios globales de criptomonedas en Binance Square
⚡️ Obtén información útil y actualizada sobre criptos.
💬 Avalado por el mayor exchange de criptomonedas en el mundo.
👍 Descubre perspectivas reales de creadores verificados.
Email/número de teléfono
Temas populares
BitcoinFiveWeeklyLosses
8 vistas
16 están debatiendo
Noticias de Bitcoin | Bitcoin cae durante cinco semanas consecutivas mientras la debacle de las acciones de IA se extiende a las criptomonedas
Binance News
·2 me gusta
·1.8k vistas
AIChipSlumpNasdaq
8 vistas
18 están debatiendo
BinanceReopensWithdrawalsForHYPE&APT
121,899 vistas
1,087 están debatiendo