
R3N 1
459 Publicaciones

R3N 1
Web3 & crypto Analyst || Breaking down market moves || token updates daily ➪NFA!!!
0 Siguiendo
2 Seguidores
2 Me gusta
Publicaciones
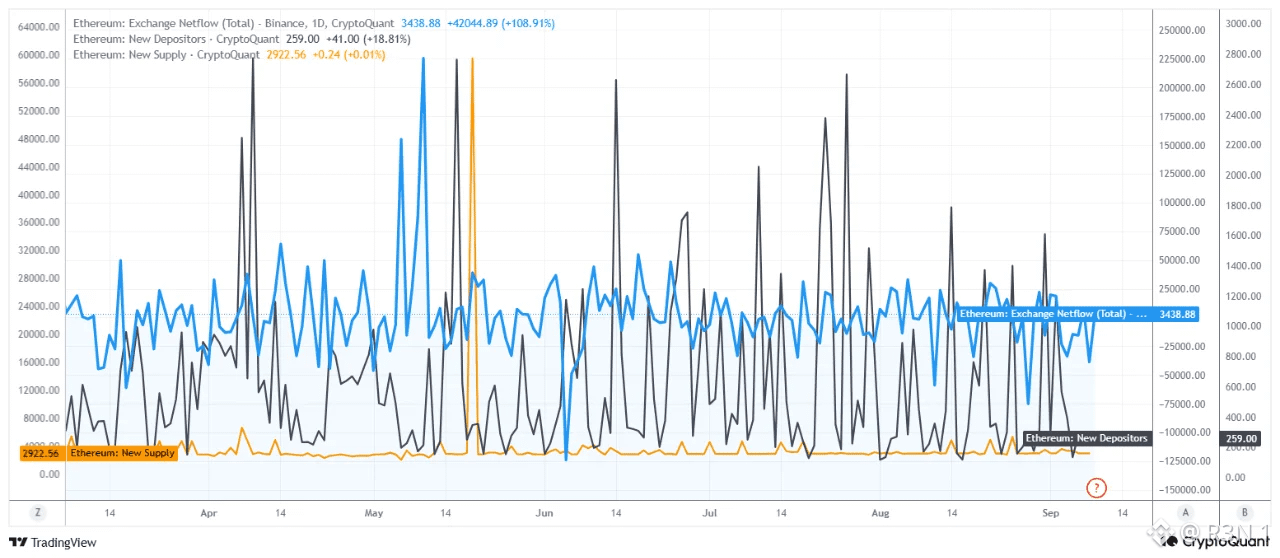
El netflow de Binance en Ethereum se sitúa en aproximadamente +3.439 ETH, con un aumento de más del 100% respecto al día anterior. Ese salto parece dramático en aislamiento, pero el nivel en sí no es grande, y el gráfico deja claro por qué el contexto importa aquí. Amplía la vista y la línea azul de netflow pasa la mayor parte del tiempo oscilando con fuerza alrededor de cero, con picos fuertes en ambas direcciones a lo largo de los últimos meses. No es un gráfico que describa un flujo estable y unidireccional; está describiendo un entorno volátil donde dominan las transferencias de corto plazo y la actividad de grandes actores. Un solo día positivo dentro de ese ruido no es una señal de venta fiable por sí sola; estas transferencias pueden relacionarse igual con staking, colateral, arbitraje o con movimientos internos entre carteras institucionales. Los nuevos depositantes están en 259, un aumento de aproximadamente 18,8% durante el día. Cabe destacar que este indicador ha mostrado históricamente picos realmente extremos en el mismo gráfico, y 259 ni siquiera se acerca a esos máximos: es un repunte moderado frente a movimientos históricos mucho mayores, no una ola amplia de nuevos participantes. La nueva oferta es esencialmente plana alrededor de 2.922 ETH. No es alcista por sí sola, pero descarta un riesgo: no hay una expansión estructural repentina de la oferta que esté añadiendo presión vendedora ahora mismo. Si el netflow de los exchanges eventualmente se vuelve negativo de forma sostenida mientras la oferta se mantiene plana, esa combinación empezaría a inclinarse en apoyo del precio. Mi lectura honesta: estos datos respaldan la cautela más que una convicción en cualquier dirección. $ETH podría enfrentar resistencia en intentos alcistas o bien operar en rango, con un movimiento lateral hacia abajo, dado el patrón volátil; pero como los nuevos depositantes siguen siendo bajos, tampoco hay nada aquí que apoye una tesis realmente bajista. ya sea que este pico de netflow se extienda a días consecutivos con un flujo positivo elevado, o se desvanezca de nuevo en la misma oscilación ruidosa que el gráfico ha mostrado durante todo el año. #BTC Price Analysis# #Meme Alpha#
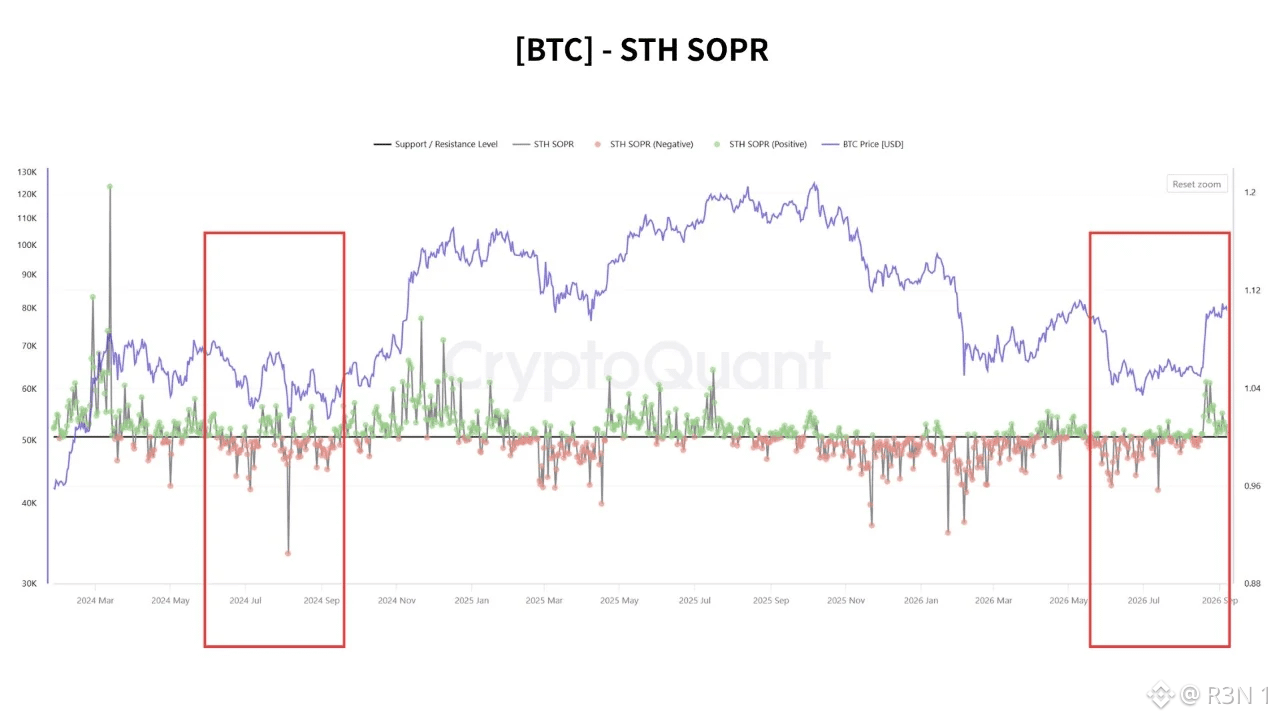
USD/JPY cayó de 160.17 a 152.89 en aproximadamente una semana, y ese movimiento por sí solo es suficiente para cambiar cuánto vale realmente el BTC para un tenedor japonés, antes de que el propio precio de Bitcoin haga algo. El mecanismo es sencillo. El valor del BTC en yenes equivale a su precio en dólares multiplicado por USD/JPY. Con 78,500 dólares, el movimiento de 160.17 hacia 153.81 recorta aproximadamente 500,000 yenes del valor del BTC en términos de yenes. Ese es un efecto real sobre la riqueza que afecta a los tenedores japoneses al margen de lo que ocurra en los gráficos denominados en dólares. Hay un segundo canal también: cualquiera que haya pedido yenes prestados a bajo costo para financiar posiciones en activos de riesgo ahora enfrenta costos de repago en aumento a medida que el yen se fortalece, lo cual históricamente empuja algunas de esas posiciones hacia la liquidación. La pregunta obvia es si esto es otra vez agosto de 2024, cuando un aumento similar del yen desencadenó un evento real de desapalancamiento global. Por ahora, los datos no respaldan esa comparación. En el corto plazo, el SOPR de los tenedores cayó por debajo de 1 durante esa venta de agosto de 2024, evidencia clara de pérdidas realizadas en todo el grupo. El gráfico aquí muestra algo distinto: lecturas recientes del STH SOPR ubicadas en torno a 1 o ligeramente por encima, no el pánico sostenido por debajo de 1 que marcó el desmonte previo del carry trade. Mi lectura honesta: esto parece un evento real de presión en términos de yenes, sin mostrar todavía la firma más amplia de desapalancamiento que confirmaría una repetición de 2024. El STH SOPR por sí solo no puede resolver esta pregunta de ninguna de las dos maneras, porque es un solo dato. Una caída sostenida por debajo de 1, combinada con el aumento de entradas en los exchanges y el descenso del interés abierto en futuros, sería lo que en realidad confirmaría que se está produciendo un desajuste más amplio. Lo que estoy observando: el acercamiento de USD/JPY hacia 150, la guía del BOJ junto con ello, y si el STH SOPR en realidad se quiebra o se mantiene cerca de los niveles actuales a medida que este movimiento del yen continúa. #BTC Price Analysis# #Altcoin Season# $BTC
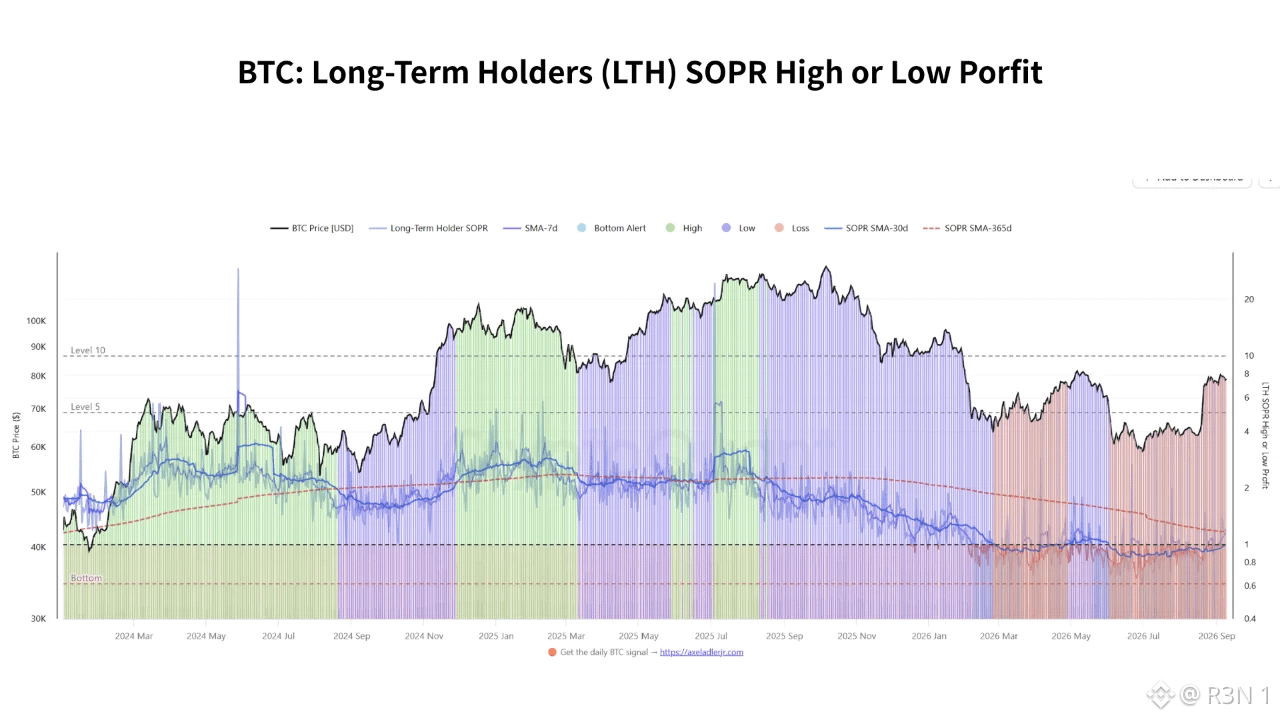
El SOPR de largo plazo acaba de volver a subir hasta 1.2, lo que significa que las monedas que se están moviendo en cadena vuelven a vender con beneficio, en lugar de con pérdida. Mira el gráfico y verás que esa recuperación se aprecia de inmediato: las barras rojas de pérdidas que dominaron a principios de 2026 han dado paso nuevamente a barras azules y verdes mientras el precio vuelve a acercarse a los 80,000 dólares. La ganancia y pérdida realizada neta también se ha vuelto positiva, y las direcciones de acumulación ahora rondan los 2.3 millones de BTC: señales realmente constructivas de que la presión vendedora está cediendo. Las posiciones cortas de los fondos de cobertura han disminuido, y los grandes depósitos en exchanges no se han disparado pese a que el precio se aproxima a los 80,000 dólares; exactamente lo que querrías ver en una recuperación saludable en lugar de una distribución aprovechando la fuerza. Aquí es donde, aun así, yo iría más despacio. El CVD spot a 90 días sigue siendo neutral, lo que significa que la mayor parte del trabajo en este rebote la han hecho los futuros, no las compras en spot. La prima de Coinbase es negativa, y los ratios de depósitos de ballenas siguen altos. Las reservas de stablecoins de Binance se recuperaron 1.6 mil millones de dólares durante el último mes, una señal real de liquidez, pero por sí sola no confirma que la demanda en spot haya aparecido realmente. Mi lectura honesta: estas señales en realidad no se contradicen de la forma en que podrían parecer a primera vista. La actividad de ballenas puede representar una gran parte de las entradas a exchanges sin que los depósitos totales se disparen, y una mejora de la rentabilidad no significa automáticamente que entren compradores nuevos. Lo que estos datos respaldan de verdad es que la presión vendedora se está relajando mientras que la nueva demanda spot aún no se ha confirmado. Lo que estoy vigilando: si <t-2/>BTC puede mantener una ruptura sostenida por encima de los 80,000 dólares respaldada por una demanda spot real y una liquidez mejorando; porque hasta que eso ocurra, esto sigue impulsado por el apalancamiento y es vulnerable al tipo de volatilidad que trae consigo. #BTC Price Analysis# #Macro Insights# #Meme Alpha#
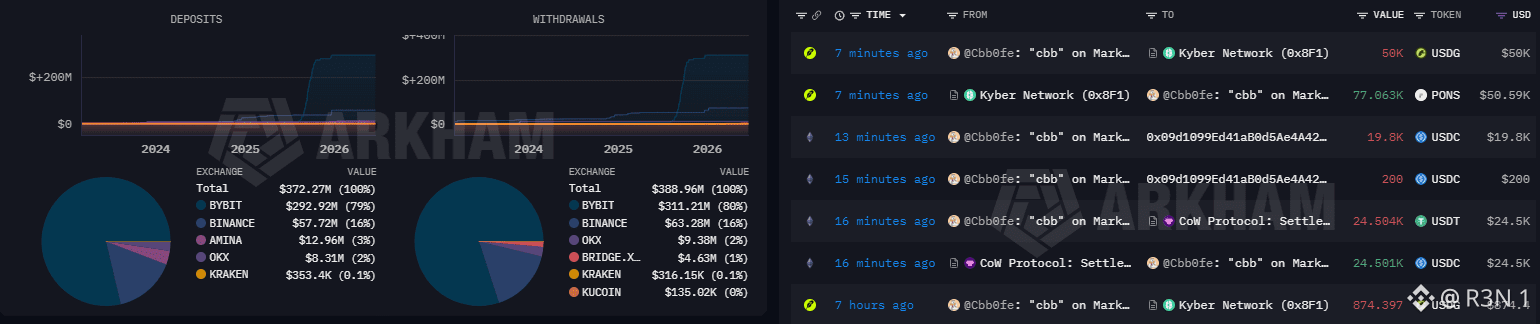
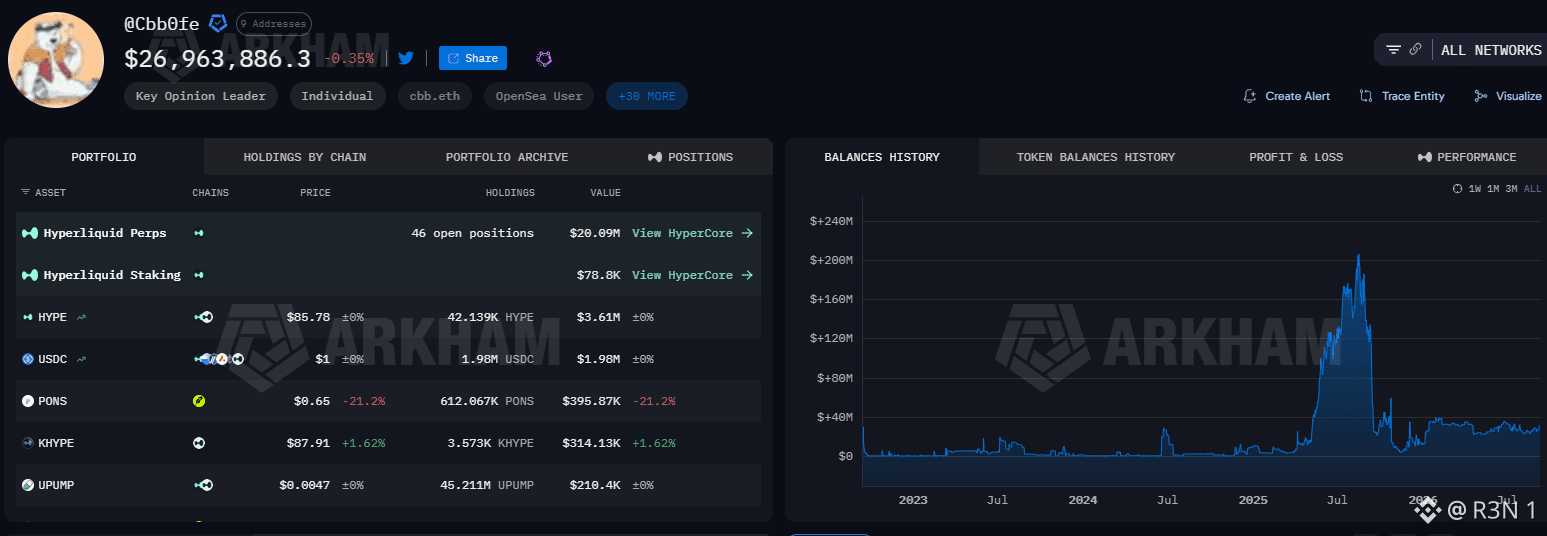
$50K en $PONS desde una wallet de KOL conocida, justo después de que el token subiera 18,9% y luego devolviera 12,9% de eso en un plazo de 24 horas. Ese timing es la historia real aquí, no solo la cantidad en dólares. Según datos on-chain, la wallet etiquetada "cbb" en Markets.xyz compró 77.063 tokens PONS usando USDG (stablecoin) a través de Kyber Network, después del pico inicial y durante la fase de retroceso, sin perseguir el máximo del movimiento. Comprar en una corrección en lugar del pump en sí suele interpretarse como una entrada más deliberada que el momentum chasing, aunque yo tendría cuidado al suponer demasiada intención solo por el timing de una única wallet. Vale la pena dejar claro qué es lo que esto realmente te dice y qué no. Esto es una sola wallet de KOL haciendo una compra; no es evidencia de una acumulación más amplia, y $50K, aunque lo bastante notable como para seguirse en cadena, no es un tamaño que por sí solo mueva los fundamentos de un token. Lo que puede hacer es influir en el sentimiento, especialmente si esta wallet tiene seguidores que tratan sus movimientos como señal. Ese es exactamente el mecanismo por el cual a veces las compras de KOL se vuelven auto-reforzadas, independientemente del razonamiento subyacente. Mi lectura honesta: vale la pena marcar esto como un dato, no como una confirmación de nada. Una entrada estratégica tras una caída es una observación razonable, pero PONS todavía acaba de experimentar volatilidad real en una ventana corta, y la compra de una sola wallet no te dice si esa volatilidad ya terminó o si solo se pausó. #PONS #Macro Insights# #Altcoin Season#
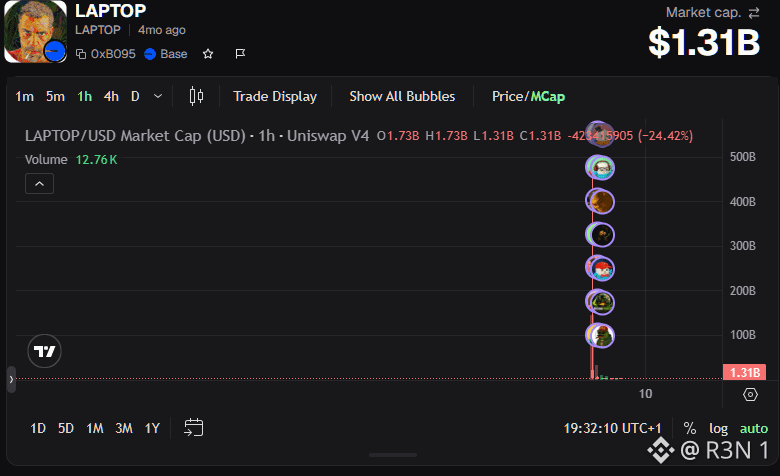
El $LAPTOP de Hunter Biden se lanzó en la Base y hizo lo que suelen hacer lanzamientos como este. Bubblemaps señaló que aproximadamente el 80% de los traders que tocaron el token terminaron perdiendo dinero. Más de 11.000 billeteras estaban en pérdidas por menos de $1.000 cada una. Unas 700 perdieron más de $1.000. 100 billeteras perdieron más de $10.000. Dos billeteras absorbieron impactos entre $100.000 y $1.000.000. Entonces, ¿quién estaba del otro lado? Los datos de Arkham muestran que el market maker GSR distribuyó tokens en bloques: 9 millones, 1,5 millones y luego 500.000, con cada transferencia precedida por un pequeño envío de prueba. Wintermute tiene alrededor de 1,8 millones de tokens en una billetera caliente. Una transferencia de 14,5 millones de tokens fue a una dirección no etiquetada unas dos horas antes de que comenzara la negociación, y nadie ha identificado quién lo recibió. Bubblemaps también indicó que muchas billeteras de grandes tenedores fueron financiadas recientemente con poca o nula actividad previa en la cadena, un patrón que normalmente apunta a un “sniping” coordinado más que a compradores orgánicos. También está el ángulo del airdrop. Parte del suministro fue a billeteras que perdieron dinero con $TRUMP, lo cual se lee ya sea como un arco de redención o como una lista específica de personas que ya han demostrado que comprarán una moneda “por las vibes”. Lookonchain rastreó dos de esas billeteras del airdrop que reclamaron aproximadamente 4.276 tokens cada una y vendieron casi inmediatamente por $404.000 y $243.000. Nada de esto prueba coordinación en un sentido legal. Las asignaciones previas al lanzamiento a market makers son una práctica estándar, y llegar temprano no es lo mismo que ser culpable. Pero cuando el 80% de los participantes pierde dinero y las billeteras del otro lado parecen recién creadas y preposicionadas antes incluso de que se abriera el token, la pregunta no es si esto iba a pasar. La pregunta es quién lo sabía. #Macro Insights# #BTC Price Analysis# #Altcoin Season#
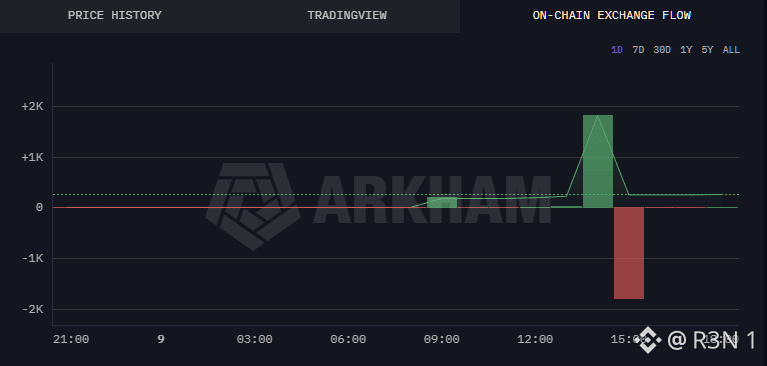
USDT en la cadena BNB es un USDT BEP-20. El USDT en TON es un activo on-chain separado emitido en The Open Network. Moverse entre ellos requiere una ejecución entre cadenas: una transferencia estándar de la wallet no puede salvar la brecha entre dos blockchains separadas.
Así es como hacerlo en STONfi
Paso uno. Abre https://app.ston.fi y conecta tu wallet TON mediante TON Connect. Ten lista tu wallet EVM con USDT BEP-20 y BNB para el gas.
Paso dos. Cambia al modo entre cadenas. Selecciona BNB Chain como red de origen y TON como red de destino.
Paso tres. Selecciona USDT en BNB Chain como activo de origen y USDT en TON como activo de destino. Introduce tu cantidad.
Paso cuatro. Revisa la cotización. Verifica la cantidad de USDT de destino, las comisiones, ambas etiquetas de red y la dirección de tu wallet TON de destino. Las tarifas de gas en BNB Chain son significativamente más bajas que en Ethereum; esta ruta es más económica que la ruta de Ethereum para cantidades equivalentes.
Paso cinco. Confirma y firma usando tu wallet EVM del lado de BNB Chain. Omniston coordina la ejecución. El USDT llega a TON según la cotización o tu USDT original de BNB Chain regresa automáticamente a través del timelock.
Una vez recibido el USDT en TON, queda disponible de inmediato para la liquidez agregada de TON de Omniston: puedes intercambiarlo por cualquier activo TON, proporcionar liquidez o hacer farming directamente desde la interfaz de STONfi sin pasos adicionales.
El límite de transacciones actual es de $1,000 por intercambio.
Prueba el intercambio →https://app.ston.fi/swap?mode=cross-chain
#BTC Price Analysis# $ZEC #Temporada de Altcoins# $PI
Así es como hacerlo en STONfi
Paso uno. Abre https://app.ston.fi y conecta tu wallet TON mediante TON Connect. Ten lista tu wallet EVM con USDT BEP-20 y BNB para el gas.
Paso dos. Cambia al modo entre cadenas. Selecciona BNB Chain como red de origen y TON como red de destino.
Paso tres. Selecciona USDT en BNB Chain como activo de origen y USDT en TON como activo de destino. Introduce tu cantidad.
Paso cuatro. Revisa la cotización. Verifica la cantidad de USDT de destino, las comisiones, ambas etiquetas de red y la dirección de tu wallet TON de destino. Las tarifas de gas en BNB Chain son significativamente más bajas que en Ethereum; esta ruta es más económica que la ruta de Ethereum para cantidades equivalentes.
Paso cinco. Confirma y firma usando tu wallet EVM del lado de BNB Chain. Omniston coordina la ejecución. El USDT llega a TON según la cotización o tu USDT original de BNB Chain regresa automáticamente a través del timelock.
Una vez recibido el USDT en TON, queda disponible de inmediato para la liquidez agregada de TON de Omniston: puedes intercambiarlo por cualquier activo TON, proporcionar liquidez o hacer farming directamente desde la interfaz de STONfi sin pasos adicionales.
El límite de transacciones actual es de $1,000 por intercambio.
Prueba el intercambio →https://app.ston.fi/swap?mode=cross-chain
#BTC Price Analysis# $ZEC #Temporada de Altcoins# $PI
Block acaba de presentar la solicitud para convertirse en banco. No es una metáfora: es una solicitud real ante la OCC para una carta constitutiva de fideicomiso nacional, Builders Bank & Trust, N.A.
Si se aprueba, Block podría ofrecer directamente servicios de custodia y fiduciarios, incluidos para bitcoin y stablecoins, bajo un marco federal en lugar del mosaico de licencias estatales y acuerdos con bancos asociados del que dependen la mayoría de las fintech. Lee Woolley, quien dirigiría la nueva entidad, lo planteó como una ampliación de Square Financial Services y de la experiencia de Block en activos digitales, más que un giro: formalizar la infraestructura que ya operan en las proximidades.
El patrón importa más que esta presentación en particular. Revolut obtuvo la aprobación condicional la semana pasada. Coinbase, Paxos, BitGo, Ripple y Circle siguieron exactamente este mismo proceso. La OCC ha tramitado 40 solicitudes de nuevas cartas (de novo) desde 2025, aprobando 21 y rechazando dos: una tasa alta que señala que un regulador está activamente receptivo en este momento, no un escenario contra el que las empresas estén luchando.
Mi lectura honesta: la infraestructura cripto y fintech se está consolidando hacia una legitimidad federal a un ritmo que hace un par de años habría parecido improbable. Una carta federal de fideicomiso no solo reduce la fricción de cumplimiento: es una señal de credibilidad que cambia la forma en que los contrapartes institucionales valoran a una empresa. Vale la pena destacarlo, no como crítica a Block, que la OCC también concedió una aprobación condicional a la solicitud de banco nacional fiduciario vinculada a Trump, World Liberty Financial, recientemente, en medio de un escrutinio real sobre conflictos de interés. Es un recordatorio de que este entorno de aprobaciones no está ocurriendo en un vacío político.
Lo que estoy vigilando: si Builders Bank obtiene la aprobación y si esta carrera de cartas cambia dónde se posiciona la custodia a gran escala de bitcoin y stablecoins—alejándola de custodios nativos de cripto y llevándola hacia bancos fintech con carta federal.
#BTC Price Analysis# $SUI #Macro Insights#
Si se aprueba, Block podría ofrecer directamente servicios de custodia y fiduciarios, incluidos para bitcoin y stablecoins, bajo un marco federal en lugar del mosaico de licencias estatales y acuerdos con bancos asociados del que dependen la mayoría de las fintech. Lee Woolley, quien dirigiría la nueva entidad, lo planteó como una ampliación de Square Financial Services y de la experiencia de Block en activos digitales, más que un giro: formalizar la infraestructura que ya operan en las proximidades.
El patrón importa más que esta presentación en particular. Revolut obtuvo la aprobación condicional la semana pasada. Coinbase, Paxos, BitGo, Ripple y Circle siguieron exactamente este mismo proceso. La OCC ha tramitado 40 solicitudes de nuevas cartas (de novo) desde 2025, aprobando 21 y rechazando dos: una tasa alta que señala que un regulador está activamente receptivo en este momento, no un escenario contra el que las empresas estén luchando.
Mi lectura honesta: la infraestructura cripto y fintech se está consolidando hacia una legitimidad federal a un ritmo que hace un par de años habría parecido improbable. Una carta federal de fideicomiso no solo reduce la fricción de cumplimiento: es una señal de credibilidad que cambia la forma en que los contrapartes institucionales valoran a una empresa. Vale la pena destacarlo, no como crítica a Block, que la OCC también concedió una aprobación condicional a la solicitud de banco nacional fiduciario vinculada a Trump, World Liberty Financial, recientemente, en medio de un escrutinio real sobre conflictos de interés. Es un recordatorio de que este entorno de aprobaciones no está ocurriendo en un vacío político.
Lo que estoy vigilando: si Builders Bank obtiene la aprobación y si esta carrera de cartas cambia dónde se posiciona la custodia a gran escala de bitcoin y stablecoins—alejándola de custodios nativos de cripto y llevándola hacia bancos fintech con carta federal.
#BTC Price Analysis# $SUI #Macro Insights#

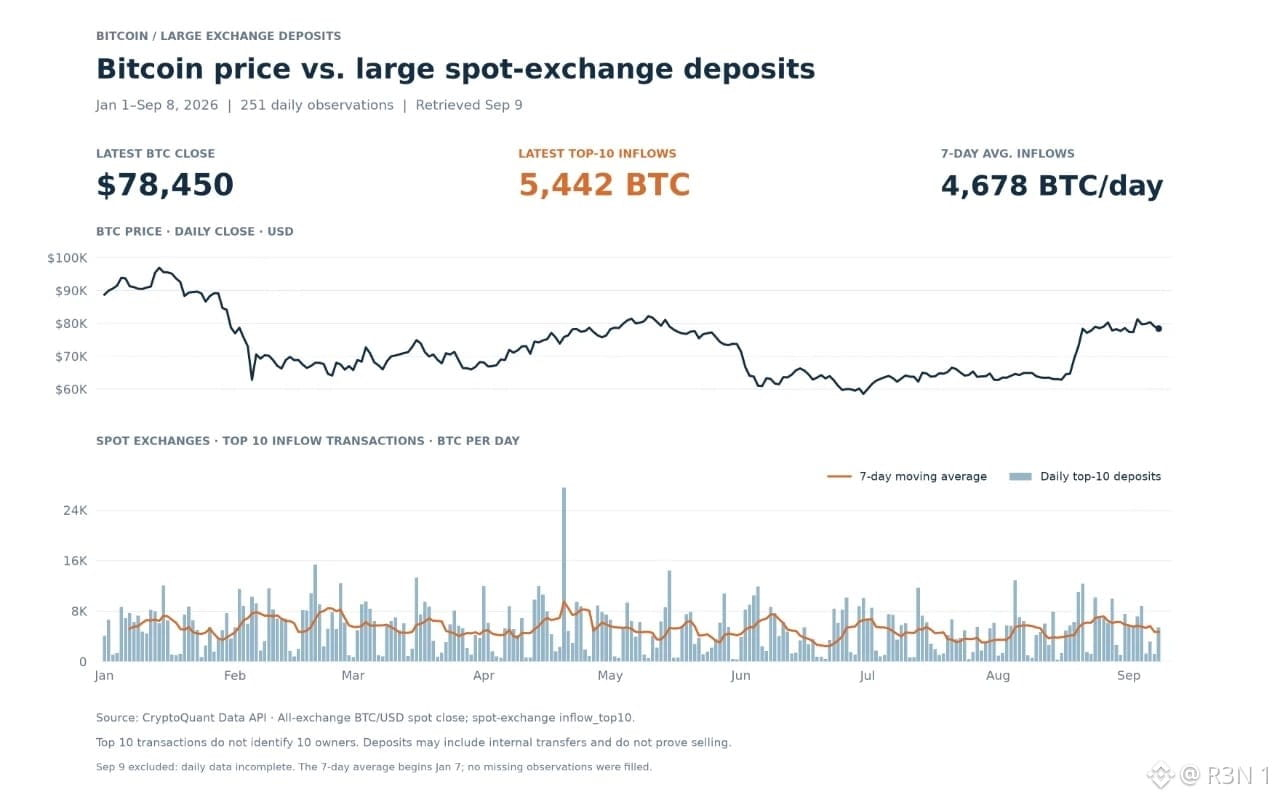
El Bitcoin cerró en 78.450 dólares el 8 de septiembre, muy alejado de la zona de 60.000 en la que estaba a principios de este verano. La pregunta obvia con cualquier recuperación de este tamaño es si los grandes tenedores están utilizando en silencio la fortaleza para vender en los exchanges. Por ahora, los datos no respaldan realmente esa historia.
Las 10 principales entradas a exchanges spot alcanzaron 5.442 BTC el 8 de septiembre, una cifra que en la superficie parece dramática: 4,4 veces el nivel del día anterior. Pero aquí el contexto importa más que el múltiplo día a día. Esa misma cifra estaba solo un 5,1% por encima del promedio de 30 días anterior, y el promedio de siete días se sitúa en 4.678 BTC, aún por debajo de varios picos registrados más temprano en el año. Un salto diario de 4,4x suena alarmante hasta que te das cuenta de que el día anterior simplemente estuvo inusualmente tranquilo, no de que este fuera inusualmente ruidoso.
Mi lectura honesta: esto parece actividad de depósitos de gran escala revirtiendo hacia su rango normal reciente, más que cualquier señal de distribución. Si los grandes tenedores estuvieran usando esta subida para descargar de forma significativa, esperarías entradas empujando claramente por encima de la tendencia, no solo volviendo a alinearse con el promedio de 30 días. Esa es una diferencia real, no una cuestión técnica.
Dónde sí me gustaría marcar límites para no ponerse demasiado cómodo con esto: que un día de datos revierta hacia la media no descarta que la presión vendedora se esté acumulando gradualmente. La prueba real no es una sola impresión elevada; es si el promedio de entradas de siete días empieza a subir de manera persistente, especialmente si ese aumento ocurre junto con debilidad en el precio en lugar de con fortaleza. Esa combinación sería la verdadera señal de alerta; un rebote de vuelta hacia las normas recientes no lo es.
Si el promedio de entradas de siete días se mantiene cerca de los niveles actuales o empieza a mostrar una tendencia alcista durante la próxima semana o dos, y si cualquier subida de ese promedio coincide con el precio manteniéndose o, por el contrario, rompiéndose a la baja.
#Análisis del precio de Bitcoin# $BTC #Meme Alpha# #Perspectivas macro#
Las 10 principales entradas a exchanges spot alcanzaron 5.442 BTC el 8 de septiembre, una cifra que en la superficie parece dramática: 4,4 veces el nivel del día anterior. Pero aquí el contexto importa más que el múltiplo día a día. Esa misma cifra estaba solo un 5,1% por encima del promedio de 30 días anterior, y el promedio de siete días se sitúa en 4.678 BTC, aún por debajo de varios picos registrados más temprano en el año. Un salto diario de 4,4x suena alarmante hasta que te das cuenta de que el día anterior simplemente estuvo inusualmente tranquilo, no de que este fuera inusualmente ruidoso.
Mi lectura honesta: esto parece actividad de depósitos de gran escala revirtiendo hacia su rango normal reciente, más que cualquier señal de distribución. Si los grandes tenedores estuvieran usando esta subida para descargar de forma significativa, esperarías entradas empujando claramente por encima de la tendencia, no solo volviendo a alinearse con el promedio de 30 días. Esa es una diferencia real, no una cuestión técnica.
Dónde sí me gustaría marcar límites para no ponerse demasiado cómodo con esto: que un día de datos revierta hacia la media no descarta que la presión vendedora se esté acumulando gradualmente. La prueba real no es una sola impresión elevada; es si el promedio de entradas de siete días empieza a subir de manera persistente, especialmente si ese aumento ocurre junto con debilidad en el precio en lugar de con fortaleza. Esa combinación sería la verdadera señal de alerta; un rebote de vuelta hacia las normas recientes no lo es.
Si el promedio de entradas de siete días se mantiene cerca de los niveles actuales o empieza a mostrar una tendencia alcista durante la próxima semana o dos, y si cualquier subida de ese promedio coincide con el precio manteniéndose o, por el contrario, rompiéndose a la baja.
#Análisis del precio de Bitcoin# $BTC #Meme Alpha# #Perspectivas macro#
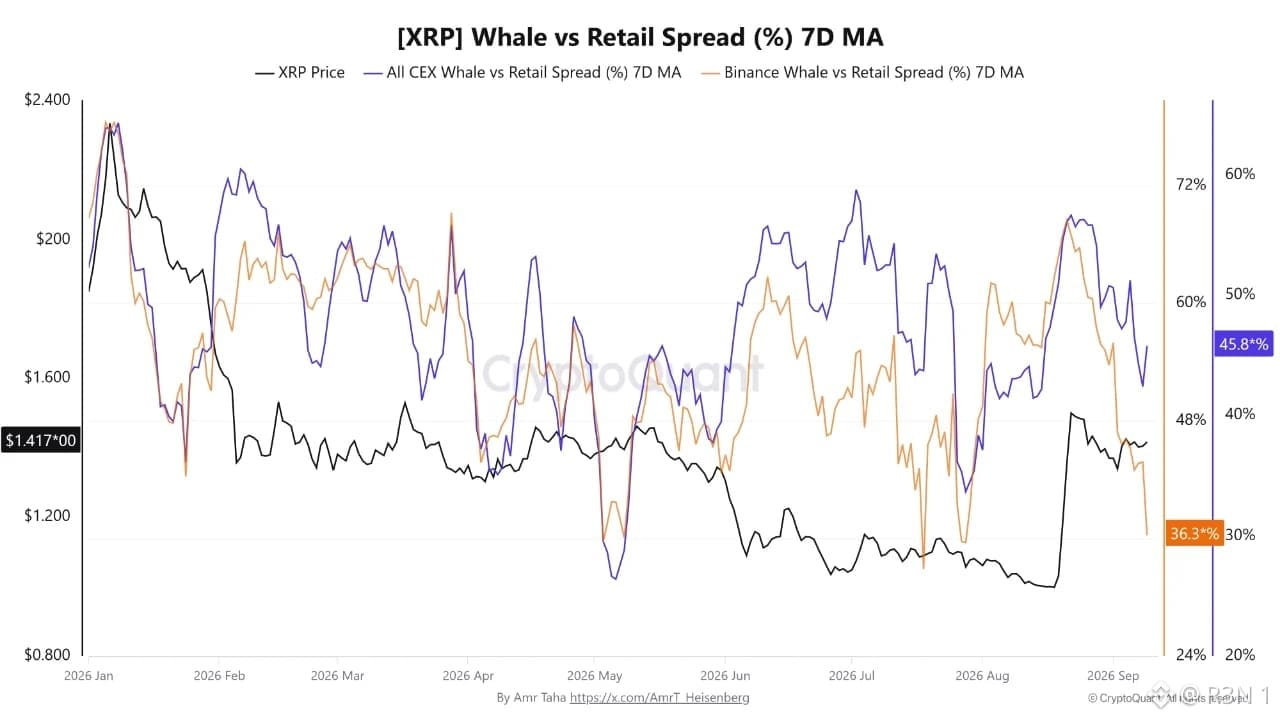
$XRP sube aproximadamente un 35% desde el 28 de julio, cotizando cerca de $1.41 al 9 de septiembre. La brecha entre ballenas y minoristas de Binance apenas se movió: solo subió 0.7 puntos hasta 36.3%. En todas partes de los CEX, ese mismo indicador saltó 12.8 puntos, un aumento relativo del 39%. Mismo activo, misma ventana de seis semanas, dos historias muy diferentes según el centro de negociación.
La relación entre estas dos lecturas se invirtió. El 28 de julio, Binance estaba 2.6 puntos por encima de la lectura de Todos los CEX. Para el 9 de septiembre, Todos los CEX está 9.5 puntos por encima de Binance, en su lugar, un cambio de 12.1 puntos en poco más de seis semanas. Cualquier cambio estructural que ocurrió en el comportamiento de salidas de ballenas versus minoristas ocurrió casi por completo fuera de Binance.
Vale la pena ser preciso sobre qué mide este indicador. La brecha ballena versus minorista compara el peso relativo de las salidas de gran tamaño versus las de tamaño minorista; no te dice si las ballenas están comprando, vendiendo o simplemente moviendo monedas para custodia. Una brecha más amplia significa que las transferencias más grandes forman una mayor parte de la mezcla de salidas, nada más específico que eso.
Mi lectura honesta: que el precio repunte 35% mientras la estructura propia de ballenas minoristas de Binance se mantiene casi plana es realmente interesante; este movimiento probablemente no fue un evento impulsado principalmente por ballenas de Binance, al menos no según esta métrica. La acción se concentró en otros lugares del panorama de exchanges en general.
Dónde me gustaría marcar el freno ante una sobreinterpretación de esto: una métrica de brecha describe la composición, no la intención, y sin saber si ese cambio más amplio refleja acumulación, distribución o solo cambios en los patrones de transferencia, esta divergencia real merece ser señalada en lugar de tomarse como una señal direccional para operar.
si la brecha de Binance empieza a converger de nuevo hacia la lectura de Todos los CEX, o si esta brecha se convierte en una característica persistente de cómo se negocia XRP desde aquí, eso será lo que vigile
#Análisis de Precio de BTC# #Temporada de Altcoins# #Meme Alpha#
La relación entre estas dos lecturas se invirtió. El 28 de julio, Binance estaba 2.6 puntos por encima de la lectura de Todos los CEX. Para el 9 de septiembre, Todos los CEX está 9.5 puntos por encima de Binance, en su lugar, un cambio de 12.1 puntos en poco más de seis semanas. Cualquier cambio estructural que ocurrió en el comportamiento de salidas de ballenas versus minoristas ocurrió casi por completo fuera de Binance.
Vale la pena ser preciso sobre qué mide este indicador. La brecha ballena versus minorista compara el peso relativo de las salidas de gran tamaño versus las de tamaño minorista; no te dice si las ballenas están comprando, vendiendo o simplemente moviendo monedas para custodia. Una brecha más amplia significa que las transferencias más grandes forman una mayor parte de la mezcla de salidas, nada más específico que eso.
Mi lectura honesta: que el precio repunte 35% mientras la estructura propia de ballenas minoristas de Binance se mantiene casi plana es realmente interesante; este movimiento probablemente no fue un evento impulsado principalmente por ballenas de Binance, al menos no según esta métrica. La acción se concentró en otros lugares del panorama de exchanges en general.
Dónde me gustaría marcar el freno ante una sobreinterpretación de esto: una métrica de brecha describe la composición, no la intención, y sin saber si ese cambio más amplio refleja acumulación, distribución o solo cambios en los patrones de transferencia, esta divergencia real merece ser señalada en lugar de tomarse como una señal direccional para operar.
si la brecha de Binance empieza a converger de nuevo hacia la lectura de Todos los CEX, o si esta brecha se convierte en una característica persistente de cómo se negocia XRP desde aquí, eso será lo que vigile
#Análisis de Precio de BTC# #Temporada de Altcoins# #Meme Alpha#
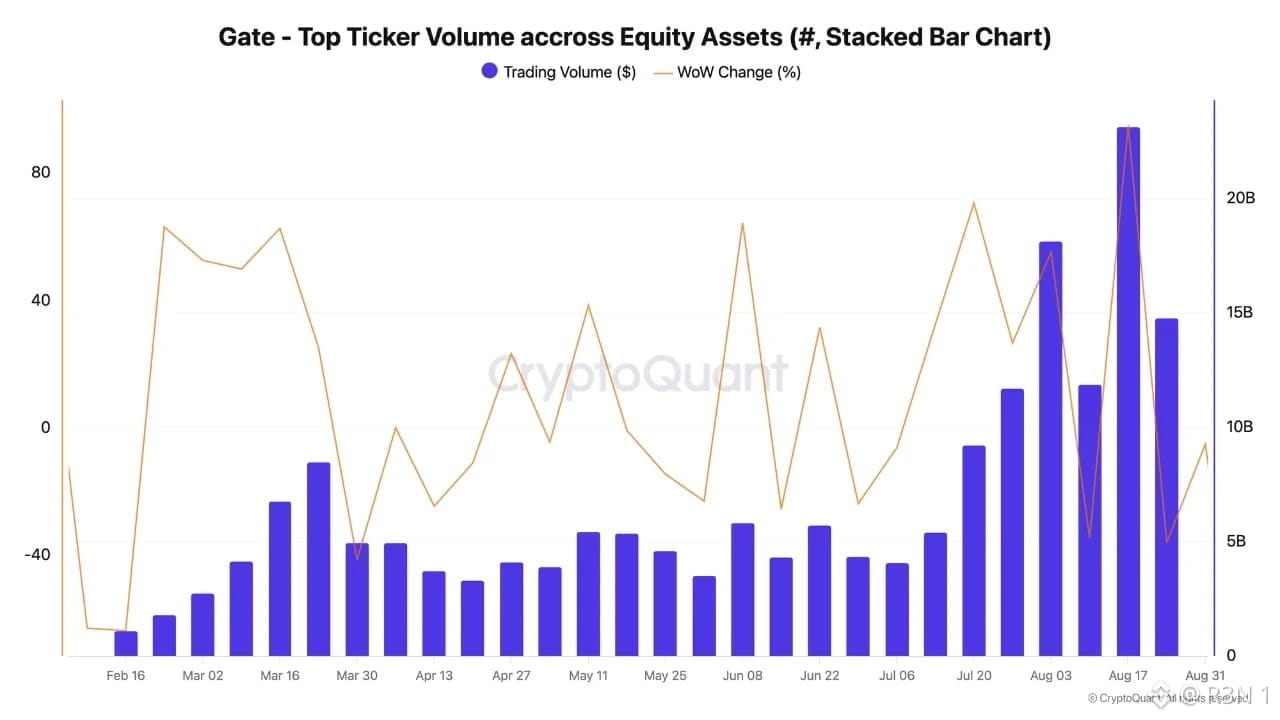
Desde finales de julio, los principales tickers TradFi de Gate, nombres como NVDAX, SPCX y SK Hynix, han publicado más de $10B en volumen semanal cada una de las semanas. Una semana superó los $20B, un récord para esta categoría de activos en la plataforma, y un salto del 94% semana a semana. Ese tipo de aceleración suele significar que algo cambió en la demanda dentro de la categoría, no solo en un activo.
Los números individuales lo aterrizan. SNDK, tokenizado de SanDisk, registró por su cuenta un solo día por encima de $3.6B. SPCX y SK Hynix también tuvieron días en los que superaron los $500M. Vale la pena destacar el desempeño que respalda esto: según se informa, SK Hynix está cerca de un +500% en 2026, y SanDisk supera el +1000%. El acceso tokenizado que atrae volumen cuando los nombres subyacentes se mueven así encaja de manera lógica; no es una especulación pura desconectada de los fundamentos.
Personalmente, creo que la lectura más interesante aquí no es ningún ticker en particular, sino que esto representa una demanda real de cruce: la exposición tradicional a acciones a la que se accede mediante carriles cripto a una escala significativa, no solo traders nativos de cripto rotando entre monedas. Ese es un tipo de flujo distinto al que normalmente impulsa el volumen on-chain.
Donde me gustaría marcar un límite al optimismo sobre la tendencia en sí: una sola semana récord después de dos actuaciones excepcionales de las acciones subyacentes podría fácilmente estar impulsada por un evento más que por un cambio estructural. El volumen explosivo vinculado a movimientos de precio explosivos en los activos de referencia no necesariamente persiste cuando esos movimientos se enfrían.
Lo que estoy vigilando: si este piso semanal de +$10B se mantiene cuando inevitablemente se desacelere el impulso de SK Hynix y SanDisk, o si fueron esos dos nombres los que cargaron con toda la categoría.
#BTC Price Analysis# $XRP #Meme Alpha#
Los números individuales lo aterrizan. SNDK, tokenizado de SanDisk, registró por su cuenta un solo día por encima de $3.6B. SPCX y SK Hynix también tuvieron días en los que superaron los $500M. Vale la pena destacar el desempeño que respalda esto: según se informa, SK Hynix está cerca de un +500% en 2026, y SanDisk supera el +1000%. El acceso tokenizado que atrae volumen cuando los nombres subyacentes se mueven así encaja de manera lógica; no es una especulación pura desconectada de los fundamentos.
Personalmente, creo que la lectura más interesante aquí no es ningún ticker en particular, sino que esto representa una demanda real de cruce: la exposición tradicional a acciones a la que se accede mediante carriles cripto a una escala significativa, no solo traders nativos de cripto rotando entre monedas. Ese es un tipo de flujo distinto al que normalmente impulsa el volumen on-chain.
Donde me gustaría marcar un límite al optimismo sobre la tendencia en sí: una sola semana récord después de dos actuaciones excepcionales de las acciones subyacentes podría fácilmente estar impulsada por un evento más que por un cambio estructural. El volumen explosivo vinculado a movimientos de precio explosivos en los activos de referencia no necesariamente persiste cuando esos movimientos se enfrían.
Lo que estoy vigilando: si este piso semanal de +$10B se mantiene cuando inevitablemente se desacelere el impulso de SK Hynix y SanDisk, o si fueron esos dos nombres los que cargaron con toda la categoría.
#BTC Price Analysis# $XRP #Meme Alpha#
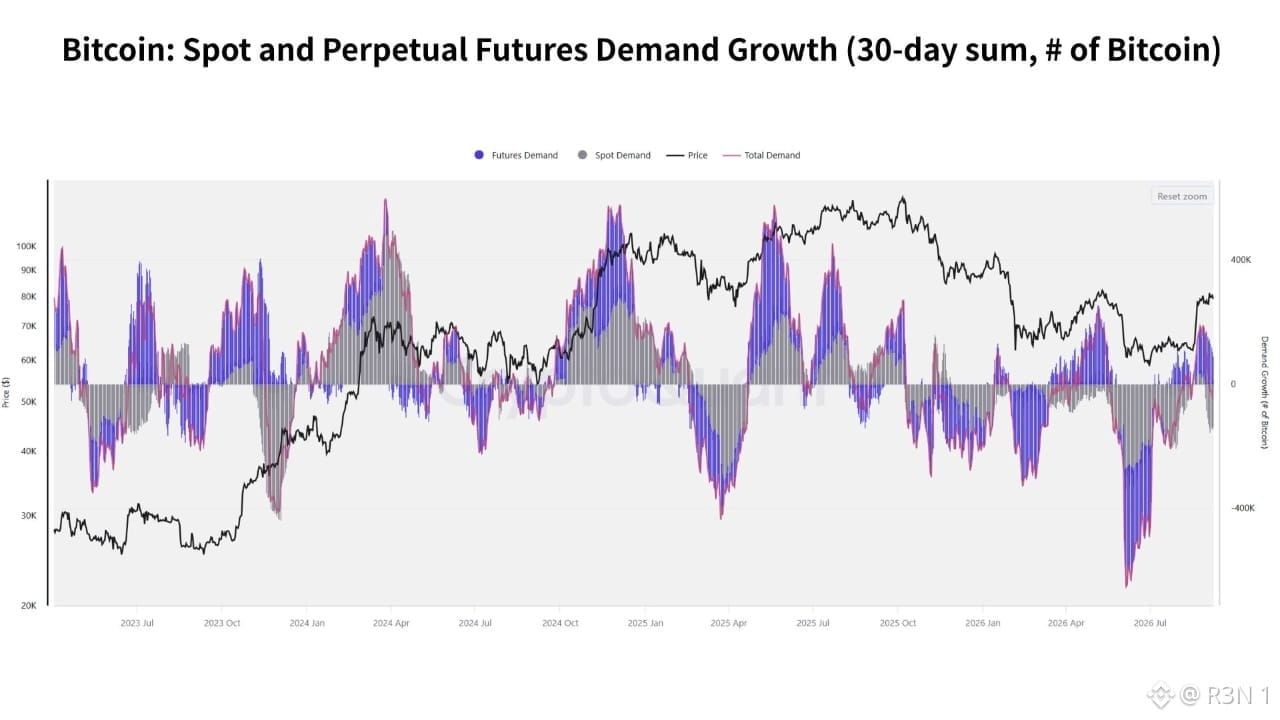
Tres semanas seguidas de entradas netas de ETF y la Demanda Aparente de BTC sigue siendo negativa. Esos dos hechos colocados uno al lado del otro son toda la historia ahora mismo.
Las instituciones han estado comprando a través de las correcciones; esa parte es constructiva. Pero el seguimiento de la demanda aparente en negativo significa que el mercado spot en general, la presión compradora fuera de los envoltorios de los ETF, no ha seguido el ritmo. Los flujos de ETF son una acumulación real, pero son un canal estrecho; no son una prueba de que la demanda spot total haya cambiado realmente.
El lado de la oferta tampoco ayuda. Aproximadamente 2.487 BTC, con un valor cercano a $197M, supuestamente se movieron desde carteras de ballenas a exchanges, y las reservas de Binance se mantienen elevadas alrededor de 685.000 a 687.000 BTC: más posible oferta del lado vendedor mientras la demanda spot aún se recupera. Los derivados también añaden riesgo. La ratio de compra/venta de Binance cerca de 0,917 se inclina hacia la presión vendedora, y el interés abierto sigue alto, alrededor de $8,5B. Una demanda spot débil junto con un apalancamiento elevado históricamente produce cascadas de liquidaciones bruscas, en lugar de tendencias limpias.
Aun así, las señales estructurales están mejorando de manera genuina, y eso no debería perderse en el encuadre del riesgo. Se ha formado un Golden Cross, el precio se mantiene por encima de la EMA de 50 semanas y el MVRV Z-Score se acerca a su promedio de 365 días; ninguno de estos son desarrollos bajistas.
Mi lectura honesta: esto parece un mercado con una estructura que mejora, pero que aún no ha sido confirmada por el lado de la demanda. La estructura puede marcar el precio, pero necesita que la demanda spot realmente se materialice; si no, un apalancamiento elevado contra una demanda débil se convierte en el escenario para un “flush” en lugar de una ruptura.
Si #BTC recupera la zona de $80.000 a $81.000 con un máximo más alto, y si la demanda aparente realmente se torna positiva junto con eso, ya que esa combinación es la confirmación real aquí.
$BTC #BTC Price Analysis# #Meme Alpha#
Las instituciones han estado comprando a través de las correcciones; esa parte es constructiva. Pero el seguimiento de la demanda aparente en negativo significa que el mercado spot en general, la presión compradora fuera de los envoltorios de los ETF, no ha seguido el ritmo. Los flujos de ETF son una acumulación real, pero son un canal estrecho; no son una prueba de que la demanda spot total haya cambiado realmente.
El lado de la oferta tampoco ayuda. Aproximadamente 2.487 BTC, con un valor cercano a $197M, supuestamente se movieron desde carteras de ballenas a exchanges, y las reservas de Binance se mantienen elevadas alrededor de 685.000 a 687.000 BTC: más posible oferta del lado vendedor mientras la demanda spot aún se recupera. Los derivados también añaden riesgo. La ratio de compra/venta de Binance cerca de 0,917 se inclina hacia la presión vendedora, y el interés abierto sigue alto, alrededor de $8,5B. Una demanda spot débil junto con un apalancamiento elevado históricamente produce cascadas de liquidaciones bruscas, en lugar de tendencias limpias.
Aun así, las señales estructurales están mejorando de manera genuina, y eso no debería perderse en el encuadre del riesgo. Se ha formado un Golden Cross, el precio se mantiene por encima de la EMA de 50 semanas y el MVRV Z-Score se acerca a su promedio de 365 días; ninguno de estos son desarrollos bajistas.
Mi lectura honesta: esto parece un mercado con una estructura que mejora, pero que aún no ha sido confirmada por el lado de la demanda. La estructura puede marcar el precio, pero necesita que la demanda spot realmente se materialice; si no, un apalancamiento elevado contra una demanda débil se convierte en el escenario para un “flush” en lugar de una ruptura.
Si #BTC recupera la zona de $80.000 a $81.000 con un máximo más alto, y si la demanda aparente realmente se torna positiva junto con eso, ya que esa combinación es la confirmación real aquí.
$BTC #BTC Price Analysis# #Meme Alpha#
Hunter Biden planea lanzar LAPTOP en Base el 9 de septiembre, un token de suministro de 1.000 millones con nombre inspirado en la controversia del portátil que lo persiguió durante años. Según el informe de WSJ, el 20% del suministro se destina a dos rondas de airdrop, con elegibilidad ampliada a billeteras que perdieron dinero al mantener TRUMP, además de los suscriptores de Substack de Biden y una lista de correo separada. El equipo fundador controla el 30%, con un bloqueo de seis meses y un desbloqueo de dos años. La parte inusual es el mecanismo de quema: hasta el 30% del suministro puede destruirse si se cumplen los disparadores, incluido un nuevo máximo histórico de BTC, la valoración de LAPTOP superando la de TRUMP o que gane un demócrata en 2028.
TRUMP lanzó cerca de la toma de posesión de enero de 2025 de Trump, se disparó hasta una capitalización de mercado cercana a $15B y luego se desplomó aproximadamente un 97% hasta alrededor de $600M a principios de septiembre. Los datos de Nansen citados por múltiples medios indican que casi 989.000 billeteras tenían en conjunto $3,81B en pérdidas realizadas y no realizadas. Ese es exactamente el grupo al que apunta LAPTOP con su airdrop, gente que ya fue quemada una vez con un memecoin político.
Mi lectura honesta: la mecánica es genuinamente ingeniosa desde el punto de vista de la atención pura, al vincular las quemas de tokens con resultados políticos garantiza participación continua independientemente de la acción del precio. Si eso se traduce en valor real es otra cosa. Los tokens airdropeados a titulares que están bajo el agua normalmente se venden rápido, y una moneda construida enteramente sobre troleo político lleva el mismo riesgo de desvanecimiento que golpeó a TRUMP.
Estaré atento a si LAPTOP mantiene algún valor más allá del volcado inicial del airdrop y a si este patrón, figuras políticas emitiendo memecoins como comentario directo, se convierte en un manual repetible en lugar de una sola ocasión.
#Análisis del precio de BTC# $TRUMP $BTC
TRUMP lanzó cerca de la toma de posesión de enero de 2025 de Trump, se disparó hasta una capitalización de mercado cercana a $15B y luego se desplomó aproximadamente un 97% hasta alrededor de $600M a principios de septiembre. Los datos de Nansen citados por múltiples medios indican que casi 989.000 billeteras tenían en conjunto $3,81B en pérdidas realizadas y no realizadas. Ese es exactamente el grupo al que apunta LAPTOP con su airdrop, gente que ya fue quemada una vez con un memecoin político.
Mi lectura honesta: la mecánica es genuinamente ingeniosa desde el punto de vista de la atención pura, al vincular las quemas de tokens con resultados políticos garantiza participación continua independientemente de la acción del precio. Si eso se traduce en valor real es otra cosa. Los tokens airdropeados a titulares que están bajo el agua normalmente se venden rápido, y una moneda construida enteramente sobre troleo político lleva el mismo riesgo de desvanecimiento que golpeó a TRUMP.
Estaré atento a si LAPTOP mantiene algún valor más allá del volcado inicial del airdrop y a si este patrón, figuras políticas emitiendo memecoins como comentario directo, se convierte en un manual repetible en lugar de una sola ocasión.
#Análisis del precio de BTC# $TRUMP $BTC


La mayoría de los relatos sobre privacidad en cripto siguen siendo teóricos. El de Arcium no lo es. Está en marcha. @Arcium es una red de computación confidencial construida de forma nativa sobre Solana, que usa computación multipartita para permitir que los desarrolladores ejecuten cómputos sobre datos cifrados sin exponerlos: ni a la red, ni a los operadores de nodos, ni siquiera a Arcium. El planteamiento es un superordenador cifrado, y ya está en mainnet alpha en lugar de ser una promesa de whitepaper. Lo que realmente se ha construido abarca DeFi confidencial (dark pools y subastas de pujas selladas con un flujo de órdenes completamente oculto), transferencias confidenciales a través de C-SPL, un estándar de token SPL confidencial y aplicaciones confidenciales para equipos que construyen sobre Solana. Varios proyectos del ecosistema ya figuran ejecutándose en producción con cómputo a través de ella. El token, $ARX , ya está en vivo en vez de ser un catalizador futuro. Cubre las comisiones de red, el staking para asegurar nodos MPC, la programación de trabajos ponderada por stake y la gobernanza en cadena con votación ponderada por lockup. Lo que viene en lugar de lo ya entregado: Blackthorn, su producto de IA confidencial, ejecutándose con inferencia y entrenamiento sobre datos que se mantienen cifrados de extremo a extremo. Marcado como próximamente, vale la pena destacarlo porque es la mitad más ambiciosa de la hoja de ruta y aún no está en vivo. El respaldo incluye NVIDIA Inception, Coinbase Ventures, Jump Crypto y Solana, según sus propias divulgaciones. Señal de credibilidad, no una garantía. Mi opinión honesta: la computación confidencial es claramente una categoría real. La pregunta abierta es si la demanda de $ARX escala con el uso real de dark pools, transferencias confidenciales y, eventualmente, Blackthorn; o si la adopción se queda atrás frente a la infraestructura, como a menudo ocurre en este sector. En lo que me fijo: el volumen real de transacciones a través de C-SPL y DeFi confidencial, y cómo se ve Blackthorn una vez que se lance. #BTC Price Analysis# #Altcoin Season# #Meme Alpha#
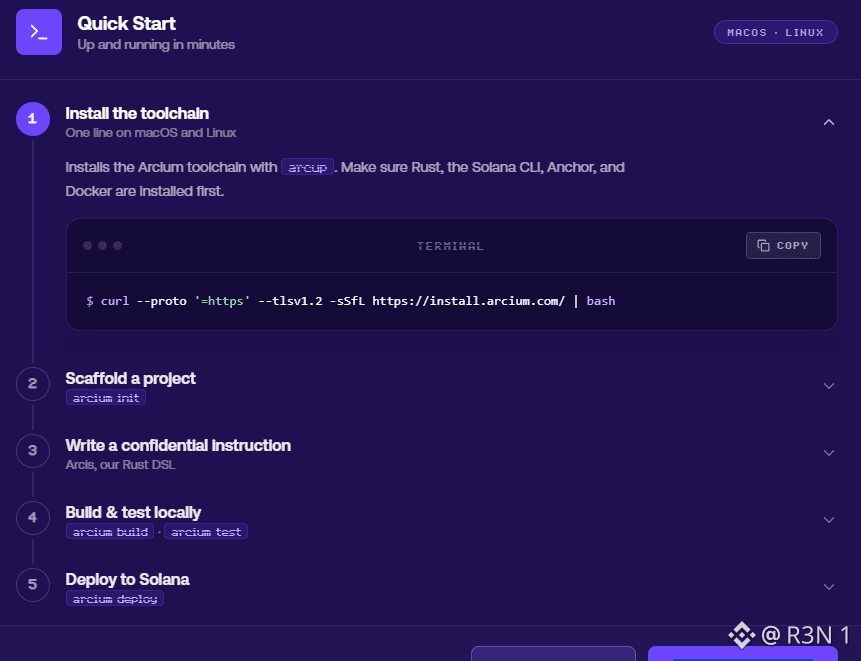
Bitcoin ha vuelto a acercarse a los 79,4K dólares desde mediados de agosto, y los datos de inactividad (dormancy) de la moneda que hay debajo de ese movimiento son más tranquilos de lo que cabría esperar para una recuperación de este tamaño. El CDD de entrada a las bolsas (Exchange Inflow CDD) añade un componente de antigüedad a las entradas a exchanges. Una lectura alta sugiere que las monedas que han permanecido inactivas durante un periodo significativo se están moviendo hacia las bolsas; aunque también puede significar simplemente que un lote grande de monedas relativamente jóvenes se movió de una vez. Por eso no es una lectura perfectamente limpia por sí sola. Mirando este ciclo en retrospectiva, el gráfico muestra varios picos pronunciados de esta métrica, agrupados sobre todo desde finales de 2025 hasta principios de 2026, lo cual encaja con lo que esperarías de las olas de distribución cuando los holders a largo plazo tomaron beneficios o se cubrieron (redujeron riesgo) durante la debilidad. Lo que destaca para mí ahora es el contraste. El precio se ha recuperado de forma importante desde los mínimos de 2026, pero la SMA de 7 días de esta métrica se ha mantenido apagada durante todo ese ascenso. Si esta recuperación se estuviera produciendo con monedas antiguas despertando para vender con fuerza, esperarías ver que aparezca aquí, y ahora mismo no se está viendo. Mi lectura honesta: esto parece más bien que los holders a largo plazo están quietos, en lugar de estar distribuyendo durante el rebote. Esa es una señal genuinamente constructiva si se mantiene, porque sugiere que las monedas con más convicción no están tratando los 79K dólares como una salida. Yo sería cauto con interpretar demasiado a partir de esto, aunque. Los datos tranquilos de inactividad no garantizan nada sobre lo que pasará después; solo te dicen lo que aún no ha ocurrido. Y este indicador ya ha tenido picos fuertes y rápidos antes, sin demasiada advertencia. Lo que estoy vigilando: si se mantiene apagado a medida que el precio empuja más arriba, o si aparece un pico justo en el momento en que esta recuperación empiece a probar niveles en los que las monedas con mucho tiempo de inactividad estarían realmente registrando ganancias significativas. #BTC Análisis de Precio# $BTC #Temporada de Altcoins#
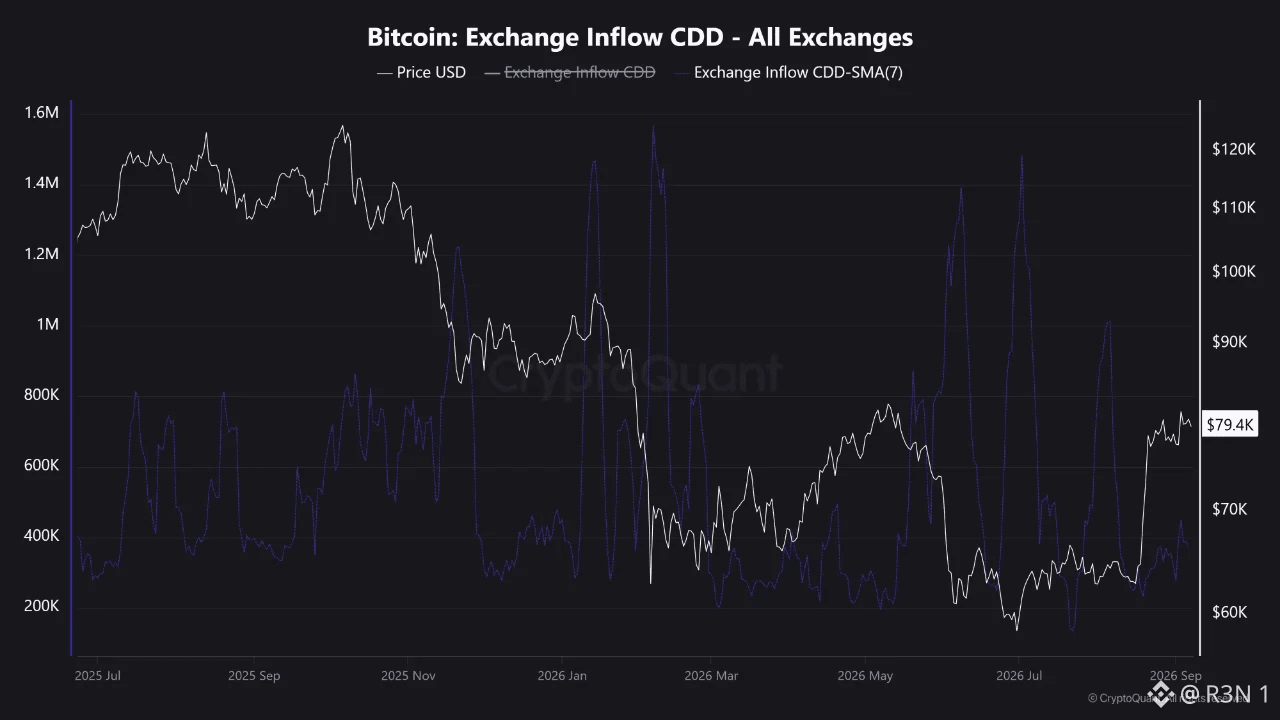
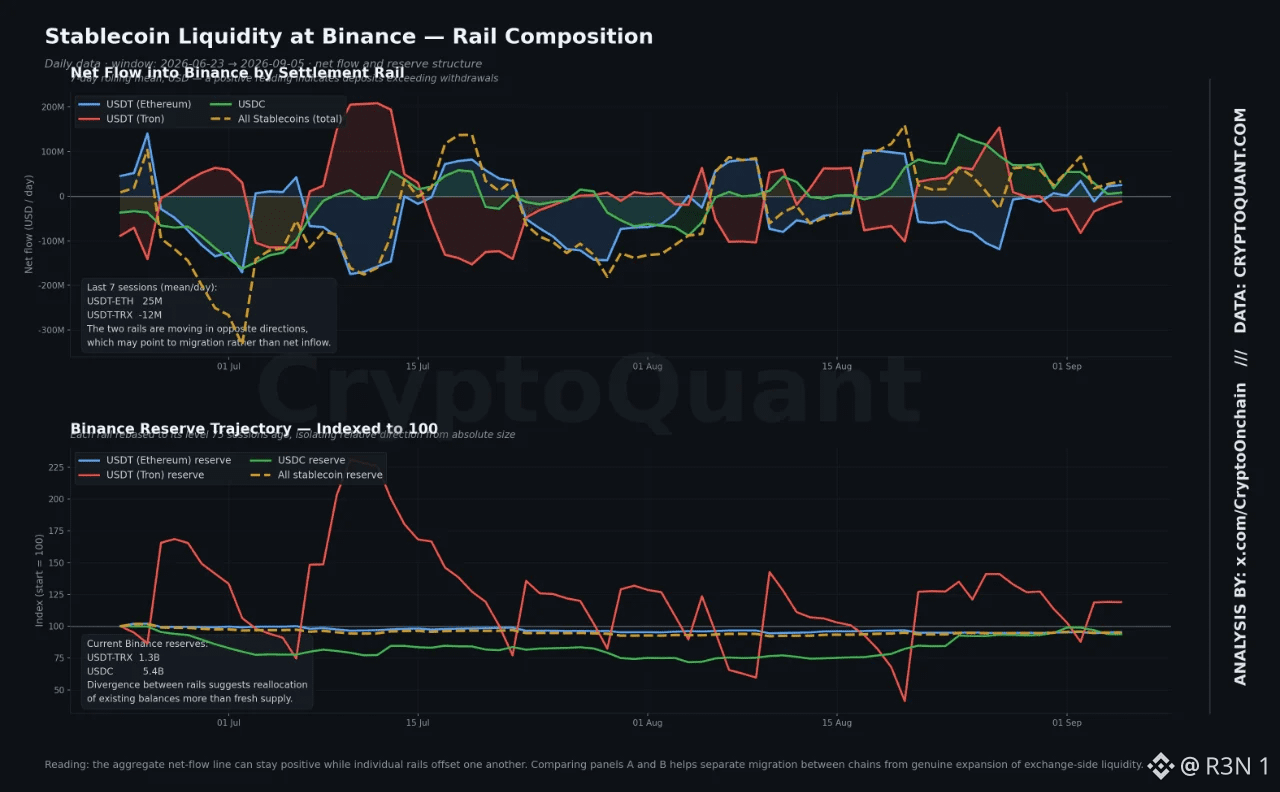
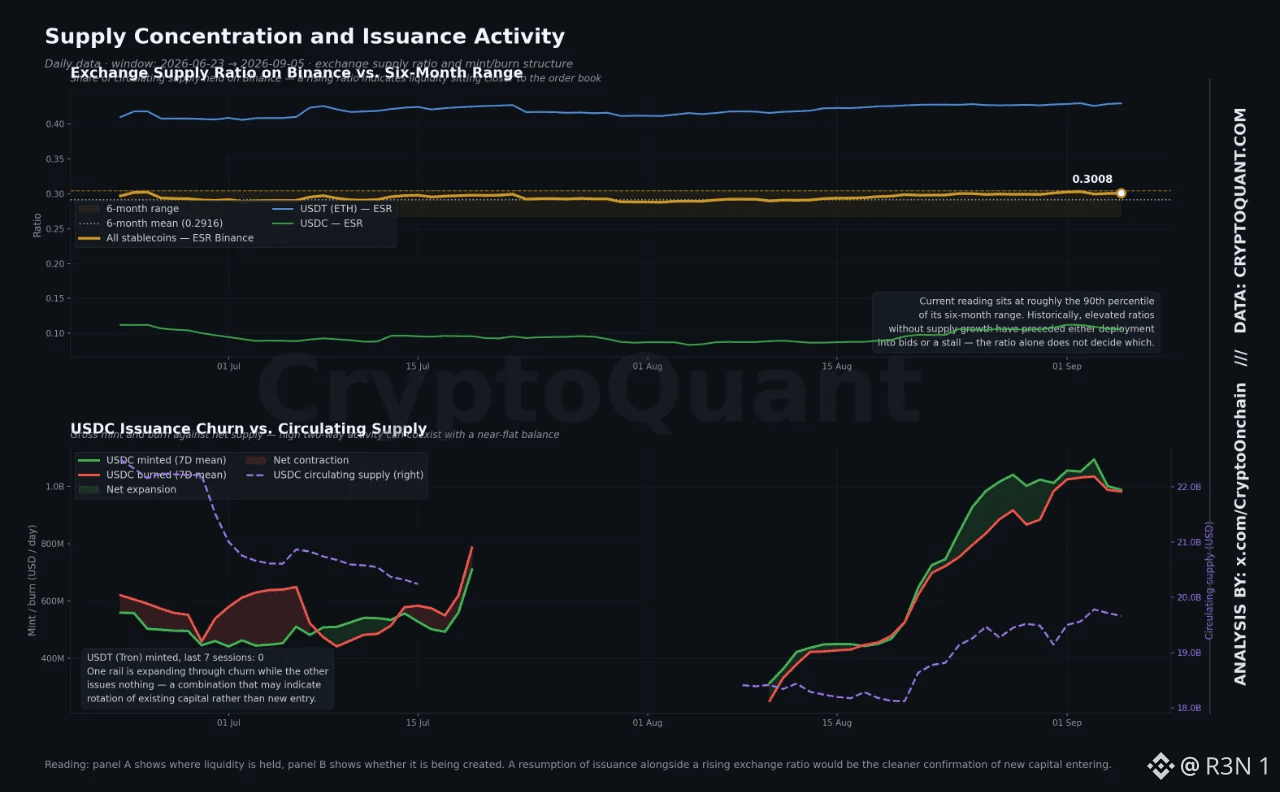
$33.3M al día fluyendo hacia Binance en agregado como netflow de stablecoins suena a capital fresco apareciendo. No lo es, y el desglose de debajo deja eso claro. El USDC en Ethereum impulsó la cifra principal, con un promedio de +$25.1M/día, 330% por encima del punto de referencia del trimestre. El USDT en Tron fue en la dirección opuesta, -$12.1M/día, un giro de aproximadamente 1,373% frente al mes anterior. No son dos tendencias independientes. La liquidez se mueve de un carril a otro. Los datos de emisión resuelven la pregunta. En el lado de Tron, el conteo de USDT acuñado y la oferta acuñada imprimieron cero durante la semana, -100% frente tanto al promedio de 30 como de 90 días, mientras que las quemas cayeron 84%. El contrato no se está expandiendo ni contrayendo. Está en pausa. Su reserva en Binance se deslizó 14.8% semana contra semana hasta $1.22B. El USDC cuenta una historia igualmente neutral en términos de netflow, pero más activa: $988.8M/día acuñados contra $982.6M/día quemados, con una rotación intensa que solo produce 4.9% de crecimiento de la oferta. Donde se pone interesante es la concentración. La proporción de toda la oferta de stablecoins en exchanges en Binance se sitúa en 0.3009, coincidiendo efectivamente con su máximo de seis meses de 0.3046. La proporción del $USDT en Ethereum alcanzó 0.4282 frente a la media de 0.4088 de seis meses. La del $USDC subió 17.6% en treinta días hasta 0.1086, con la reserva de Binance subiendo 19.9% hasta $5.52B, aunque ese aumento ocurrió antes en la ventana, ya que el netflow semanal se desaceleró 88.2%. Mi lectura: la pólvora seca está más cerca del libro de órdenes de Binance de lo que ha estado en seis meses, pero llegó allí migrando entre cadenas, no por la entrada de capital nuevo al sistema. Proporciones elevadas en el lado de exchanges sin crecimiento de la oferta históricamente han precedido ya sea el despliegue en pujas spot o una pausa si la emisión se mantiene plana. Lo que estoy vigilando: si se reanuda la acuñación en el lado de Tron, ya que eso sería la señal más limpia de que es capital nuevo y no el mismo capital cambiando de dirección. #BTC Price Analysis# #Altcoin Season#
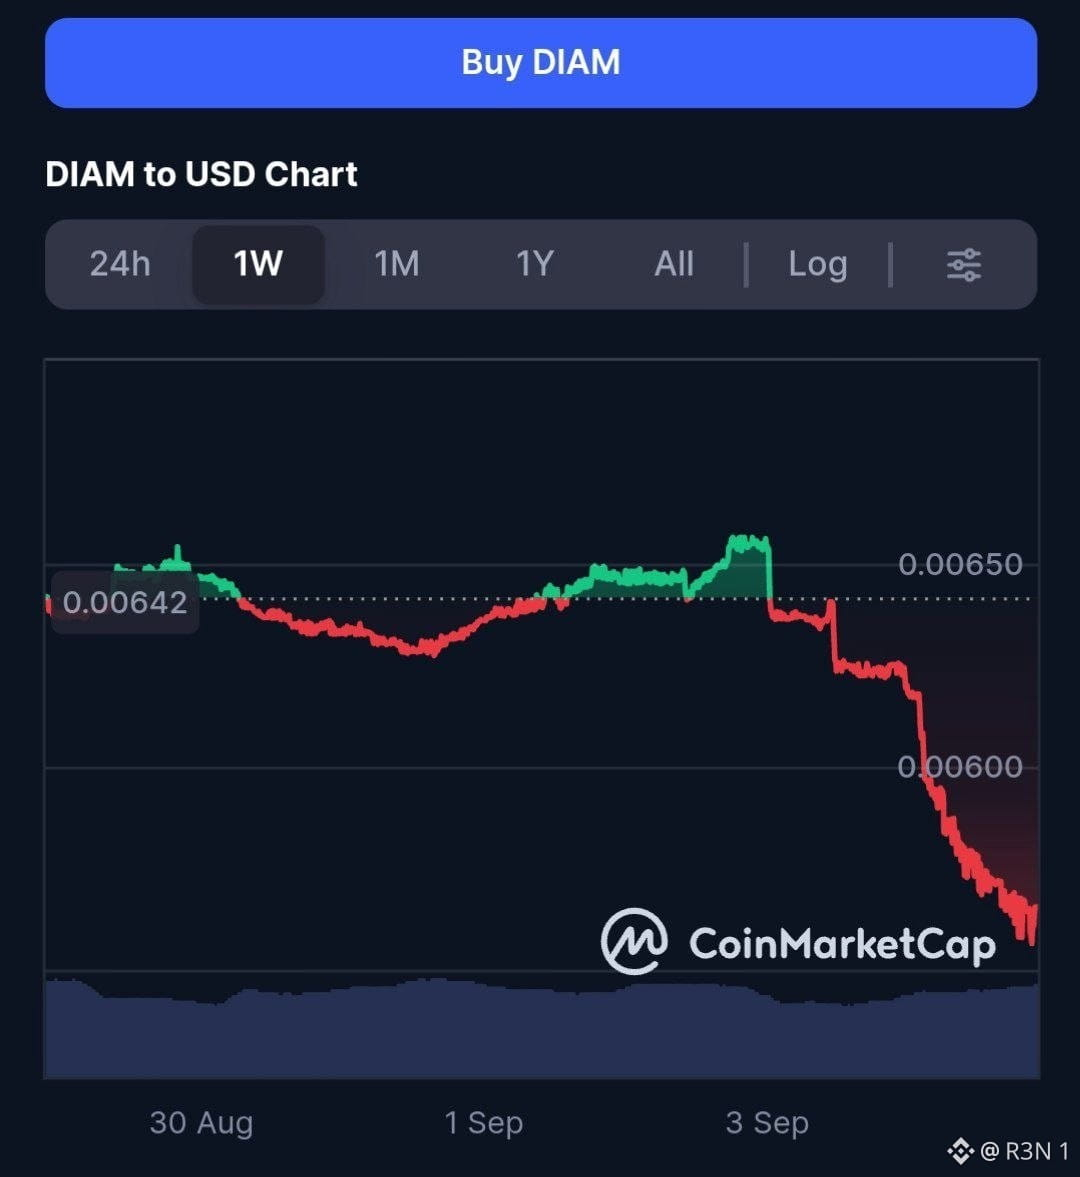
$9.07B. Ese es el récord que ahora figura en los libros para las ballenas de tenedores a corto plazo: las ganancias en papel acumuladas por grandes carteras que compraron en los últimos varios meses. La impresión más alta en un conjunto de datos que se remonta a 2016. (Asumiendo que aquí se trata de $BTC, ya que es lo que normalmente rastrea este indicador). Se suavizó hasta $7.51B para el 5 de septiembre cuando el precio bajó ligeramente, y aun así ese retroceso sigue estando entre las cinco lecturas más altas registradas; las cinco provienen de solo las dos últimas semanas. No hubo ningún pico. Un conjunto de impresiones récord en una ventana estrecha. Aquí está la tensión a la que vuelvo una y otra vez. La misma estructura de costo base que hace que este rally parezca real es también la que lo vuelve frágil ahora mismo. Las ballenas de STH compraron recientemente, a precios más altos, y están con una ganancia no realizada genuinamente grande en comparación con su propio historial. Eso es constructivo cuando se mantiene, porque los compradores recientes bajo el agua serían una señal mucho peor. Pero la ganancia no realizada a escala récord también es una exposición. Esta cohorte es históricamente la más rápida en tomar ganancias en cuanto está disponible, precisamente porque las ganancias son recientes y la convicción no ha sido puesta a prueba por un drawdown real todavía. Mi lectura honesta: no creo que estos datos por sí solos te digan en qué dirección se rompe. Es genuinamente de dos caras. Un suelo sólido construido sobre una acumulación real y reciente, sentado justo debajo de la estructura de incentivos exacta que podría socavar ese suelo si el precio se estanca. El récord en sí no es la señal. Lo que pasa después es lo importante. Lo que estoy observando: si esa cifra de ganancia no realizada sigue comprimiéndose con una mayor debilidad del precio, lo que sugeriría que las ballenas de STH están empezando a asegurar ganancias, o si se mantiene cerca de estos niveles, lo que indicaría que la cohorte está conforme con aguantar una sacudida en lugar de vender en medio de ella. #BTC Price Analysis# #Macro Insights#
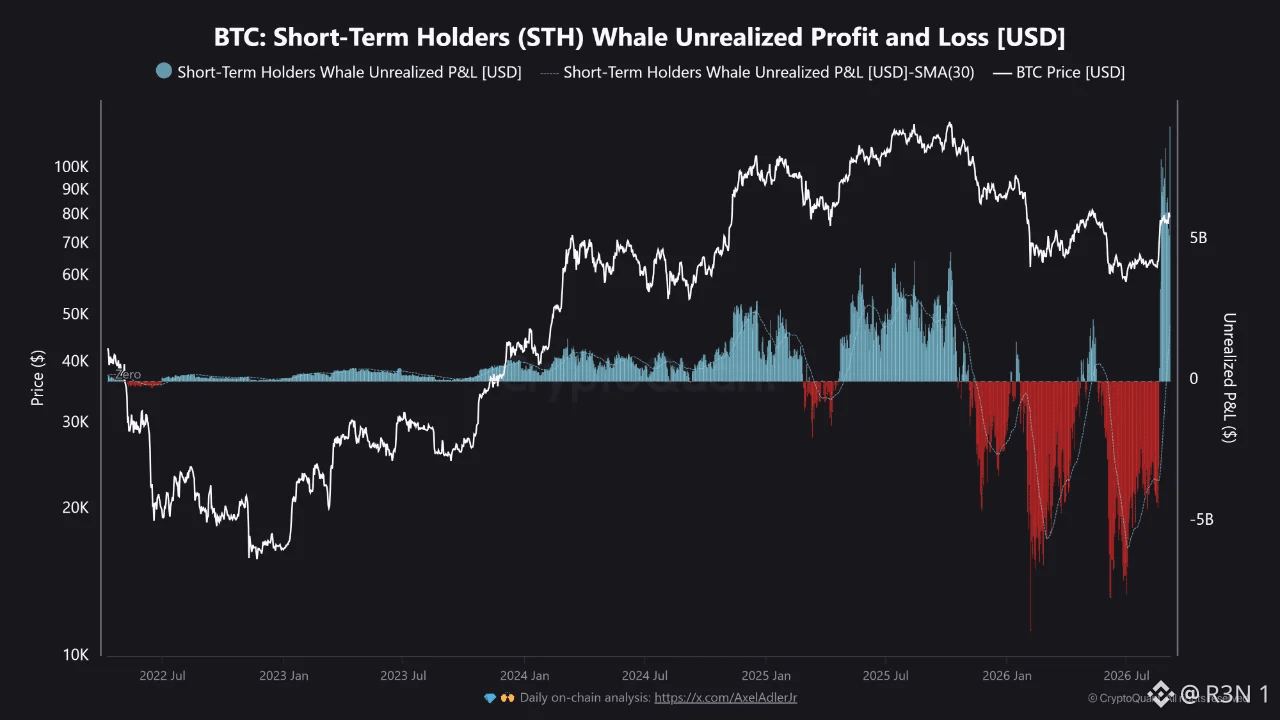
$320M acaba de salir del monedero de la federación de la red Liquid de Blockstream y las personas que lo tomaron están negociando su devolución en público: mensajes on-chain y luego un movimiento a canales cifrados. Así no se desarrolla un exploit normal. Lo confirmado: aproximadamente 4.000 BTC, cerca del 95% de la reserva de la federación de ~4.200 BTC que respalda L-BTC, se drenó el 6 de septiembre mediante una falla de validación en Elements, el software de código abierto que ejecuta el sidechain de Liquid. No se comprometieron claves. SideSwap dice que un cliente envió 4.000 L-BTC a su servicio de peg-out a las 14:05 UTC, y la federación pagó aproximadamente 3.996 BTC reales 23 minutos después: el mecanismo de peg-out hizo exactamente lo que está diseñado para hacer; simplemente confió en L-BTC que en realidad nunca estuvo respaldado. Liquid deshabilitó los nodos puente y pausó el sidechain en cuestión de horas; los exchanges suspendieron los depósitos y retiros de L-BTC. Según se reporta, USDT y otros activos emitidos en Liquid no se vieron afectados. La capa base de Bitcoin nunca se tocó: este es un problema del sidechain, no de Bitcoin. Lo inusual: un mensaje OP_RETURN llamó al actor “whitehat” y lo invitó a contactar. Blockstream respondió on-chain y, según se informa, las conversaciones pasaron a canales cifrados, con el actor diciendo que devolverían la mayor parte de los fondos una vez que el fallo se parcheara a nivel de red. Al 7 de septiembre, Blockstream dice que los nodos puente ya están parcheados, que es exactamente la condición que el atacante estableció para devolver el dinero. Personalmente, lo dudo. El CTO de Ledger, Charles Guillemet, hizo el punto obvio en público: los white hats legítimos no suelen drenar cientos de millones como jugada inicial, y trazó la comparación con Ronin y Euler. Contrapunto: según se reporta, los fondos han permanecido intocados desde el drenaje, lo cual al menos coincide con la historia, pero no es prueba. Lo que estoy observando ahora: se cumplió la condición del parche, así que el siguiente movimiento es el suyo. Si el $BTC no regresa pronto, “devuélvelo después del arreglo” nunca fue intención: era palanca. #Análisis del precio de $BTC# #Temporada de Altcoins#
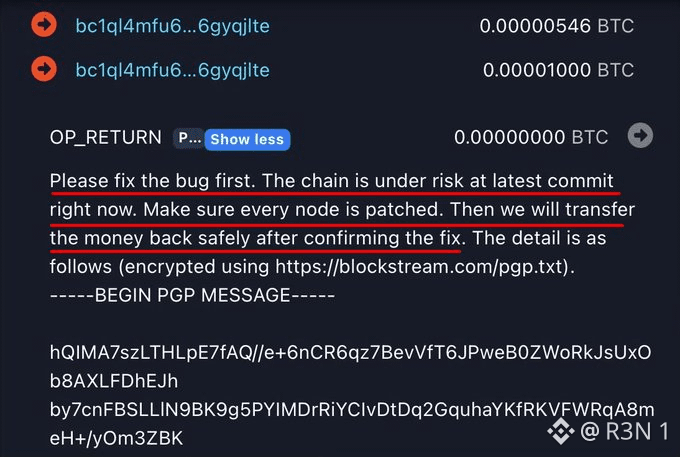
Elimine las salidas frente a unas entradas de aproximadamente 260.000 XRP hacia Binance en el rango de ballenas de 100K-1M. En términos de titulares, ese tipo de cifra se marca como bajista de inmediato y, por sí sola, es una señal negativa leve y razonable. Las monedas que se mueven hacia un intercambio en ese rango pueden ser el escenario de una posible venta a corto plazo. Pero el contexto más útil es la tendencia detrás de esa única lectura, no la lectura en sí. Tanto el volumen de entrada como el de salida en este rango han estado notablemente tranquilos desde julio, en comparación con los picos más grandes que se vieron antes en el año. Vale la pena tenerlo en mente: no es que las ballenas hayan despertado de repente para distribuir, es una única impresión de entrada dentro de un tramo por lo demás tranquilo. Mi lectura: eso cambia el peso que le daría. Una entrada de 260K durante una distribución activa me preocuparía más que el mismo número que aparezca en un periodo tranquilo. Conviene señalar que el indicador Aroon supuestamente aún favorece la tendencia alcista a corto plazo: la línea alcista está elevada, la línea bajista está baja, lo cual está un poco en tensión con una lectura de entradas bajistas. Lo marcaría como exactamente el tipo de señal mixta que no debería resolverse eligiendo el indicador que confirme tu sesgo. Lo que en realidad necesita más datos antes de que signifique algo: una sola jornada de entrada neta no establece un patrón. Si las entradas siguen subiendo en sesiones consecutivas, el argumento de presión vendedora se vuelve real. Si las salidas empiezan a superar a las entradas, eso se inclina hacia ballenas moviendo $XRP hacia almacenamiento en frío, algo más constructivo para el precio. Por ahora lo llamaría neutral a levemente negativo, en lugar de una señal sobre la que valga la pena actuar: la cifra importa menos que lo que ocurra en las próximas pocas sesiones, junto con la dirección de BTC y cualquier noticia específica de XRP. Lo que estoy vigilando: si esta entrada es un hecho aislado o el inicio de una racha.
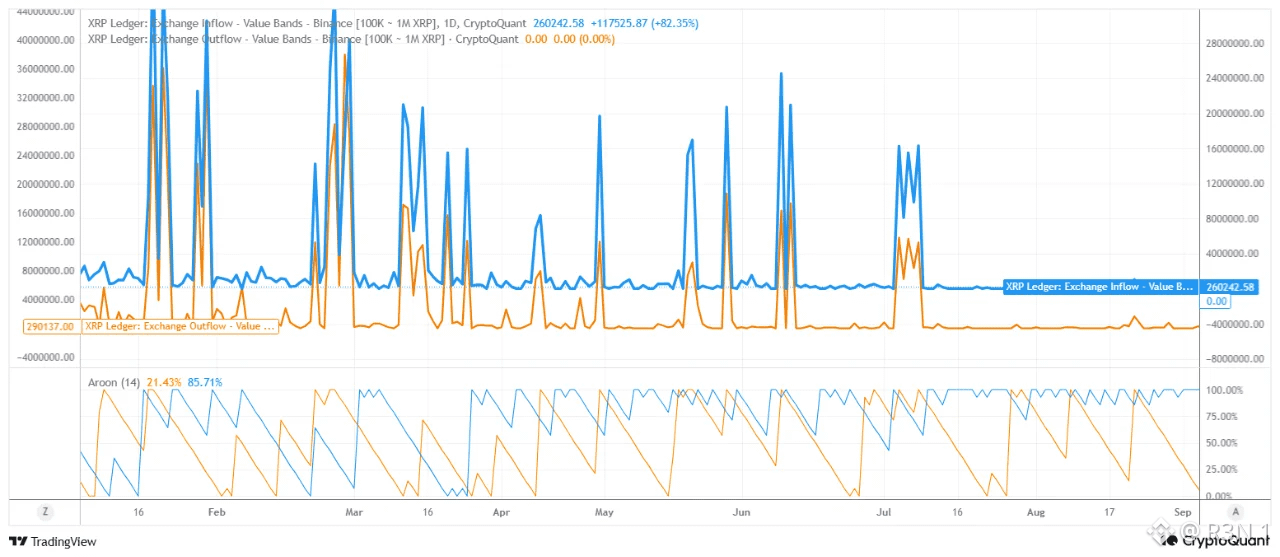
$DIAM está mostrando una configuración interesante aquí.
El precio se sitúa actualmente alrededor de $0.005628 después de enfrentar un fuerte rechazo en la zona de $0.0065.
La caída pone el foco en si DIAM puede estabilizarse alrededor de estos niveles y atraer nueva presión compradora.
Mientras tanto, $BTC sigue siendo una pieza importante del panorama general. Si Bitcoin mantiene su fortaleza, las altcoins podrían tener más margen para recuperarse, pero DIAM todavía necesita mostrar su propia fortaleza.
Estaré atento a la reacción desde aquí, especialmente al volumen y a cualquier intento de recuperar los niveles perdidos durante la caída.
$DIAM sigue en el radar. 📈
@Diam #DIAM #BTC #Altcoins #Crypto
El precio se sitúa actualmente alrededor de $0.005628 después de enfrentar un fuerte rechazo en la zona de $0.0065.
La caída pone el foco en si DIAM puede estabilizarse alrededor de estos niveles y atraer nueva presión compradora.
Mientras tanto, $BTC sigue siendo una pieza importante del panorama general. Si Bitcoin mantiene su fortaleza, las altcoins podrían tener más margen para recuperarse, pero DIAM todavía necesita mostrar su propia fortaleza.
Estaré atento a la reacción desde aquí, especialmente al volumen y a cualquier intento de recuperar los niveles perdidos durante la caída.
$DIAM sigue en el radar. 📈
@Diam #DIAM #BTC #Altcoins #Crypto
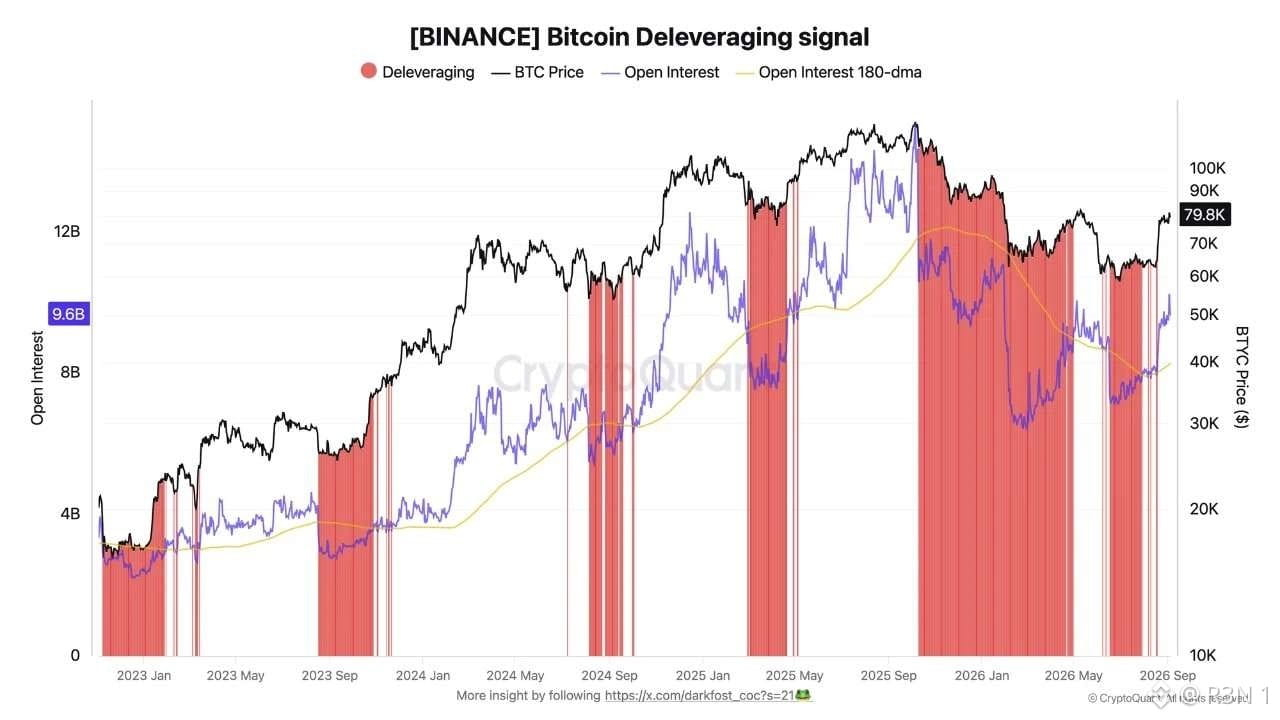
$BTC experimentó su desapalancamiento más brusco desde 2023
Después de un ciclo dominado en gran medida por los volúmenes de futuros, Bitcoin acaba de pasar por su fase de desapalancamiento más brusca desde 2023.
Esto se reflejó en un marcado descenso del Open Interest de Binance, que cayó por debajo de su promedio de 180 días, destacando tanto la fuerza como la rapidez del movimiento.
Esta es una fase necesaria para Bitcoin. A través de la corrección, el mercado obliga al cierre o la liquidación de posiciones que se habían vuelto demasiado pesadas. Ya fueran cortas o largas, fue durante este ciclo cuando Bitcoin registró los mayores eventos de liquidación de su historia.
A pesar de ello, el Open Interest de Binance sigue relativamente elevado en $9.6B, en comparación con un promedio de 180 días de $8.3B, lo que representa aproximadamente el 37% del Open Interest total de Bitcoin. Es un nivel más alto que el observado durante la recuperación de mayo, que a su vez ayudó a impulsar a BTC de nuevo hasta $82 000.
Aunque esta fase de corrección fue dura para los traders, ya parecen estar de vuelta, una señal que naturalmente está alimentando el rebote alcista de Bitcoin. Aun así, conviene vigilarlo, porque un mercado que acumula demasiado apalancamiento acaba desencadenando nuevos episodios brutales de desapalancamiento.
#BTC Price Analysis# #Macro Insights#
Después de un ciclo dominado en gran medida por los volúmenes de futuros, Bitcoin acaba de pasar por su fase de desapalancamiento más brusca desde 2023.
Esto se reflejó en un marcado descenso del Open Interest de Binance, que cayó por debajo de su promedio de 180 días, destacando tanto la fuerza como la rapidez del movimiento.
Esta es una fase necesaria para Bitcoin. A través de la corrección, el mercado obliga al cierre o la liquidación de posiciones que se habían vuelto demasiado pesadas. Ya fueran cortas o largas, fue durante este ciclo cuando Bitcoin registró los mayores eventos de liquidación de su historia.
A pesar de ello, el Open Interest de Binance sigue relativamente elevado en $9.6B, en comparación con un promedio de 180 días de $8.3B, lo que representa aproximadamente el 37% del Open Interest total de Bitcoin. Es un nivel más alto que el observado durante la recuperación de mayo, que a su vez ayudó a impulsar a BTC de nuevo hasta $82 000.
Aunque esta fase de corrección fue dura para los traders, ya parecen estar de vuelta, una señal que naturalmente está alimentando el rebote alcista de Bitcoin. Aun así, conviene vigilarlo, porque un mercado que acumula demasiado apalancamiento acaba desencadenando nuevos episodios brutales de desapalancamiento.
#BTC Price Analysis# #Macro Insights#
Inicia sesión para explorar más contenidos