
#liquidationmap
liquidationmap
397,281 vistas
813 están debatiendo
Hot
Lo último

·
--
Alcista
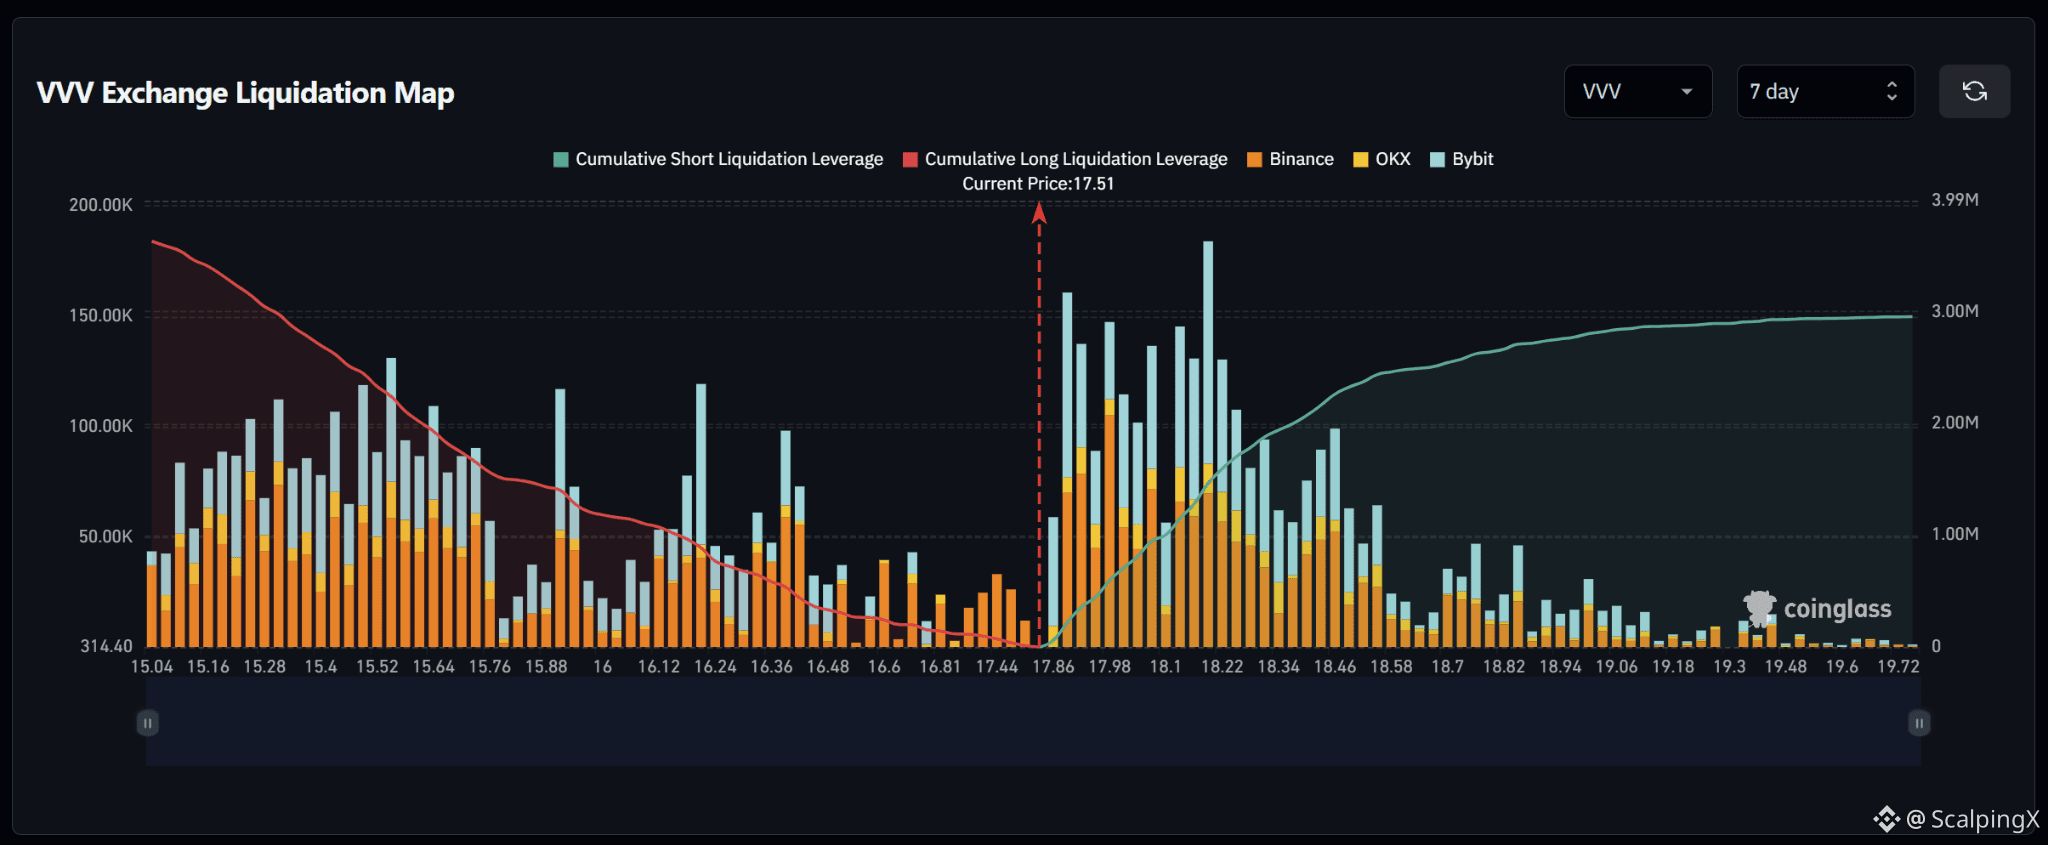
$VVV – Mapa de Liquidación (7 Días) – Precio Actual 17.51
🔎 El mapa de liquidación de 7 días muestra aproximadamente $3.6 millones en liquidaciones largas por debajo del precio actual, superando aproximadamente $3.0 millones en liquidaciones cortas por encima. Por lo tanto, la estructura de liquidez está bastante equilibrada, pero ligeramente inclinada a la baja, con alrededor de 1.2 veces más liquidez acumulada por debajo del mercado.
📉 Por debajo del mercado, la liquidez cercana de liquidaciones largas sigue siendo relativamente escasa alrededor de 17.44–16.81 antes de aumentar entre 16.60–16.24. Aparecen agrupaciones notables alrededor de 16.36 y 16.24, mientras que la liquidez se vuelve mucho más densa más abajo entre 15.88–15.28. Perder 17.44 trasladaría la atención hacia 16.81–16.60.
📈 Por encima del mercado, la liquidez de liquidaciones cortas comienza a aumentar bruscamente desde 17.86 y se vuelve densa entre 17.98–18.34. El grupo más fuerte se sitúa alrededor de 18.18–18.22, donde la barra de liquidación se acerca a $185,000, mientras que 17.86–18.10 y 18.34–18.46 también contienen liquidez notable.
🧭 La configuración general favorece modestamente la baja porque la exposición a liquidaciones largas por debajo es mayor. Perder 17.44 aumentaría la probabilidad de un barrido hacia 16.81–16.60, mientras que romper por encima de 17.86 desplazaría la atención hacia 17.98–18.22.
#LiquidationMap
$VVV – Mapa de Liquidación (7 Días) – Precio Actual 17.51
🔎 El mapa de liquidación de 7 días muestra aproximadamente $3.6 millones en liquidaciones largas por debajo del precio actual, superando aproximadamente $3.0 millones en liquidaciones cortas por encima. Por lo tanto, la estructura de liquidez está bastante equilibrada, pero ligeramente inclinada a la baja, con alrededor de 1.2 veces más liquidez acumulada por debajo del mercado.
📉 Por debajo del mercado, la liquidez cercana de liquidaciones largas sigue siendo relativamente escasa alrededor de 17.44–16.81 antes de aumentar entre 16.60–16.24. Aparecen agrupaciones notables alrededor de 16.36 y 16.24, mientras que la liquidez se vuelve mucho más densa más abajo entre 15.88–15.28. Perder 17.44 trasladaría la atención hacia 16.81–16.60.
📈 Por encima del mercado, la liquidez de liquidaciones cortas comienza a aumentar bruscamente desde 17.86 y se vuelve densa entre 17.98–18.34. El grupo más fuerte se sitúa alrededor de 18.18–18.22, donde la barra de liquidación se acerca a $185,000, mientras que 17.86–18.10 y 18.34–18.46 también contienen liquidez notable.
🧭 La configuración general favorece modestamente la baja porque la exposición a liquidaciones largas por debajo es mayor. Perder 17.44 aumentaría la probabilidad de un barrido hacia 16.81–16.60, mientras que romper por encima de 17.86 desplazaría la atención hacia 17.98–18.22.
#LiquidationMap
🔎 El mapa de liquidación de 7 días muestra aproximadamente $3.6 millones en liquidaciones largas por debajo del precio actual, superando aproximadamente $3.0 millones en liquidaciones cortas por encima. Por lo tanto, la estructura de liquidez está bastante equilibrada, pero ligeramente inclinada a la baja, con alrededor de 1.2 veces más liquidez acumulada por debajo del mercado.
📉 Por debajo del mercado, la liquidez cercana de liquidaciones largas sigue siendo relativamente escasa alrededor de 17.44–16.81 antes de aumentar entre 16.60–16.24. Aparecen agrupaciones notables alrededor de 16.36 y 16.24, mientras que la liquidez se vuelve mucho más densa más abajo entre 15.88–15.28. Perder 17.44 trasladaría la atención hacia 16.81–16.60.
📈 Por encima del mercado, la liquidez de liquidaciones cortas comienza a aumentar bruscamente desde 17.86 y se vuelve densa entre 17.98–18.34. El grupo más fuerte se sitúa alrededor de 18.18–18.22, donde la barra de liquidación se acerca a $185,000, mientras que 17.86–18.10 y 18.34–18.46 también contienen liquidez notable.
🧭 La configuración general favorece modestamente la baja porque la exposición a liquidaciones largas por debajo es mayor. Perder 17.44 aumentaría la probabilidad de un barrido hacia 16.81–16.60, mientras que romper por encima de 17.86 desplazaría la atención hacia 17.98–18.22.
#LiquidationMap
84
·
--
Alcista
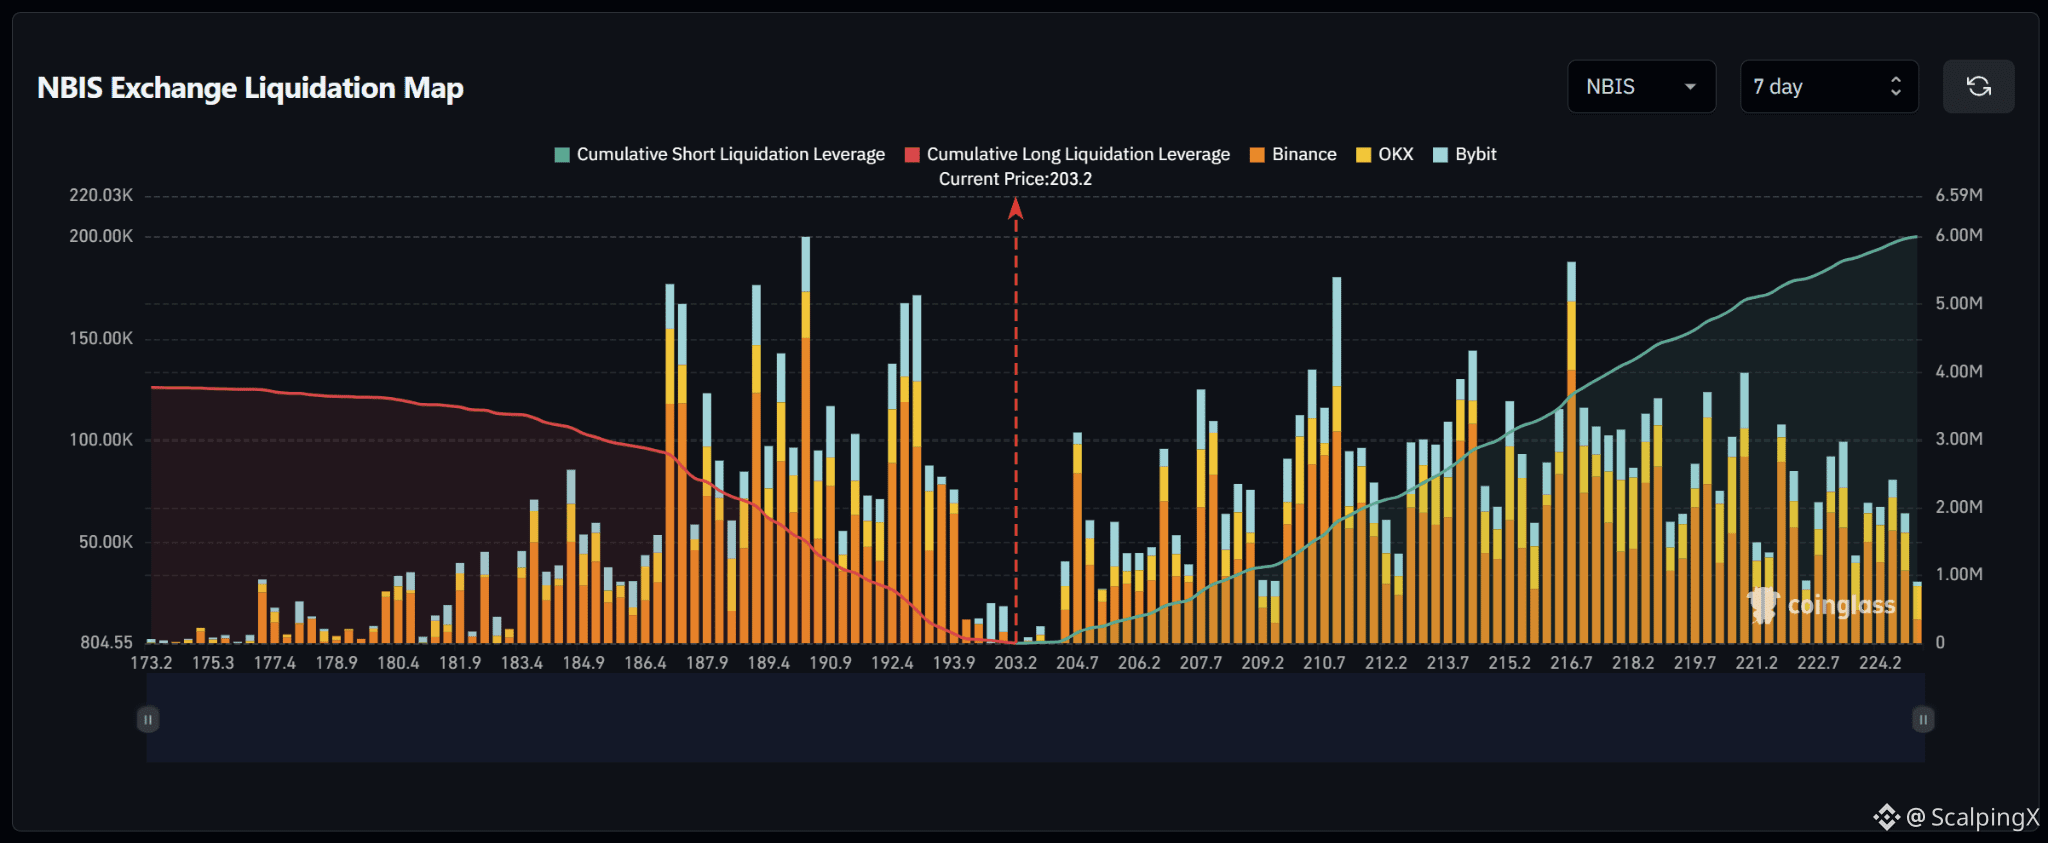
$NBIS – Mapa de Liquidaciones (7 Días) – Precio Actual 203.2
🔎 El mapa de liquidaciones a 7 días muestra aproximadamente 6 millones de dólares en liquidaciones cortas por encima del precio actual, superando aproximadamente 4 millones en liquidaciones largas por debajo. Por lo tanto, la estructura de liquidez favorece la subida, con alrededor de 1,5 veces más liquidez acumulada por encima del mercado.
📉 Por debajo del mercado, la liquidez cercana de liquidaciones largas se mantiene relativamente delgada alrededor de 193.9–192.4 antes de aumentar con fuerza entre 190.9–186.4. Los clústeres más fuertes se sitúan cerca de 190 y 187, con varias barras que alcanzan aproximadamente entre $150,000 y $200,000. Perder 193.9 haría que la atención se desplace hacia 192.4–190.9.
📈 Por encima del mercado, la liquidez de liquidaciones cortas comienza a formarse desde 204.7 y aumenta a través de 207.7–212.2. Un clúster destacado cerca de 210.7 alcanza casi $180,000. Más lejos, la liquidez se mantiene densa entre 213.7–218.2, y la zona 216.7 destaca cerca de $190,000.
🧭 La configuración general favorece la subida porque la exposición por liquidaciones cortas por encima es aproximadamente 1,5 veces mayor. Romper 204.7 incrementaría la probabilidad de un barrido hacia 207.7–212.2, mientras que perder 193.9 haría que la atención se desplace hacia 192.4–190.9.
#LiquidationMap
$NBIS – Mapa de Liquidaciones (7 Días) – Precio Actual 203.2
🔎 El mapa de liquidaciones a 7 días muestra aproximadamente 6 millones de dólares en liquidaciones cortas por encima del precio actual, superando aproximadamente 4 millones en liquidaciones largas por debajo. Por lo tanto, la estructura de liquidez favorece la subida, con alrededor de 1,5 veces más liquidez acumulada por encima del mercado.
📉 Por debajo del mercado, la liquidez cercana de liquidaciones largas se mantiene relativamente delgada alrededor de 193.9–192.4 antes de aumentar con fuerza entre 190.9–186.4. Los clústeres más fuertes se sitúan cerca de 190 y 187, con varias barras que alcanzan aproximadamente entre $150,000 y $200,000. Perder 193.9 haría que la atención se desplace hacia 192.4–190.9.
📈 Por encima del mercado, la liquidez de liquidaciones cortas comienza a formarse desde 204.7 y aumenta a través de 207.7–212.2. Un clúster destacado cerca de 210.7 alcanza casi $180,000. Más lejos, la liquidez se mantiene densa entre 213.7–218.2, y la zona 216.7 destaca cerca de $190,000.
🧭 La configuración general favorece la subida porque la exposición por liquidaciones cortas por encima es aproximadamente 1,5 veces mayor. Romper 204.7 incrementaría la probabilidad de un barrido hacia 207.7–212.2, mientras que perder 193.9 haría que la atención se desplace hacia 192.4–190.9.
#LiquidationMap
🔎 El mapa de liquidaciones a 7 días muestra aproximadamente 6 millones de dólares en liquidaciones cortas por encima del precio actual, superando aproximadamente 4 millones en liquidaciones largas por debajo. Por lo tanto, la estructura de liquidez favorece la subida, con alrededor de 1,5 veces más liquidez acumulada por encima del mercado.
📉 Por debajo del mercado, la liquidez cercana de liquidaciones largas se mantiene relativamente delgada alrededor de 193.9–192.4 antes de aumentar con fuerza entre 190.9–186.4. Los clústeres más fuertes se sitúan cerca de 190 y 187, con varias barras que alcanzan aproximadamente entre $150,000 y $200,000. Perder 193.9 haría que la atención se desplace hacia 192.4–190.9.
📈 Por encima del mercado, la liquidez de liquidaciones cortas comienza a formarse desde 204.7 y aumenta a través de 207.7–212.2. Un clúster destacado cerca de 210.7 alcanza casi $180,000. Más lejos, la liquidez se mantiene densa entre 213.7–218.2, y la zona 216.7 destaca cerca de $190,000.
🧭 La configuración general favorece la subida porque la exposición por liquidaciones cortas por encima es aproximadamente 1,5 veces mayor. Romper 204.7 incrementaría la probabilidad de un barrido hacia 207.7–212.2, mientras que perder 193.9 haría que la atención se desplace hacia 192.4–190.9.
#LiquidationMap
17
·
--
Alcista
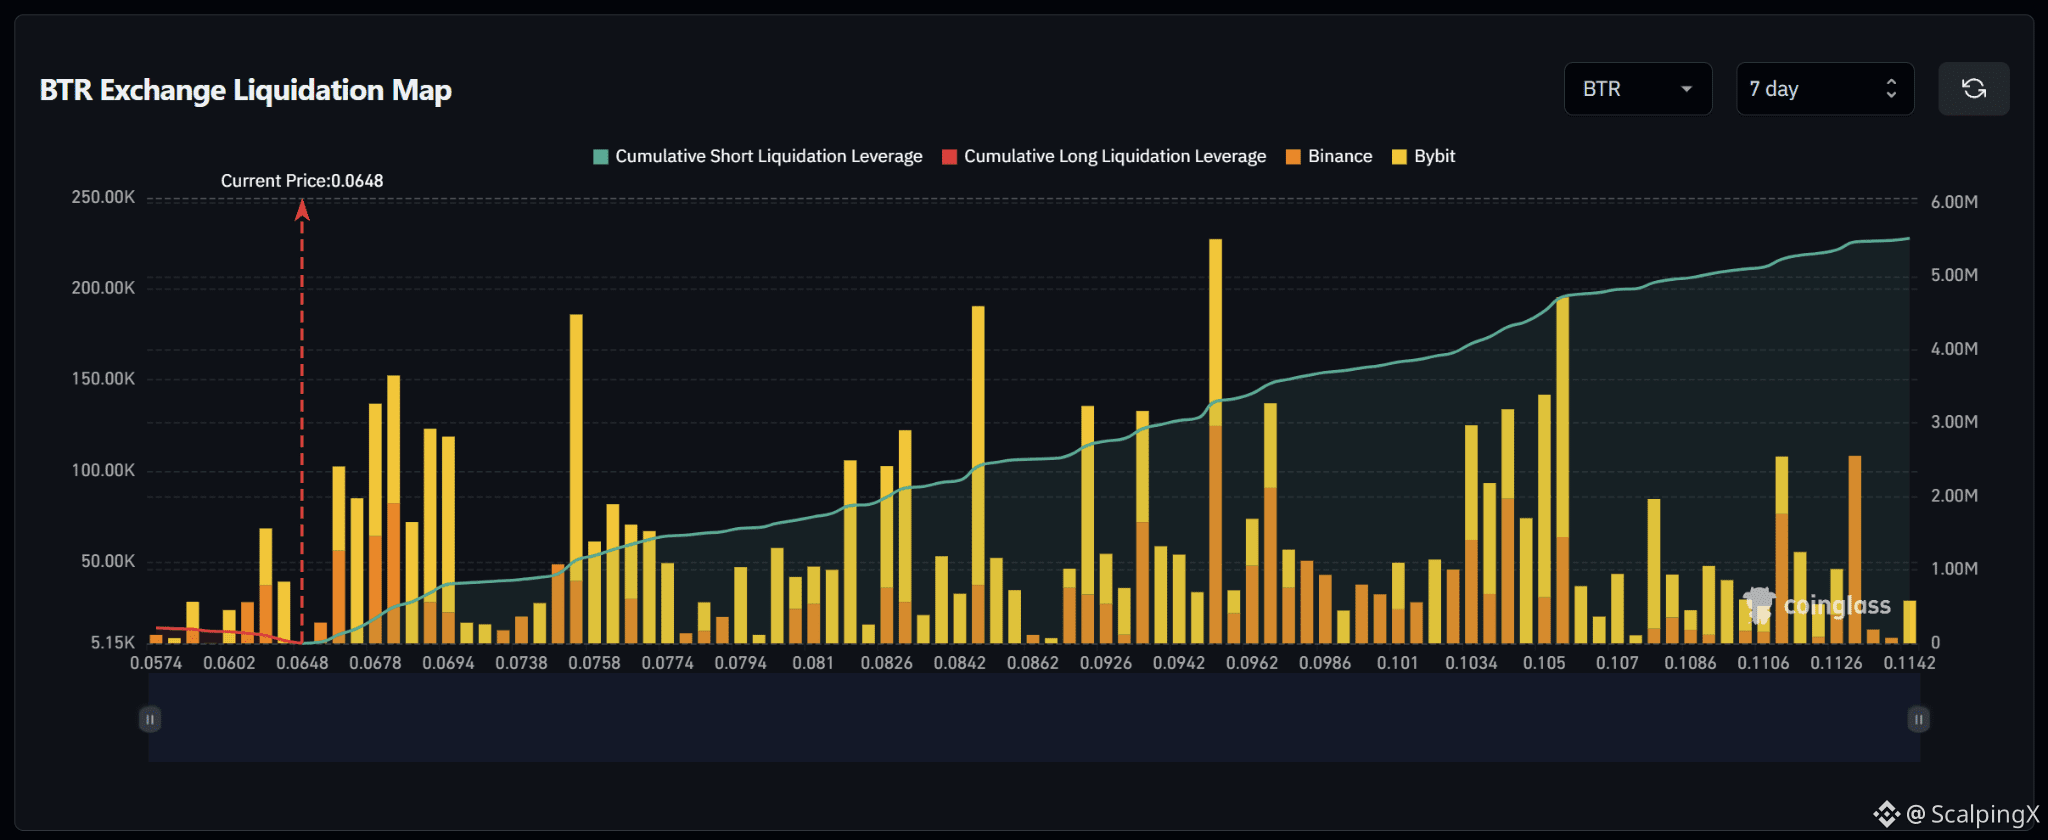
$BTR – Mapa de Liquidación (7 Días) – Precio Actual 0.0648
🔎 El mapa de liquidaciones a 7 días muestra aproximadamente $5.4–5.5 millones en liquidaciones cortas por encima del precio actual, mientras que la exposición a liquidaciones largas por debajo es casi nula, ya que el precio se sitúa cerca del borde inferior del rango mostrado. La estructura de liquidez, por lo tanto, favorece fuertemente la subida.
📉 Por debajo del mercado, la liquidez restante de liquidaciones largas es relativamente delgada, principalmente alrededor de 0.0602–0.0574. No hay grandes clústeres de liquidación justo debajo del precio actual, lo que sugiere poca atracción de liquidez a la baja dentro del rango mostrado.
📈 Por encima del mercado, la liquidez de liquidaciones cortas empieza a acumularse inmediatamente alrededor de 0.0678–0.0694, seguida por varios clústeres grandes cerca de 0.0758, 0.0842 y especialmente 0.094–0.096. Más lejos, 0.1034–0.105 destaca con barras alrededor de $140,000–195,000, mientras que 0.1126 también contiene un clúster notable.
🧭 La configuración general favorece fuertemente la subida porque casi toda la liquidez significativa de liquidaciones está colocada por encima del mercado. Romper 0.0678 aumentaría la probabilidad de un barrido hacia 0.0694–0.0758; si el impulso continúa, 0.0842 y 0.094–0.096 se convertirían en las siguientes zonas de liquidez destacadas.
#LiquidationMap
$BTR – Mapa de Liquidación (7 Días) – Precio Actual 0.0648
🔎 El mapa de liquidaciones a 7 días muestra aproximadamente $5.4–5.5 millones en liquidaciones cortas por encima del precio actual, mientras que la exposición a liquidaciones largas por debajo es casi nula, ya que el precio se sitúa cerca del borde inferior del rango mostrado. La estructura de liquidez, por lo tanto, favorece fuertemente la subida.
📉 Por debajo del mercado, la liquidez restante de liquidaciones largas es relativamente delgada, principalmente alrededor de 0.0602–0.0574. No hay grandes clústeres de liquidación justo debajo del precio actual, lo que sugiere poca atracción de liquidez a la baja dentro del rango mostrado.
📈 Por encima del mercado, la liquidez de liquidaciones cortas empieza a acumularse inmediatamente alrededor de 0.0678–0.0694, seguida por varios clústeres grandes cerca de 0.0758, 0.0842 y especialmente 0.094–0.096. Más lejos, 0.1034–0.105 destaca con barras alrededor de $140,000–195,000, mientras que 0.1126 también contiene un clúster notable.
🧭 La configuración general favorece fuertemente la subida porque casi toda la liquidez significativa de liquidaciones está colocada por encima del mercado. Romper 0.0678 aumentaría la probabilidad de un barrido hacia 0.0694–0.0758; si el impulso continúa, 0.0842 y 0.094–0.096 se convertirían en las siguientes zonas de liquidez destacadas.
#LiquidationMap
🔎 El mapa de liquidaciones a 7 días muestra aproximadamente $5.4–5.5 millones en liquidaciones cortas por encima del precio actual, mientras que la exposición a liquidaciones largas por debajo es casi nula, ya que el precio se sitúa cerca del borde inferior del rango mostrado. La estructura de liquidez, por lo tanto, favorece fuertemente la subida.
📉 Por debajo del mercado, la liquidez restante de liquidaciones largas es relativamente delgada, principalmente alrededor de 0.0602–0.0574. No hay grandes clústeres de liquidación justo debajo del precio actual, lo que sugiere poca atracción de liquidez a la baja dentro del rango mostrado.
📈 Por encima del mercado, la liquidez de liquidaciones cortas empieza a acumularse inmediatamente alrededor de 0.0678–0.0694, seguida por varios clústeres grandes cerca de 0.0758, 0.0842 y especialmente 0.094–0.096. Más lejos, 0.1034–0.105 destaca con barras alrededor de $140,000–195,000, mientras que 0.1126 también contiene un clúster notable.
🧭 La configuración general favorece fuertemente la subida porque casi toda la liquidez significativa de liquidaciones está colocada por encima del mercado. Romper 0.0678 aumentaría la probabilidad de un barrido hacia 0.0694–0.0758; si el impulso continúa, 0.0842 y 0.094–0.096 se convertirían en las siguientes zonas de liquidez destacadas.
#LiquidationMap
40
·
--
Alcista
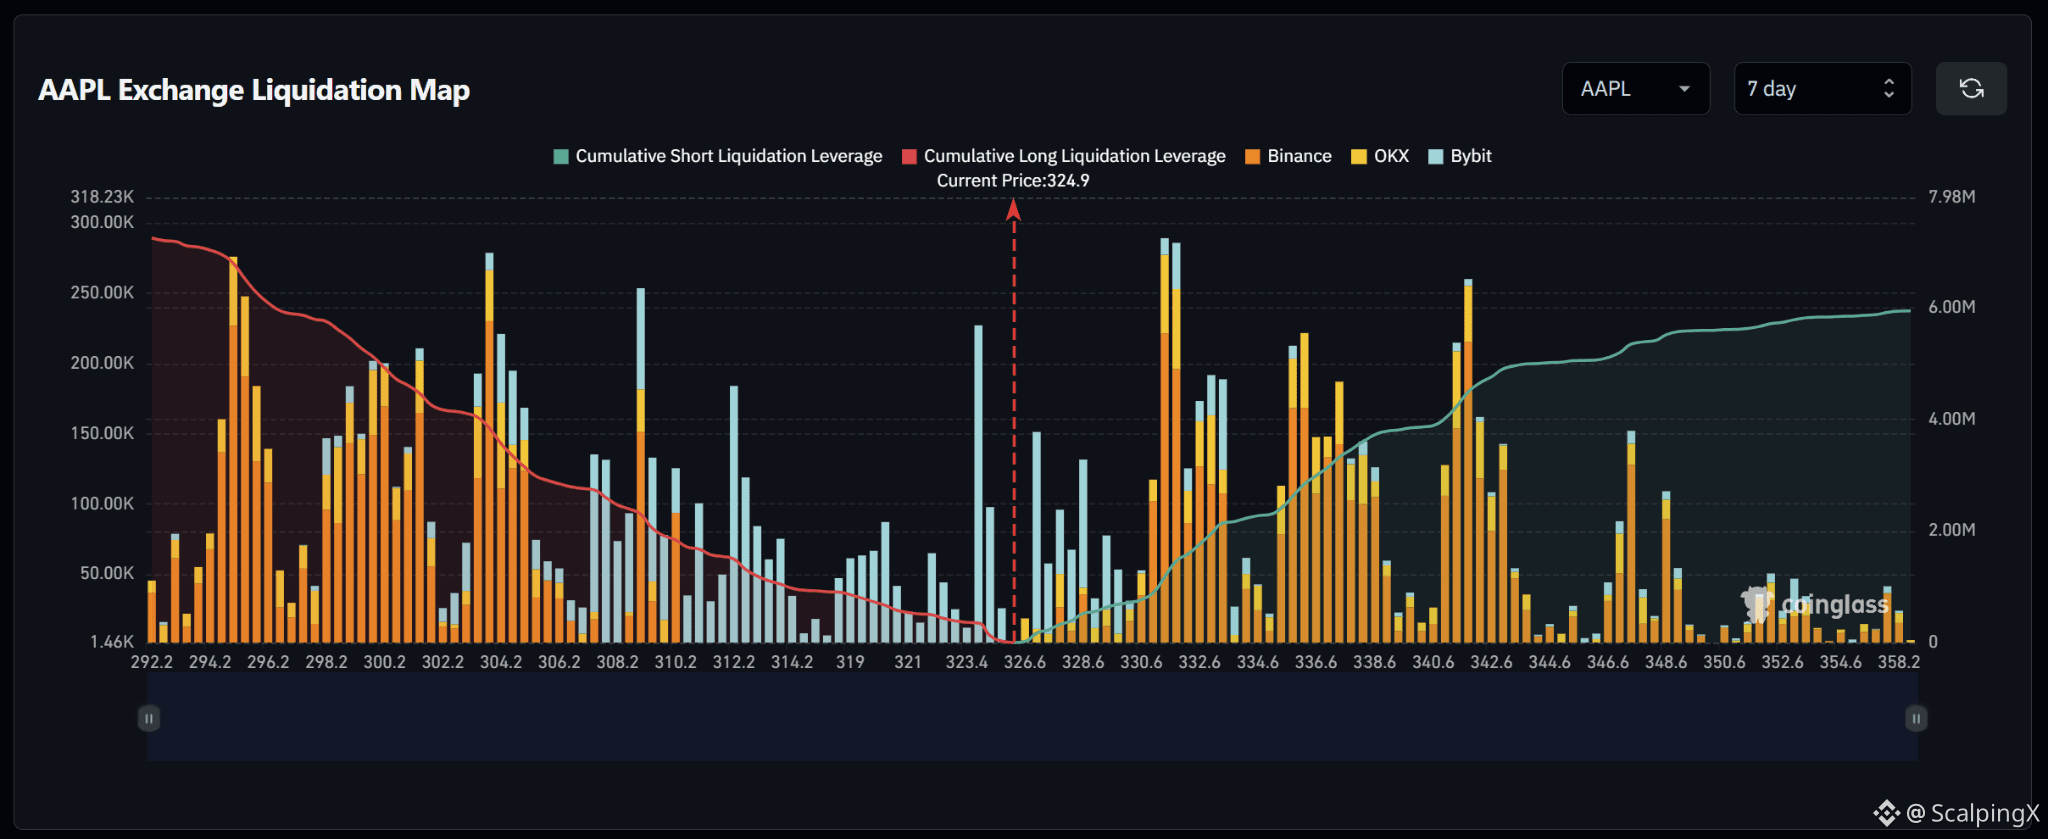
$AAPL – Mapa de Liquidaciones (7 días) – Precio Actual 324.9
🔎 El mapa de liquidaciones a 7 días muestra aproximadamente 7 millones de dólares en liquidaciones largas por debajo del precio actual, superando cerca de 6 millones de dólares en liquidaciones cortas por encima. La estructura general está bastante equilibrada, pero con una ligera inclinación hacia la baja.
📉 Por debajo del mercado, la liquidez de liquidaciones largas cercana se concentra alrededor de 323.4–321.0, con una barra destacada cerca de 323.4 que supera los 200,000. Más abajo, aparecen clústeres más grandes alrededor de 308.2–304.2 y 296.2–294.2, donde varias barras alcanzan aproximadamente entre 200,000 y 280,000. Perder 323.4 movería la atención hacia 321.0–319.0.
📈 Por encima del mercado, la liquidez de liquidaciones cortas comienza a acumularse desde alrededor de 326.6 y se vuelve mucho más densa en 330.6–332.6. El clúster más fuerte cerca de 331–332 se acerca a los 290,000. Más lejos, 336.6 y 340.6–342.6 también contienen liquidez notable.
🧭 La configuración general favorece modestamente la baja porque la exposición a liquidaciones largas por debajo es mayor. Perder 323.4 aumentaría la probabilidad de un barrido hacia 321.0–319.0, mientras que romper por encima de 326.6 desplazaría la atención hacia 330.6–332.6.
#LiquidationMap
$AAPL – Mapa de Liquidaciones (7 días) – Precio Actual 324.9
🔎 El mapa de liquidaciones a 7 días muestra aproximadamente 7 millones de dólares en liquidaciones largas por debajo del precio actual, superando cerca de 6 millones de dólares en liquidaciones cortas por encima. La estructura general está bastante equilibrada, pero con una ligera inclinación hacia la baja.
📉 Por debajo del mercado, la liquidez de liquidaciones largas cercana se concentra alrededor de 323.4–321.0, con una barra destacada cerca de 323.4 que supera los 200,000. Más abajo, aparecen clústeres más grandes alrededor de 308.2–304.2 y 296.2–294.2, donde varias barras alcanzan aproximadamente entre 200,000 y 280,000. Perder 323.4 movería la atención hacia 321.0–319.0.
📈 Por encima del mercado, la liquidez de liquidaciones cortas comienza a acumularse desde alrededor de 326.6 y se vuelve mucho más densa en 330.6–332.6. El clúster más fuerte cerca de 331–332 se acerca a los 290,000. Más lejos, 336.6 y 340.6–342.6 también contienen liquidez notable.
🧭 La configuración general favorece modestamente la baja porque la exposición a liquidaciones largas por debajo es mayor. Perder 323.4 aumentaría la probabilidad de un barrido hacia 321.0–319.0, mientras que romper por encima de 326.6 desplazaría la atención hacia 330.6–332.6.
#LiquidationMap
🔎 El mapa de liquidaciones a 7 días muestra aproximadamente 7 millones de dólares en liquidaciones largas por debajo del precio actual, superando cerca de 6 millones de dólares en liquidaciones cortas por encima. La estructura general está bastante equilibrada, pero con una ligera inclinación hacia la baja.
📉 Por debajo del mercado, la liquidez de liquidaciones largas cercana se concentra alrededor de 323.4–321.0, con una barra destacada cerca de 323.4 que supera los 200,000. Más abajo, aparecen clústeres más grandes alrededor de 308.2–304.2 y 296.2–294.2, donde varias barras alcanzan aproximadamente entre 200,000 y 280,000. Perder 323.4 movería la atención hacia 321.0–319.0.
📈 Por encima del mercado, la liquidez de liquidaciones cortas comienza a acumularse desde alrededor de 326.6 y se vuelve mucho más densa en 330.6–332.6. El clúster más fuerte cerca de 331–332 se acerca a los 290,000. Más lejos, 336.6 y 340.6–342.6 también contienen liquidez notable.
🧭 La configuración general favorece modestamente la baja porque la exposición a liquidaciones largas por debajo es mayor. Perder 323.4 aumentaría la probabilidad de un barrido hacia 321.0–319.0, mientras que romper por encima de 326.6 desplazaría la atención hacia 330.6–332.6.
#LiquidationMap
1
16
·
--
Alcista
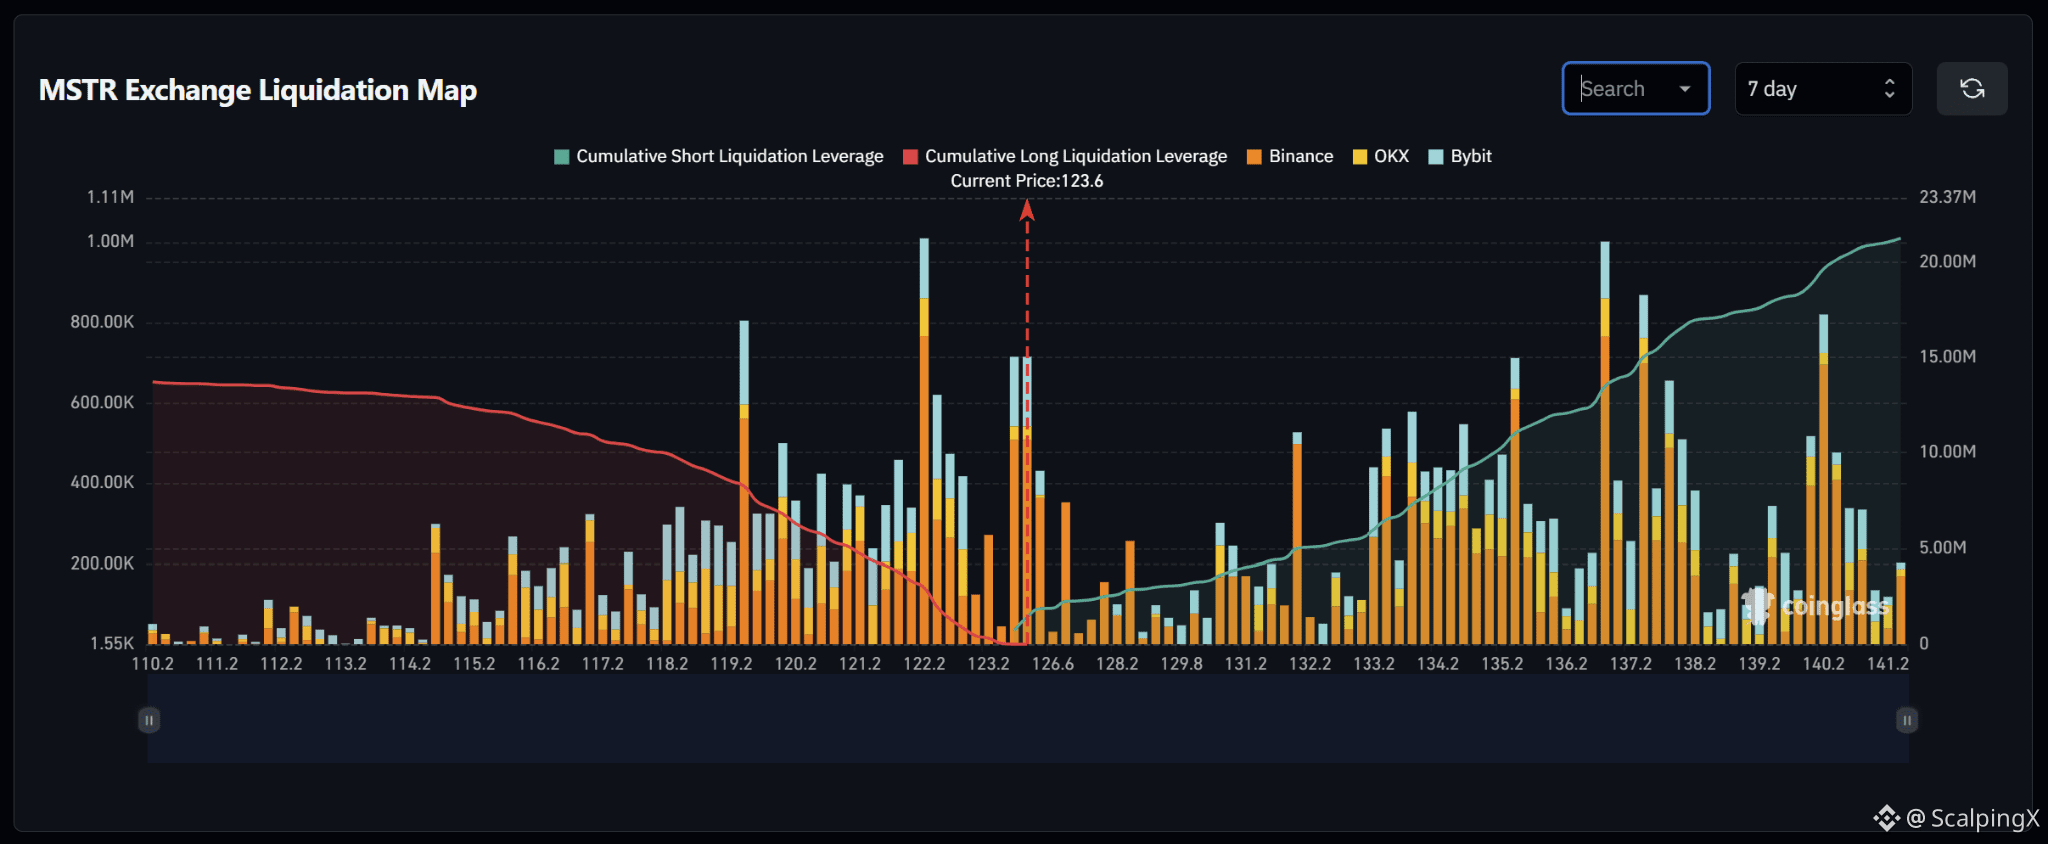
$MSTR – Mapa de liquidaciones (7 días) – Precio actual 123.6
🔎 El mapa de liquidaciones a 7 días muestra aproximadamente $20–21 millones en liquidaciones cortas por encima del precio actual, superando aproximadamente 13–14 millones en liquidaciones largas por debajo. La estructura de liquidez, por tanto, favorece la parte alcista, con alrededor de 1.5 veces más liquidez acumulada por encima del mercado.
📉 Por debajo del mercado, la liquidez cercana de liquidaciones largas se concentra alrededor de 123.2–122.2. El clúster más fuerte está cerca de 122.2, donde la barra de liquidación alcanza aproximadamente 1 millón, mientras que 119.2 también contiene un clúster grande cerca de $800,000. Perder 123.2 aumentaría la probabilidad de un barrido hacia 122.2.
📈 Por encima del mercado, la liquidez de liquidaciones cortas empieza a formarse alrededor de 124–126.6 antes de aumentar con fuerza a través de 133.2–137.2. La zona 136.2–137.2 destaca con barras de liquidación alrededor de $850,000–1 millón. Más lejos, el área 140.2 también contiene un clúster grande por encima de $800,000.
🧭 El escenario más amplio favorece la parte alcista porque la exposición a liquidaciones cortas por encima es aproximadamente 1.5 veces mayor. Romper 124–126.6 aumentaría la probabilidad de un movimiento hacia 133.2–137.2, mientras que perder 123.2 haría que la atención se desplace hacia 122.2.
#LiquidationMap
$MSTR – Mapa de liquidaciones (7 días) – Precio actual 123.6
🔎 El mapa de liquidaciones a 7 días muestra aproximadamente $20–21 millones en liquidaciones cortas por encima del precio actual, superando aproximadamente 13–14 millones en liquidaciones largas por debajo. La estructura de liquidez, por tanto, favorece la parte alcista, con alrededor de 1.5 veces más liquidez acumulada por encima del mercado.
📉 Por debajo del mercado, la liquidez cercana de liquidaciones largas se concentra alrededor de 123.2–122.2. El clúster más fuerte está cerca de 122.2, donde la barra de liquidación alcanza aproximadamente 1 millón, mientras que 119.2 también contiene un clúster grande cerca de $800,000. Perder 123.2 aumentaría la probabilidad de un barrido hacia 122.2.
📈 Por encima del mercado, la liquidez de liquidaciones cortas empieza a formarse alrededor de 124–126.6 antes de aumentar con fuerza a través de 133.2–137.2. La zona 136.2–137.2 destaca con barras de liquidación alrededor de $850,000–1 millón. Más lejos, el área 140.2 también contiene un clúster grande por encima de $800,000.
🧭 El escenario más amplio favorece la parte alcista porque la exposición a liquidaciones cortas por encima es aproximadamente 1.5 veces mayor. Romper 124–126.6 aumentaría la probabilidad de un movimiento hacia 133.2–137.2, mientras que perder 123.2 haría que la atención se desplace hacia 122.2.
#LiquidationMap
🔎 El mapa de liquidaciones a 7 días muestra aproximadamente $20–21 millones en liquidaciones cortas por encima del precio actual, superando aproximadamente 13–14 millones en liquidaciones largas por debajo. La estructura de liquidez, por tanto, favorece la parte alcista, con alrededor de 1.5 veces más liquidez acumulada por encima del mercado.
📉 Por debajo del mercado, la liquidez cercana de liquidaciones largas se concentra alrededor de 123.2–122.2. El clúster más fuerte está cerca de 122.2, donde la barra de liquidación alcanza aproximadamente 1 millón, mientras que 119.2 también contiene un clúster grande cerca de $800,000. Perder 123.2 aumentaría la probabilidad de un barrido hacia 122.2.
📈 Por encima del mercado, la liquidez de liquidaciones cortas empieza a formarse alrededor de 124–126.6 antes de aumentar con fuerza a través de 133.2–137.2. La zona 136.2–137.2 destaca con barras de liquidación alrededor de $850,000–1 millón. Más lejos, el área 140.2 también contiene un clúster grande por encima de $800,000.
🧭 El escenario más amplio favorece la parte alcista porque la exposición a liquidaciones cortas por encima es aproximadamente 1.5 veces mayor. Romper 124–126.6 aumentaría la probabilidad de un movimiento hacia 133.2–137.2, mientras que perder 123.2 haría que la atención se desplace hacia 122.2.
#LiquidationMap
9
·
--
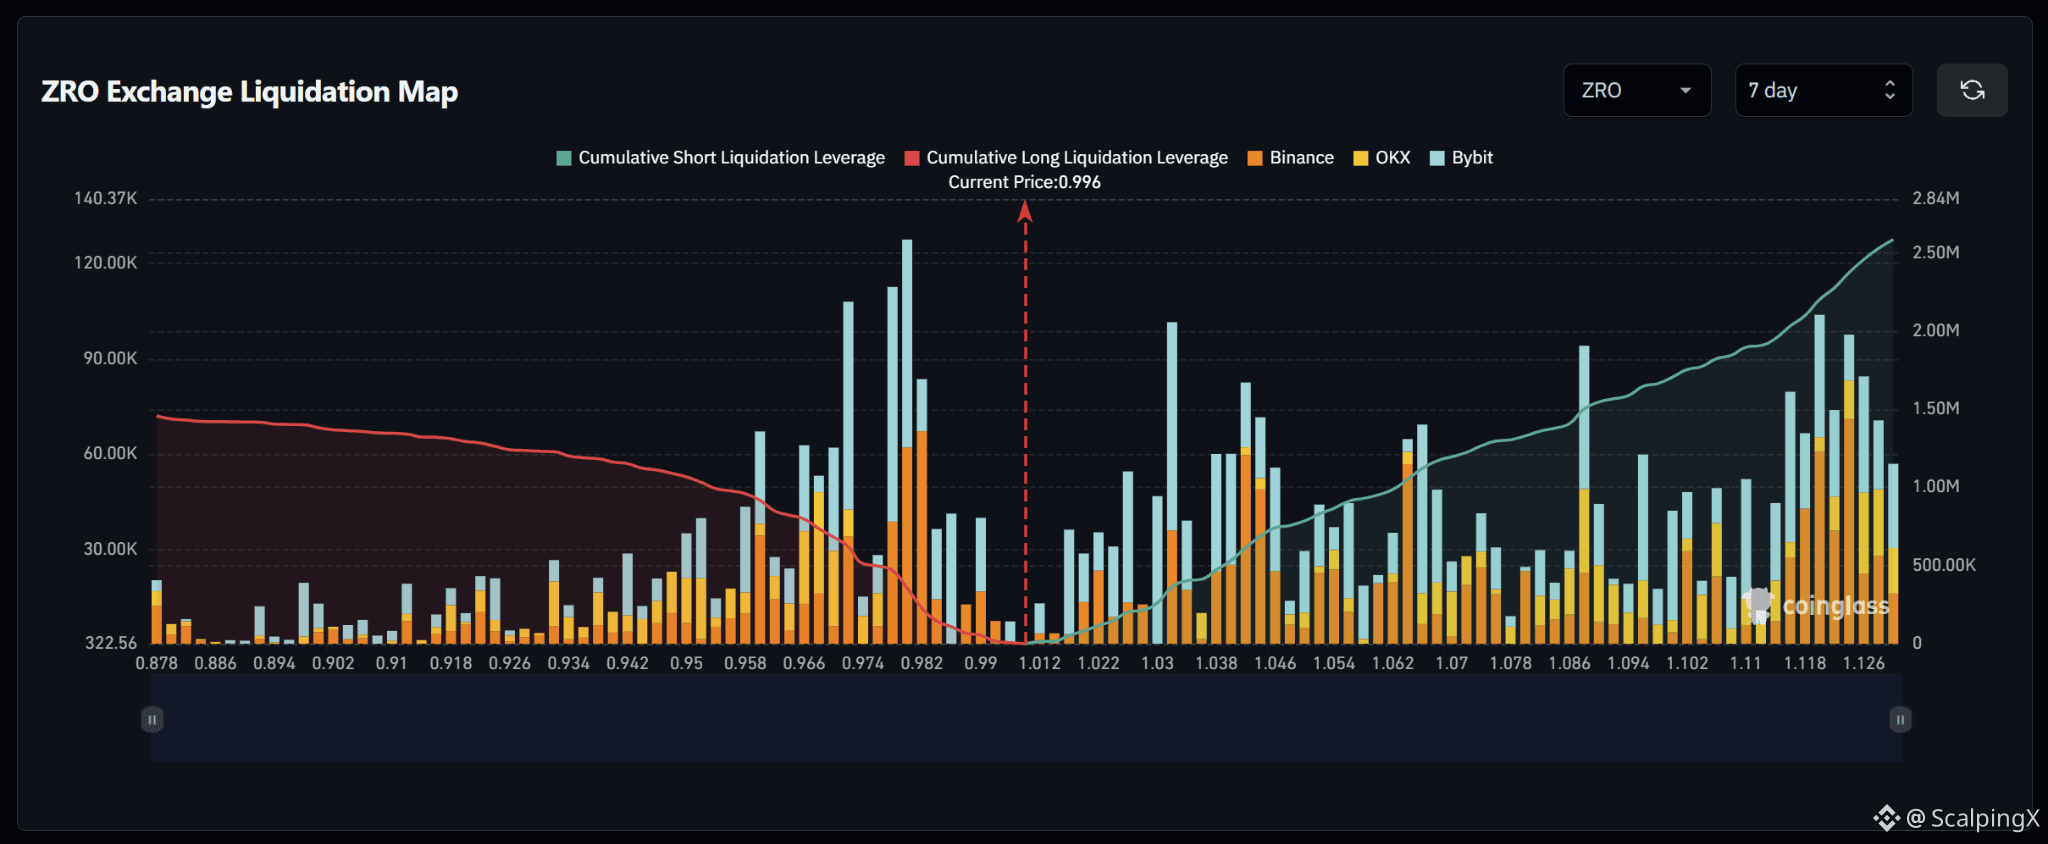
$ZRO – Mapa de Liquidación (7 Días) – Precio Actual 0.996
🔎 El mapa de liquidaciones de 7 días muestra aproximadamente $2.5 millones en liquidaciones cortas por encima del precio actual, superando aproximadamente $1.5 millones en liquidaciones largas por debajo. La estructura de liquidez, por lo tanto, favorece el alza, con alrededor de 1.6–1.7 veces más liquidez acumulada por encima del mercado.
📉 Por debajo del mercado, la liquidez cercana de liquidaciones largas se concentra alrededor de 0.982–0.966. El clúster más fuerte se sitúa cerca de 0.978–0.982, donde las barras de liquidación alcanzan aproximadamente $110,000–130,000, mientras que 0.966–0.974 también contiene liquidez destacada. Perder 0.982 desviaría la atención hacia 0.974–0.966.
📈 Por encima del mercado, la liquidez de liquidaciones cortas comienza a acumularse desde alrededor de 1.012 y aumenta a lo largo de 1.030–1.046. Más lejos, las zonas de 1.086 y especialmente 1.118–1.126 destacan, con varias barras alrededor de $90,000–105,000. Estas constituyen algunas de las zonas de liquidez alcista más notables.
🧭 La configuración general favorece el alza porque la exposición a liquidaciones cortas por encima es aproximadamente 1.6–1.7 veces mayor. Romper 1.012 incrementaría la probabilidad de un barrido hacia 1.030–1.046, mientras que perder 0.982 haría que la atención se desplace hacia 0.974–0.966.
#LiquidationMap
$ZRO – Mapa de Liquidación (7 Días) – Precio Actual 0.996
🔎 El mapa de liquidaciones de 7 días muestra aproximadamente $2.5 millones en liquidaciones cortas por encima del precio actual, superando aproximadamente $1.5 millones en liquidaciones largas por debajo. La estructura de liquidez, por lo tanto, favorece el alza, con alrededor de 1.6–1.7 veces más liquidez acumulada por encima del mercado.
📉 Por debajo del mercado, la liquidez cercana de liquidaciones largas se concentra alrededor de 0.982–0.966. El clúster más fuerte se sitúa cerca de 0.978–0.982, donde las barras de liquidación alcanzan aproximadamente $110,000–130,000, mientras que 0.966–0.974 también contiene liquidez destacada. Perder 0.982 desviaría la atención hacia 0.974–0.966.
📈 Por encima del mercado, la liquidez de liquidaciones cortas comienza a acumularse desde alrededor de 1.012 y aumenta a lo largo de 1.030–1.046. Más lejos, las zonas de 1.086 y especialmente 1.118–1.126 destacan, con varias barras alrededor de $90,000–105,000. Estas constituyen algunas de las zonas de liquidez alcista más notables.
🧭 La configuración general favorece el alza porque la exposición a liquidaciones cortas por encima es aproximadamente 1.6–1.7 veces mayor. Romper 1.012 incrementaría la probabilidad de un barrido hacia 1.030–1.046, mientras que perder 0.982 haría que la atención se desplace hacia 0.974–0.966.
#LiquidationMap
🔎 El mapa de liquidaciones de 7 días muestra aproximadamente $2.5 millones en liquidaciones cortas por encima del precio actual, superando aproximadamente $1.5 millones en liquidaciones largas por debajo. La estructura de liquidez, por lo tanto, favorece el alza, con alrededor de 1.6–1.7 veces más liquidez acumulada por encima del mercado.
📉 Por debajo del mercado, la liquidez cercana de liquidaciones largas se concentra alrededor de 0.982–0.966. El clúster más fuerte se sitúa cerca de 0.978–0.982, donde las barras de liquidación alcanzan aproximadamente $110,000–130,000, mientras que 0.966–0.974 también contiene liquidez destacada. Perder 0.982 desviaría la atención hacia 0.974–0.966.
📈 Por encima del mercado, la liquidez de liquidaciones cortas comienza a acumularse desde alrededor de 1.012 y aumenta a lo largo de 1.030–1.046. Más lejos, las zonas de 1.086 y especialmente 1.118–1.126 destacan, con varias barras alrededor de $90,000–105,000. Estas constituyen algunas de las zonas de liquidez alcista más notables.
🧭 La configuración general favorece el alza porque la exposición a liquidaciones cortas por encima es aproximadamente 1.6–1.7 veces mayor. Romper 1.012 incrementaría la probabilidad de un barrido hacia 1.030–1.046, mientras que perder 0.982 haría que la atención se desplace hacia 0.974–0.966.
#LiquidationMap
73
·
--
Alcista
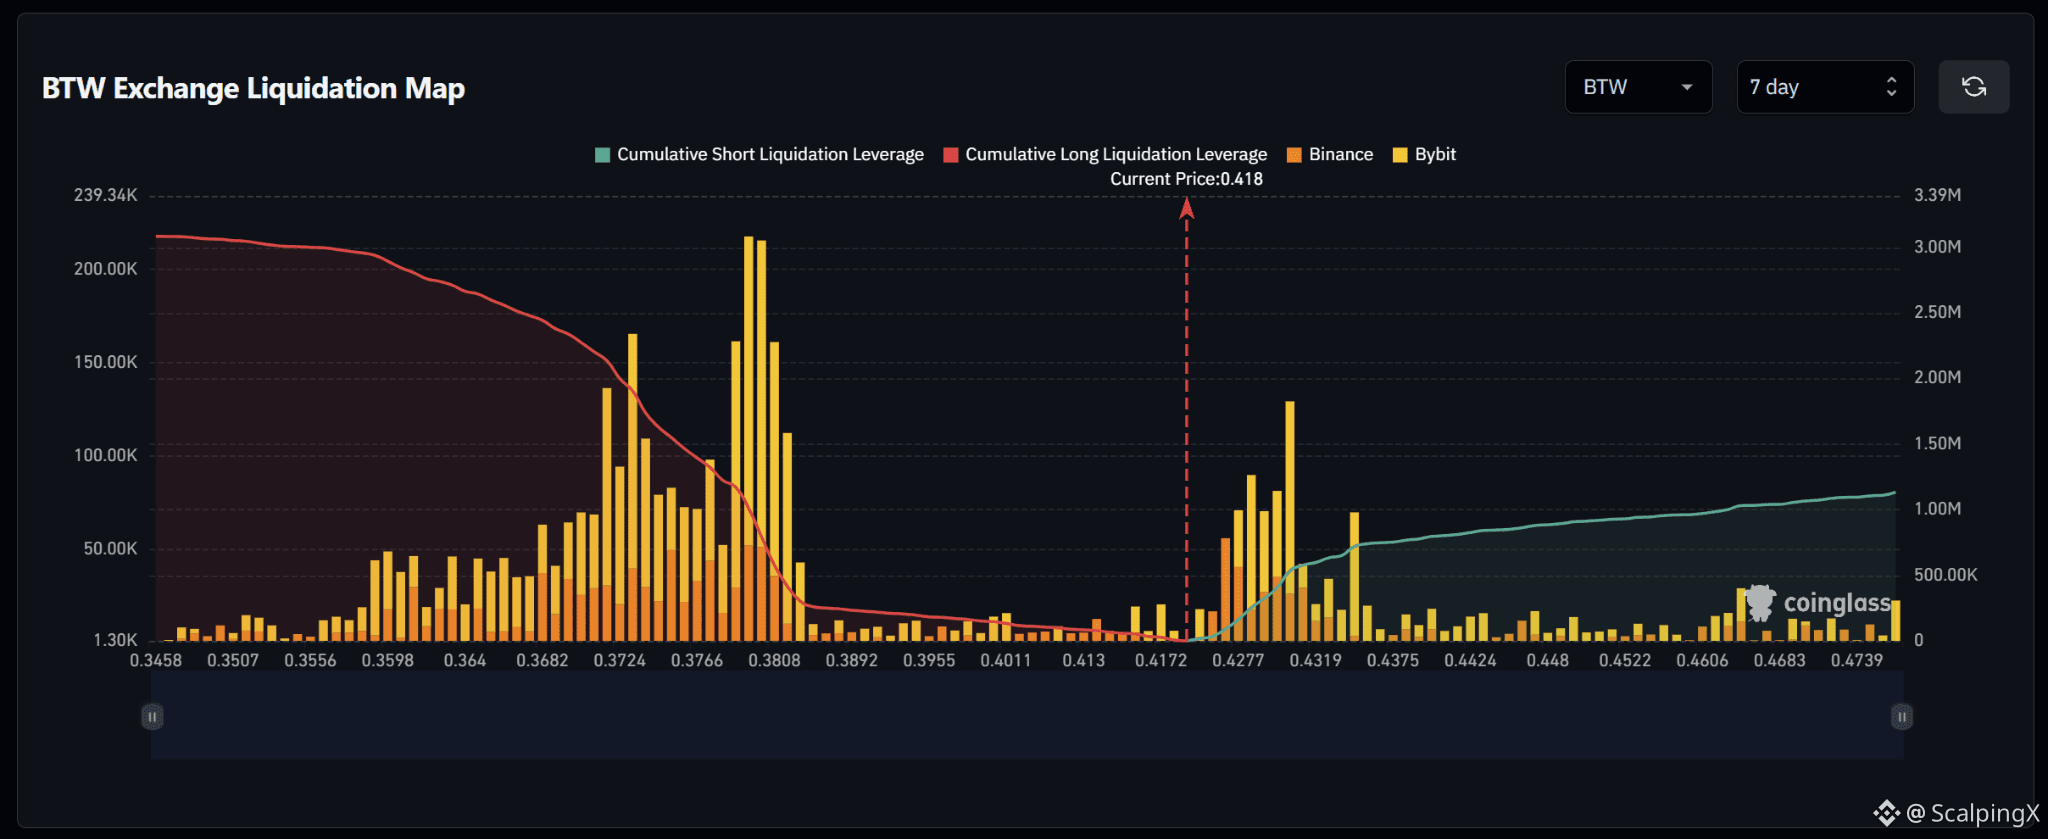
$BTW – Mapa de Liquidación (7 días) – Precio actual 0.418
🔎 El mapa de liquidaciones de 7 días muestra aproximadamente $3.1 millones en liquidaciones largas por debajo del precio actual, casi tres veces los aproximadamente $1.1 millones en liquidaciones cortas por encima. Por lo tanto, la estructura de liquidez favorece claramente la caída.
📉 Por debajo del mercado, la liquidez de liquidaciones largas cercana se mantiene relativamente escasa alrededor de 0.413–0.401 antes de aumentar con fuerza en 0.389–0.372. El clúster más fuerte está alrededor de 0.378–0.381, donde las barras de liquidación superan los $200,000, mientras que 0.372–0.377 también contiene una liquidez considerable. Perder 0.413 haría que gradualmente se centre la atención en 0.401–0.389.
📈 Por encima del mercado, la liquidez de liquidaciones cortas comienza a acumularse con claridad desde 0.4277 y aumenta a lo largo de 0.4319–0.4375. El clúster más fuerte está cerca de 0.4319, donde la barra de liquidación alcanza aproximadamente $130,000, mientras que 0.4277–0.4319 forma la zona más cercana y notable de liquidez alcista.
🧭 La configuración más amplia favorece la caída porque la exposición por liquidaciones largas por debajo es casi tres veces mayor. Perder 0.413 aumentaría la probabilidad de un barrido hacia 0.401–0.389, mientras que romper por encima de 0.4277 desplazaría la atención hacia 0.4319–0.4375.
#LiquidationMap
$BTW – Mapa de Liquidación (7 días) – Precio actual 0.418
🔎 El mapa de liquidaciones de 7 días muestra aproximadamente $3.1 millones en liquidaciones largas por debajo del precio actual, casi tres veces los aproximadamente $1.1 millones en liquidaciones cortas por encima. Por lo tanto, la estructura de liquidez favorece claramente la caída.
📉 Por debajo del mercado, la liquidez de liquidaciones largas cercana se mantiene relativamente escasa alrededor de 0.413–0.401 antes de aumentar con fuerza en 0.389–0.372. El clúster más fuerte está alrededor de 0.378–0.381, donde las barras de liquidación superan los $200,000, mientras que 0.372–0.377 también contiene una liquidez considerable. Perder 0.413 haría que gradualmente se centre la atención en 0.401–0.389.
📈 Por encima del mercado, la liquidez de liquidaciones cortas comienza a acumularse con claridad desde 0.4277 y aumenta a lo largo de 0.4319–0.4375. El clúster más fuerte está cerca de 0.4319, donde la barra de liquidación alcanza aproximadamente $130,000, mientras que 0.4277–0.4319 forma la zona más cercana y notable de liquidez alcista.
🧭 La configuración más amplia favorece la caída porque la exposición por liquidaciones largas por debajo es casi tres veces mayor. Perder 0.413 aumentaría la probabilidad de un barrido hacia 0.401–0.389, mientras que romper por encima de 0.4277 desplazaría la atención hacia 0.4319–0.4375.
#LiquidationMap
🔎 El mapa de liquidaciones de 7 días muestra aproximadamente $3.1 millones en liquidaciones largas por debajo del precio actual, casi tres veces los aproximadamente $1.1 millones en liquidaciones cortas por encima. Por lo tanto, la estructura de liquidez favorece claramente la caída.
📉 Por debajo del mercado, la liquidez de liquidaciones largas cercana se mantiene relativamente escasa alrededor de 0.413–0.401 antes de aumentar con fuerza en 0.389–0.372. El clúster más fuerte está alrededor de 0.378–0.381, donde las barras de liquidación superan los $200,000, mientras que 0.372–0.377 también contiene una liquidez considerable. Perder 0.413 haría que gradualmente se centre la atención en 0.401–0.389.
📈 Por encima del mercado, la liquidez de liquidaciones cortas comienza a acumularse con claridad desde 0.4277 y aumenta a lo largo de 0.4319–0.4375. El clúster más fuerte está cerca de 0.4319, donde la barra de liquidación alcanza aproximadamente $130,000, mientras que 0.4277–0.4319 forma la zona más cercana y notable de liquidez alcista.
🧭 La configuración más amplia favorece la caída porque la exposición por liquidaciones largas por debajo es casi tres veces mayor. Perder 0.413 aumentaría la probabilidad de un barrido hacia 0.401–0.389, mientras que romper por encima de 0.4277 desplazaría la atención hacia 0.4319–0.4375.
#LiquidationMap
8
·
--
Alcista
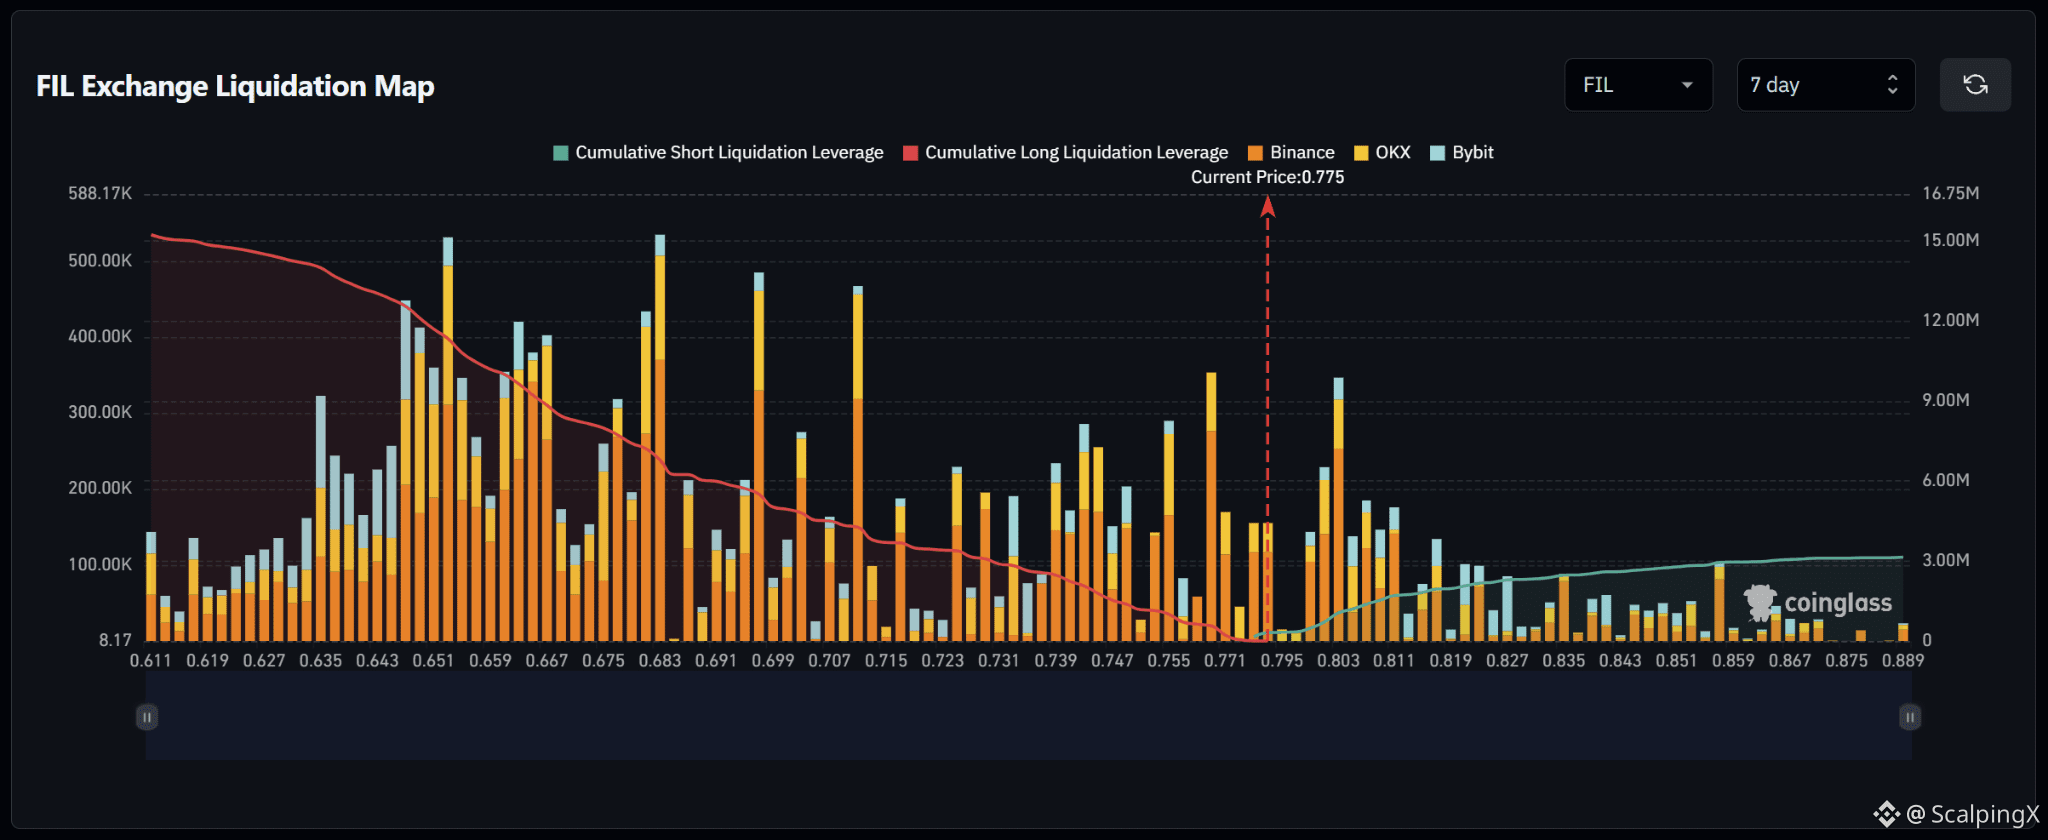
$FIL – Mapa de Liquidaciones (7 Días) – Precio Actual 0.775
🔎 El mapa de liquidaciones de 7 días muestra aproximadamente 15 millones de dólares en liquidaciones largas por debajo del precio actual, unas cinco veces las aproximadamente 3 millones de dólares en liquidaciones cortas por encima. Por lo tanto, la estructura de liquidez favorece claramente la baja.
📉 Por debajo del mercado, la liquidez de liquidaciones largas cercana se concentra alrededor de 0.771–0.747, con grupos notables cerca de 0.755 y 0.747. Más abajo, la liquidez aumenta bruscamente en el rango 0.707–0.683, mientras que 0.667–0.643 contiene varias barras grandes alrededor de 300,000–530,000 dólares. Perder 0.771 aumentaría la probabilidad de un barrido hacia 0.755–0.747.
📈 Por encima del mercado, la liquidez de liquidaciones cortas se mantiene relativamente escasa cerca del precio actual y se vuelve más visible a partir de aproximadamente 0.795. El clúster cercano más fuerte está cerca de 0.803, donde la barra de liquidación alcanza aproximadamente 340,000 dólares, seguido por 0.811–0.819. Más lejos, la liquidez alcista se vuelve significativamente más tenue.
🧭 La configuración general favorece fuertemente la baja porque la exposición a liquidaciones largas por debajo es aproximadamente cinco veces mayor. Perder 0.771 aumentaría la probabilidad de un barrido hacia 0.755–0.747, mientras que al romper por encima de 0.795 la atención se desplazaría hacia 0.803–0.811.
#LiquidationMap
$FIL – Mapa de Liquidaciones (7 Días) – Precio Actual 0.775
🔎 El mapa de liquidaciones de 7 días muestra aproximadamente 15 millones de dólares en liquidaciones largas por debajo del precio actual, unas cinco veces las aproximadamente 3 millones de dólares en liquidaciones cortas por encima. Por lo tanto, la estructura de liquidez favorece claramente la baja.
📉 Por debajo del mercado, la liquidez de liquidaciones largas cercana se concentra alrededor de 0.771–0.747, con grupos notables cerca de 0.755 y 0.747. Más abajo, la liquidez aumenta bruscamente en el rango 0.707–0.683, mientras que 0.667–0.643 contiene varias barras grandes alrededor de 300,000–530,000 dólares. Perder 0.771 aumentaría la probabilidad de un barrido hacia 0.755–0.747.
📈 Por encima del mercado, la liquidez de liquidaciones cortas se mantiene relativamente escasa cerca del precio actual y se vuelve más visible a partir de aproximadamente 0.795. El clúster cercano más fuerte está cerca de 0.803, donde la barra de liquidación alcanza aproximadamente 340,000 dólares, seguido por 0.811–0.819. Más lejos, la liquidez alcista se vuelve significativamente más tenue.
🧭 La configuración general favorece fuertemente la baja porque la exposición a liquidaciones largas por debajo es aproximadamente cinco veces mayor. Perder 0.771 aumentaría la probabilidad de un barrido hacia 0.755–0.747, mientras que al romper por encima de 0.795 la atención se desplazaría hacia 0.803–0.811.
#LiquidationMap
🔎 El mapa de liquidaciones de 7 días muestra aproximadamente 15 millones de dólares en liquidaciones largas por debajo del precio actual, unas cinco veces las aproximadamente 3 millones de dólares en liquidaciones cortas por encima. Por lo tanto, la estructura de liquidez favorece claramente la baja.
📉 Por debajo del mercado, la liquidez de liquidaciones largas cercana se concentra alrededor de 0.771–0.747, con grupos notables cerca de 0.755 y 0.747. Más abajo, la liquidez aumenta bruscamente en el rango 0.707–0.683, mientras que 0.667–0.643 contiene varias barras grandes alrededor de 300,000–530,000 dólares. Perder 0.771 aumentaría la probabilidad de un barrido hacia 0.755–0.747.
📈 Por encima del mercado, la liquidez de liquidaciones cortas se mantiene relativamente escasa cerca del precio actual y se vuelve más visible a partir de aproximadamente 0.795. El clúster cercano más fuerte está cerca de 0.803, donde la barra de liquidación alcanza aproximadamente 340,000 dólares, seguido por 0.811–0.819. Más lejos, la liquidez alcista se vuelve significativamente más tenue.
🧭 La configuración general favorece fuertemente la baja porque la exposición a liquidaciones largas por debajo es aproximadamente cinco veces mayor. Perder 0.771 aumentaría la probabilidad de un barrido hacia 0.755–0.747, mientras que al romper por encima de 0.795 la atención se desplazaría hacia 0.803–0.811.
#LiquidationMap
26
·
--
Alcista
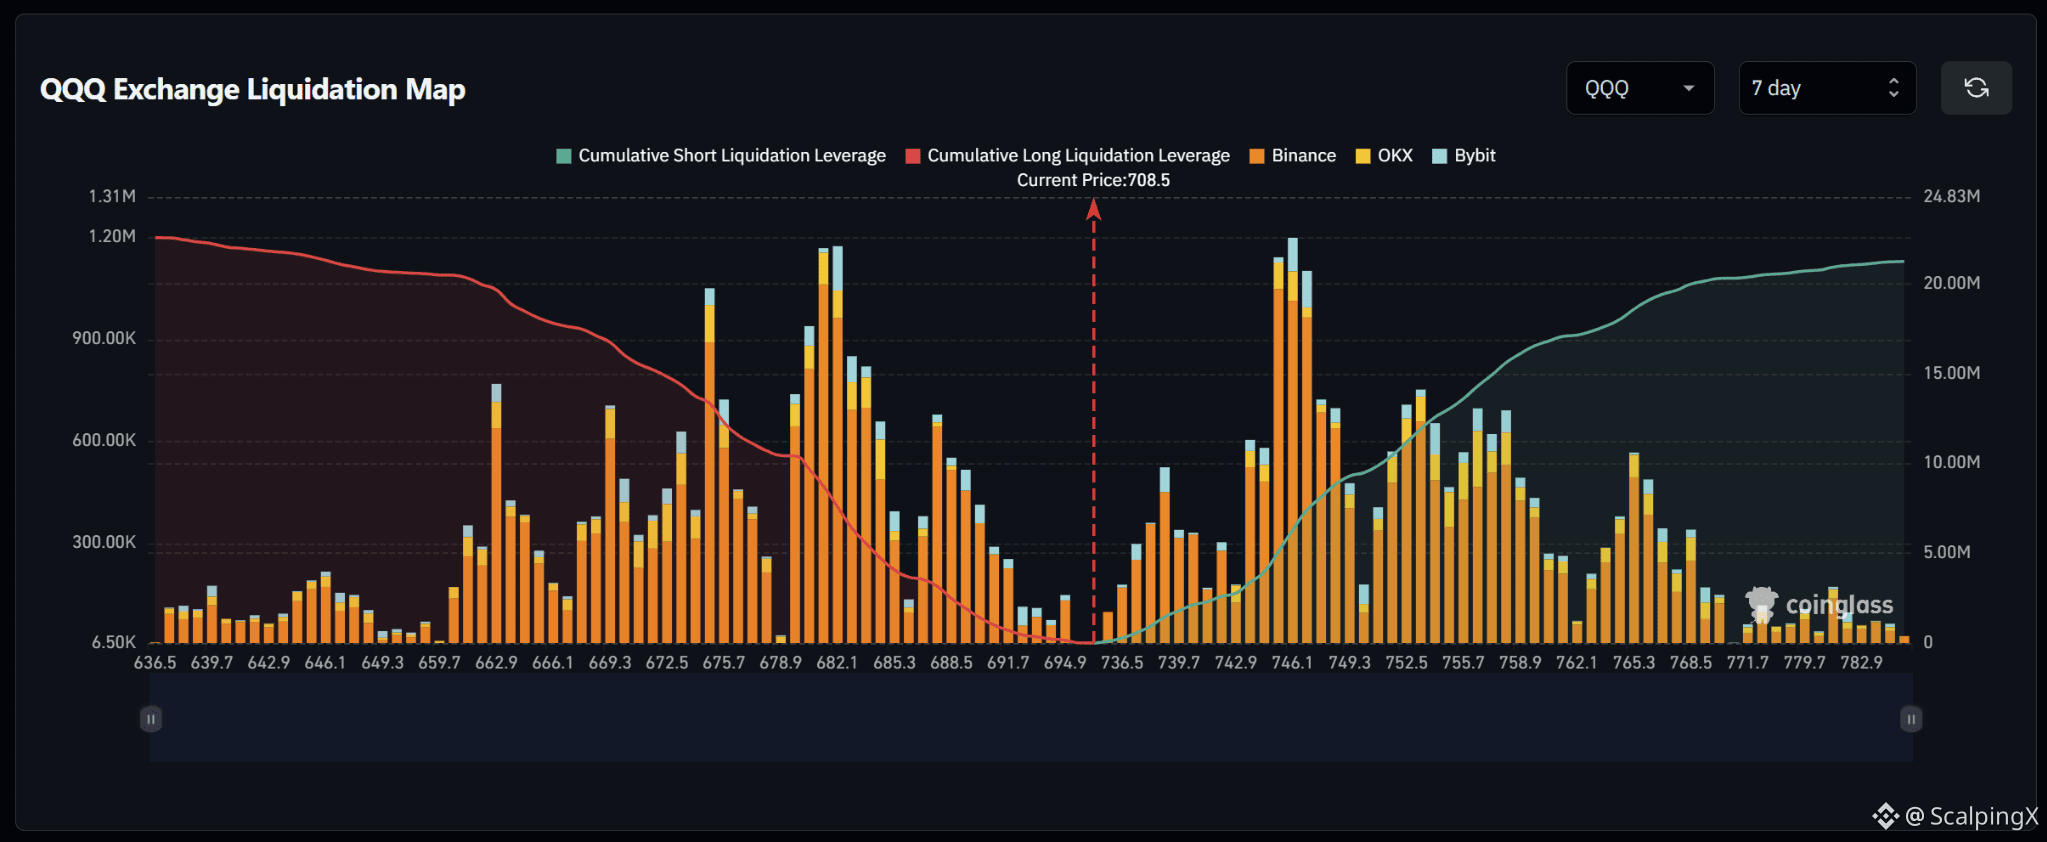
$QQQ – Mapa de liquidaciones (7 días) – Precio actual 708.5
🔎 El mapa de liquidaciones a 7 días muestra aproximadamente 22 millones de dólares en liquidaciones largas por debajo del precio actual, superando ligeramente los aproximadamente 21 millones de dólares en liquidaciones cortas por encima. Por lo tanto, la estructura general está bastante equilibrada, pero ligeramente inclinada hacia la baja.
📉 Debajo del mercado, la liquidez de liquidaciones largas se concentra fuertemente en 688.5–675.7. El clúster más fuerte está cerca de 682.1, donde la barra de liquidación se acerca a 1.2 millones de dólares; mientras que 675.7 y 662.9 también contienen clústeres grandes alrededor de 700,000–1 millón de dólares. Perder 694.9 haría que la atención se desplace hacia 688.5–682.1.
📈 Por encima del mercado, la liquidez significativa de liquidaciones cortas se hace más visible a partir de aproximadamente 736.5 y aumenta con fuerza a través de 742.9–749.3. El clúster más fuerte está cerca de 746.1, donde la barra de liquidación se acerca a 1.2 millones de dólares. Más afuera, 752.5–758.9 también contiene varios clústeres de 500,000–750,000.
🧭 La configuración más amplia sigue siendo relativamente equilibrada, pero favorece modestamente la baja. Perder 694.9 aumentaría la probabilidad de un barrido hacia 688.5–682.1, mientras que un movimiento por encima de 736.5 desplazaría la atención hacia 742.9–749.3.
#LiquidationMap
$QQQ – Mapa de liquidaciones (7 días) – Precio actual 708.5
🔎 El mapa de liquidaciones a 7 días muestra aproximadamente 22 millones de dólares en liquidaciones largas por debajo del precio actual, superando ligeramente los aproximadamente 21 millones de dólares en liquidaciones cortas por encima. Por lo tanto, la estructura general está bastante equilibrada, pero ligeramente inclinada hacia la baja.
📉 Debajo del mercado, la liquidez de liquidaciones largas se concentra fuertemente en 688.5–675.7. El clúster más fuerte está cerca de 682.1, donde la barra de liquidación se acerca a 1.2 millones de dólares; mientras que 675.7 y 662.9 también contienen clústeres grandes alrededor de 700,000–1 millón de dólares. Perder 694.9 haría que la atención se desplace hacia 688.5–682.1.
📈 Por encima del mercado, la liquidez significativa de liquidaciones cortas se hace más visible a partir de aproximadamente 736.5 y aumenta con fuerza a través de 742.9–749.3. El clúster más fuerte está cerca de 746.1, donde la barra de liquidación se acerca a 1.2 millones de dólares. Más afuera, 752.5–758.9 también contiene varios clústeres de 500,000–750,000.
🧭 La configuración más amplia sigue siendo relativamente equilibrada, pero favorece modestamente la baja. Perder 694.9 aumentaría la probabilidad de un barrido hacia 688.5–682.1, mientras que un movimiento por encima de 736.5 desplazaría la atención hacia 742.9–749.3.
#LiquidationMap
🔎 El mapa de liquidaciones a 7 días muestra aproximadamente 22 millones de dólares en liquidaciones largas por debajo del precio actual, superando ligeramente los aproximadamente 21 millones de dólares en liquidaciones cortas por encima. Por lo tanto, la estructura general está bastante equilibrada, pero ligeramente inclinada hacia la baja.
📉 Debajo del mercado, la liquidez de liquidaciones largas se concentra fuertemente en 688.5–675.7. El clúster más fuerte está cerca de 682.1, donde la barra de liquidación se acerca a 1.2 millones de dólares; mientras que 675.7 y 662.9 también contienen clústeres grandes alrededor de 700,000–1 millón de dólares. Perder 694.9 haría que la atención se desplace hacia 688.5–682.1.
📈 Por encima del mercado, la liquidez significativa de liquidaciones cortas se hace más visible a partir de aproximadamente 736.5 y aumenta con fuerza a través de 742.9–749.3. El clúster más fuerte está cerca de 746.1, donde la barra de liquidación se acerca a 1.2 millones de dólares. Más afuera, 752.5–758.9 también contiene varios clústeres de 500,000–750,000.
🧭 La configuración más amplia sigue siendo relativamente equilibrada, pero favorece modestamente la baja. Perder 694.9 aumentaría la probabilidad de un barrido hacia 688.5–682.1, mientras que un movimiento por encima de 736.5 desplazaría la atención hacia 742.9–749.3.
#LiquidationMap
13
·
--
Alcista
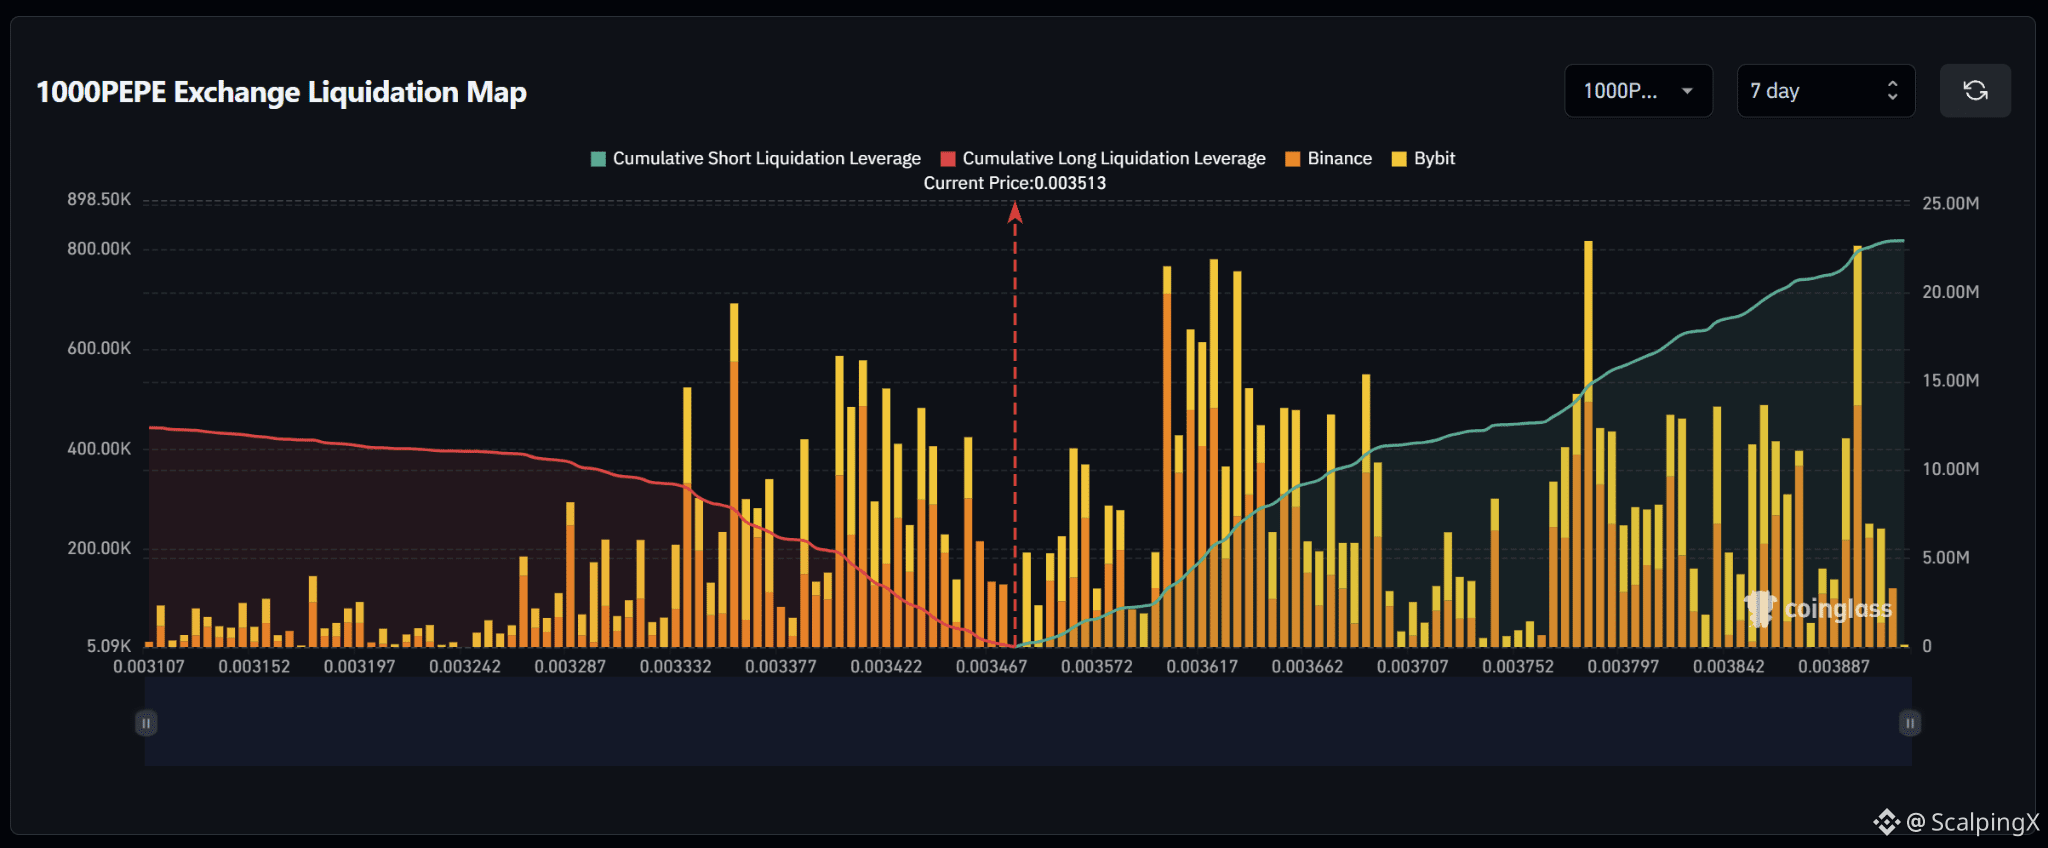
$PEPE – Mapa de Liquidaciones (7 Días) – Precio Actual 0.003513
🔎 El mapa de liquidaciones a 7 días muestra aproximadamente $22–23 millones en liquidaciones cortas por encima del precio actual, casi el doble de los aproximadamente $12 millones en liquidaciones largas por debajo. La estructura de liquidez, por lo tanto, favorece claramente la subida, con aproximadamente 1.8–1.9 veces más liquidez acumulada por encima del mercado.
📉 Por debajo del mercado, la liquidez cercana de liquidaciones largas se concentra alrededor de 0.003467–0.003377. Aparecen clústeres notables alrededor de 0.003422–0.003377, con varias barras de liquidación que alcanzan aproximadamente $400,000–600,000. Más abajo, la zona de 0.003332 también contiene un gran clúster cerca de $500,000. Perder 0.003467 haría que la atención se desplace hacia 0.003422–0.003377.
📈 Por encima del mercado, la liquidez de liquidaciones cortas comienza a formarse alrededor de 0.003572 y aumenta con fuerza entre 0.00360–0.00366, donde varias barras alcanzan aproximadamente $600,000–780,000. Más lejos, 0.003797 y 0.003887 destacan con barras cercanas a $800,000, formando algunos de los clústeres de subida más grandes.
🧭 El panorama más amplio favorece la subida porque la exposición a liquidaciones cortas por encima es casi el doble. Romper 0.003572 aumentaría la probabilidad de un barrido hacia 0.00360–0.00366, mientras que perder 0.003467 haría que la atención se desplace hacia 0.003422–0.003377.
#LiquidationMap
$PEPE – Mapa de Liquidaciones (7 Días) – Precio Actual 0.003513
🔎 El mapa de liquidaciones a 7 días muestra aproximadamente $22–23 millones en liquidaciones cortas por encima del precio actual, casi el doble de los aproximadamente $12 millones en liquidaciones largas por debajo. La estructura de liquidez, por lo tanto, favorece claramente la subida, con aproximadamente 1.8–1.9 veces más liquidez acumulada por encima del mercado.
📉 Por debajo del mercado, la liquidez cercana de liquidaciones largas se concentra alrededor de 0.003467–0.003377. Aparecen clústeres notables alrededor de 0.003422–0.003377, con varias barras de liquidación que alcanzan aproximadamente $400,000–600,000. Más abajo, la zona de 0.003332 también contiene un gran clúster cerca de $500,000. Perder 0.003467 haría que la atención se desplace hacia 0.003422–0.003377.
📈 Por encima del mercado, la liquidez de liquidaciones cortas comienza a formarse alrededor de 0.003572 y aumenta con fuerza entre 0.00360–0.00366, donde varias barras alcanzan aproximadamente $600,000–780,000. Más lejos, 0.003797 y 0.003887 destacan con barras cercanas a $800,000, formando algunos de los clústeres de subida más grandes.
🧭 El panorama más amplio favorece la subida porque la exposición a liquidaciones cortas por encima es casi el doble. Romper 0.003572 aumentaría la probabilidad de un barrido hacia 0.00360–0.00366, mientras que perder 0.003467 haría que la atención se desplace hacia 0.003422–0.003377.
#LiquidationMap
🔎 El mapa de liquidaciones a 7 días muestra aproximadamente $22–23 millones en liquidaciones cortas por encima del precio actual, casi el doble de los aproximadamente $12 millones en liquidaciones largas por debajo. La estructura de liquidez, por lo tanto, favorece claramente la subida, con aproximadamente 1.8–1.9 veces más liquidez acumulada por encima del mercado.
📉 Por debajo del mercado, la liquidez cercana de liquidaciones largas se concentra alrededor de 0.003467–0.003377. Aparecen clústeres notables alrededor de 0.003422–0.003377, con varias barras de liquidación que alcanzan aproximadamente $400,000–600,000. Más abajo, la zona de 0.003332 también contiene un gran clúster cerca de $500,000. Perder 0.003467 haría que la atención se desplace hacia 0.003422–0.003377.
📈 Por encima del mercado, la liquidez de liquidaciones cortas comienza a formarse alrededor de 0.003572 y aumenta con fuerza entre 0.00360–0.00366, donde varias barras alcanzan aproximadamente $600,000–780,000. Más lejos, 0.003797 y 0.003887 destacan con barras cercanas a $800,000, formando algunos de los clústeres de subida más grandes.
🧭 El panorama más amplio favorece la subida porque la exposición a liquidaciones cortas por encima es casi el doble. Romper 0.003572 aumentaría la probabilidad de un barrido hacia 0.00360–0.00366, mientras que perder 0.003467 haría que la atención se desplace hacia 0.003422–0.003377.
#LiquidationMap
1
22
·
--
Alcista
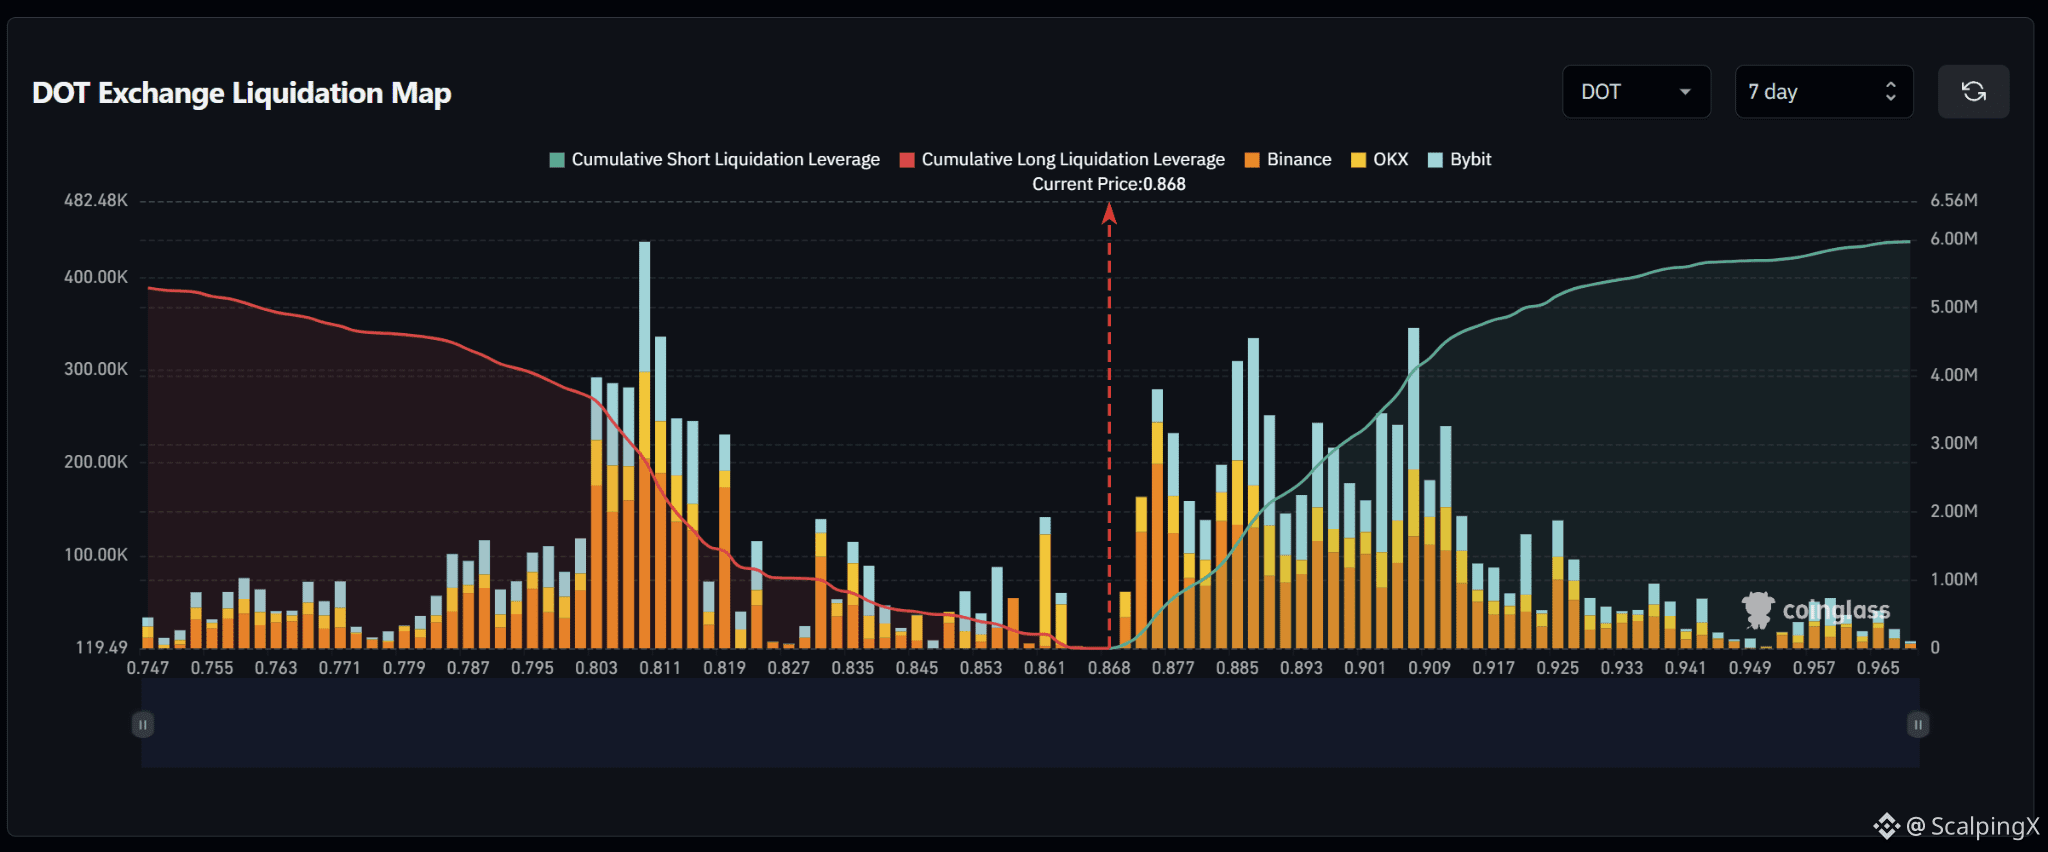
$DOT – Mapa de Liquidación (7 días) – Precio Actual 0.868
🔎 El mapa de liquidaciones de 7 días muestra aproximadamente $6 millones en liquidaciones cortas por encima del precio actual, superando ligeramente aproximadamente $5.3 millones en liquidaciones largas por debajo. La estructura general está, por lo tanto, bastante equilibrada pero con una ligera inclinación al alza.
📉 Por debajo del mercado, la liquidez de liquidaciones largas cercana se mantiene relativamente delgada alrededor de 0.861–0.845 antes de aumentar en el rango 0.835–0.803. El clúster más fuerte está cerca de 0.811, donde la barra de liquidación supera los $400,000, mientras que 0.803–0.819 también contiene varios clústeres de $200,000–300,000. Perder 0.861 desplazaría el foco hacia 0.853–0.835.
📈 Por encima del mercado, la liquidez de liquidaciones cortas empieza a acumularse alrededor de 0.877 y se vuelve mucho más densa en 0.885–0.909. Los clústeres más fuertes cerca de 0.885 y 0.909 alcanzan aproximadamente $300,000–350,000. Más allá, 0.917–0.925 también contiene una liquidez destacable.
🧭 La configuración más amplia favorece modestamente la subida porque la exposición a liquidaciones cortas por encima es mayor. Romper 0.877 incrementaría la probabilidad de un barrido hacia 0.885–0.909, mientras que perder 0.861 desplazaría el foco hacia 0.853–0.835.
#LiquidationMap
$DOT – Mapa de Liquidación (7 días) – Precio Actual 0.868
🔎 El mapa de liquidaciones de 7 días muestra aproximadamente $6 millones en liquidaciones cortas por encima del precio actual, superando ligeramente aproximadamente $5.3 millones en liquidaciones largas por debajo. La estructura general está, por lo tanto, bastante equilibrada pero con una ligera inclinación al alza.
📉 Por debajo del mercado, la liquidez de liquidaciones largas cercana se mantiene relativamente delgada alrededor de 0.861–0.845 antes de aumentar en el rango 0.835–0.803. El clúster más fuerte está cerca de 0.811, donde la barra de liquidación supera los $400,000, mientras que 0.803–0.819 también contiene varios clústeres de $200,000–300,000. Perder 0.861 desplazaría el foco hacia 0.853–0.835.
📈 Por encima del mercado, la liquidez de liquidaciones cortas empieza a acumularse alrededor de 0.877 y se vuelve mucho más densa en 0.885–0.909. Los clústeres más fuertes cerca de 0.885 y 0.909 alcanzan aproximadamente $300,000–350,000. Más allá, 0.917–0.925 también contiene una liquidez destacable.
🧭 La configuración más amplia favorece modestamente la subida porque la exposición a liquidaciones cortas por encima es mayor. Romper 0.877 incrementaría la probabilidad de un barrido hacia 0.885–0.909, mientras que perder 0.861 desplazaría el foco hacia 0.853–0.835.
#LiquidationMap
🔎 El mapa de liquidaciones de 7 días muestra aproximadamente $6 millones en liquidaciones cortas por encima del precio actual, superando ligeramente aproximadamente $5.3 millones en liquidaciones largas por debajo. La estructura general está, por lo tanto, bastante equilibrada pero con una ligera inclinación al alza.
📉 Por debajo del mercado, la liquidez de liquidaciones largas cercana se mantiene relativamente delgada alrededor de 0.861–0.845 antes de aumentar en el rango 0.835–0.803. El clúster más fuerte está cerca de 0.811, donde la barra de liquidación supera los $400,000, mientras que 0.803–0.819 también contiene varios clústeres de $200,000–300,000. Perder 0.861 desplazaría el foco hacia 0.853–0.835.
📈 Por encima del mercado, la liquidez de liquidaciones cortas empieza a acumularse alrededor de 0.877 y se vuelve mucho más densa en 0.885–0.909. Los clústeres más fuertes cerca de 0.885 y 0.909 alcanzan aproximadamente $300,000–350,000. Más allá, 0.917–0.925 también contiene una liquidez destacable.
🧭 La configuración más amplia favorece modestamente la subida porque la exposición a liquidaciones cortas por encima es mayor. Romper 0.877 incrementaría la probabilidad de un barrido hacia 0.885–0.909, mientras que perder 0.861 desplazaría el foco hacia 0.853–0.835.
#LiquidationMap
35
·
--
Alcista
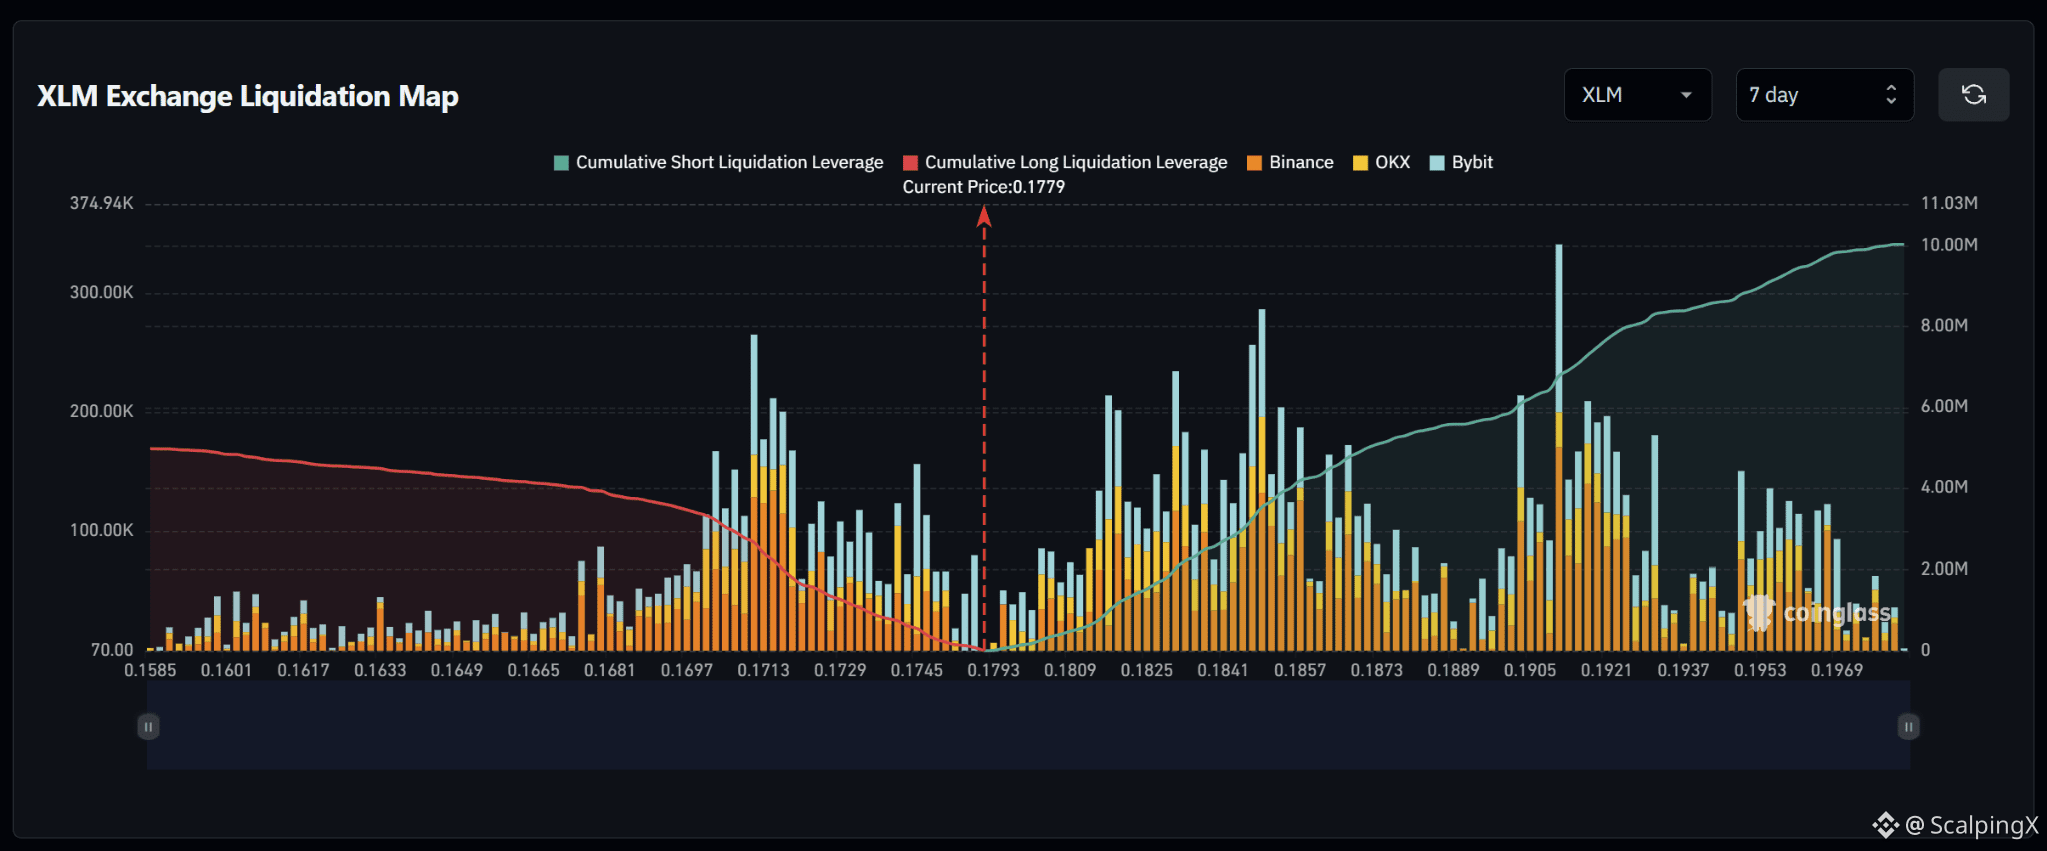
$XLM – Mapa de Liquidación (7 Días) – Precio Actual 0.1779
🔎 El mapa de liquidaciones de 7 días muestra aproximadamente $10 millones en liquidaciones cortas por encima del precio actual, casi el doble de los aproximadamente $5 millones en liquidaciones largas por debajo. Por lo tanto, la estructura de liquidez favorece claramente la subida.
📉 Debajo del mercado, la liquidez cercana de liquidaciones largas se concentra alrededor de 0.1745–0.1713. El clúster más fuerte está cerca de 0.1713, donde la barra de liquidación alcanza aproximadamente $250,000–270,000, mientras que 0.1697–0.1681 también contiene liquidez notable. Perder 0.1745 aumentaría la probabilidad de un barrido hacia 0.1729–0.1713.
📈 Por encima del mercado, la liquidez de liquidaciones cortas empieza a acumularse alrededor de 0.1809 y se vuelve más densa a través de 0.1825–0.1857. Más lejos, 0.1905–0.1921 destaca con mayor claridad, con la barra más grande cerca de 0.1905 superando los $300,000. Una ruptura por encima de 0.1809 pondría primero en foco 0.1825–0.1857.
🧭 El panorama general favorece la subida porque la exposición por encima en liquidaciones cortas es casi el doble. Romper 0.1809 aumentaría la probabilidad de un barrido hacia 0.1825–0.1857, mientras que perder 0.1745 desplazaría la atención hacia 0.1729–0.1713.
#LiquidationMap
$XLM – Mapa de Liquidación (7 Días) – Precio Actual 0.1779
🔎 El mapa de liquidaciones de 7 días muestra aproximadamente $10 millones en liquidaciones cortas por encima del precio actual, casi el doble de los aproximadamente $5 millones en liquidaciones largas por debajo. Por lo tanto, la estructura de liquidez favorece claramente la subida.
📉 Debajo del mercado, la liquidez cercana de liquidaciones largas se concentra alrededor de 0.1745–0.1713. El clúster más fuerte está cerca de 0.1713, donde la barra de liquidación alcanza aproximadamente $250,000–270,000, mientras que 0.1697–0.1681 también contiene liquidez notable. Perder 0.1745 aumentaría la probabilidad de un barrido hacia 0.1729–0.1713.
📈 Por encima del mercado, la liquidez de liquidaciones cortas empieza a acumularse alrededor de 0.1809 y se vuelve más densa a través de 0.1825–0.1857. Más lejos, 0.1905–0.1921 destaca con mayor claridad, con la barra más grande cerca de 0.1905 superando los $300,000. Una ruptura por encima de 0.1809 pondría primero en foco 0.1825–0.1857.
🧭 El panorama general favorece la subida porque la exposición por encima en liquidaciones cortas es casi el doble. Romper 0.1809 aumentaría la probabilidad de un barrido hacia 0.1825–0.1857, mientras que perder 0.1745 desplazaría la atención hacia 0.1729–0.1713.
#LiquidationMap
🔎 El mapa de liquidaciones de 7 días muestra aproximadamente $10 millones en liquidaciones cortas por encima del precio actual, casi el doble de los aproximadamente $5 millones en liquidaciones largas por debajo. Por lo tanto, la estructura de liquidez favorece claramente la subida.
📉 Debajo del mercado, la liquidez cercana de liquidaciones largas se concentra alrededor de 0.1745–0.1713. El clúster más fuerte está cerca de 0.1713, donde la barra de liquidación alcanza aproximadamente $250,000–270,000, mientras que 0.1697–0.1681 también contiene liquidez notable. Perder 0.1745 aumentaría la probabilidad de un barrido hacia 0.1729–0.1713.
📈 Por encima del mercado, la liquidez de liquidaciones cortas empieza a acumularse alrededor de 0.1809 y se vuelve más densa a través de 0.1825–0.1857. Más lejos, 0.1905–0.1921 destaca con mayor claridad, con la barra más grande cerca de 0.1905 superando los $300,000. Una ruptura por encima de 0.1809 pondría primero en foco 0.1825–0.1857.
🧭 El panorama general favorece la subida porque la exposición por encima en liquidaciones cortas es casi el doble. Romper 0.1809 aumentaría la probabilidad de un barrido hacia 0.1825–0.1857, mientras que perder 0.1745 desplazaría la atención hacia 0.1729–0.1713.
#LiquidationMap
18
·
--
Alcista
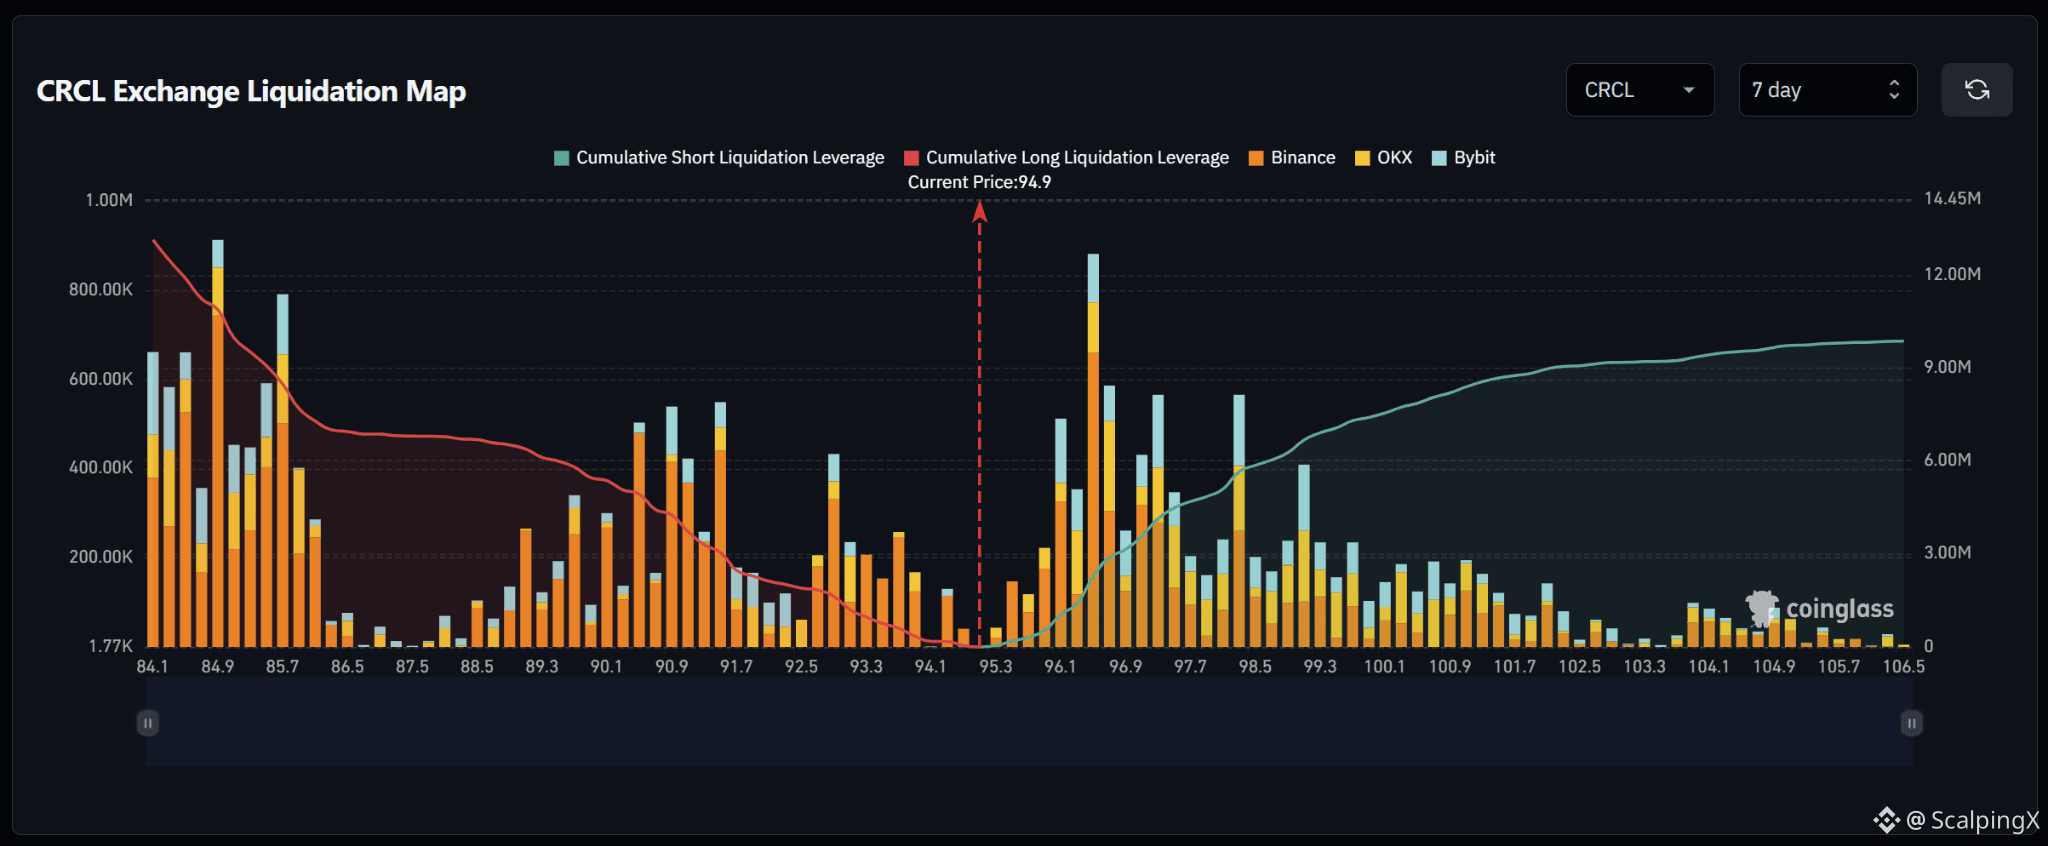
$CRCL – Mapa de Liquidaciones (7 Días) – Precio Actual 94.9
🔎 El mapa de liquidaciones de 7 días muestra aproximadamente $13 millones en liquidaciones largas por debajo del precio actual, superando alrededor de $9–10 millones en liquidaciones cortas por encima. La estructura de liquidez, por tanto, favorece la caída, con aproximadamente 1.3–1.4 veces más liquidez acumulada ubicada por debajo del mercado.
📉 Por debajo del mercado, la liquidez cercana de liquidaciones largas se mantiene relativamente delgada alrededor de 94.1 antes de aumentar en 93.3–92.5. Más abajo, 91.7–90.1 contiene varios grupos alrededor de $300,000–550,000. Perder 94.1 incrementaría la probabilidad de un barrido hacia 93.3–92.5.
📈 Por encima del mercado, la liquidez de liquidaciones cortas comienza a acumularse alrededor de 95.3–96.1 y aumenta con fuerza en 96.1–96.9. El grupo más fuerte cercano se sitúa alrededor de 96.5, donde la barra de liquidación se aproxima a $900,000. Más lejos, 97.7–99.3 también contiene liquidez notable. Una ruptura por encima de 95.3 pondría primero en el foco 96.1–96.9.
🧭 El escenario general favorece moderadamente la parte bajista porque la exposición a liquidaciones largas por debajo es aproximadamente 1.3–1.4 veces mayor. Perder 94.1 aumentaría la probabilidad de un barrido hacia 93.3–92.5, mientras que romper por encima de 95.3 desplazaría la atención hacia 96.1–96.9.
#LiquidationMap
$CRCL – Mapa de Liquidaciones (7 Días) – Precio Actual 94.9
🔎 El mapa de liquidaciones de 7 días muestra aproximadamente $13 millones en liquidaciones largas por debajo del precio actual, superando alrededor de $9–10 millones en liquidaciones cortas por encima. La estructura de liquidez, por tanto, favorece la caída, con aproximadamente 1.3–1.4 veces más liquidez acumulada ubicada por debajo del mercado.
📉 Por debajo del mercado, la liquidez cercana de liquidaciones largas se mantiene relativamente delgada alrededor de 94.1 antes de aumentar en 93.3–92.5. Más abajo, 91.7–90.1 contiene varios grupos alrededor de $300,000–550,000. Perder 94.1 incrementaría la probabilidad de un barrido hacia 93.3–92.5.
📈 Por encima del mercado, la liquidez de liquidaciones cortas comienza a acumularse alrededor de 95.3–96.1 y aumenta con fuerza en 96.1–96.9. El grupo más fuerte cercano se sitúa alrededor de 96.5, donde la barra de liquidación se aproxima a $900,000. Más lejos, 97.7–99.3 también contiene liquidez notable. Una ruptura por encima de 95.3 pondría primero en el foco 96.1–96.9.
🧭 El escenario general favorece moderadamente la parte bajista porque la exposición a liquidaciones largas por debajo es aproximadamente 1.3–1.4 veces mayor. Perder 94.1 aumentaría la probabilidad de un barrido hacia 93.3–92.5, mientras que romper por encima de 95.3 desplazaría la atención hacia 96.1–96.9.
#LiquidationMap
🔎 El mapa de liquidaciones de 7 días muestra aproximadamente $13 millones en liquidaciones largas por debajo del precio actual, superando alrededor de $9–10 millones en liquidaciones cortas por encima. La estructura de liquidez, por tanto, favorece la caída, con aproximadamente 1.3–1.4 veces más liquidez acumulada ubicada por debajo del mercado.
📉 Por debajo del mercado, la liquidez cercana de liquidaciones largas se mantiene relativamente delgada alrededor de 94.1 antes de aumentar en 93.3–92.5. Más abajo, 91.7–90.1 contiene varios grupos alrededor de $300,000–550,000. Perder 94.1 incrementaría la probabilidad de un barrido hacia 93.3–92.5.
📈 Por encima del mercado, la liquidez de liquidaciones cortas comienza a acumularse alrededor de 95.3–96.1 y aumenta con fuerza en 96.1–96.9. El grupo más fuerte cercano se sitúa alrededor de 96.5, donde la barra de liquidación se aproxima a $900,000. Más lejos, 97.7–99.3 también contiene liquidez notable. Una ruptura por encima de 95.3 pondría primero en el foco 96.1–96.9.
🧭 El escenario general favorece moderadamente la parte bajista porque la exposición a liquidaciones largas por debajo es aproximadamente 1.3–1.4 veces mayor. Perder 94.1 aumentaría la probabilidad de un barrido hacia 93.3–92.5, mientras que romper por encima de 95.3 desplazaría la atención hacia 96.1–96.9.
#LiquidationMap
14
·
--
Alcista
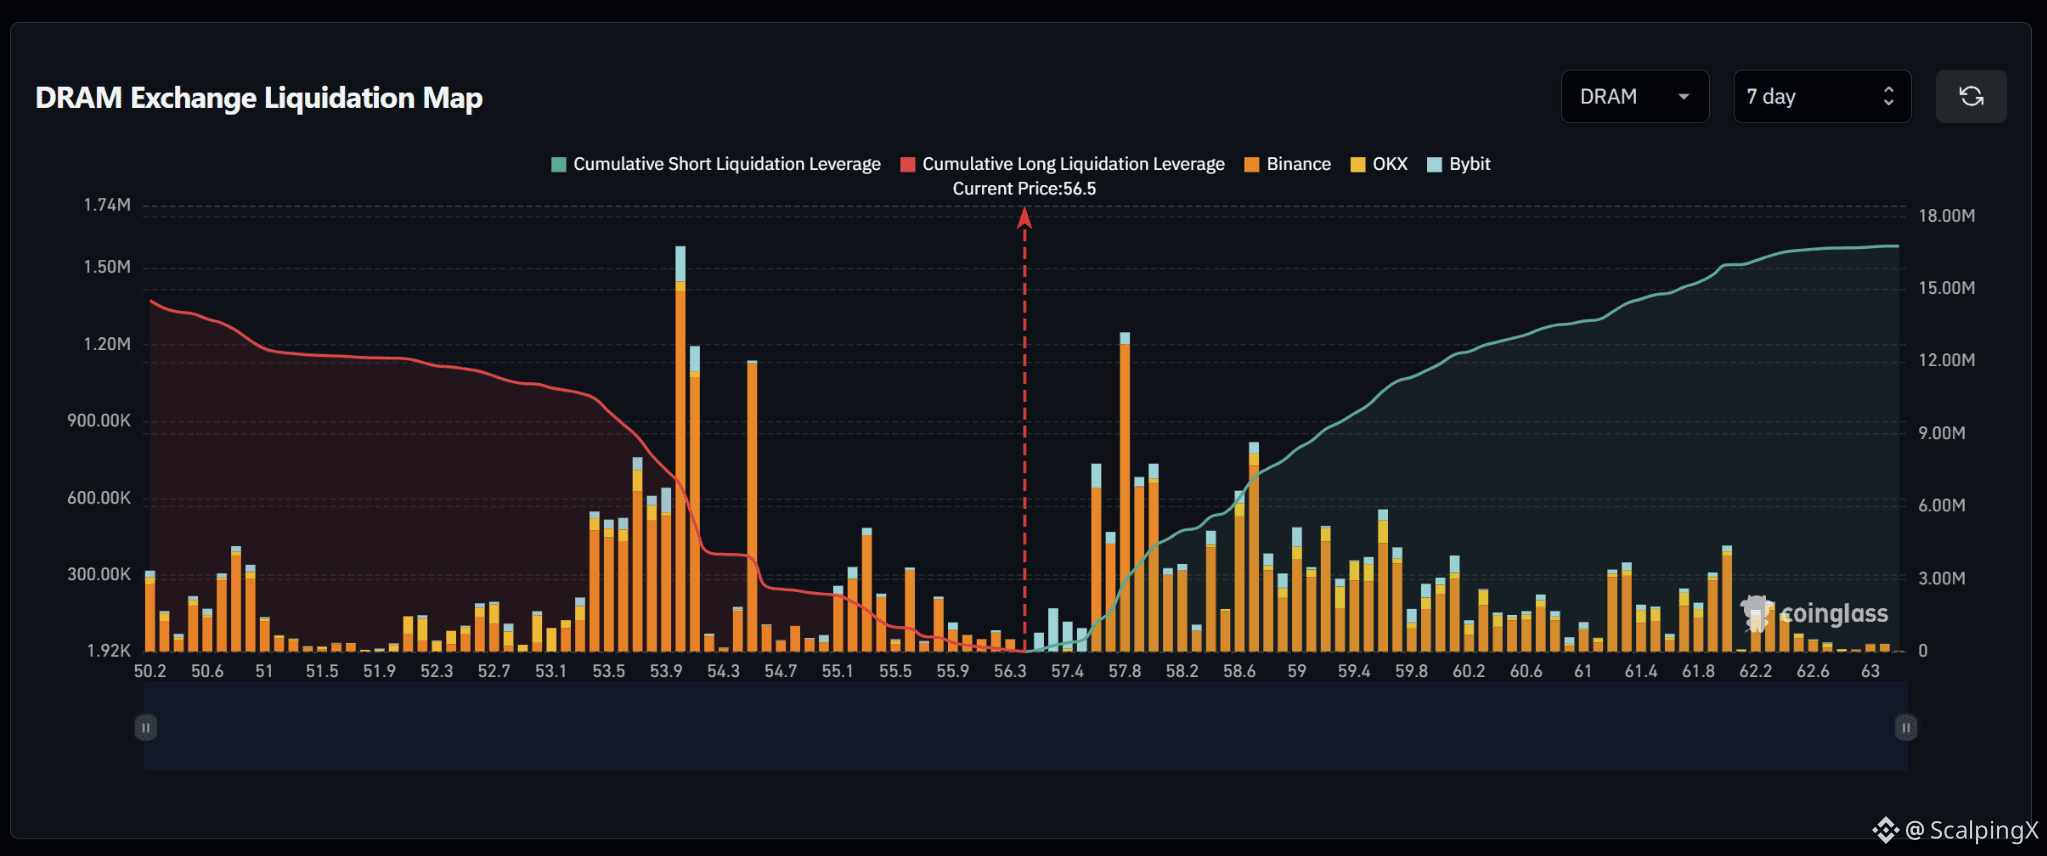
$DRAM – Mapa de Liquidación (7 Días) – Precio Actual 56.5
🔎 El mapa de liquidaciones de 7 días muestra aproximadamente 16 millones de dólares en liquidaciones cortas por encima del precio actual, superando ligeramente los aproximadamente 14–15 millones en liquidaciones largas por debajo. Por lo tanto, la estructura general está bastante equilibrada, pero con una inclinación moderada al alza.
📉 Por debajo del mercado, la liquidez de liquidaciones largas cercana se concentra alrededor de 55.9–55.1 antes de volverse mucho más densa en 54.7–53.5. El clúster más fuerte está alrededor de 53.9–54.3, donde la barra de liquidación más grande alcanza aproximadamente 1.6 millones de dólares. Perder 55.9 aumentaría la probabilidad de un barrido hacia 55.1–54.7 antes de que el clúster más grande a la baja entre en foco.
📈 Por encima del mercado, la liquidez de liquidaciones cortas empieza a acumularse alrededor de 57.4 y aumenta con fuerza en 57.8–58.6. El clúster de 57.8 destaca con una barra de liquidación por encima de 1.2 millones de dólares, mientras que 58.6 también contiene liquidez destacable. Más adelante, 59.0–59.8 sigue manteniendo una liquidez relativamente densa.
🧭 El panorama más amplio favorece modestamente la subida porque la exposición a liquidaciones cortas por encima es mayor. Romper 57.4 incrementaría la probabilidad de un barrido hacia 57.8–58.6, mientras que perder 55.9 desviaría la atención hacia 55.1–54.7.
#LiquidationMap
$DRAM – Mapa de Liquidación (7 Días) – Precio Actual 56.5
🔎 El mapa de liquidaciones de 7 días muestra aproximadamente 16 millones de dólares en liquidaciones cortas por encima del precio actual, superando ligeramente los aproximadamente 14–15 millones en liquidaciones largas por debajo. Por lo tanto, la estructura general está bastante equilibrada, pero con una inclinación moderada al alza.
📉 Por debajo del mercado, la liquidez de liquidaciones largas cercana se concentra alrededor de 55.9–55.1 antes de volverse mucho más densa en 54.7–53.5. El clúster más fuerte está alrededor de 53.9–54.3, donde la barra de liquidación más grande alcanza aproximadamente 1.6 millones de dólares. Perder 55.9 aumentaría la probabilidad de un barrido hacia 55.1–54.7 antes de que el clúster más grande a la baja entre en foco.
📈 Por encima del mercado, la liquidez de liquidaciones cortas empieza a acumularse alrededor de 57.4 y aumenta con fuerza en 57.8–58.6. El clúster de 57.8 destaca con una barra de liquidación por encima de 1.2 millones de dólares, mientras que 58.6 también contiene liquidez destacable. Más adelante, 59.0–59.8 sigue manteniendo una liquidez relativamente densa.
🧭 El panorama más amplio favorece modestamente la subida porque la exposición a liquidaciones cortas por encima es mayor. Romper 57.4 incrementaría la probabilidad de un barrido hacia 57.8–58.6, mientras que perder 55.9 desviaría la atención hacia 55.1–54.7.
#LiquidationMap
🔎 El mapa de liquidaciones de 7 días muestra aproximadamente 16 millones de dólares en liquidaciones cortas por encima del precio actual, superando ligeramente los aproximadamente 14–15 millones en liquidaciones largas por debajo. Por lo tanto, la estructura general está bastante equilibrada, pero con una inclinación moderada al alza.
📉 Por debajo del mercado, la liquidez de liquidaciones largas cercana se concentra alrededor de 55.9–55.1 antes de volverse mucho más densa en 54.7–53.5. El clúster más fuerte está alrededor de 53.9–54.3, donde la barra de liquidación más grande alcanza aproximadamente 1.6 millones de dólares. Perder 55.9 aumentaría la probabilidad de un barrido hacia 55.1–54.7 antes de que el clúster más grande a la baja entre en foco.
📈 Por encima del mercado, la liquidez de liquidaciones cortas empieza a acumularse alrededor de 57.4 y aumenta con fuerza en 57.8–58.6. El clúster de 57.8 destaca con una barra de liquidación por encima de 1.2 millones de dólares, mientras que 58.6 también contiene liquidez destacable. Más adelante, 59.0–59.8 sigue manteniendo una liquidez relativamente densa.
🧭 El panorama más amplio favorece modestamente la subida porque la exposición a liquidaciones cortas por encima es mayor. Romper 57.4 incrementaría la probabilidad de un barrido hacia 57.8–58.6, mientras que perder 55.9 desviaría la atención hacia 55.1–54.7.
#LiquidationMap
64
·
--
Alcista
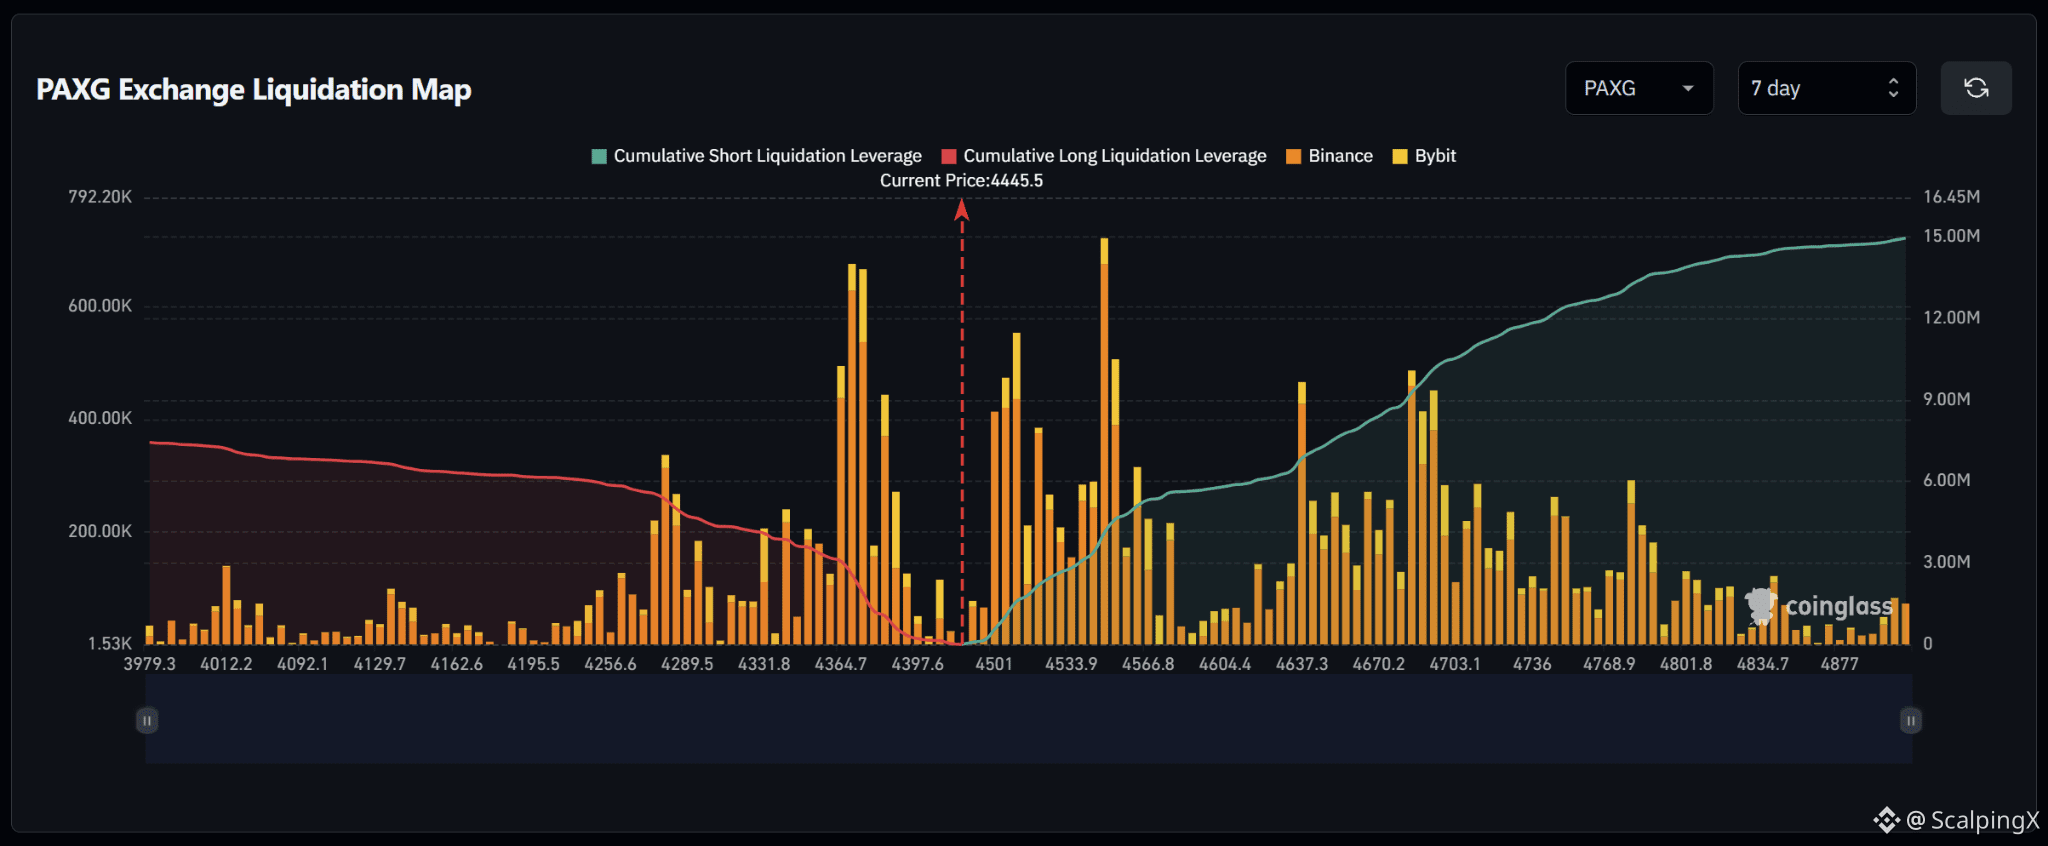
$PAXG – Mapa de Liquidación (7 Días) – Precio Actual 4.445,5
🔎 El mapa de liquidación de 7 días muestra aproximadamente 15 millones de dólares en liquidaciones cortas por encima del precio actual, superando significativamente aproximadamente 6,5–7 millones de dólares en liquidaciones largas por debajo. La estructura de liquidez, por lo tanto, favorece claramente la subida, con alrededor de 2,2 veces más liquidez acumulada por encima del mercado.
📉 Por debajo del mercado, la liquidez de liquidaciones largas se concentra fuertemente alrededor de 4.397,6–4.364,7. El clúster más fuerte se sitúa cerca de 4.364,7, donde las barras de liquidación alcanzan aproximadamente 650.000–700.000 dólares, mientras que 4.331,8–4.289,5 también contiene liquidez destacable. Perder 4.397,6 incrementaría la probabilidad de un barrido hacia 4.364,7–4.331,8.
📈 Por encima del mercado, la liquidez de liquidaciones cortas comienza a construirse desde 4.501 y aumenta con fuerza a lo largo de 4.533,9–4.566,8. El clúster más fuerte está alrededor de 4.550, donde la barra de liquidación supera los 700.000 dólares. Más lejos, 4.637,3–4.703,1 también contiene una liquidez sustancial. Una ruptura por encima de 4.501 pondría en foco a continuación 4.533,9–4.566.8.
🧭 La configuración más amplia favorece la subida porque la exposición a liquidaciones cortas por encima es aproximadamente 2,2 veces mayor. Romper 4.501 aumentaría la probabilidad de un barrido hacia 4.533,9–4.566,8, mientras que perder 4.397,6 desplazaría la atención hacia 4.364,7–4.331,8.
#LiquidationMap
$PAXG – Mapa de Liquidación (7 Días) – Precio Actual 4.445,5
🔎 El mapa de liquidación de 7 días muestra aproximadamente 15 millones de dólares en liquidaciones cortas por encima del precio actual, superando significativamente aproximadamente 6,5–7 millones de dólares en liquidaciones largas por debajo. La estructura de liquidez, por lo tanto, favorece claramente la subida, con alrededor de 2,2 veces más liquidez acumulada por encima del mercado.
📉 Por debajo del mercado, la liquidez de liquidaciones largas se concentra fuertemente alrededor de 4.397,6–4.364,7. El clúster más fuerte se sitúa cerca de 4.364,7, donde las barras de liquidación alcanzan aproximadamente 650.000–700.000 dólares, mientras que 4.331,8–4.289,5 también contiene liquidez destacable. Perder 4.397,6 incrementaría la probabilidad de un barrido hacia 4.364,7–4.331,8.
📈 Por encima del mercado, la liquidez de liquidaciones cortas comienza a construirse desde 4.501 y aumenta con fuerza a lo largo de 4.533,9–4.566,8. El clúster más fuerte está alrededor de 4.550, donde la barra de liquidación supera los 700.000 dólares. Más lejos, 4.637,3–4.703,1 también contiene una liquidez sustancial. Una ruptura por encima de 4.501 pondría en foco a continuación 4.533,9–4.566.8.
🧭 La configuración más amplia favorece la subida porque la exposición a liquidaciones cortas por encima es aproximadamente 2,2 veces mayor. Romper 4.501 aumentaría la probabilidad de un barrido hacia 4.533,9–4.566,8, mientras que perder 4.397,6 desplazaría la atención hacia 4.364,7–4.331,8.
#LiquidationMap
🔎 El mapa de liquidación de 7 días muestra aproximadamente 15 millones de dólares en liquidaciones cortas por encima del precio actual, superando significativamente aproximadamente 6,5–7 millones de dólares en liquidaciones largas por debajo. La estructura de liquidez, por lo tanto, favorece claramente la subida, con alrededor de 2,2 veces más liquidez acumulada por encima del mercado.
📉 Por debajo del mercado, la liquidez de liquidaciones largas se concentra fuertemente alrededor de 4.397,6–4.364,7. El clúster más fuerte se sitúa cerca de 4.364,7, donde las barras de liquidación alcanzan aproximadamente 650.000–700.000 dólares, mientras que 4.331,8–4.289,5 también contiene liquidez destacable. Perder 4.397,6 incrementaría la probabilidad de un barrido hacia 4.364,7–4.331,8.
📈 Por encima del mercado, la liquidez de liquidaciones cortas comienza a construirse desde 4.501 y aumenta con fuerza a lo largo de 4.533,9–4.566,8. El clúster más fuerte está alrededor de 4.550, donde la barra de liquidación supera los 700.000 dólares. Más lejos, 4.637,3–4.703,1 también contiene una liquidez sustancial. Una ruptura por encima de 4.501 pondría en foco a continuación 4.533,9–4.566.8.
🧭 La configuración más amplia favorece la subida porque la exposición a liquidaciones cortas por encima es aproximadamente 2,2 veces mayor. Romper 4.501 aumentaría la probabilidad de un barrido hacia 4.533,9–4.566,8, mientras que perder 4.397,6 desplazaría la atención hacia 4.364,7–4.331,8.
#LiquidationMap
20
·
--
Alcista
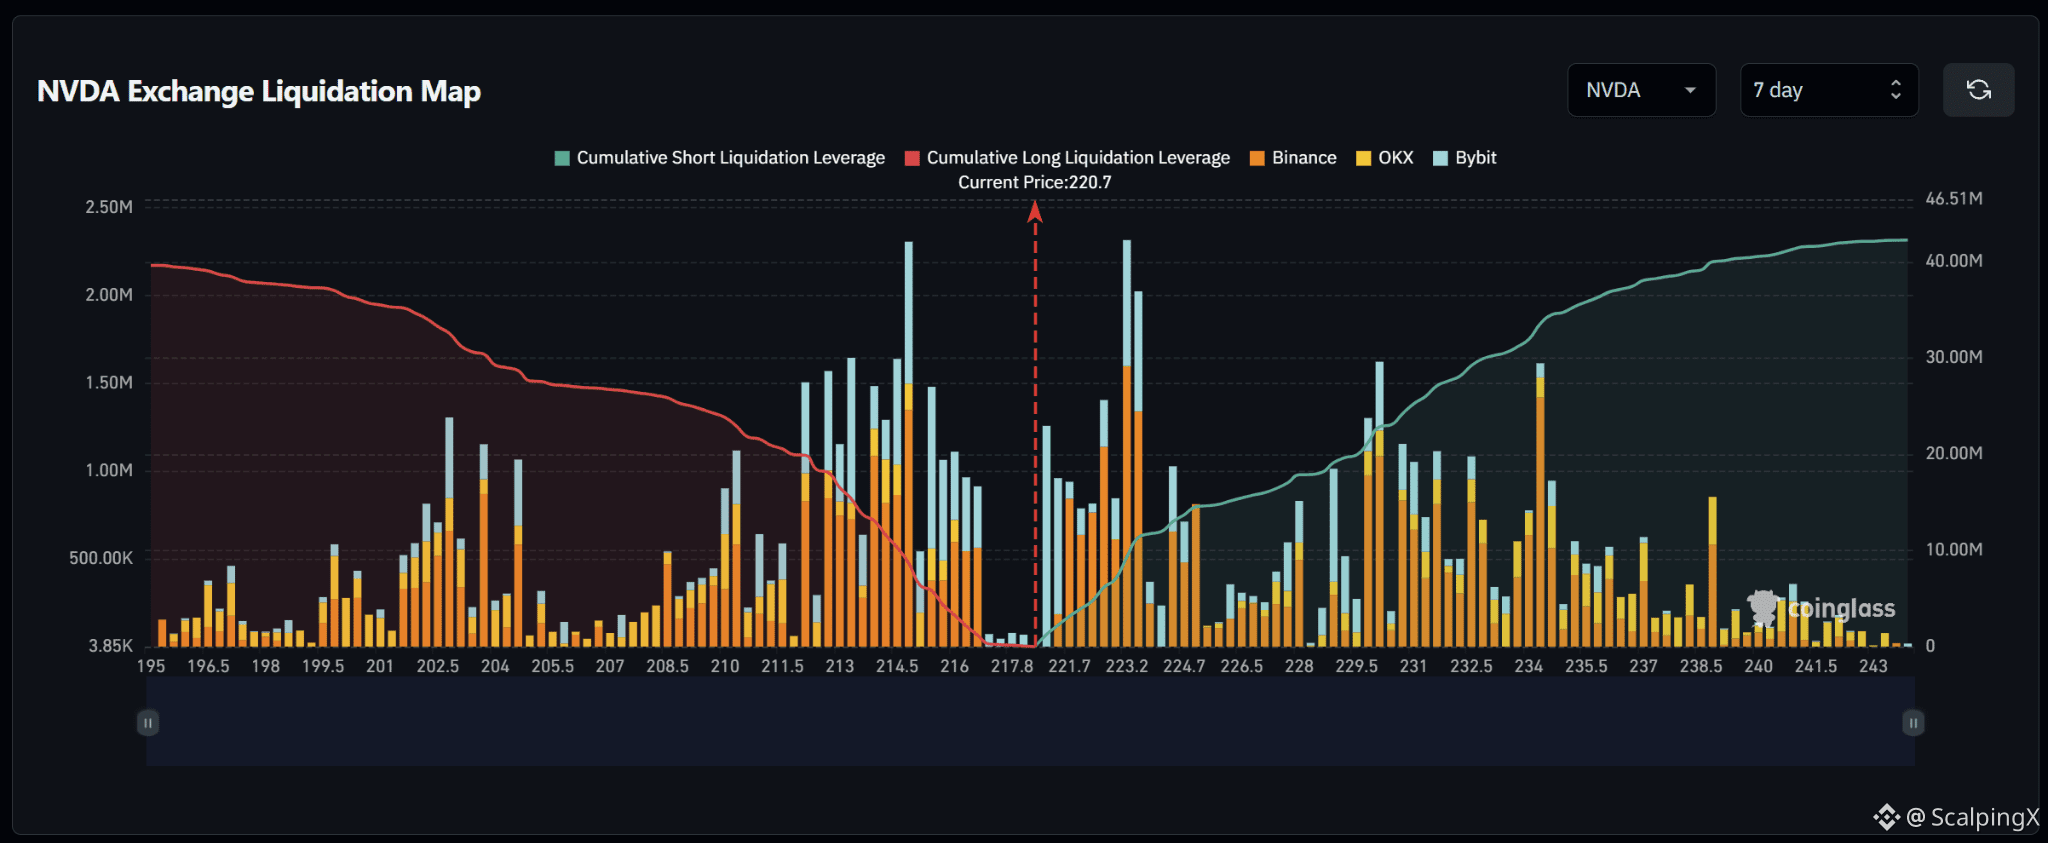
$NVDA – Mapa de Liquidaciones (7 Días) – Precio Actual 220.7
🔎 El mapa de liquidaciones de 7 días muestra aproximadamente 42 millones en liquidaciones cortas por encima del precio actual, superando ligeramente aproximadamente 40 millones en liquidaciones largas por debajo. La estructura general, por lo tanto, está bastante equilibrada pero con una ligera inclinación hacia arriba.
📉 Debajo del mercado, la liquidez de liquidaciones largas cercana se
concentra alrededor de 217.8–214.5. El grupo más fuerte se sitúa cerca de 214.5, donde la barra de liquidación supera los $2.2 millones, mientras que 213.0–216.0 también contiene liquidez sustancial. Perder 217.8 aumentaría la probabilidad de un barrido hacia 216.0–214.5.
📈 Por encima del mercado, la liquidez de liquidaciones cortas comienza a acumularse alrededor de 221.7 y aumenta con fuerza a través de 223.2–224.7. El grupo cercano a 223.2 se destaca con una barra de liquidación de más de $2.2 millones. Más lejos, 229.5–234.0 también contiene varios grupos grandes. Una ruptura por encima de 221.7 haría que primero se pongan en foco 223.2–224.7.
🧭 La configuración más amplia sigue siendo relativamente equilibrada, pero favorece modestamente la parte alcista. Romper 221.7 aumentaría la probabilidad de un barrido de liquidaciones cortas hacia 223.2–224.7, mientras que perder 217.8 cambiaría la atención hacia 216.0–214.5.
#LiquidationMap
$NVDA – Mapa de Liquidaciones (7 Días) – Precio Actual 220.7
🔎 El mapa de liquidaciones de 7 días muestra aproximadamente 42 millones en liquidaciones cortas por encima del precio actual, superando ligeramente aproximadamente 40 millones en liquidaciones largas por debajo. La estructura general, por lo tanto, está bastante equilibrada pero con una ligera inclinación hacia arriba.
📉 Debajo del mercado, la liquidez de liquidaciones largas cercana se
concentra alrededor de 217.8–214.5. El grupo más fuerte se sitúa cerca de 214.5, donde la barra de liquidación supera los $2.2 millones, mientras que 213.0–216.0 también contiene liquidez sustancial. Perder 217.8 aumentaría la probabilidad de un barrido hacia 216.0–214.5.
📈 Por encima del mercado, la liquidez de liquidaciones cortas comienza a acumularse alrededor de 221.7 y aumenta con fuerza a través de 223.2–224.7. El grupo cercano a 223.2 se destaca con una barra de liquidación de más de $2.2 millones. Más lejos, 229.5–234.0 también contiene varios grupos grandes. Una ruptura por encima de 221.7 haría que primero se pongan en foco 223.2–224.7.
🧭 La configuración más amplia sigue siendo relativamente equilibrada, pero favorece modestamente la parte alcista. Romper 221.7 aumentaría la probabilidad de un barrido de liquidaciones cortas hacia 223.2–224.7, mientras que perder 217.8 cambiaría la atención hacia 216.0–214.5.
#LiquidationMap
🔎 El mapa de liquidaciones de 7 días muestra aproximadamente 42 millones en liquidaciones cortas por encima del precio actual, superando ligeramente aproximadamente 40 millones en liquidaciones largas por debajo. La estructura general, por lo tanto, está bastante equilibrada pero con una ligera inclinación hacia arriba.
📉 Debajo del mercado, la liquidez de liquidaciones largas cercana se
concentra alrededor de 217.8–214.5. El grupo más fuerte se sitúa cerca de 214.5, donde la barra de liquidación supera los $2.2 millones, mientras que 213.0–216.0 también contiene liquidez sustancial. Perder 217.8 aumentaría la probabilidad de un barrido hacia 216.0–214.5.
📈 Por encima del mercado, la liquidez de liquidaciones cortas comienza a acumularse alrededor de 221.7 y aumenta con fuerza a través de 223.2–224.7. El grupo cercano a 223.2 se destaca con una barra de liquidación de más de $2.2 millones. Más lejos, 229.5–234.0 también contiene varios grupos grandes. Una ruptura por encima de 221.7 haría que primero se pongan en foco 223.2–224.7.
🧭 La configuración más amplia sigue siendo relativamente equilibrada, pero favorece modestamente la parte alcista. Romper 221.7 aumentaría la probabilidad de un barrido de liquidaciones cortas hacia 223.2–224.7, mientras que perder 217.8 cambiaría la atención hacia 216.0–214.5.
#LiquidationMap
18
·
--
Alcista
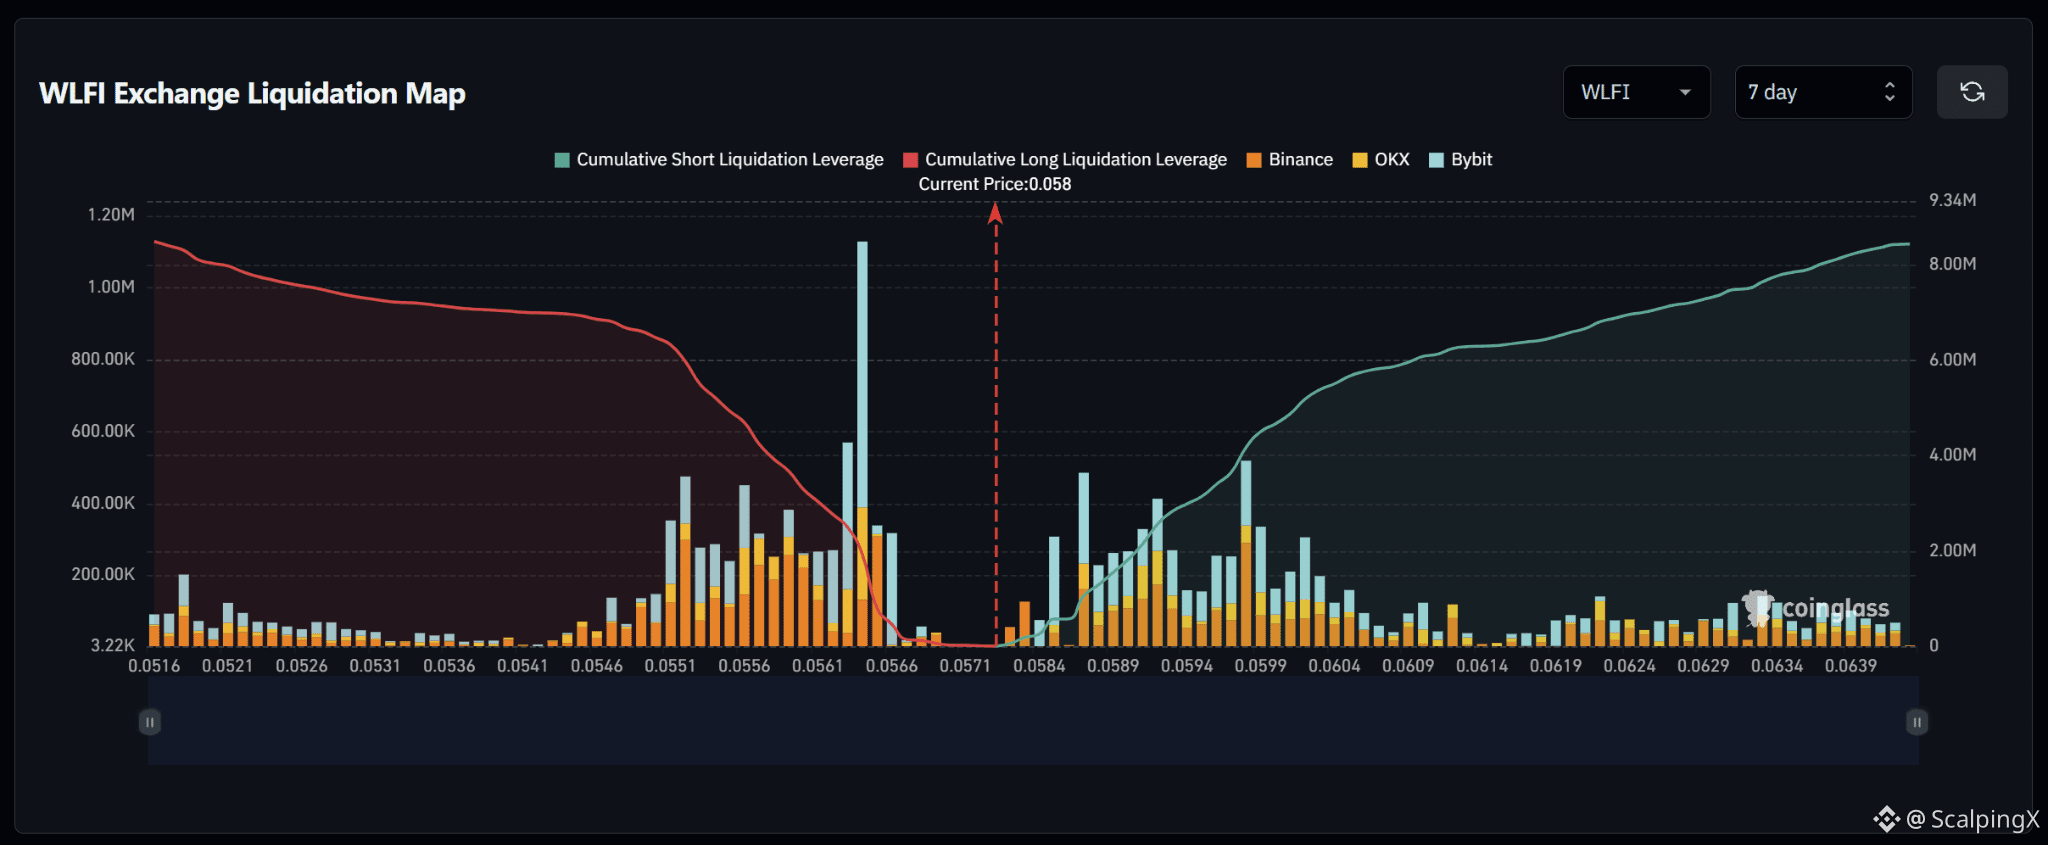
$WLFI – Mapa de Liquidación (7 Días) – Precio Actual 0.0580
🔎 El mapa de liquidaciones de 7 días muestra una estructura de liquidez bastante equilibrada, con liquidaciones largas por debajo y liquidaciones cortas por encima situadas alrededor de 8–9 millones de dólares. Por lo tanto, la configuración general está cerca de un punto neutral, sin un desequilibrio direccional fuerte.
📉 Por debajo del mercado, la liquidez de liquidación larga se concentra con fuerza en torno a 0.0566–0.0551. El clúster más fuerte se sitúa cerca de 0.0563, donde la barra de liquidación supera 1 millón, mientras que 0.0556–0.0551 también contiene una liquidez sustancial. Perder 0.0566 aumentaría la probabilidad de un barrido hacia 0.0561–0.0556.
📈 Por encima del mercado, la liquidez de liquidación corta empieza a formarse alrededor de 0.0584 y se vuelve más densa a través de 0.0589–0.0604. Los clústeres cercanos más fuertes se ubican alrededor de 0.0589 y 0.0599, con barras de liquidación que alcanzan aproximadamente 400,000–500,000 dólares. Una ruptura por encima de 0.0584 haría que 0.0589–0.0599 entre primero en el foco.
🧭 La configuración más amplia sigue siendo relativamente equilibrada. Romper 0.0584 aumentaría la probabilidad de un barrido de liquidación corta hacia 0.0589–0.0599, mientras que perder 0.0566 cambiaría la atención hacia 0.0561–0.0556.
#LiquidationMap
$WLFI – Mapa de Liquidación (7 Días) – Precio Actual 0.0580
🔎 El mapa de liquidaciones de 7 días muestra una estructura de liquidez bastante equilibrada, con liquidaciones largas por debajo y liquidaciones cortas por encima situadas alrededor de 8–9 millones de dólares. Por lo tanto, la configuración general está cerca de un punto neutral, sin un desequilibrio direccional fuerte.
📉 Por debajo del mercado, la liquidez de liquidación larga se concentra con fuerza en torno a 0.0566–0.0551. El clúster más fuerte se sitúa cerca de 0.0563, donde la barra de liquidación supera 1 millón, mientras que 0.0556–0.0551 también contiene una liquidez sustancial. Perder 0.0566 aumentaría la probabilidad de un barrido hacia 0.0561–0.0556.
📈 Por encima del mercado, la liquidez de liquidación corta empieza a formarse alrededor de 0.0584 y se vuelve más densa a través de 0.0589–0.0604. Los clústeres cercanos más fuertes se ubican alrededor de 0.0589 y 0.0599, con barras de liquidación que alcanzan aproximadamente 400,000–500,000 dólares. Una ruptura por encima de 0.0584 haría que 0.0589–0.0599 entre primero en el foco.
🧭 La configuración más amplia sigue siendo relativamente equilibrada. Romper 0.0584 aumentaría la probabilidad de un barrido de liquidación corta hacia 0.0589–0.0599, mientras que perder 0.0566 cambiaría la atención hacia 0.0561–0.0556.
#LiquidationMap
🔎 El mapa de liquidaciones de 7 días muestra una estructura de liquidez bastante equilibrada, con liquidaciones largas por debajo y liquidaciones cortas por encima situadas alrededor de 8–9 millones de dólares. Por lo tanto, la configuración general está cerca de un punto neutral, sin un desequilibrio direccional fuerte.
📉 Por debajo del mercado, la liquidez de liquidación larga se concentra con fuerza en torno a 0.0566–0.0551. El clúster más fuerte se sitúa cerca de 0.0563, donde la barra de liquidación supera 1 millón, mientras que 0.0556–0.0551 también contiene una liquidez sustancial. Perder 0.0566 aumentaría la probabilidad de un barrido hacia 0.0561–0.0556.
📈 Por encima del mercado, la liquidez de liquidación corta empieza a formarse alrededor de 0.0584 y se vuelve más densa a través de 0.0589–0.0604. Los clústeres cercanos más fuertes se ubican alrededor de 0.0589 y 0.0599, con barras de liquidación que alcanzan aproximadamente 400,000–500,000 dólares. Una ruptura por encima de 0.0584 haría que 0.0589–0.0599 entre primero en el foco.
🧭 La configuración más amplia sigue siendo relativamente equilibrada. Romper 0.0584 aumentaría la probabilidad de un barrido de liquidación corta hacia 0.0589–0.0599, mientras que perder 0.0566 cambiaría la atención hacia 0.0561–0.0556.
#LiquidationMap
8
·
--
Alcista
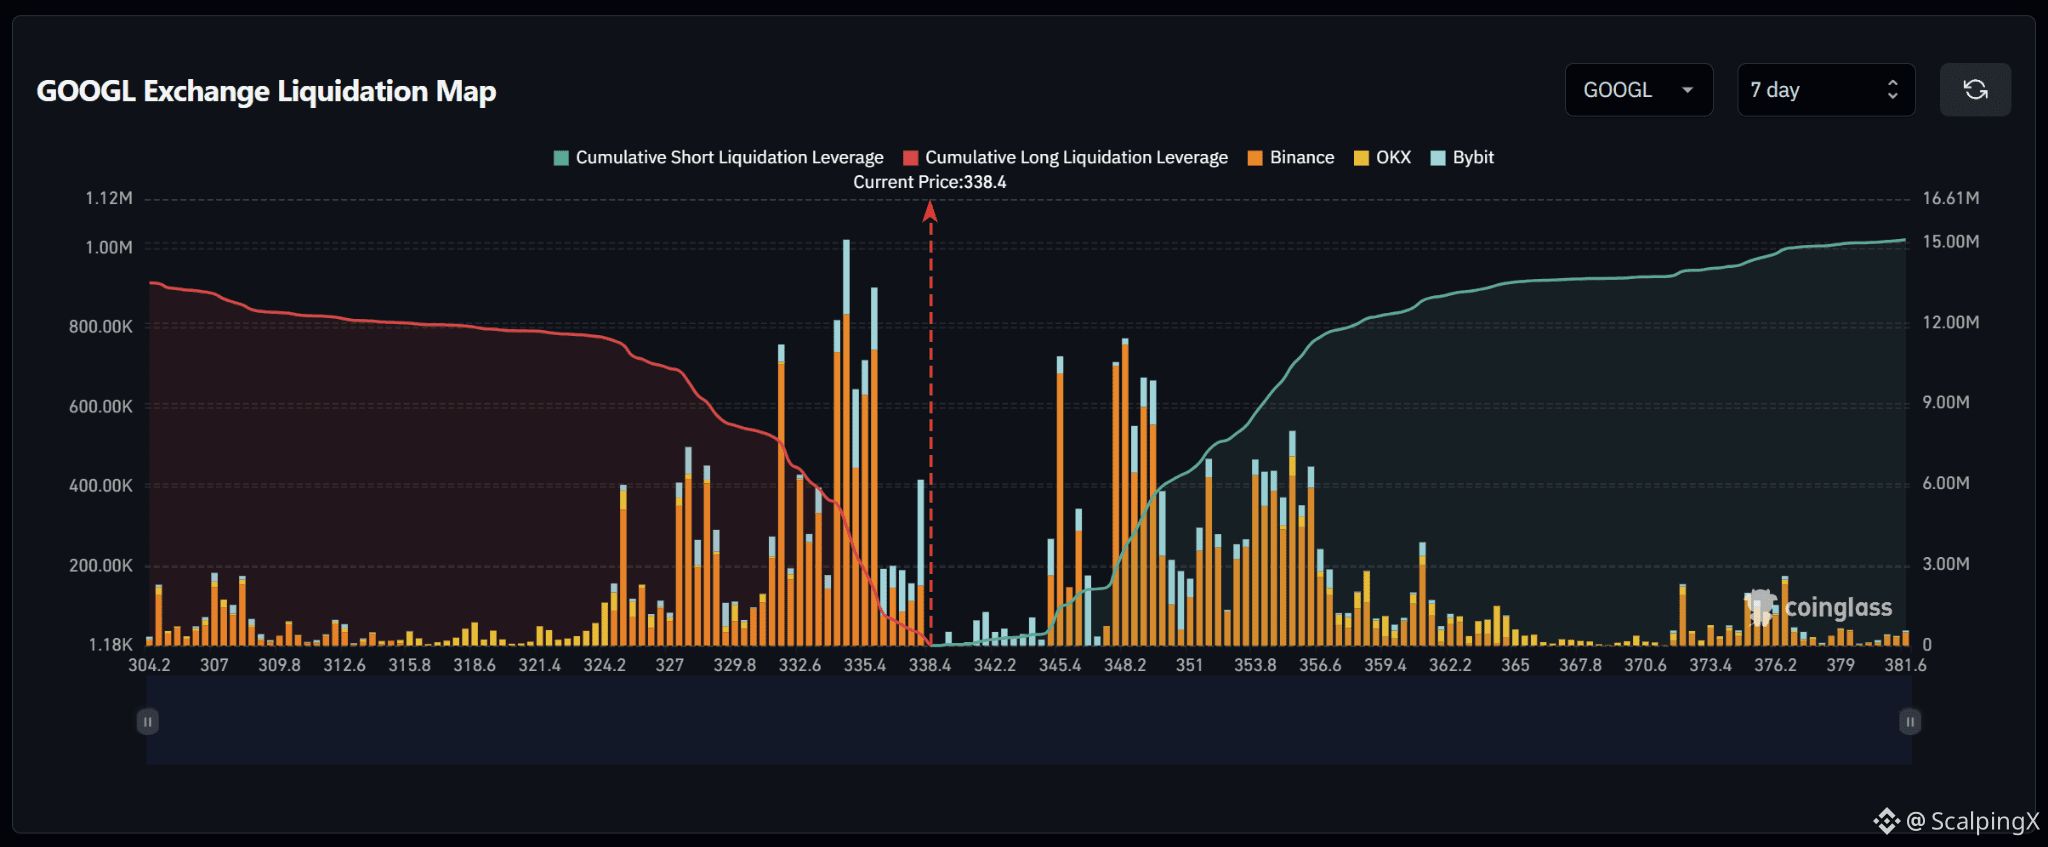
$GOOGL – Mapa de Liquidaciones (7 Días) – Precio Actual 338.4
🔎 El mapa de liquidaciones de 7 días muestra aproximadamente $15 millones en liquidaciones cortas por encima del precio actual, superando ligeramente los aproximadamente $13 millones en liquidaciones largas por debajo. Por lo tanto, la estructura general está bastante equilibrada, pero ligeramente inclinada al alza, con aproximadamente 1.15 veces más liquidez acumulada por encima del mercado.
📉 Por debajo del mercado, la liquidez de liquidaciones largas se concentra fuertemente alrededor de 335.4–332.6. Los clústeres más fuertes están cerca de 335.4 y 334.0, donde las barras de liquidación se aproximan a $900,000–1 millón, mientras que 332.6 también contiene liquidez destacable. Perder 335.4 aumentaría la probabilidad de un barrido hacia 334.0–332.6.
📈 Por encima del mercado, la liquidez se mantiene relativamente delgada entre 338.4 y 342.2 antes de que la exposición a liquidaciones cortas aumente bruscamente desde 345.4. Los clústeres sólidos aparecen alrededor de 345.4 y 348.2–351.0, con varias barras alcanzando aproximadamente $600,000–800,000. Una ruptura por encima de 342.2 pondría en foco 345.4–348.2.
🧭 La configuración más amplia favorece modestamente el alza porque la exposición a liquidaciones cortas por encima es mayor. Romper 342.2 aumentaría la probabilidad de un barrido hacia 345.4–348.2, mientras que perder 335.4 desplazaría la atención hacia 334.0–332.6.
#LiquidationMap
$GOOGL – Mapa de Liquidaciones (7 Días) – Precio Actual 338.4
🔎 El mapa de liquidaciones de 7 días muestra aproximadamente $15 millones en liquidaciones cortas por encima del precio actual, superando ligeramente los aproximadamente $13 millones en liquidaciones largas por debajo. Por lo tanto, la estructura general está bastante equilibrada, pero ligeramente inclinada al alza, con aproximadamente 1.15 veces más liquidez acumulada por encima del mercado.
📉 Por debajo del mercado, la liquidez de liquidaciones largas se concentra fuertemente alrededor de 335.4–332.6. Los clústeres más fuertes están cerca de 335.4 y 334.0, donde las barras de liquidación se aproximan a $900,000–1 millón, mientras que 332.6 también contiene liquidez destacable. Perder 335.4 aumentaría la probabilidad de un barrido hacia 334.0–332.6.
📈 Por encima del mercado, la liquidez se mantiene relativamente delgada entre 338.4 y 342.2 antes de que la exposición a liquidaciones cortas aumente bruscamente desde 345.4. Los clústeres sólidos aparecen alrededor de 345.4 y 348.2–351.0, con varias barras alcanzando aproximadamente $600,000–800,000. Una ruptura por encima de 342.2 pondría en foco 345.4–348.2.
🧭 La configuración más amplia favorece modestamente el alza porque la exposición a liquidaciones cortas por encima es mayor. Romper 342.2 aumentaría la probabilidad de un barrido hacia 345.4–348.2, mientras que perder 335.4 desplazaría la atención hacia 334.0–332.6.
#LiquidationMap
🔎 El mapa de liquidaciones de 7 días muestra aproximadamente $15 millones en liquidaciones cortas por encima del precio actual, superando ligeramente los aproximadamente $13 millones en liquidaciones largas por debajo. Por lo tanto, la estructura general está bastante equilibrada, pero ligeramente inclinada al alza, con aproximadamente 1.15 veces más liquidez acumulada por encima del mercado.
📉 Por debajo del mercado, la liquidez de liquidaciones largas se concentra fuertemente alrededor de 335.4–332.6. Los clústeres más fuertes están cerca de 335.4 y 334.0, donde las barras de liquidación se aproximan a $900,000–1 millón, mientras que 332.6 también contiene liquidez destacable. Perder 335.4 aumentaría la probabilidad de un barrido hacia 334.0–332.6.
📈 Por encima del mercado, la liquidez se mantiene relativamente delgada entre 338.4 y 342.2 antes de que la exposición a liquidaciones cortas aumente bruscamente desde 345.4. Los clústeres sólidos aparecen alrededor de 345.4 y 348.2–351.0, con varias barras alcanzando aproximadamente $600,000–800,000. Una ruptura por encima de 342.2 pondría en foco 345.4–348.2.
🧭 La configuración más amplia favorece modestamente el alza porque la exposición a liquidaciones cortas por encima es mayor. Romper 342.2 aumentaría la probabilidad de un barrido hacia 345.4–348.2, mientras que perder 335.4 desplazaría la atención hacia 334.0–332.6.
#LiquidationMap
21
·
--
Alcista
$TRX – Mapa de Liquidación (7 Días) – Precio Actual 0.3365
🔎 El mapa de liquidación a 7 días muestra una estructura de liquidez bastante equilibrada, con aproximadamente $21–22 millones en liquidaciones cortas por encima del precio actual y alrededor de $21 millones en liquidaciones largas por debajo. El conjunto general está, por lo tanto, cerca de neutral pero con una inclinación moderada hacia arriba.
📉 Por debajo del mercado, la liquidez de liquidación larga cercana se concentra fuertemente alrededor de 0.3332–0.3294. Varios niveles de liquidación en esta zona alcanzan aproximadamente $800,000–1 millón, mientras que 0.3266–0.3238 también contiene liquidez notable. Perder 0.3350 aumentaría la probabilidad de un barrido hacia 0.3332–0.3294.
📈 Por encima del mercado, la liquidez de liquidación corta comienza a formarse con fuerza alrededor de 0.3438–0.3494. Los clusters más fuertes están cerca de 0.3438 y 0.3466–0.3494, con varias velas superando 1 millón. Más lejos, 0.3522–0.3550 también contiene liquidez notable.
🧭 La configuración más amplia está relativamente equilibrada pero favorece moderadamente la parte alcista. Romper 0.3438 aumentaría la probabilidad de un barrido hacia 0.3466–0.3494, mientras que perder 0.3350 desviaría la atención hacia 0.3332–0.3294.
#LiquidationMap
$TRX – Mapa de Liquidación (7 Días) – Precio Actual 0.3365
🔎 El mapa de liquidación a 7 días muestra una estructura de liquidez bastante equilibrada, con aproximadamente $21–22 millones en liquidaciones cortas por encima del precio actual y alrededor de $21 millones en liquidaciones largas por debajo. El conjunto general está, por lo tanto, cerca de neutral pero con una inclinación moderada hacia arriba.
📉 Por debajo del mercado, la liquidez de liquidación larga cercana se concentra fuertemente alrededor de 0.3332–0.3294. Varios niveles de liquidación en esta zona alcanzan aproximadamente $800,000–1 millón, mientras que 0.3266–0.3238 también contiene liquidez notable. Perder 0.3350 aumentaría la probabilidad de un barrido hacia 0.3332–0.3294.
📈 Por encima del mercado, la liquidez de liquidación corta comienza a formarse con fuerza alrededor de 0.3438–0.3494. Los clusters más fuertes están cerca de 0.3438 y 0.3466–0.3494, con varias velas superando 1 millón. Más lejos, 0.3522–0.3550 también contiene liquidez notable.
🧭 La configuración más amplia está relativamente equilibrada pero favorece moderadamente la parte alcista. Romper 0.3438 aumentaría la probabilidad de un barrido hacia 0.3466–0.3494, mientras que perder 0.3350 desviaría la atención hacia 0.3332–0.3294.
#LiquidationMap
🔎 El mapa de liquidación a 7 días muestra una estructura de liquidez bastante equilibrada, con aproximadamente $21–22 millones en liquidaciones cortas por encima del precio actual y alrededor de $21 millones en liquidaciones largas por debajo. El conjunto general está, por lo tanto, cerca de neutral pero con una inclinación moderada hacia arriba.
📉 Por debajo del mercado, la liquidez de liquidación larga cercana se concentra fuertemente alrededor de 0.3332–0.3294. Varios niveles de liquidación en esta zona alcanzan aproximadamente $800,000–1 millón, mientras que 0.3266–0.3238 también contiene liquidez notable. Perder 0.3350 aumentaría la probabilidad de un barrido hacia 0.3332–0.3294.
📈 Por encima del mercado, la liquidez de liquidación corta comienza a formarse con fuerza alrededor de 0.3438–0.3494. Los clusters más fuertes están cerca de 0.3438 y 0.3466–0.3494, con varias velas superando 1 millón. Más lejos, 0.3522–0.3550 también contiene liquidez notable.
🧭 La configuración más amplia está relativamente equilibrada pero favorece moderadamente la parte alcista. Romper 0.3438 aumentaría la probabilidad de un barrido hacia 0.3466–0.3494, mientras que perder 0.3350 desviaría la atención hacia 0.3332–0.3294.
#LiquidationMap
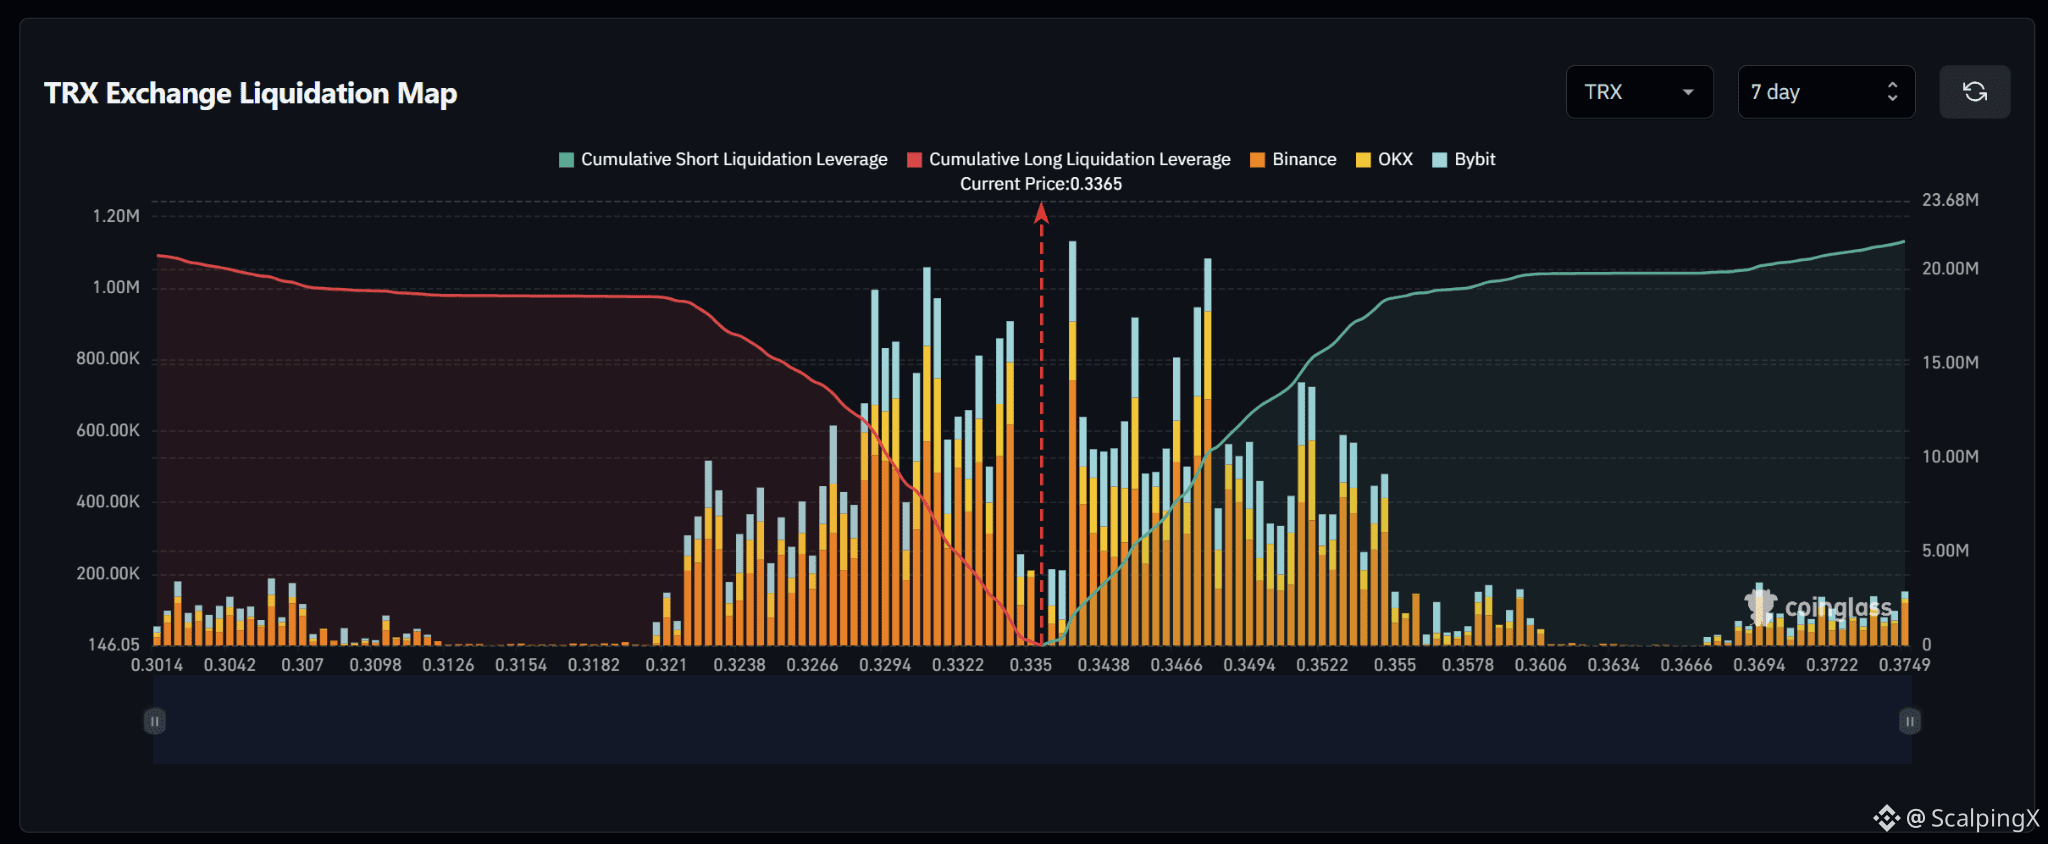
17
·
--
$AVAX – Mapa de Liquidación (7 Días) – Precio Actual 7.42
🔎 El mapa de liquidaciones a 7 días muestra aproximadamente $15 millones en liquidaciones cortas por encima del precio actual, superando cerca de $12 millones en liquidaciones largas por debajo. La estructura general está bastante equilibrada, pero con una ligera inclinación al alza, con aproximadamente 1.2–1.3 veces más liquidez acumulada por encima del mercado.
📉 Por debajo del mercado, la liquidez cercana de liquidaciones largas es relativamente escasa alrededor de 7.30–7.22 antes de aumentar bruscamente en 7.18–7.10. El clúster más fuerte se sitúa alrededor de 7.10–7.16, donde varias barras de liquidación alcanzan aproximadamente $600,000–700,000. Perder 7.30 pondría en foco 7.22–7.18 antes del clúster de caída más amplio.
📈 Por encima del mercado, la liquidez de liquidaciones cortas comienza a acumularse desde alrededor de 7.50 y se vuelve mucho más densa en 7.54–7.70. Los clústeres más fuertes se encuentran cerca de 7.58 y 7.66–7.70, con varias barras superando $500,000. Más lejos, 7.74–7.86 también contiene una liquidez notable.
🧭 La configuración general favorece modestamente la subida porque la exposición de liquidaciones cortas por encima es aproximadamente 1.2–1.3 veces mayor. Romper 7.50 aumentaría la probabilidad de un barrido hacia 7.54–7.58, mientras que perder 7.30 desviaría la atención hacia 7.22–7.18.
#LiquidationMap
$AVAX – Mapa de Liquidación (7 Días) – Precio Actual 7.42
🔎 El mapa de liquidaciones a 7 días muestra aproximadamente $15 millones en liquidaciones cortas por encima del precio actual, superando cerca de $12 millones en liquidaciones largas por debajo. La estructura general está bastante equilibrada, pero con una ligera inclinación al alza, con aproximadamente 1.2–1.3 veces más liquidez acumulada por encima del mercado.
📉 Por debajo del mercado, la liquidez cercana de liquidaciones largas es relativamente escasa alrededor de 7.30–7.22 antes de aumentar bruscamente en 7.18–7.10. El clúster más fuerte se sitúa alrededor de 7.10–7.16, donde varias barras de liquidación alcanzan aproximadamente $600,000–700,000. Perder 7.30 pondría en foco 7.22–7.18 antes del clúster de caída más amplio.
📈 Por encima del mercado, la liquidez de liquidaciones cortas comienza a acumularse desde alrededor de 7.50 y se vuelve mucho más densa en 7.54–7.70. Los clústeres más fuertes se encuentran cerca de 7.58 y 7.66–7.70, con varias barras superando $500,000. Más lejos, 7.74–7.86 también contiene una liquidez notable.
🧭 La configuración general favorece modestamente la subida porque la exposición de liquidaciones cortas por encima es aproximadamente 1.2–1.3 veces mayor. Romper 7.50 aumentaría la probabilidad de un barrido hacia 7.54–7.58, mientras que perder 7.30 desviaría la atención hacia 7.22–7.18.
#LiquidationMap
🔎 El mapa de liquidaciones a 7 días muestra aproximadamente $15 millones en liquidaciones cortas por encima del precio actual, superando cerca de $12 millones en liquidaciones largas por debajo. La estructura general está bastante equilibrada, pero con una ligera inclinación al alza, con aproximadamente 1.2–1.3 veces más liquidez acumulada por encima del mercado.
📉 Por debajo del mercado, la liquidez cercana de liquidaciones largas es relativamente escasa alrededor de 7.30–7.22 antes de aumentar bruscamente en 7.18–7.10. El clúster más fuerte se sitúa alrededor de 7.10–7.16, donde varias barras de liquidación alcanzan aproximadamente $600,000–700,000. Perder 7.30 pondría en foco 7.22–7.18 antes del clúster de caída más amplio.
📈 Por encima del mercado, la liquidez de liquidaciones cortas comienza a acumularse desde alrededor de 7.50 y se vuelve mucho más densa en 7.54–7.70. Los clústeres más fuertes se encuentran cerca de 7.58 y 7.66–7.70, con varias barras superando $500,000. Más lejos, 7.74–7.86 también contiene una liquidez notable.
🧭 La configuración general favorece modestamente la subida porque la exposición de liquidaciones cortas por encima es aproximadamente 1.2–1.3 veces mayor. Romper 7.50 aumentaría la probabilidad de un barrido hacia 7.54–7.58, mientras que perder 7.30 desviaría la atención hacia 7.22–7.18.
#LiquidationMap
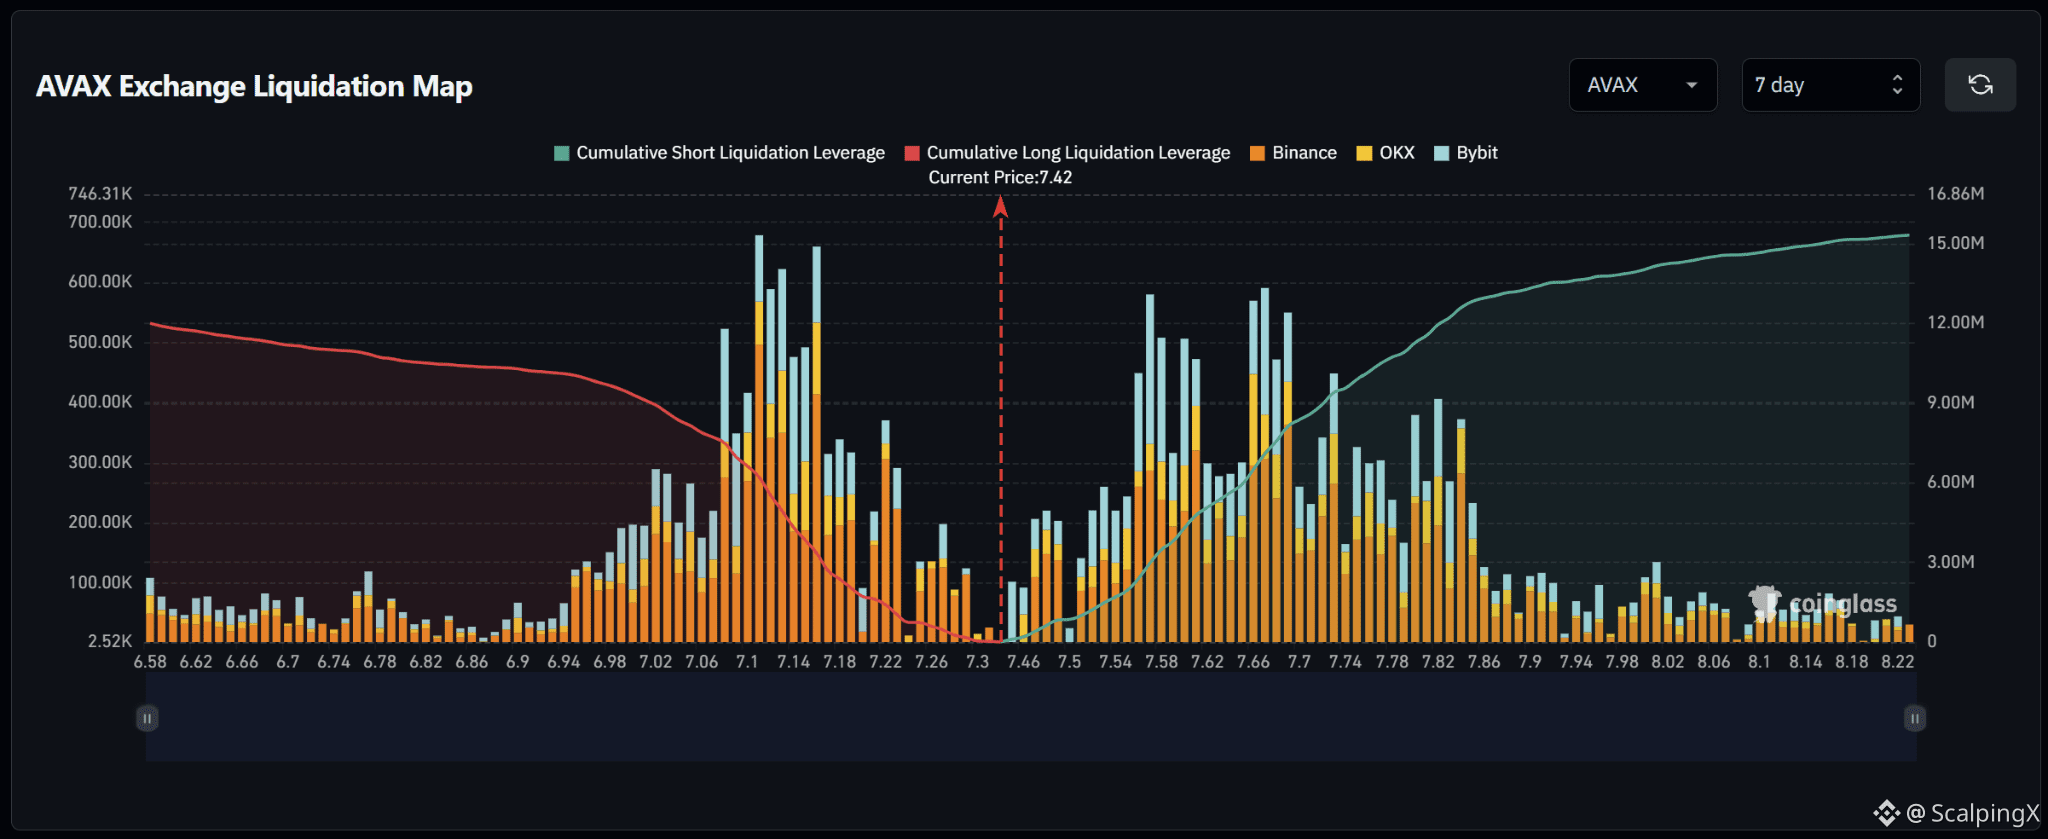
43
Inicia sesión para explorar más contenidos
Únete a usuarios globales de criptomonedas en Binance Square
⚡️ Obtén información útil y actualizada sobre criptos.
💬 Avalado por el mayor exchange de criptomonedas en el mundo.
👍 Descubre perspectivas reales de creadores verificados.
Email/número de teléfono
Temas populares
1
#USAugustPPIRisesLessThanExpected
72,251 vistas
991 están debatiendo
2
#SECApprovesNasdaqTexasCommodityTrustRule
36,976 vistas
680 están debatiendo
3
#ECBRaisesRatesSecondTimeTo2.5%
32,619 vistas
487 están debatiendo
4
#USContinuingJoblessClaims1.774M
43,611 vistas
576 están debatiendo
5
#USAugustPPIYoYRisesTo5.4%
39,474 vistas
444 están debatiendo
6
#AppleDebutsFoldablePhone
120,848 vistas
1,622 están debatiendo
7
#TSMCAugustRevenueUp53.3%YoY
29,299 vistas
572 están debatiendo
8
#IranSaysReadyToEscalateWarWithUS
44,293 vistas
563 están debatiendo
9
#EUExtendsCentralContactPointToCASPs
36,278 vistas
563 están debatiendo
10
#US10YTreasuryYieldHitsHighestSinceNov2023
78,106 vistas
884 están debatiendo