

#cryptomarketanalysis
cryptomarketanalysis
13.2M vistas
25,707 están debatiendo
Hot
Lo último


·
--

Artículo
Inteligencia de mercado de Binance: rotación de altcoins y análisis de la volatilidad de las memecoins📊 Análisis del mercado cripto — 11 de octubre de 2026
🌐 Panorama general del mercado cripto
🟠 Bitcoin (BTC): Aproximadamente $82,862 | 🔻 −1.70%
🔵 Ethereum (ETH): Aproximadamente $2,570 | 🔻 −1.91%
🟣 Solana (SOL): Aproximadamente $115.24 | 🔻 −3.04%
💧 XRP: Aproximadamente $1.40 | 🔻 −4.69%
📊 Análisis detallado del mercado y perspectivas
🌐 Panorama macroeconómico y catalizadores
🇺🇸 Señales de la Reserva Federal: Las expectativas de una política monetaria más restrictiva y la persistente presión de los rendimientos de los bonos del Tesoro han frenado el apetito por el riesgo, impulsando a los operadores institucionales a reducir el riesgo de sus carteras.
Inteligencia de mercado de Binance: rotación de altcoins y análisis de la volatilidad de las memecoins
📊 Análisis del mercado cripto — 11 de octubre de 2026
🌐 Panorama general del mercado cripto
🟠 Bitcoin (BTC): Aproximadamente $82,862 | 🔻 −1.70%
🔵 Ethereum (ETH): Aproximadamente $2,570 | 🔻 −1.91%
🟣 Solana (SOL): Aproximadamente $115.24 | 🔻 −3.04%
💧 XRP: Aproximadamente $1.40 | 🔻 −4.69%
📊 Análisis detallado del mercado y perspectivas
🌐 Panorama macroeconómico y catalizadores
🇺🇸 Señales de la Reserva Federal: Las expectativas de una política monetaria más restrictiva y la persistente presión de los rendimientos de los bonos del Tesoro han frenado el apetito por el riesgo, impulsando a los operadores institucionales a reducir el riesgo de sus carteras.
🌐 Panorama general del mercado cripto
🟠 Bitcoin (BTC): Aproximadamente $82,862 | 🔻 −1.70%
🔵 Ethereum (ETH): Aproximadamente $2,570 | 🔻 −1.91%
🟣 Solana (SOL): Aproximadamente $115.24 | 🔻 −3.04%
💧 XRP: Aproximadamente $1.40 | 🔻 −4.69%
📊 Análisis detallado del mercado y perspectivas
🌐 Panorama macroeconómico y catalizadores
🇺🇸 Señales de la Reserva Federal: Las expectativas de una política monetaria más restrictiva y la persistente presión de los rendimientos de los bonos del Tesoro han frenado el apetito por el riesgo, impulsando a los operadores institucionales a reducir el riesgo de sus carteras.
3
2.1k
·
--
Artículo
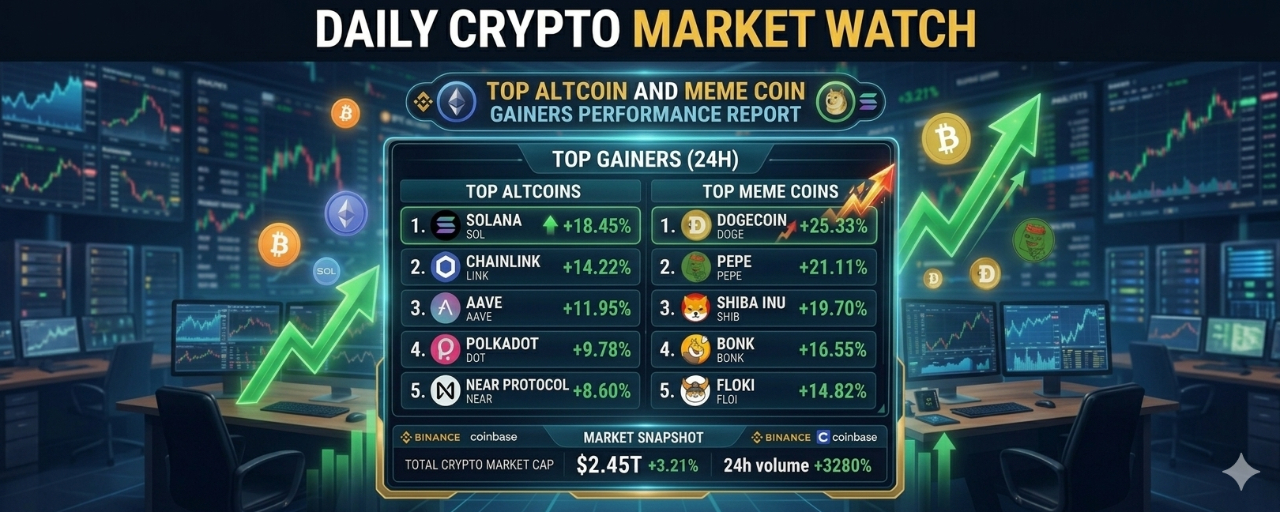
Vigilancia diaria del mercado cripto: Informe de rendimiento de los mayores ganadores en altcoins y monedas meme📊 Análisis del mercado de criptomonedas de Binance — 2 de octubre de 2026
🌐 Resumen general del mercado
📈 La última instantánea de 4 horas de Binance muestra una fortaleza selectiva en altcoins y monedas meme, en lugar de una recuperación generalizada en todo el mercado.
💰 El segmento de tokens meme que se muestra en la captura tiene alrededor de $2.75B en volumen de 24 horas, con un aumento del 19.82%, mientras que su capitalización de mercado combinada es de aproximadamente $24.71B, con una caída del 5.55%.
🟢 Esta combinación sugiere una actividad comercial intensa junto con una caída del valor de mercado agregado, lo que indica mayor especulación y rotación en lugar de una apreciación amplia y estable.
Vigilancia diaria del mercado cripto: Informe de rendimiento de los mayores ganadores en altcoins y monedas meme
📊 Análisis del mercado de criptomonedas de Binance — 2 de octubre de 2026
🌐 Resumen general del mercado
📈 La última instantánea de 4 horas de Binance muestra una fortaleza selectiva en altcoins y monedas meme, en lugar de una recuperación generalizada en todo el mercado.
💰 El segmento de tokens meme que se muestra en la captura tiene alrededor de $2.75B en volumen de 24 horas, con un aumento del 19.82%, mientras que su capitalización de mercado combinada es de aproximadamente $24.71B, con una caída del 5.55%.
🟢 Esta combinación sugiere una actividad comercial intensa junto con una caída del valor de mercado agregado, lo que indica mayor especulación y rotación en lugar de una apreciación amplia y estable.
🌐 Resumen general del mercado
📈 La última instantánea de 4 horas de Binance muestra una fortaleza selectiva en altcoins y monedas meme, en lugar de una recuperación generalizada en todo el mercado.
💰 El segmento de tokens meme que se muestra en la captura tiene alrededor de $2.75B en volumen de 24 horas, con un aumento del 19.82%, mientras que su capitalización de mercado combinada es de aproximadamente $24.71B, con una caída del 5.55%.
🟢 Esta combinación sugiere una actividad comercial intensa junto con una caída del valor de mercado agregado, lo que indica mayor especulación y rotación en lugar de una apreciación amplia y estable.
2
895
·
--

Artículo
Análisis completo del mercado de Binance: descripción general de los principales ganadores de altcoins y memecoins📊 Contexto integral del mercado y desglose de activos
🌐 Sentimiento general del mercado: El mercado de las criptomonedas muestra un impulso selectivo, con algunos altcoins específicos y tokens meme registrando un movimiento alcista moderado en una ventana de 4 horas, mientras que el volumen de negociación de tokens meme en general se sitúa en aproximadamente $2.29B (bajó 17.35%).
📌 Alcance de los datos y limitaciones: Las cifras a continuación reflejan a los principales ganadores de precio extraídos directamente de las instantáneas proporcionadas de la plataforma de Binance para altcoins y tokens meme durante el período de 4 horas.
Análisis completo del mercado de Binance: descripción general de los principales ganadores de altcoins y memecoins
📊 Contexto integral del mercado y desglose de activos
🌐 Sentimiento general del mercado: El mercado de las criptomonedas muestra un impulso selectivo, con algunos altcoins específicos y tokens meme registrando un movimiento alcista moderado en una ventana de 4 horas, mientras que el volumen de negociación de tokens meme en general se sitúa en aproximadamente $2.29B (bajó 17.35%).
📌 Alcance de los datos y limitaciones: Las cifras a continuación reflejan a los principales ganadores de precio extraídos directamente de las instantáneas proporcionadas de la plataforma de Binance para altcoins y tokens meme durante el período de 4 horas.
🌐 Sentimiento general del mercado: El mercado de las criptomonedas muestra un impulso selectivo, con algunos altcoins específicos y tokens meme registrando un movimiento alcista moderado en una ventana de 4 horas, mientras que el volumen de negociación de tokens meme en general se sitúa en aproximadamente $2.29B (bajó 17.35%).
📌 Alcance de los datos y limitaciones: Las cifras a continuación reflejan a los principales ganadores de precio extraídos directamente de las instantáneas proporcionadas de la plataforma de Binance para altcoins y tokens meme durante el período de 4 horas.
5
1.7k

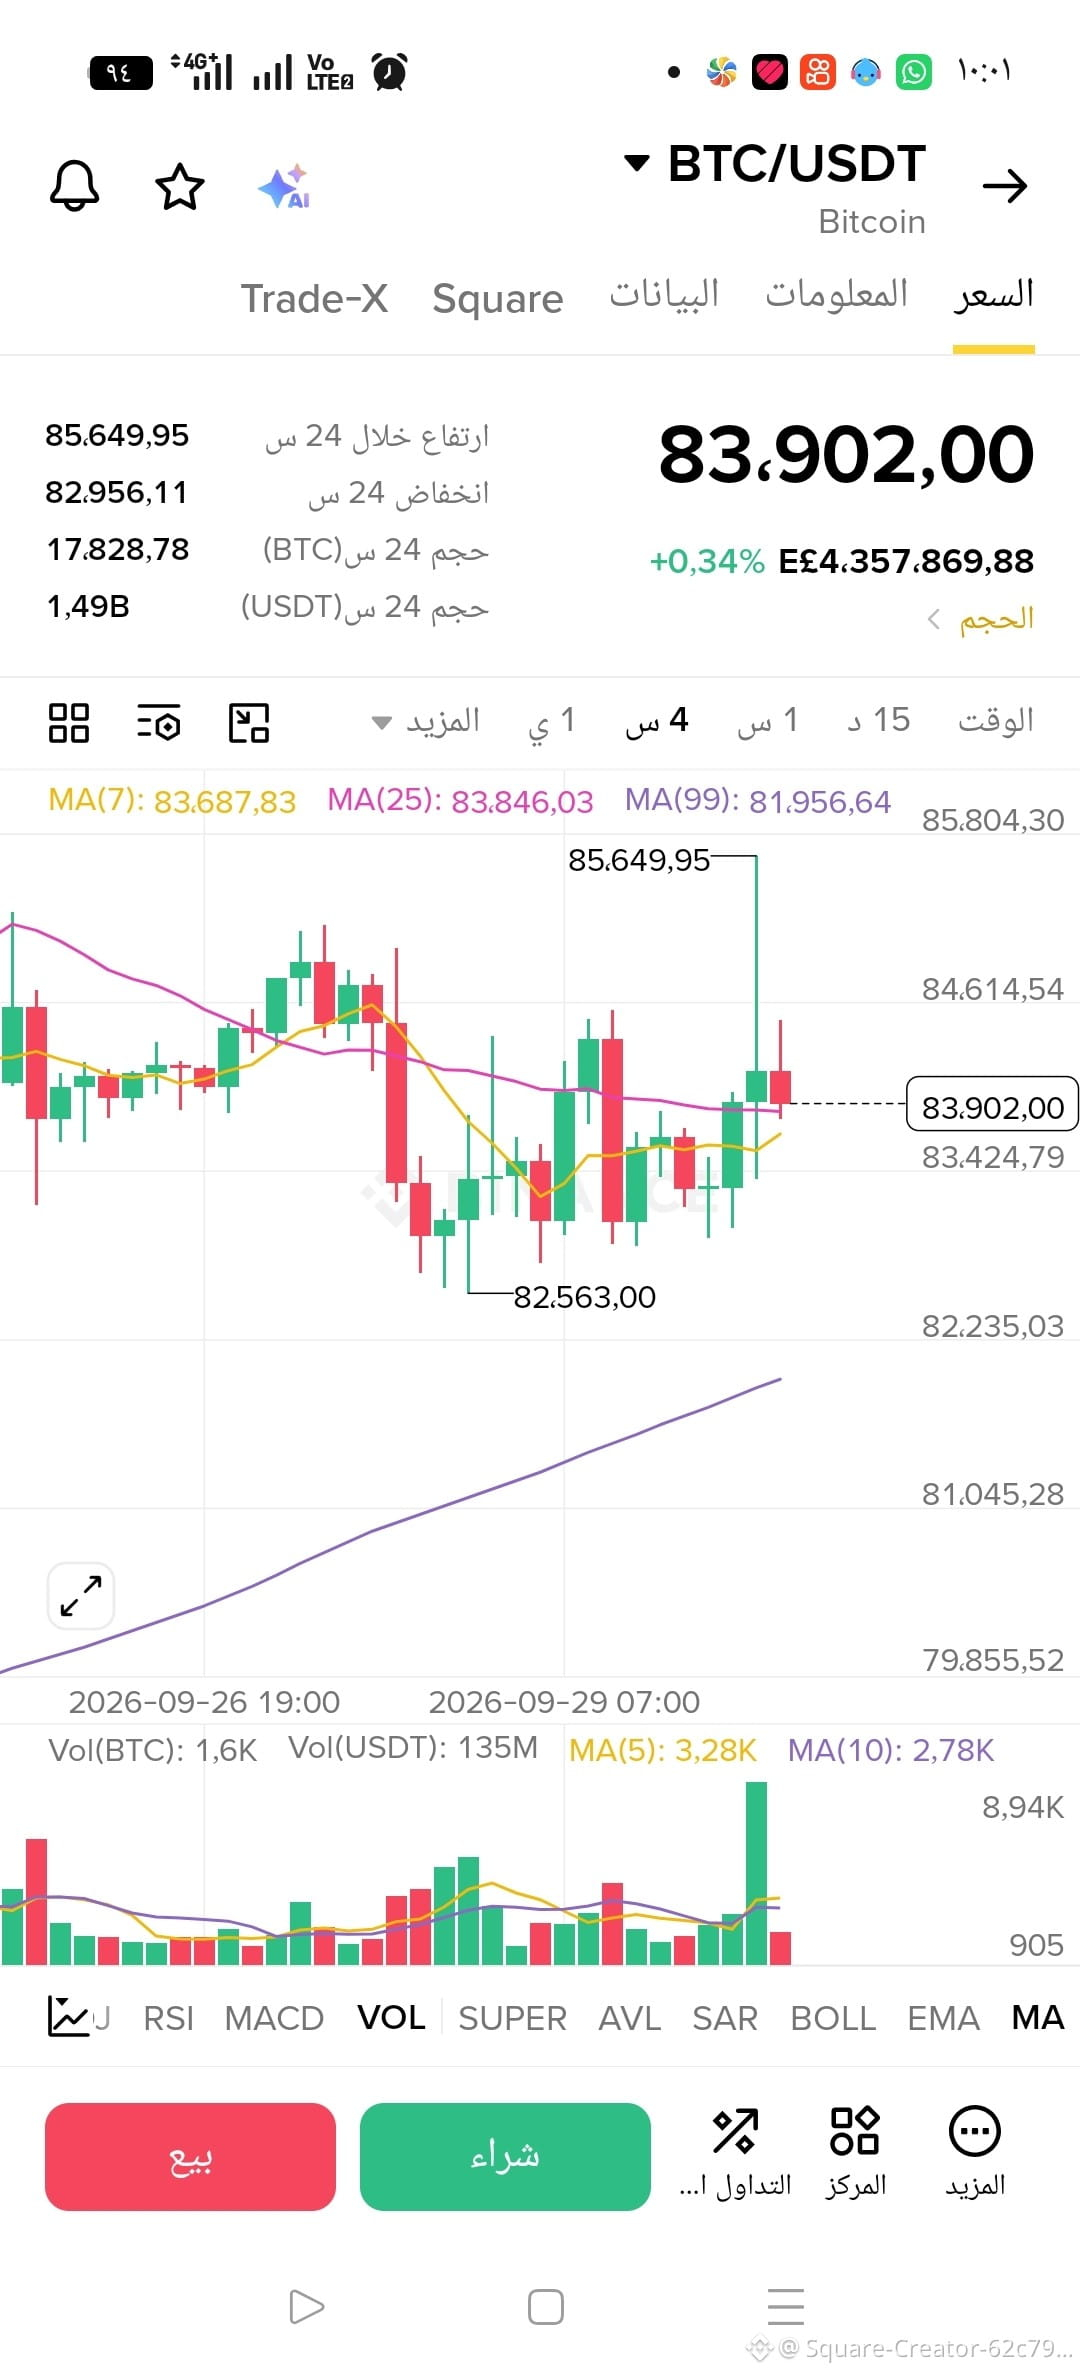
📊 Actualización técnica: Bitcoin
Se mantiene en los niveles de 83,902$ tras registrar un máximo diario prometedor
Después de que el Bitcoin lograra superar previamente la barrera de 85,200$ , los indicadores de negociación actuales para el par BTC/USDT muestran un movimiento correctivo normal y una estabilidad por encima de los niveles de soporte. El precio actual en el momento es 83,902.00$ , con un ligero aumento de +0.34%, en medio de la continuidad del impulso positivo y el precio por encima de las medias móviles técnicas (MA99).
📈 Datos de trading de las últimas 24 horas:
• 🔺 Precio más alto registrado: 85,649.95$
• 🔻 Precio más bajo registrado: 82,956.11$
• 📊 Volumen de trading (BTC): 17.828,78
• 💰 Volumen de trading (USDT): 1.49 mil millones
#BTCUSDT
#CryptoTrading
#BinanceSquare
#CryptoMarketAnalysis
📊 Actualización técnica: Bitcoin
Se mantiene en los niveles de 83,902$ tras registrar un máximo diario prometedor
Después de que el Bitcoin lograra superar previamente la barrera de 85,200$ , los indicadores de negociación actuales para el par BTC/USDT muestran un movimiento correctivo normal y una estabilidad por encima de los niveles de soporte. El precio actual en el momento es 83,902.00$ , con un ligero aumento de +0.34%, en medio de la continuidad del impulso positivo y el precio por encima de las medias móviles técnicas (MA99).
📈 Datos de trading de las últimas 24 horas:
• 🔺 Precio más alto registrado: 85,649.95$
• 🔻 Precio más bajo registrado: 82,956.11$
• 📊 Volumen de trading (BTC): 17.828,78
• 💰 Volumen de trading (USDT): 1.49 mil millones
#BTCUSDT
#CryptoTrading
#BinanceSquare
#CryptoMarketAnalysis
Se mantiene en los niveles de 83,902$ tras registrar un máximo diario prometedor
Después de que el Bitcoin lograra superar previamente la barrera de 85,200$ , los indicadores de negociación actuales para el par BTC/USDT muestran un movimiento correctivo normal y una estabilidad por encima de los niveles de soporte. El precio actual en el momento es 83,902.00$ , con un ligero aumento de +0.34%, en medio de la continuidad del impulso positivo y el precio por encima de las medias móviles técnicas (MA99).
📈 Datos de trading de las últimas 24 horas:
• 🔺 Precio más alto registrado: 85,649.95$
• 🔻 Precio más bajo registrado: 82,956.11$
• 📊 Volumen de trading (BTC): 17.828,78
• 💰 Volumen de trading (USDT): 1.49 mil millones
#BTCUSDT
#CryptoTrading
#BinanceSquare
#CryptoMarketAnalysis
1
53
·
--
Artículo
Análisis integral del mercado cripto: principales ganadores de altcoins de Binance & monedas meme de hoy📊 Análisis del mercado cripto de Binance — 30 de septiembre de 2026
Instantánea del mercado: La página de mercado actual de Binance muestra una capitalización total del mercado cripto de alrededor de $2.9T, un volumen de 24 horas cercano a $90.9B y la dominancia de BTC en 58.65%. Bitcoin está alrededor de $83,620, mientras que Ethereum está alrededor de $2,691.
🌐 Mercado general de criptomonedas
🟢 Bitcoin: BTC se cotiza alrededor de $83.6K, y Binance muestra aproximadamente +0.30% en 24 horas.
🟢 Ethereum: ETH está alrededor de $2,691, ganando aproximadamente 0.63% en el snapshot actual de Binance.
🟠 Amplitud del mercado: A pesar del rendimiento relativamente estable de BTC/ETH, los datos recientes del mercado muestran una dispersión considerable entre las altcoins, lo que significa que el capital está rotando de forma selectiva en lugar de impulsar todo el mercado a la vez.
Análisis integral del mercado cripto: principales ganadores de altcoins de Binance & monedas meme de hoy
📊 Análisis del mercado cripto de Binance — 30 de septiembre de 2026
Instantánea del mercado: La página de mercado actual de Binance muestra una capitalización total del mercado cripto de alrededor de $2.9T, un volumen de 24 horas cercano a $90.9B y la dominancia de BTC en 58.65%. Bitcoin está alrededor de $83,620, mientras que Ethereum está alrededor de $2,691.
🌐 Mercado general de criptomonedas
🟢 Bitcoin: BTC se cotiza alrededor de $83.6K, y Binance muestra aproximadamente +0.30% en 24 horas.
🟢 Ethereum: ETH está alrededor de $2,691, ganando aproximadamente 0.63% en el snapshot actual de Binance.
🟠 Amplitud del mercado: A pesar del rendimiento relativamente estable de BTC/ETH, los datos recientes del mercado muestran una dispersión considerable entre las altcoins, lo que significa que el capital está rotando de forma selectiva en lugar de impulsar todo el mercado a la vez.
Instantánea del mercado: La página de mercado actual de Binance muestra una capitalización total del mercado cripto de alrededor de $2.9T, un volumen de 24 horas cercano a $90.9B y la dominancia de BTC en 58.65%. Bitcoin está alrededor de $83,620, mientras que Ethereum está alrededor de $2,691.
🌐 Mercado general de criptomonedas
🟢 Bitcoin: BTC se cotiza alrededor de $83.6K, y Binance muestra aproximadamente +0.30% en 24 horas.
🟢 Ethereum: ETH está alrededor de $2,691, ganando aproximadamente 0.63% en el snapshot actual de Binance.
🟠 Amplitud del mercado: A pesar del rendimiento relativamente estable de BTC/ETH, los datos recientes del mercado muestran una dispersión considerable entre las altcoins, lo que significa que el capital está rotando de forma selectiva en lugar de impulsar todo el mercado a la vez.
3
6
13
336
·
--
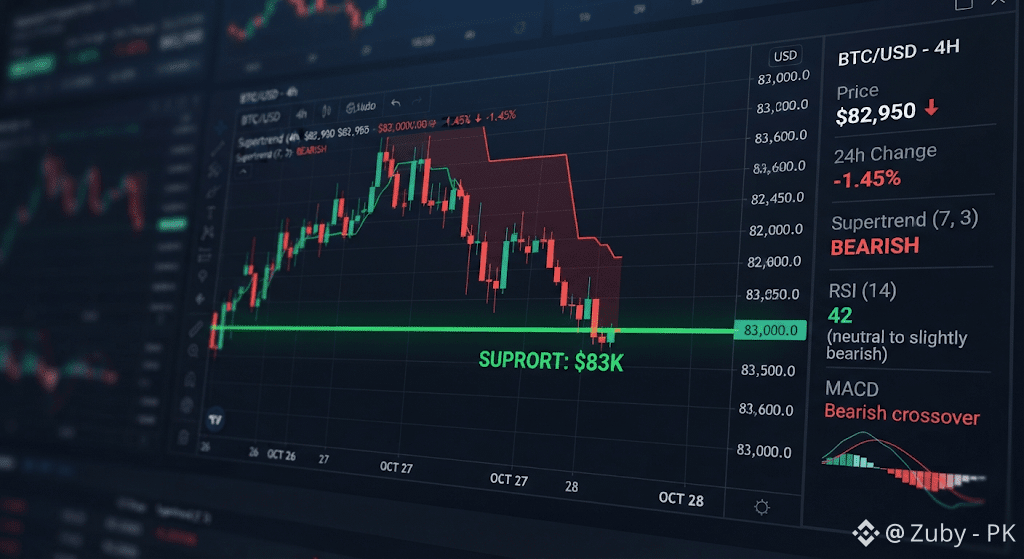
₿ Las pruebas de Bitcoin sostienen los 83K mientras la tendencia a corto plazo se debilita
📉 Retroceso de BTC
🔸 Bitcoin cotizó cerca de $83.960, retrocediendo desde el máximo reciente de $87K.
🔸 BTC se mantiene por encima de sus principales medias móviles diarias, mientras que el RSI enfrió hasta 62,83.
💰 Demanda de ETF
🔸 Los ETF spot de Bitcoin en EE. UU. registraron alrededor de $2,39B en entradas netas del 21 al 25 de septiembre.
🔸 Sin embargo, las entradas diarias se desaceleraron hacia el final de la semana.
⚠️ Niveles técnicos clave
🔸 El Supertrend de 4 horas es bajista cerca de $85.087, creando resistencia inmediata.
🔸 $83.250 es un soporte cercano, seguido por la zona clave de $81.500–$83.000.
🔸 Una ruptura por debajo de $82K podría exponer a BTC a una caída más profunda hacia el promedio de 20 días de $80.730.
🔸 Un movimiento por encima de $85K podría reabrir el camino hacia $87K.
📊 Perspectiva
🔸 La tendencia diaria se mantiene relativamente respaldada, pero el impulso a corto plazo se ha debilitado.
🔸 $82K–$85K es el rango clave a vigilar para el próximo movimiento importante de Bitcoin.
🏷️#BitcoinPriceAnalysis #BitcoinResistanceLevels #CryptoMarketAnalysis
$BTC
{spot}(BTCUSDT)
₿ Las pruebas de Bitcoin sostienen los 83K mientras la tendencia a corto plazo se debilita
📉 Retroceso de BTC
🔸 Bitcoin cotizó cerca de $83.960, retrocediendo desde el máximo reciente de $87K.
🔸 BTC se mantiene por encima de sus principales medias móviles diarias, mientras que el RSI enfrió hasta 62,83.
💰 Demanda de ETF
🔸 Los ETF spot de Bitcoin en EE. UU. registraron alrededor de $2,39B en entradas netas del 21 al 25 de septiembre.
🔸 Sin embargo, las entradas diarias se desaceleraron hacia el final de la semana.
⚠️ Niveles técnicos clave
🔸 El Supertrend de 4 horas es bajista cerca de $85.087, creando resistencia inmediata.
🔸 $83.250 es un soporte cercano, seguido por la zona clave de $81.500–$83.000.
🔸 Una ruptura por debajo de $82K podría exponer a BTC a una caída más profunda hacia el promedio de 20 días de $80.730.
🔸 Un movimiento por encima de $85K podría reabrir el camino hacia $87K.
📊 Perspectiva
🔸 La tendencia diaria se mantiene relativamente respaldada, pero el impulso a corto plazo se ha debilitado.
🔸 $82K–$85K es el rango clave a vigilar para el próximo movimiento importante de Bitcoin.
🏷️#BitcoinPriceAnalysis #BitcoinResistanceLevels #CryptoMarketAnalysis
$BTC
📉 Retroceso de BTC
🔸 Bitcoin cotizó cerca de $83.960, retrocediendo desde el máximo reciente de $87K.
🔸 BTC se mantiene por encima de sus principales medias móviles diarias, mientras que el RSI enfrió hasta 62,83.
💰 Demanda de ETF
🔸 Los ETF spot de Bitcoin en EE. UU. registraron alrededor de $2,39B en entradas netas del 21 al 25 de septiembre.
🔸 Sin embargo, las entradas diarias se desaceleraron hacia el final de la semana.
⚠️ Niveles técnicos clave
🔸 El Supertrend de 4 horas es bajista cerca de $85.087, creando resistencia inmediata.
🔸 $83.250 es un soporte cercano, seguido por la zona clave de $81.500–$83.000.
🔸 Una ruptura por debajo de $82K podría exponer a BTC a una caída más profunda hacia el promedio de 20 días de $80.730.
🔸 Un movimiento por encima de $85K podría reabrir el camino hacia $87K.
📊 Perspectiva
🔸 La tendencia diaria se mantiene relativamente respaldada, pero el impulso a corto plazo se ha debilitado.
🔸 $82K–$85K es el rango clave a vigilar para el próximo movimiento importante de Bitcoin.
🏷️#BitcoinPriceAnalysis #BitcoinResistanceLevels #CryptoMarketAnalysis
$BTC
1
2
180
·
--

Artículo
Montando la ola: actualización completa del mercado cripto de hoy, rompimientos de altcoins y protagonistas de monedas meme📊 Panorama macro del mercado
🌐 Capitalización total del mercado: ~2,86 billones de dólares, reflejando un fuerte impulso de riesgo a través de los activos digitales.
👑 Dominancia de Bitcoin (BTC): Fluctuando cerca del 58,5%, mostrando que el BTC sigue marcando la dirección macro mientras el capital rota hacia altcoins de alto beta.
🐂 Sentimiento del mercado: La estructura alcista persiste mientras Bitcoin defiende medias móviles exponenciales clave (oscilando alrededor de la franja de los 84.000$), lo que impulsa una rotación especulativa agresiva hacia altcoins de mediana capitalización y sectores de memes con alto impulso.
Montando la ola: actualización completa del mercado cripto de hoy, rompimientos de altcoins y protagonistas de monedas meme
📊 Panorama macro del mercado
🌐 Capitalización total del mercado: ~2,86 billones de dólares, reflejando un fuerte impulso de riesgo a través de los activos digitales.
👑 Dominancia de Bitcoin (BTC): Fluctuando cerca del 58,5%, mostrando que el BTC sigue marcando la dirección macro mientras el capital rota hacia altcoins de alto beta.
🐂 Sentimiento del mercado: La estructura alcista persiste mientras Bitcoin defiende medias móviles exponenciales clave (oscilando alrededor de la franja de los 84.000$), lo que impulsa una rotación especulativa agresiva hacia altcoins de mediana capitalización y sectores de memes con alto impulso.
🌐 Capitalización total del mercado: ~2,86 billones de dólares, reflejando un fuerte impulso de riesgo a través de los activos digitales.
👑 Dominancia de Bitcoin (BTC): Fluctuando cerca del 58,5%, mostrando que el BTC sigue marcando la dirección macro mientras el capital rota hacia altcoins de alto beta.
🐂 Sentimiento del mercado: La estructura alcista persiste mientras Bitcoin defiende medias móviles exponenciales clave (oscilando alrededor de la franja de los 84.000$), lo que impulsa una rotación especulativa agresiva hacia altcoins de mediana capitalización y sectores de memes con alto impulso.
1
4
2.1k

·
--
Bitcoin supera a todos los sectores en una caída del 26%
Bitcoin cayó aproximadamente un 26% durante los últimos tres meses hasta rondar los 86.000 dólares, pero aun así ha superado a casi todos los principales sectores de criptomonedas, según Glassnode. Ether ha bajado alrededor de un 36% desde mediados de septiembre hasta situarse por debajo de los 3.000 dólares, mientras que los tokens de IA han caído un 48% y las memecoins se han desplomado un 56%.
La categoría de tokenización de activos del mundo real está un 46% por debajo en tres meses y los tokens DeFi han caído un 38%, según datos de CoinGecko. Nick Ruck, director de LVRG Research, señaló que las entradas de capital siguen favoreciendo a Bitcoin, lo que refleja la fuerte preferencia de los inversores por la estabilidad del BTC.
El análisis de Glassnode revela que la rentabilidad promedio en casi todos los sectores cripto ha quedado por debajo de la de Bitcoin, lo que indica que el capital sigue concentrándose en la criptomoneda líder. Esto subraya la posición dominante de Bitcoin, dejando a las altcoins luchando por mantener relevancia.
Esta tendencia sugiere que los inversores están tratando a Bitcoin como un colateral digital y una cobertura macro. ¿Cuál es tu opinión: las altcoins romperán con la sombra de Bitcoin, o esta dominancia ha venido para quedarse?
#BitcoinDominance #CryptoMarketAnalysis #GlassnodeData
Bitcoin supera a todos los sectores en una caída del 26%
Bitcoin cayó aproximadamente un 26% durante los últimos tres meses hasta rondar los 86.000 dólares, pero aun así ha superado a casi todos los principales sectores de criptomonedas, según Glassnode. Ether ha bajado alrededor de un 36% desde mediados de septiembre hasta situarse por debajo de los 3.000 dólares, mientras que los tokens de IA han caído un 48% y las memecoins se han desplomado un 56%.
La categoría de tokenización de activos del mundo real está un 46% por debajo en tres meses y los tokens DeFi han caído un 38%, según datos de CoinGecko. Nick Ruck, director de LVRG Research, señaló que las entradas de capital siguen favoreciendo a Bitcoin, lo que refleja la fuerte preferencia de los inversores por la estabilidad del BTC.
El análisis de Glassnode revela que la rentabilidad promedio en casi todos los sectores cripto ha quedado por debajo de la de Bitcoin, lo que indica que el capital sigue concentrándose en la criptomoneda líder. Esto subraya la posición dominante de Bitcoin, dejando a las altcoins luchando por mantener relevancia.
Esta tendencia sugiere que los inversores están tratando a Bitcoin como un colateral digital y una cobertura macro. ¿Cuál es tu opinión: las altcoins romperán con la sombra de Bitcoin, o esta dominancia ha venido para quedarse?
#BitcoinDominance #CryptoMarketAnalysis #GlassnodeData
Bitcoin cayó aproximadamente un 26% durante los últimos tres meses hasta rondar los 86.000 dólares, pero aun así ha superado a casi todos los principales sectores de criptomonedas, según Glassnode. Ether ha bajado alrededor de un 36% desde mediados de septiembre hasta situarse por debajo de los 3.000 dólares, mientras que los tokens de IA han caído un 48% y las memecoins se han desplomado un 56%.
La categoría de tokenización de activos del mundo real está un 46% por debajo en tres meses y los tokens DeFi han caído un 38%, según datos de CoinGecko. Nick Ruck, director de LVRG Research, señaló que las entradas de capital siguen favoreciendo a Bitcoin, lo que refleja la fuerte preferencia de los inversores por la estabilidad del BTC.
El análisis de Glassnode revela que la rentabilidad promedio en casi todos los sectores cripto ha quedado por debajo de la de Bitcoin, lo que indica que el capital sigue concentrándose en la criptomoneda líder. Esto subraya la posición dominante de Bitcoin, dejando a las altcoins luchando por mantener relevancia.
Esta tendencia sugiere que los inversores están tratando a Bitcoin como un colateral digital y una cobertura macro. ¿Cuál es tu opinión: las altcoins romperán con la sombra de Bitcoin, o esta dominancia ha venido para quedarse?
#BitcoinDominance #CryptoMarketAnalysis #GlassnodeData
177

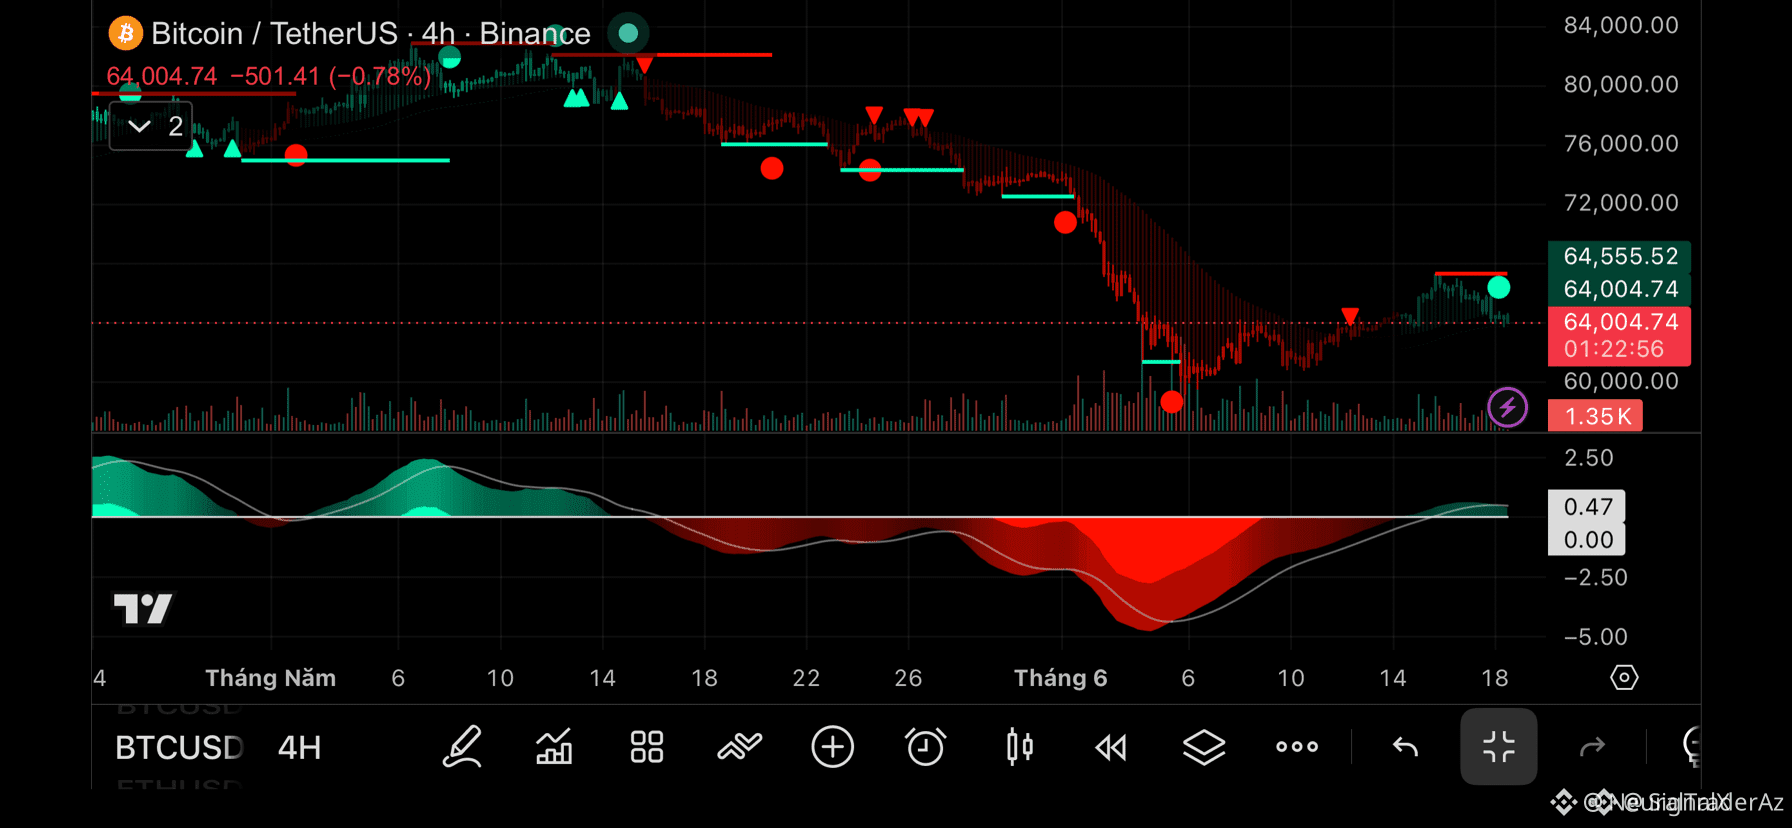
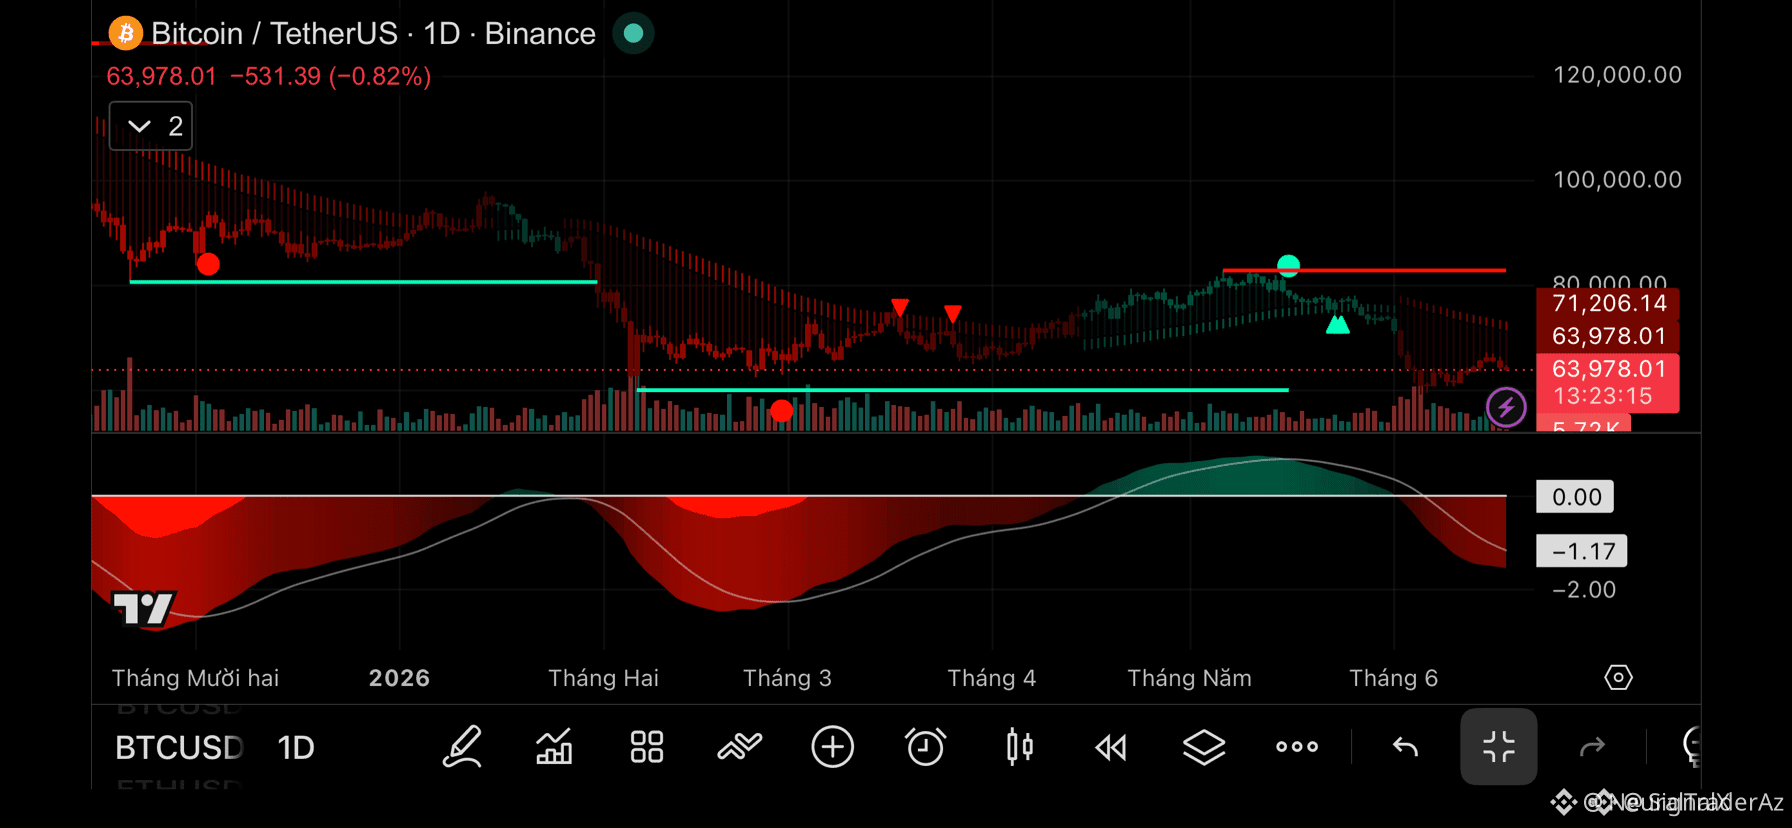
$BTC está en un punto de decisión crítico, con la estructura dominante manteniéndose bajista en marcos de tiempo más altos 🔍
Entrada: $65,500
Objetivo: $67,500
Stop Loss: $63,000
El mercado está mostrando signos de debilidad a corto plazo, con el precio sin poder establecer un máximo más alto y los vendedores defendiendo la zona de $65k-$66k. El momentum se está aplanando tras un rebote fugaz.
No es asesoramiento financiero. Maneja tu riesgo.
#BTC #LongSetup #CryptoMarketAnalysis
⚡
$BTC está en un punto de decisión crítico, con la estructura dominante manteniéndose bajista en marcos de tiempo más altos 🔍
Entrada: $65,500
Objetivo: $67,500
Stop Loss: $63,000
El mercado está mostrando signos de debilidad a corto plazo, con el precio sin poder establecer un máximo más alto y los vendedores defendiendo la zona de $65k-$66k. El momentum se está aplanando tras un rebote fugaz.
No es asesoramiento financiero. Maneja tu riesgo.
#BTC #LongSetup #CryptoMarketAnalysis
⚡
Entrada: $65,500
Objetivo: $67,500
Stop Loss: $63,000
El mercado está mostrando signos de debilidad a corto plazo, con el precio sin poder establecer un máximo más alto y los vendedores defendiendo la zona de $65k-$66k. El momentum se está aplanando tras un rebote fugaz.
No es asesoramiento financiero. Maneja tu riesgo.
#BTC #LongSetup #CryptoMarketAnalysis
⚡
54

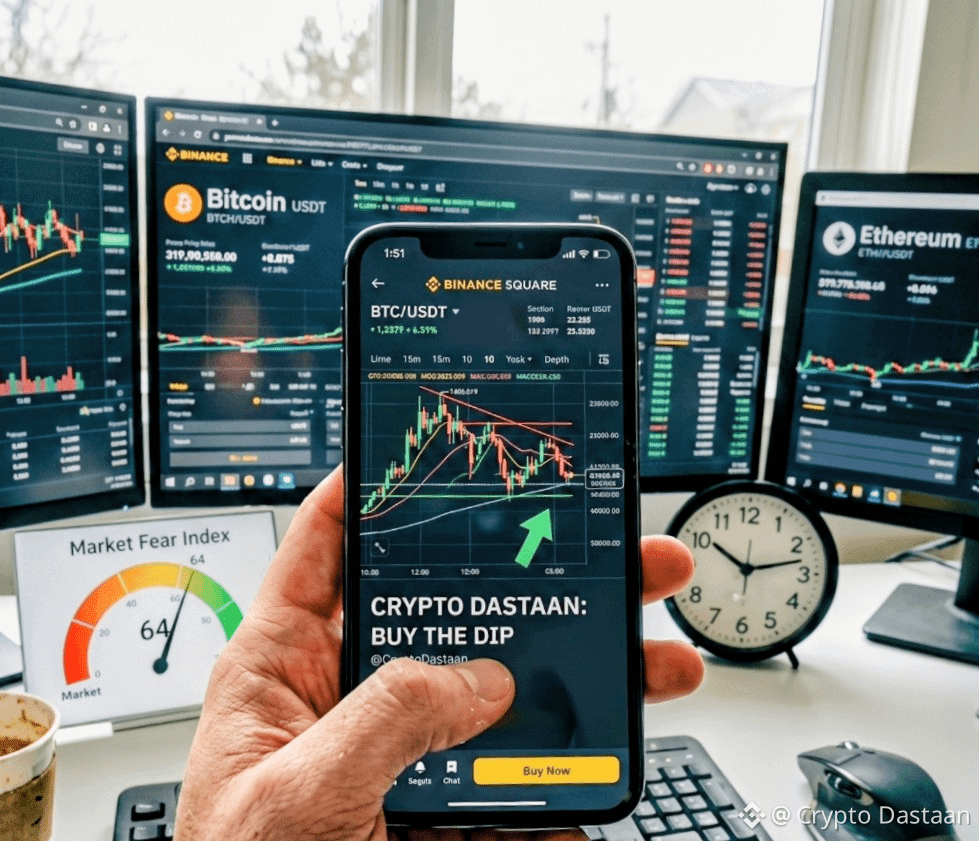
🚨 BTC cae por debajo de $64K: ¿Colapso del mercado o la oportunidad de compra definitiva? 📉🔥
¡El mercado cripto está experimentando una corrección significativa hoy! Bitcoin ($BTC) ha roto oficialmente por debajo del nivel de soporte crucial de $64,000, activando alertas de precio en todas partes. Junto con BTC, Ethereum ($ETH) ha caído por debajo de $1,700, y BNB se está negociando por debajo de $600.
Para muchos traders minoristas, el miedo está comenzando a hacer efecto. Pero los jugadores experimentados del mercado saben que las liquidaciones masivas a menudo abren el camino a los rebotes más saludables. ### 📊 Niveles Clave para Vigilar en Este Momento:
Soporte Inmediato: La anterior zona de acumulación importante alrededor del área de $62,500 – $63,000. Si BTC se mantiene aquí, podríamos ver un poderoso rally de alivio.
Resistencia: Para recuperar el impulso alcista, los compradores necesitan empujar a BTC de nuevo por encima del nivel de $65,500 con un volumen fuerte.
💡 Estrategia para Traders Inteligentes:
Entrar en pánico durante una caída nunca es la respuesta. En su lugar, busca proyectos sólidos que muestren resistencia o considera el Promedio de Costo en Dólares (DCA) en posiciones sólidas mientras el índice de miedo esté alto. Históricamente, comprar en los días rojos produce las mejores recompensas.
¿Estás comprando esta caída o estás esperando entradas más bajas? ¡Deja tu análisis técnico en los comentarios abajo! 👇
#BitcoinBinance #CryptoMarketAnalysis #BuyTheDip #TradingSignals #BinanceSquare
🚨 BTC cae por debajo de $64K: ¿Colapso del mercado o la oportunidad de compra definitiva? 📉🔥
¡El mercado cripto está experimentando una corrección significativa hoy! Bitcoin ($BTC) ha roto oficialmente por debajo del nivel de soporte crucial de $64,000, activando alertas de precio en todas partes. Junto con BTC, Ethereum ($ETH) ha caído por debajo de $1,700, y BNB se está negociando por debajo de $600.
Para muchos traders minoristas, el miedo está comenzando a hacer efecto. Pero los jugadores experimentados del mercado saben que las liquidaciones masivas a menudo abren el camino a los rebotes más saludables. ### 📊 Niveles Clave para Vigilar en Este Momento:
Soporte Inmediato: La anterior zona de acumulación importante alrededor del área de $62,500 – $63,000. Si BTC se mantiene aquí, podríamos ver un poderoso rally de alivio.
Resistencia: Para recuperar el impulso alcista, los compradores necesitan empujar a BTC de nuevo por encima del nivel de $65,500 con un volumen fuerte.
💡 Estrategia para Traders Inteligentes:
Entrar en pánico durante una caída nunca es la respuesta. En su lugar, busca proyectos sólidos que muestren resistencia o considera el Promedio de Costo en Dólares (DCA) en posiciones sólidas mientras el índice de miedo esté alto. Históricamente, comprar en los días rojos produce las mejores recompensas.
¿Estás comprando esta caída o estás esperando entradas más bajas? ¡Deja tu análisis técnico en los comentarios abajo! 👇
#BitcoinBinance #CryptoMarketAnalysis #BuyTheDip #TradingSignals #BinanceSquare
¡El mercado cripto está experimentando una corrección significativa hoy! Bitcoin ($BTC) ha roto oficialmente por debajo del nivel de soporte crucial de $64,000, activando alertas de precio en todas partes. Junto con BTC, Ethereum ($ETH) ha caído por debajo de $1,700, y BNB se está negociando por debajo de $600.
Para muchos traders minoristas, el miedo está comenzando a hacer efecto. Pero los jugadores experimentados del mercado saben que las liquidaciones masivas a menudo abren el camino a los rebotes más saludables. ### 📊 Niveles Clave para Vigilar en Este Momento:
Soporte Inmediato: La anterior zona de acumulación importante alrededor del área de $62,500 – $63,000. Si BTC se mantiene aquí, podríamos ver un poderoso rally de alivio.
Resistencia: Para recuperar el impulso alcista, los compradores necesitan empujar a BTC de nuevo por encima del nivel de $65,500 con un volumen fuerte.
💡 Estrategia para Traders Inteligentes:
Entrar en pánico durante una caída nunca es la respuesta. En su lugar, busca proyectos sólidos que muestren resistencia o considera el Promedio de Costo en Dólares (DCA) en posiciones sólidas mientras el índice de miedo esté alto. Históricamente, comprar en los días rojos produce las mejores recompensas.
¿Estás comprando esta caída o estás esperando entradas más bajas? ¡Deja tu análisis técnico en los comentarios abajo! 👇
#BitcoinBinance #CryptoMarketAnalysis #BuyTheDip #TradingSignals #BinanceSquare
131
·
--

Artículo
Resumen semanal del mercado cripto: mayores ganadores, mayores perdedores y niveles clave a vigilar📊 Cripto
Ganadores y perdedores semanales
🌐 Ánimo defensivo del mercado
📉 El aumento de los rendimientos del Tesoro, los precios del petróleo más altos y las expectativas más firmes de subidas de tasas de la Fed empujaron a Bitcoin por debajo de $77K, creando un entorno cripto más defensivo.
💰 A pesar de la presión, el capital siguió rotando hacia tokens DeFi, de privacidad, de IA y enfocados en la utilidad.
🚀 Ganadores semanales
🔥 Token de Venecia (VVV): +35%+
📈 VVV fue el mejor rendimiento semanal entre los principales, rompiendo por encima de la resistencia clave de $20 mientras su RSI semanal se mantuvo por debajo de la zona de sobrecompra.
Resumen semanal del mercado cripto: mayores ganadores, mayores perdedores y niveles clave a vigilar
📊 Cripto
Ganadores y perdedores semanales
🌐 Ánimo defensivo del mercado
📉 El aumento de los rendimientos del Tesoro, los precios del petróleo más altos y las expectativas más firmes de subidas de tasas de la Fed empujaron a Bitcoin por debajo de $77K, creando un entorno cripto más defensivo.
💰 A pesar de la presión, el capital siguió rotando hacia tokens DeFi, de privacidad, de IA y enfocados en la utilidad.
🚀 Ganadores semanales
🔥 Token de Venecia (VVV): +35%+
📈 VVV fue el mejor rendimiento semanal entre los principales, rompiendo por encima de la resistencia clave de $20 mientras su RSI semanal se mantuvo por debajo de la zona de sobrecompra.
Ganadores y perdedores semanales
🌐 Ánimo defensivo del mercado
📉 El aumento de los rendimientos del Tesoro, los precios del petróleo más altos y las expectativas más firmes de subidas de tasas de la Fed empujaron a Bitcoin por debajo de $77K, creando un entorno cripto más defensivo.
💰 A pesar de la presión, el capital siguió rotando hacia tokens DeFi, de privacidad, de IA y enfocados en la utilidad.
🚀 Ganadores semanales
🔥 Token de Venecia (VVV): +35%+
📈 VVV fue el mejor rendimiento semanal entre los principales, rompiendo por encima de la resistencia clave de $20 mientras su RSI semanal se mantuvo por debajo de la zona de sobrecompra.
4
507

·
--
Alcista
💰 UNA MONEDA CON MAYOR LIQUIDEZ SIGUE DANDO EL MENSAJE
Después de toda la movida de las altcoins, necesitamos volver al activo que sigue dominando el mercado.
$BTC está en la región de 77–78 mil USD, y CoinDesk apunta cerca de 13,7 mil millones de USD en negociación en las últimas 24 h en su referencia actual. La dominancia de Bitcoin también permanece cerca del 59% en otra lectura del mercado.
Esto significa que, a pesar del ruido de las altcoins, una parte enorme del capital sigue concentrada en Bitcoin.
Y aquí está el dato que yo observaría:
si la dominancia empieza a caer mientras BTC sostiene el precio, las altcoins pueden empezar a recibir una porción mayor de ese dinero.
💬 ¿El próximo gran movimiento volverá a ser de $BTC o de las ALTCOINS?
🔔 Sigue mi perfil para acompañar esta rotación.
#Bitcoin #BTC #Altcoins #CryptoMarketAnalysis
{spot}(BTCUSDT)
💰 UNA MONEDA CON MAYOR LIQUIDEZ SIGUE DANDO EL MENSAJE
Después de toda la movida de las altcoins, necesitamos volver al activo que sigue dominando el mercado.
$BTC está en la región de 77–78 mil USD, y CoinDesk apunta cerca de 13,7 mil millones de USD en negociación en las últimas 24 h en su referencia actual. La dominancia de Bitcoin también permanece cerca del 59% en otra lectura del mercado.
Esto significa que, a pesar del ruido de las altcoins, una parte enorme del capital sigue concentrada en Bitcoin.
Y aquí está el dato que yo observaría:
si la dominancia empieza a caer mientras BTC sostiene el precio, las altcoins pueden empezar a recibir una porción mayor de ese dinero.
💬 ¿El próximo gran movimiento volverá a ser de $BTC o de las ALTCOINS?
🔔 Sigue mi perfil para acompañar esta rotación.
#Bitcoin #BTC #Altcoins #CryptoMarketAnalysis
Después de toda la movida de las altcoins, necesitamos volver al activo que sigue dominando el mercado.
$BTC está en la región de 77–78 mil USD, y CoinDesk apunta cerca de 13,7 mil millones de USD en negociación en las últimas 24 h en su referencia actual. La dominancia de Bitcoin también permanece cerca del 59% en otra lectura del mercado.
Esto significa que, a pesar del ruido de las altcoins, una parte enorme del capital sigue concentrada en Bitcoin.
Y aquí está el dato que yo observaría:
si la dominancia empieza a caer mientras BTC sostiene el precio, las altcoins pueden empezar a recibir una porción mayor de ese dinero.
💬 ¿El próximo gran movimiento volverá a ser de $BTC o de las ALTCOINS?
🔔 Sigue mi perfil para acompañar esta rotación.
#Bitcoin #BTC #Altcoins #CryptoMarketAnalysis

168
·
--

Artículo
Alerta de rally cripto: principales movimientos de altcoins y monedas meme de Binance hoy📊 Análisis del mercado cripto de Binance — 22 de septiembre de 2026
El mercado cripto entra en la sesión de hoy con un fuerte impulso alcista, liderado por Bitcoin y una recuperación generalizada en grandes altcoins y monedas meme.
Bitcoin ha vuelto a situarse por encima de $85K–$86K, mientras que ETH, XRP, SOL y DOGE también están registrando ganancias considerables.
🚀 1. Resumen actual del mercado cripto
El informe actual del mercado sitúa la capitalización total de las criptomonedas en torno a $2.9T–$3.0T, con una dominancia de Bitcoin de aproximadamente 59%.
🚀 Top 5 ganadores de altcoins
🔥 PHA lidera el grupo con un salto diario del 30.57%, acompañado de $182M en volumen.
Alerta de rally cripto: principales movimientos de altcoins y monedas meme de Binance hoy
📊 Análisis del mercado cripto de Binance — 22 de septiembre de 2026
El mercado cripto entra en la sesión de hoy con un fuerte impulso alcista, liderado por Bitcoin y una recuperación generalizada en grandes altcoins y monedas meme.
Bitcoin ha vuelto a situarse por encima de $85K–$86K, mientras que ETH, XRP, SOL y DOGE también están registrando ganancias considerables.
🚀 1. Resumen actual del mercado cripto
El informe actual del mercado sitúa la capitalización total de las criptomonedas en torno a $2.9T–$3.0T, con una dominancia de Bitcoin de aproximadamente 59%.
🚀 Top 5 ganadores de altcoins
🔥 PHA lidera el grupo con un salto diario del 30.57%, acompañado de $182M en volumen.
El mercado cripto entra en la sesión de hoy con un fuerte impulso alcista, liderado por Bitcoin y una recuperación generalizada en grandes altcoins y monedas meme.
Bitcoin ha vuelto a situarse por encima de $85K–$86K, mientras que ETH, XRP, SOL y DOGE también están registrando ganancias considerables.
🚀 1. Resumen actual del mercado cripto
El informe actual del mercado sitúa la capitalización total de las criptomonedas en torno a $2.9T–$3.0T, con una dominancia de Bitcoin de aproximadamente 59%.
🚀 Top 5 ganadores de altcoins
🔥 PHA lidera el grupo con un salto diario del 30.57%, acompañado de $182M en volumen.
2
852

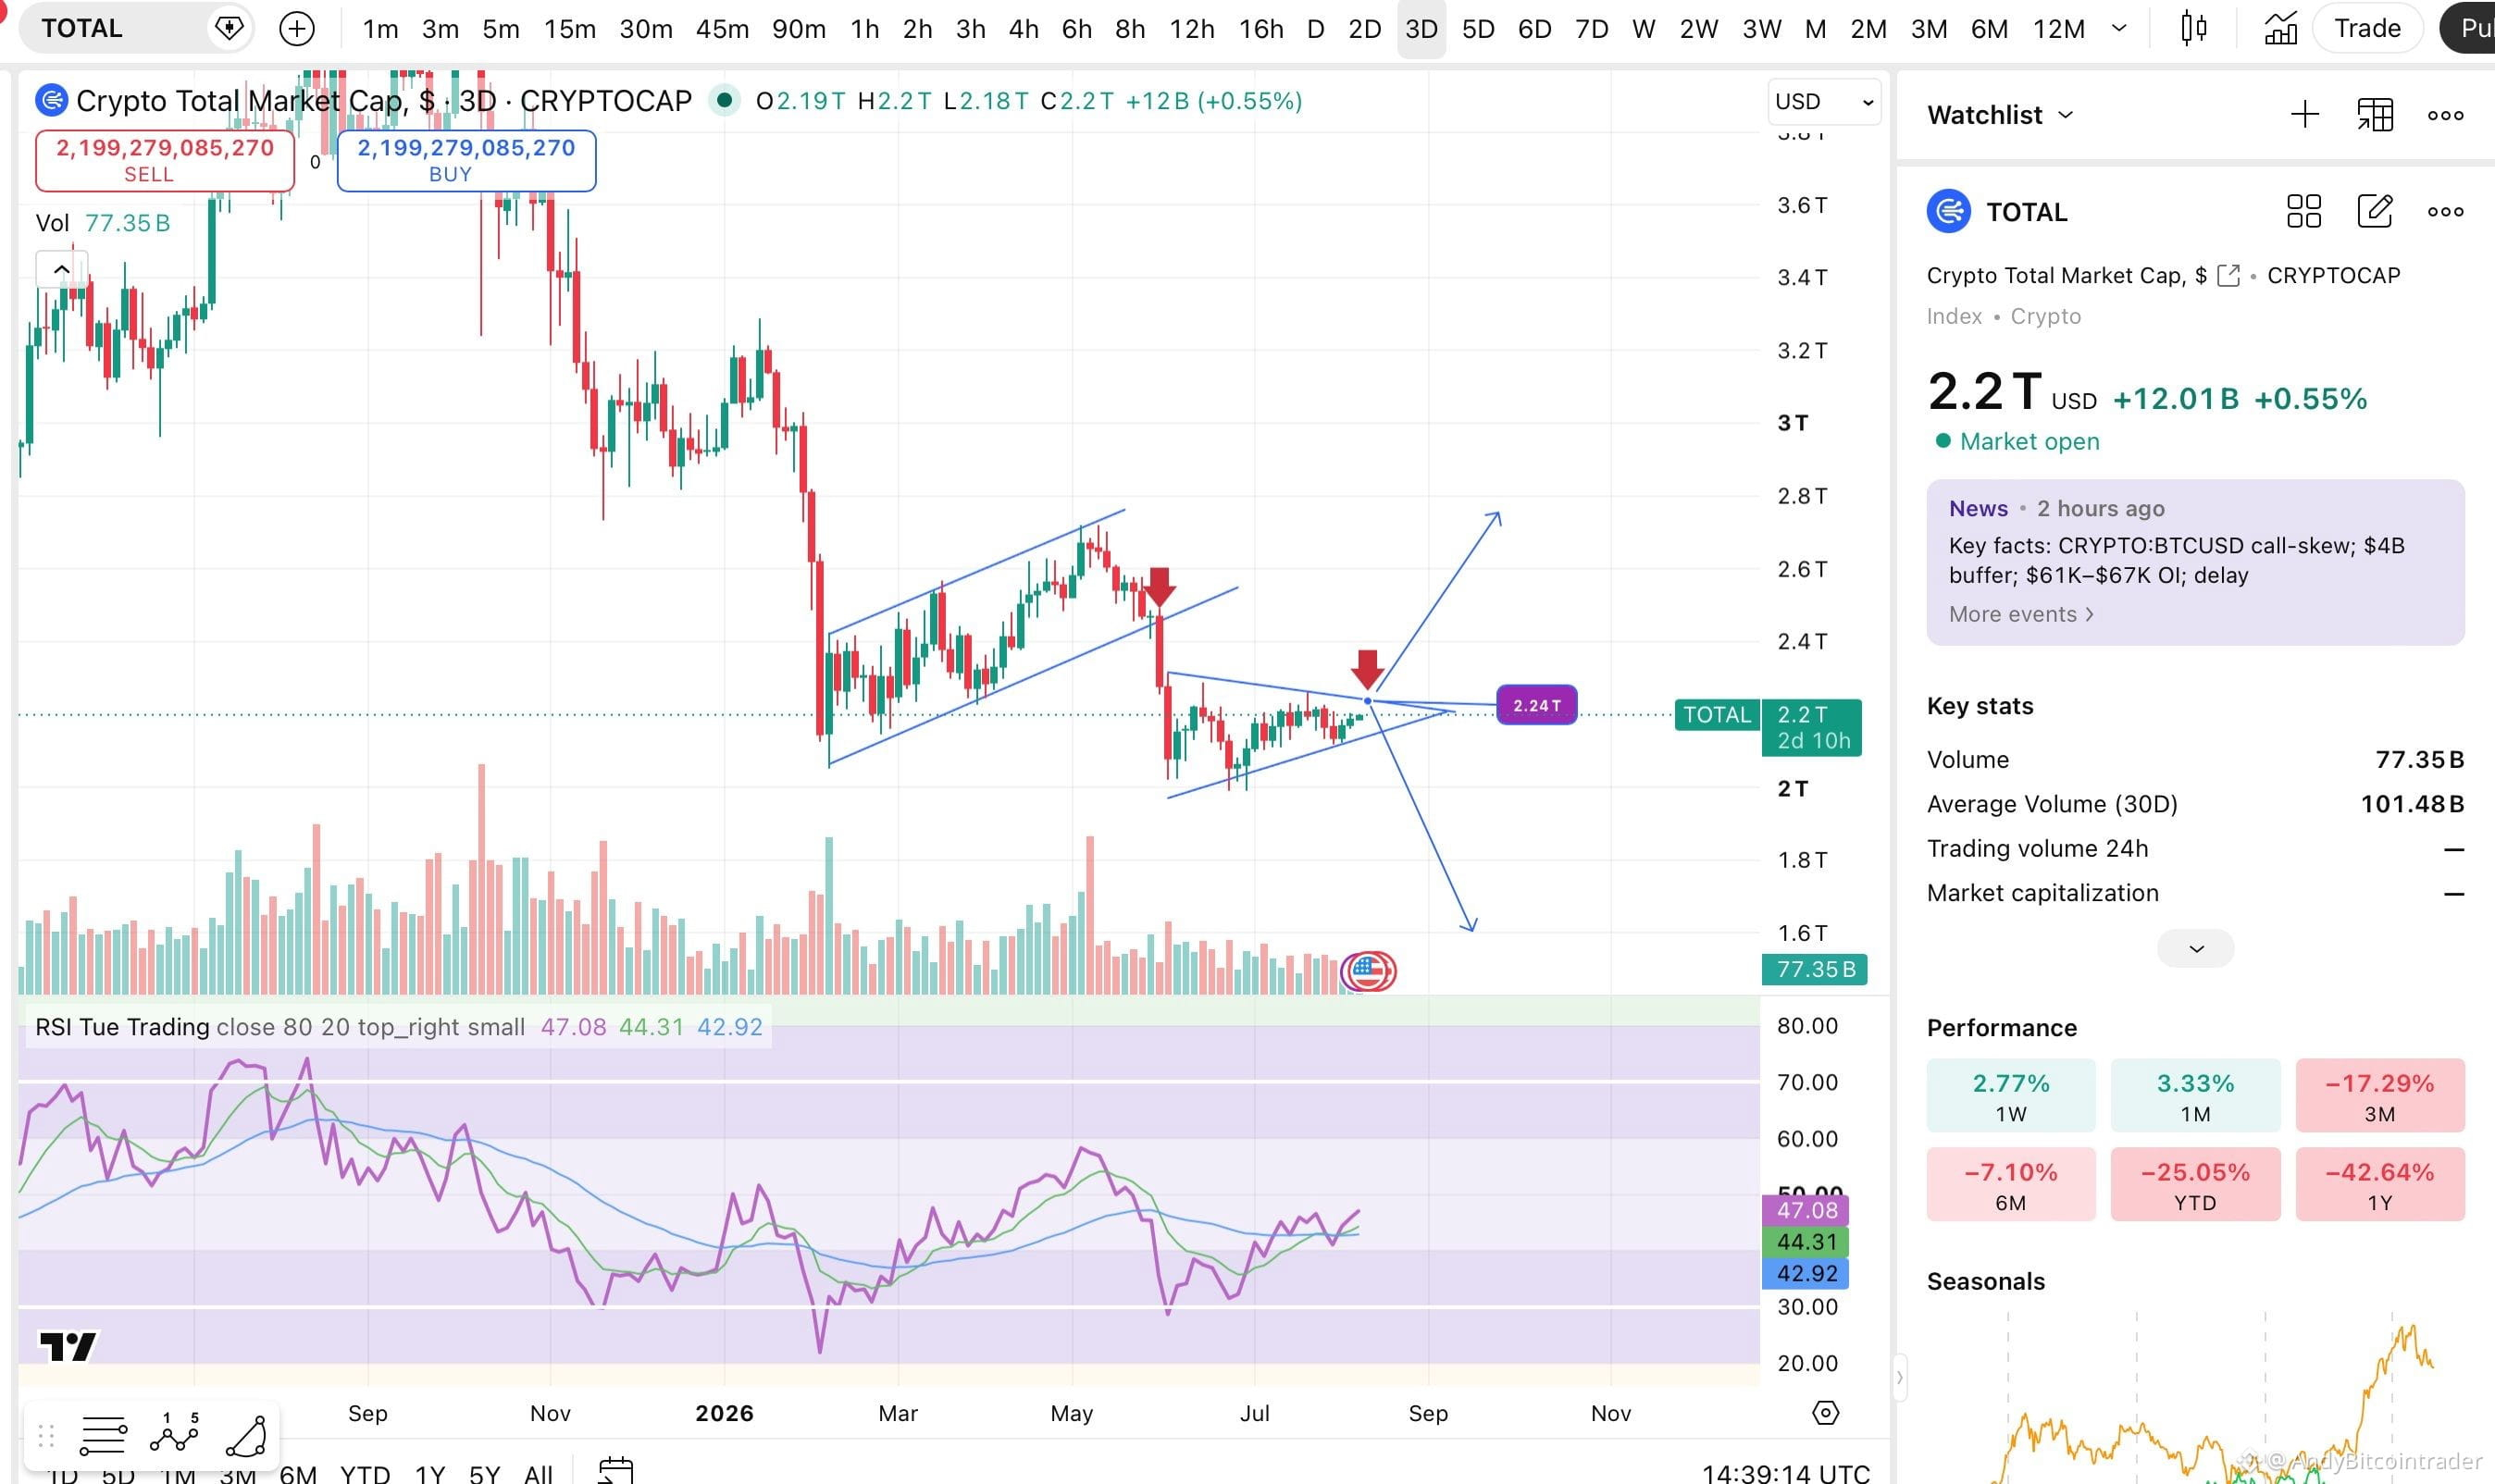
Hoy 9.8/2026 hablaré sobre el Total Crypto Marketcap
$Crypto - El valor de mercado de las criptomonedas está intentando volver a poner a prueba la resistencia de 2.3–2.4 billones... si este nivel es rechazado por tercera vez más, tendremos un escenario en el que el BTC caiga con fuerza y el fondo del mercado de capitalización podría bajar aún más, hasta por debajo de 1.8 billones
#CryptoMarketAnalysis
Hoy 9.8/2026 hablaré sobre el Total Crypto Marketcap
$Crypto - El valor de mercado de las criptomonedas está intentando volver a poner a prueba la resistencia de 2.3–2.4 billones... si este nivel es rechazado por tercera vez más, tendremos un escenario en el que el BTC caiga con fuerza y el fondo del mercado de capitalización podría bajar aún más, hasta por debajo de 1.8 billones
#CryptoMarketAnalysis
$Crypto - El valor de mercado de las criptomonedas está intentando volver a poner a prueba la resistencia de 2.3–2.4 billones... si este nivel es rechazado por tercera vez más, tendremos un escenario en el que el BTC caiga con fuerza y el fondo del mercado de capitalización podría bajar aún más, hasta por debajo de 1.8 billones
#CryptoMarketAnalysis
53
·
--

Artículo
Resumen del mercado cripto: impulso selectivo, rupturas de altcoins y auge de monedas meme🌐 Estructura general del mercado
📊 El mercado de criptomonedas atraviesa actualmente una fase correctiva leve, con la capitalización total fluctuando alrededor de entre $2.2T y $2.7T.
₿ La dominancia de Bitcoin se mantiene elevada cerca del 57%–59%, lo que indica que el capital sigue favoreciendo a Bitcoin frente a muchas altcoins a pesar de las fuertes subidas en algunos activos de menor capitalización.
📉 Los principales índices de mercado han experimentado una corrección de aproximadamente un 2% durante las últimas 24 horas, lo que sugiere toma de beneficios a corto plazo y una postura prudente.
Resumen del mercado cripto: impulso selectivo, rupturas de altcoins y auge de monedas meme
🌐 Estructura general del mercado
📊 El mercado de criptomonedas atraviesa actualmente una fase correctiva leve, con la capitalización total fluctuando alrededor de entre $2.2T y $2.7T.
₿ La dominancia de Bitcoin se mantiene elevada cerca del 57%–59%, lo que indica que el capital sigue favoreciendo a Bitcoin frente a muchas altcoins a pesar de las fuertes subidas en algunos activos de menor capitalización.
📉 Los principales índices de mercado han experimentado una corrección de aproximadamente un 2% durante las últimas 24 horas, lo que sugiere toma de beneficios a corto plazo y una postura prudente.
📊 El mercado de criptomonedas atraviesa actualmente una fase correctiva leve, con la capitalización total fluctuando alrededor de entre $2.2T y $2.7T.
₿ La dominancia de Bitcoin se mantiene elevada cerca del 57%–59%, lo que indica que el capital sigue favoreciendo a Bitcoin frente a muchas altcoins a pesar de las fuertes subidas en algunos activos de menor capitalización.
📉 Los principales índices de mercado han experimentado una corrección de aproximadamente un 2% durante las últimas 24 horas, lo que sugiere toma de beneficios a corto plazo y una postura prudente.
1
2
242

·
--
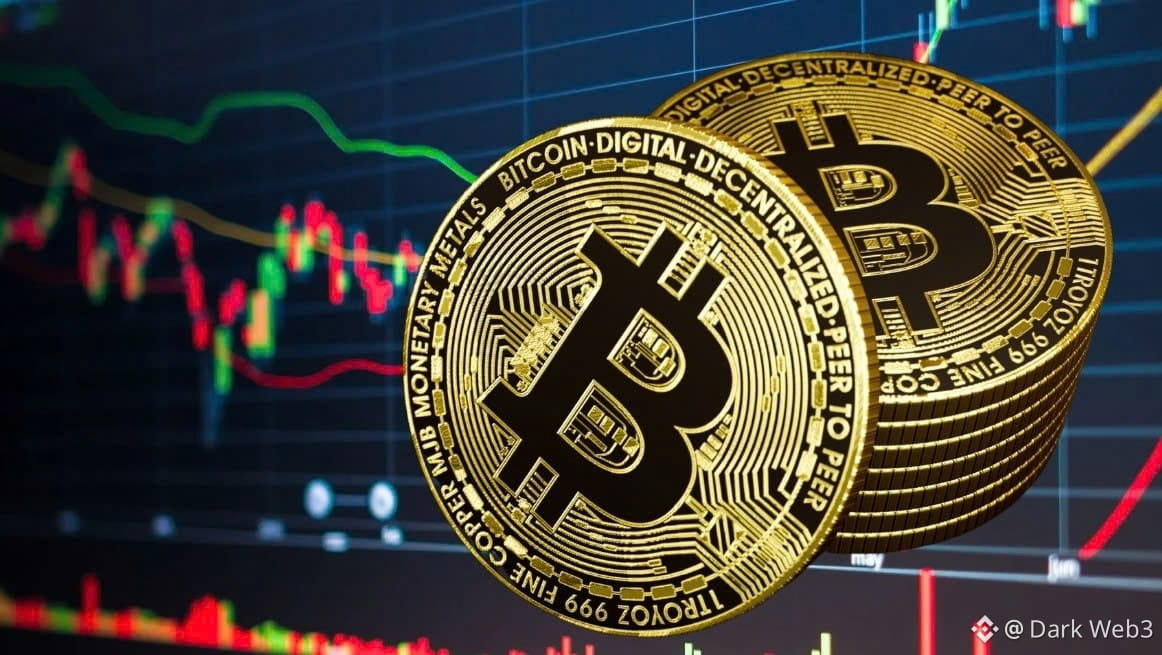
📈 INFORME DE BALLENAS: Bitcoin se acerca al precio realizado de $53,300, una señal histórica de suelo
Bitcoin está aproximadamente a $5,000 de alcanzar su precio realizado de $53,300, un nivel que históricamente ha marcado el final de los ciclos bajistas y que se considera una oportunidad de compra inmejorable. Sin embargo, la presencia de inversores institucionales podría alterar la dinámica del mercado en comparación con el pasado.
El precio realizado, que representa el costo promedio de todas las $BTC en circulación, actualmente está alrededor de $53,300. Según CryptoQuant, $BTC se está negociando cerca de un 10% por encima de este nivel. Desde el final del mercado bajista de 2022, $BTC no ha negociado por debajo de este umbral, por lo que una posible ruptura o acercamiento al precio realizado es un evento significativo.
Analistas, incluido Crypto Sunmoon, enfatizan que en el pasado, en cada ciclo bajista, $BTC ha caído por debajo de su precio realizado, lo cual siempre ha sido una oportunidad de compra clave para el siguiente ciclo. Si $BTC volviera a caer por debajo de su precio realizado, podría ser una señal para invertir para el próximo ciclo, según la consistencia de este modelo a lo largo de décadas.
#halvingjobs #Bitcoin #AnálisisDelMercadoCripto
📈 INFORME DE BALLENAS: Bitcoin se acerca al precio realizado de $53,300, una señal histórica de suelo
Bitcoin está aproximadamente a $5,000 de alcanzar su precio realizado de $53,300, un nivel que históricamente ha marcado el final de los ciclos bajistas y que se considera una oportunidad de compra inmejorable. Sin embargo, la presencia de inversores institucionales podría alterar la dinámica del mercado en comparación con el pasado.
El precio realizado, que representa el costo promedio de todas las $BTC en circulación, actualmente está alrededor de $53,300. Según CryptoQuant, $BTC se está negociando cerca de un 10% por encima de este nivel. Desde el final del mercado bajista de 2022, $BTC no ha negociado por debajo de este umbral, por lo que una posible ruptura o acercamiento al precio realizado es un evento significativo.
Analistas, incluido Crypto Sunmoon, enfatizan que en el pasado, en cada ciclo bajista, $BTC ha caído por debajo de su precio realizado, lo cual siempre ha sido una oportunidad de compra clave para el siguiente ciclo. Si $BTC volviera a caer por debajo de su precio realizado, podría ser una señal para invertir para el próximo ciclo, según la consistencia de este modelo a lo largo de décadas.
#halvingjobs #Bitcoin #AnálisisDelMercadoCripto
Bitcoin está aproximadamente a $5,000 de alcanzar su precio realizado de $53,300, un nivel que históricamente ha marcado el final de los ciclos bajistas y que se considera una oportunidad de compra inmejorable. Sin embargo, la presencia de inversores institucionales podría alterar la dinámica del mercado en comparación con el pasado.
El precio realizado, que representa el costo promedio de todas las $BTC en circulación, actualmente está alrededor de $53,300. Según CryptoQuant, $BTC se está negociando cerca de un 10% por encima de este nivel. Desde el final del mercado bajista de 2022, $BTC no ha negociado por debajo de este umbral, por lo que una posible ruptura o acercamiento al precio realizado es un evento significativo.
Analistas, incluido Crypto Sunmoon, enfatizan que en el pasado, en cada ciclo bajista, $BTC ha caído por debajo de su precio realizado, lo cual siempre ha sido una oportunidad de compra clave para el siguiente ciclo. Si $BTC volviera a caer por debajo de su precio realizado, podría ser una señal para invertir para el próximo ciclo, según la consistencia de este modelo a lo largo de décadas.
#halvingjobs #Bitcoin #AnálisisDelMercadoCripto
110
·
--
El modelo de ley de potencia del Bitcoin dice que 58K es normal.
Bitcoin acaba de alcanzar los $58.000 y la internet perdió la cabeza. Pero el modelo de ley de potencia —que ha seguido la trayectoria del precio de Bitcoin desde 2012— dice que esto es exactamente donde deberíamos estar en el ciclo actual.
El modelo relaciona el precio con el tiempo en una escala logarítmica, mostrando que el crecimiento a largo plazo de Bitcoin sigue un canal predecible. Cada mínimo de ciclo ha rebotado en la banda inferior del modelo, y los $58K están justo encima.
Sin embargo, los datos de futuros pintan un panorama más sombrío. El interés abierto está bajando, las tasas de financiación son negativas y los mercados de opciones están valorando un movimiento hacia los $50K. La brecha entre el “suelo” de la ley de potencia y el sentimiento en derivados es la más amplia desde el mínimo de 2022.
Aquí está la pregunta real: ¿la ley de potencia se sostendrá de nuevo, o este es el ciclo en el que el modelo falla? Cada vez que Bitcoin cayó hasta la banda inferior antes, se recuperó y alcanzó nuevos máximos. Pero esta vez, los vientos en contra macro son distintos: la incertidumbre de tasas, las salidas de ETFs y las acciones débiles están presionando todo al mismo tiempo.
Las ofertas se están acumulando en $56K-$58K en los libros de órdenes principales. Si ese suelo se mantiene, podríamos ver un rally de alivio. Si se rompe, el siguiente soporte está alrededor de los $48K.
¿Dónde crees que Bitcoin encontrará su suelo esta vez? 👇
#BitcoinPowerLaw #BTCPriceModel #CryptoMarketAnalysis
El modelo de ley de potencia del Bitcoin dice que 58K es normal.
Bitcoin acaba de alcanzar los $58.000 y la internet perdió la cabeza. Pero el modelo de ley de potencia —que ha seguido la trayectoria del precio de Bitcoin desde 2012— dice que esto es exactamente donde deberíamos estar en el ciclo actual.
El modelo relaciona el precio con el tiempo en una escala logarítmica, mostrando que el crecimiento a largo plazo de Bitcoin sigue un canal predecible. Cada mínimo de ciclo ha rebotado en la banda inferior del modelo, y los $58K están justo encima.
Sin embargo, los datos de futuros pintan un panorama más sombrío. El interés abierto está bajando, las tasas de financiación son negativas y los mercados de opciones están valorando un movimiento hacia los $50K. La brecha entre el “suelo” de la ley de potencia y el sentimiento en derivados es la más amplia desde el mínimo de 2022.
Aquí está la pregunta real: ¿la ley de potencia se sostendrá de nuevo, o este es el ciclo en el que el modelo falla? Cada vez que Bitcoin cayó hasta la banda inferior antes, se recuperó y alcanzó nuevos máximos. Pero esta vez, los vientos en contra macro son distintos: la incertidumbre de tasas, las salidas de ETFs y las acciones débiles están presionando todo al mismo tiempo.
Las ofertas se están acumulando en $56K-$58K en los libros de órdenes principales. Si ese suelo se mantiene, podríamos ver un rally de alivio. Si se rompe, el siguiente soporte está alrededor de los $48K.
¿Dónde crees que Bitcoin encontrará su suelo esta vez? 👇
#BitcoinPowerLaw #BTCPriceModel #CryptoMarketAnalysis
Bitcoin acaba de alcanzar los $58.000 y la internet perdió la cabeza. Pero el modelo de ley de potencia —que ha seguido la trayectoria del precio de Bitcoin desde 2012— dice que esto es exactamente donde deberíamos estar en el ciclo actual.
El modelo relaciona el precio con el tiempo en una escala logarítmica, mostrando que el crecimiento a largo plazo de Bitcoin sigue un canal predecible. Cada mínimo de ciclo ha rebotado en la banda inferior del modelo, y los $58K están justo encima.
Sin embargo, los datos de futuros pintan un panorama más sombrío. El interés abierto está bajando, las tasas de financiación son negativas y los mercados de opciones están valorando un movimiento hacia los $50K. La brecha entre el “suelo” de la ley de potencia y el sentimiento en derivados es la más amplia desde el mínimo de 2022.
Aquí está la pregunta real: ¿la ley de potencia se sostendrá de nuevo, o este es el ciclo en el que el modelo falla? Cada vez que Bitcoin cayó hasta la banda inferior antes, se recuperó y alcanzó nuevos máximos. Pero esta vez, los vientos en contra macro son distintos: la incertidumbre de tasas, las salidas de ETFs y las acciones débiles están presionando todo al mismo tiempo.
Las ofertas se están acumulando en $56K-$58K en los libros de órdenes principales. Si ese suelo se mantiene, podríamos ver un rally de alivio. Si se rompe, el siguiente soporte está alrededor de los $48K.
¿Dónde crees que Bitcoin encontrará su suelo esta vez? 👇
#BitcoinPowerLaw #BTCPriceModel #CryptoMarketAnalysis
1
84

·
--
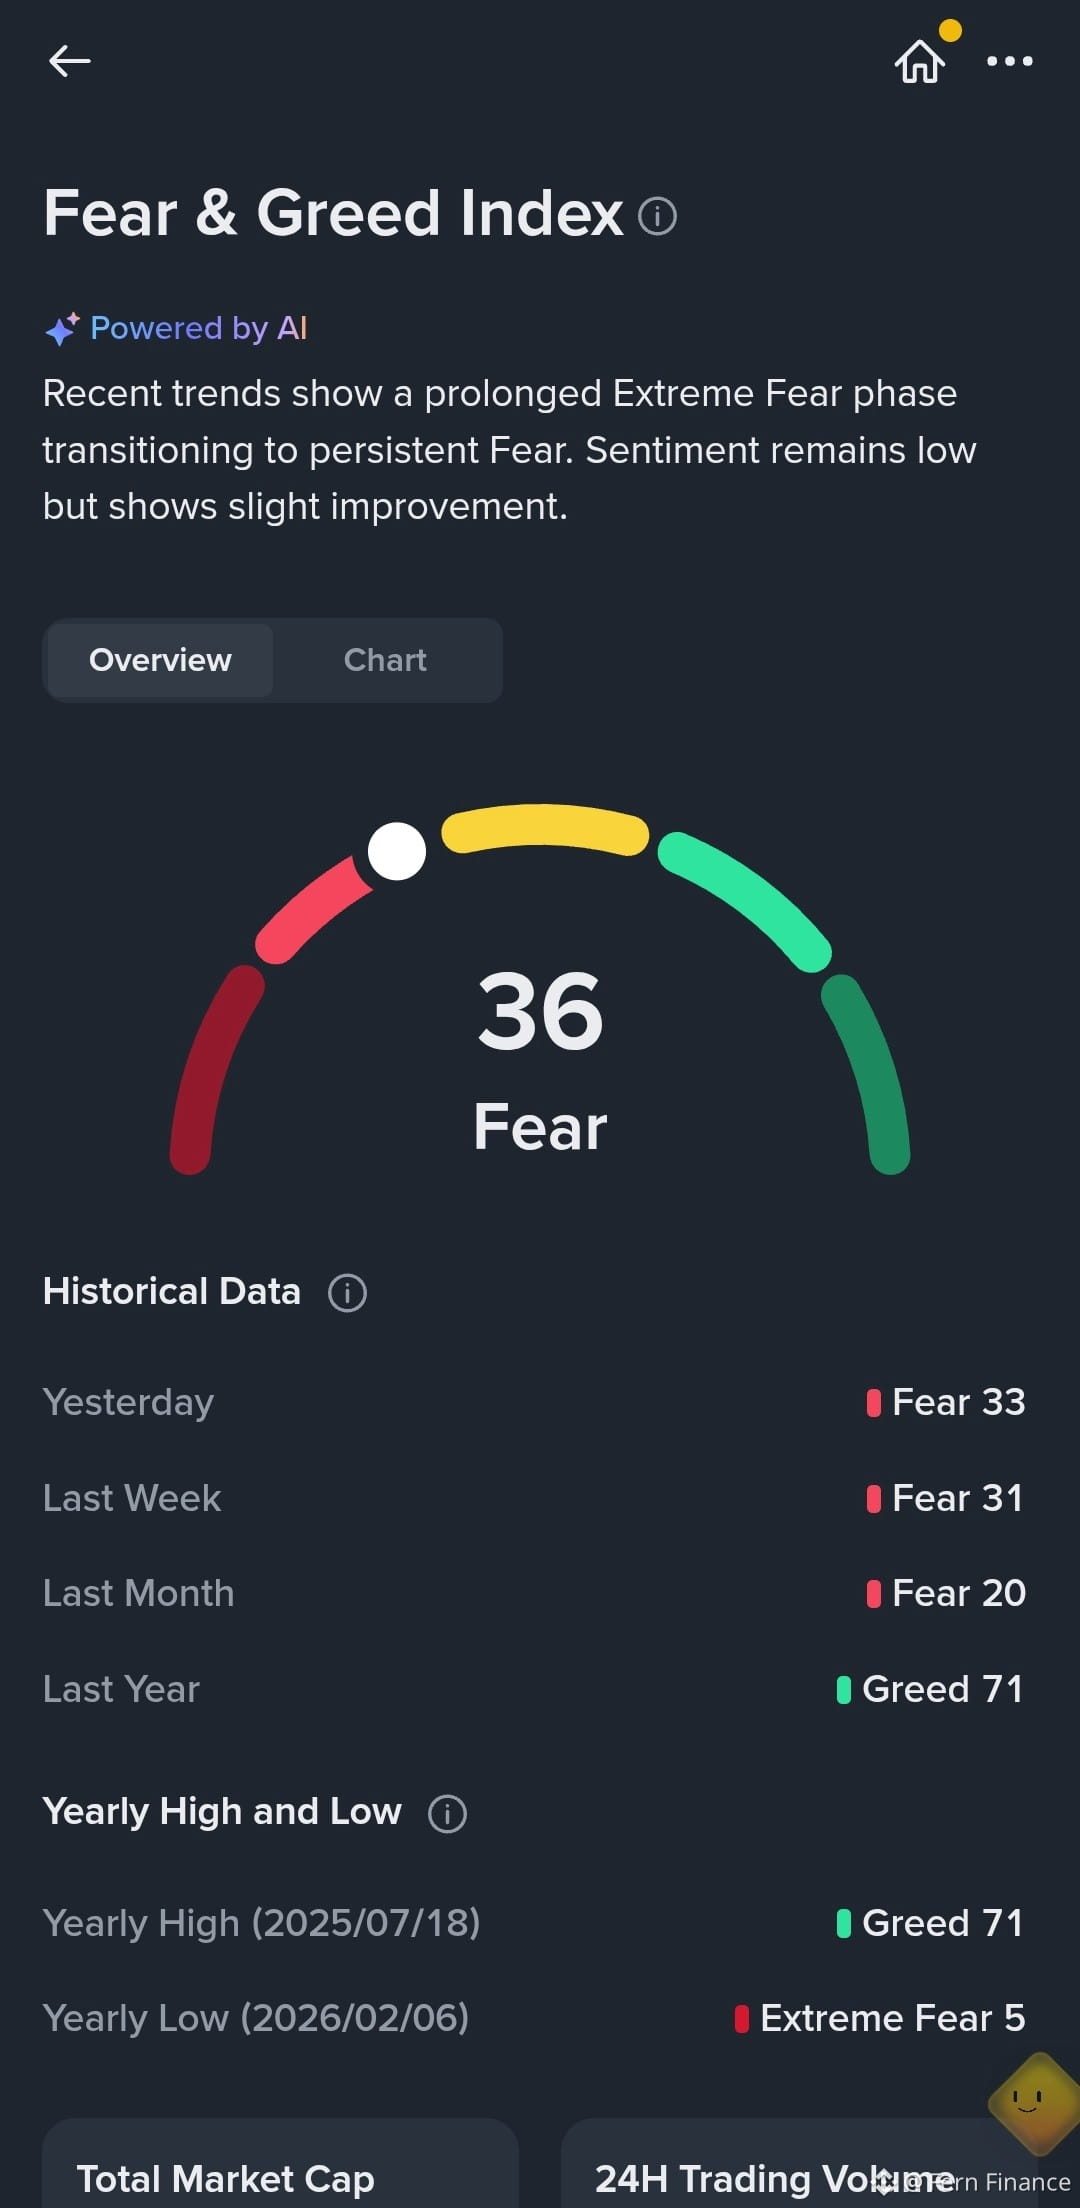
🚨 Cambio de Sentimiento: ¡El Índice Cripto Llega a 36! ¿Los Acumuladores Inteligentes Están Comprando en Silencio el Aburrimiento? 📉📈
¡Hey, Square Traders! 🚀
El mercado cripto nos está enviando hoy una señal psicológica importante. Si solo miras los gráficos de precios, te estás perdiendo el panorama más grande. Desglosémoslo: lo que el Índice de Miedo y Codicia y las métricas on-chain nos están diciendo ahora mismo. 🧠
🔍 La Gran Anomalía: Los Precios Avanzan Lento, el Volumen Desaparece
El dato más interesante de nuestro panel no es el precio: es la liquidez.
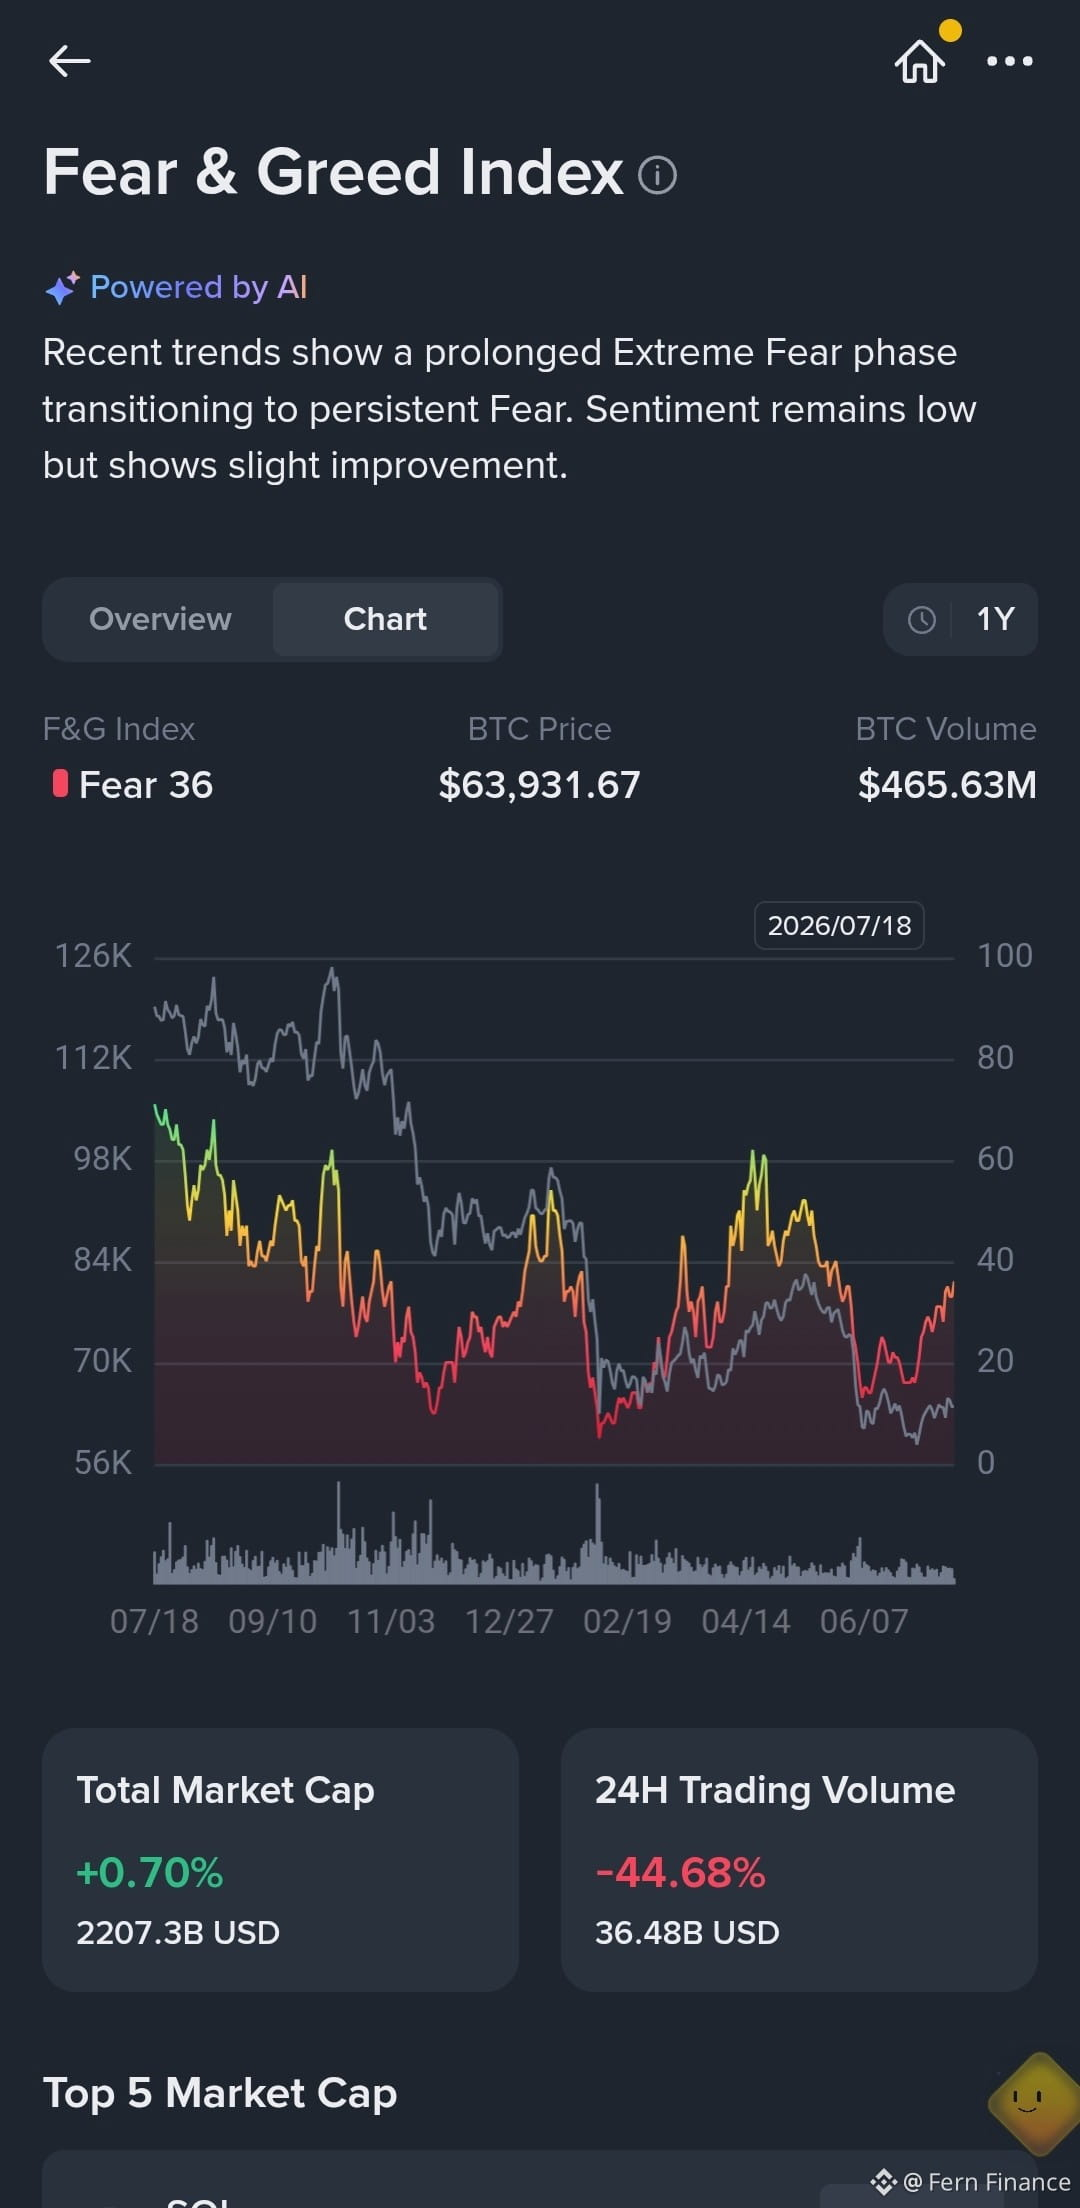
Capitalización Total: $2.20T (+0.70%)
Volumen de Trading 24H: $36.48B (-44.68%)
💡 ¿Qué significa esto? La capitalización total se mantiene firme y sube ligeramente, pero el volumen de trading se ha desplomado por completo (cayendo casi un 45%). Esto indica una fase clásica de aburrimiento y agotamiento. Los vendedores ya están cansados de vender, y los traders minoristas se quedan con las manos quietas esperando un gatillo definitivo. Históricamente, las subidas con poco volumen en una zona de "Miedo" representan grandes ventanas de acumulación para el capital paciente.
🎯 Mi Plan de Juego
Cuando el mercado está en un estado de Miedo con bajo volumen, perseguir las velas verdes suele ser una trampa. En cambio, este es el entorno donde promediar a la baja (DCA) en posiciones spot da sus frutos. Estoy vigilando un aumento del volumen para confirmar si esta ligera mejora del sentimiento tiene piernas reales.
👇 ¡Hablemos en los comentarios!
¿Estás comprando esta consolidación de bajo volumen, o crees que vamos a ver otra oleada de FUD antes de subir? ¡Deja tus objetivos abajo!
#CryptoMarketAnalysis #tradingstrategy
$BTC $BNB $BANK
{spot}(BTCUSDT)
🚨 Cambio de Sentimiento: ¡El Índice Cripto Llega a 36! ¿Los Acumuladores Inteligentes Están Comprando en Silencio el Aburrimiento? 📉📈
¡Hey, Square Traders! 🚀
El mercado cripto nos está enviando hoy una señal psicológica importante. Si solo miras los gráficos de precios, te estás perdiendo el panorama más grande. Desglosémoslo: lo que el Índice de Miedo y Codicia y las métricas on-chain nos están diciendo ahora mismo. 🧠
🔍 La Gran Anomalía: Los Precios Avanzan Lento, el Volumen Desaparece
El dato más interesante de nuestro panel no es el precio: es la liquidez.
Capitalización Total: $2.20T (+0.70%)
Volumen de Trading 24H: $36.48B (-44.68%)
💡 ¿Qué significa esto? La capitalización total se mantiene firme y sube ligeramente, pero el volumen de trading se ha desplomado por completo (cayendo casi un 45%). Esto indica una fase clásica de aburrimiento y agotamiento. Los vendedores ya están cansados de vender, y los traders minoristas se quedan con las manos quietas esperando un gatillo definitivo. Históricamente, las subidas con poco volumen en una zona de "Miedo" representan grandes ventanas de acumulación para el capital paciente.
🎯 Mi Plan de Juego
Cuando el mercado está en un estado de Miedo con bajo volumen, perseguir las velas verdes suele ser una trampa. En cambio, este es el entorno donde promediar a la baja (DCA) en posiciones spot da sus frutos. Estoy vigilando un aumento del volumen para confirmar si esta ligera mejora del sentimiento tiene piernas reales.
👇 ¡Hablemos en los comentarios!
¿Estás comprando esta consolidación de bajo volumen, o crees que vamos a ver otra oleada de FUD antes de subir? ¡Deja tus objetivos abajo!
#CryptoMarketAnalysis #tradingstrategy
$BTC $BNB $BANK
¡Hey, Square Traders! 🚀
El mercado cripto nos está enviando hoy una señal psicológica importante. Si solo miras los gráficos de precios, te estás perdiendo el panorama más grande. Desglosémoslo: lo que el Índice de Miedo y Codicia y las métricas on-chain nos están diciendo ahora mismo. 🧠
🔍 La Gran Anomalía: Los Precios Avanzan Lento, el Volumen Desaparece
El dato más interesante de nuestro panel no es el precio: es la liquidez.
Capitalización Total: $2.20T (+0.70%)
Volumen de Trading 24H: $36.48B (-44.68%)
💡 ¿Qué significa esto? La capitalización total se mantiene firme y sube ligeramente, pero el volumen de trading se ha desplomado por completo (cayendo casi un 45%). Esto indica una fase clásica de aburrimiento y agotamiento. Los vendedores ya están cansados de vender, y los traders minoristas se quedan con las manos quietas esperando un gatillo definitivo. Históricamente, las subidas con poco volumen en una zona de "Miedo" representan grandes ventanas de acumulación para el capital paciente.
🎯 Mi Plan de Juego
Cuando el mercado está en un estado de Miedo con bajo volumen, perseguir las velas verdes suele ser una trampa. En cambio, este es el entorno donde promediar a la baja (DCA) en posiciones spot da sus frutos. Estoy vigilando un aumento del volumen para confirmar si esta ligera mejora del sentimiento tiene piernas reales.
👇 ¡Hablemos en los comentarios!
¿Estás comprando esta consolidación de bajo volumen, o crees que vamos a ver otra oleada de FUD antes de subir? ¡Deja tus objetivos abajo!
#CryptoMarketAnalysis #tradingstrategy
$BTC $BNB $BANK
1
186
·
--

Artículo
¿Se calienta la temporada de altcoins? Top 5 ganadores, rally de memecoins y análisis de trading en Binance📊 Análisis de mercado de altcoins y memecoins — 21 de agosto de 2026
El mercado en general es fuertemente positivo: la capitalización global de criptomonedas está alrededor de $2.47T (+4.40% en 24h), el volumen de 24h es de aproximadamente $129.38B (+13.72%), mientras que la dominancia de BTC es 59.31%.
🚀 Líderes actuales del mercado
Aproximadamente a las 05:07 AM del 21 de agosto, los movimientos más fuertes de gran/mediana capitalización reportados en el mercado fueron:
Estas cifras se reportan en INR por Economic Times, pero los cambios porcentuales ofrecen una útil instantánea entre mercados.
📈 Momentum relativo
🐸 Sector de memecoin
¿Se calienta la temporada de altcoins? Top 5 ganadores, rally de memecoins y análisis de trading en Binance
📊 Análisis de mercado de altcoins y memecoins — 21 de agosto de 2026
El mercado en general es fuertemente positivo: la capitalización global de criptomonedas está alrededor de $2.47T (+4.40% en 24h), el volumen de 24h es de aproximadamente $129.38B (+13.72%), mientras que la dominancia de BTC es 59.31%.
🚀 Líderes actuales del mercado
Aproximadamente a las 05:07 AM del 21 de agosto, los movimientos más fuertes de gran/mediana capitalización reportados en el mercado fueron:
Estas cifras se reportan en INR por Economic Times, pero los cambios porcentuales ofrecen una útil instantánea entre mercados.
📈 Momentum relativo
🐸 Sector de memecoin
El mercado en general es fuertemente positivo: la capitalización global de criptomonedas está alrededor de $2.47T (+4.40% en 24h), el volumen de 24h es de aproximadamente $129.38B (+13.72%), mientras que la dominancia de BTC es 59.31%.
🚀 Líderes actuales del mercado
Aproximadamente a las 05:07 AM del 21 de agosto, los movimientos más fuertes de gran/mediana capitalización reportados en el mercado fueron:
Estas cifras se reportan en INR por Economic Times, pero los cambios porcentuales ofrecen una útil instantánea entre mercados.
📈 Momentum relativo
🐸 Sector de memecoin
2
5
723

*Acción del precio:*
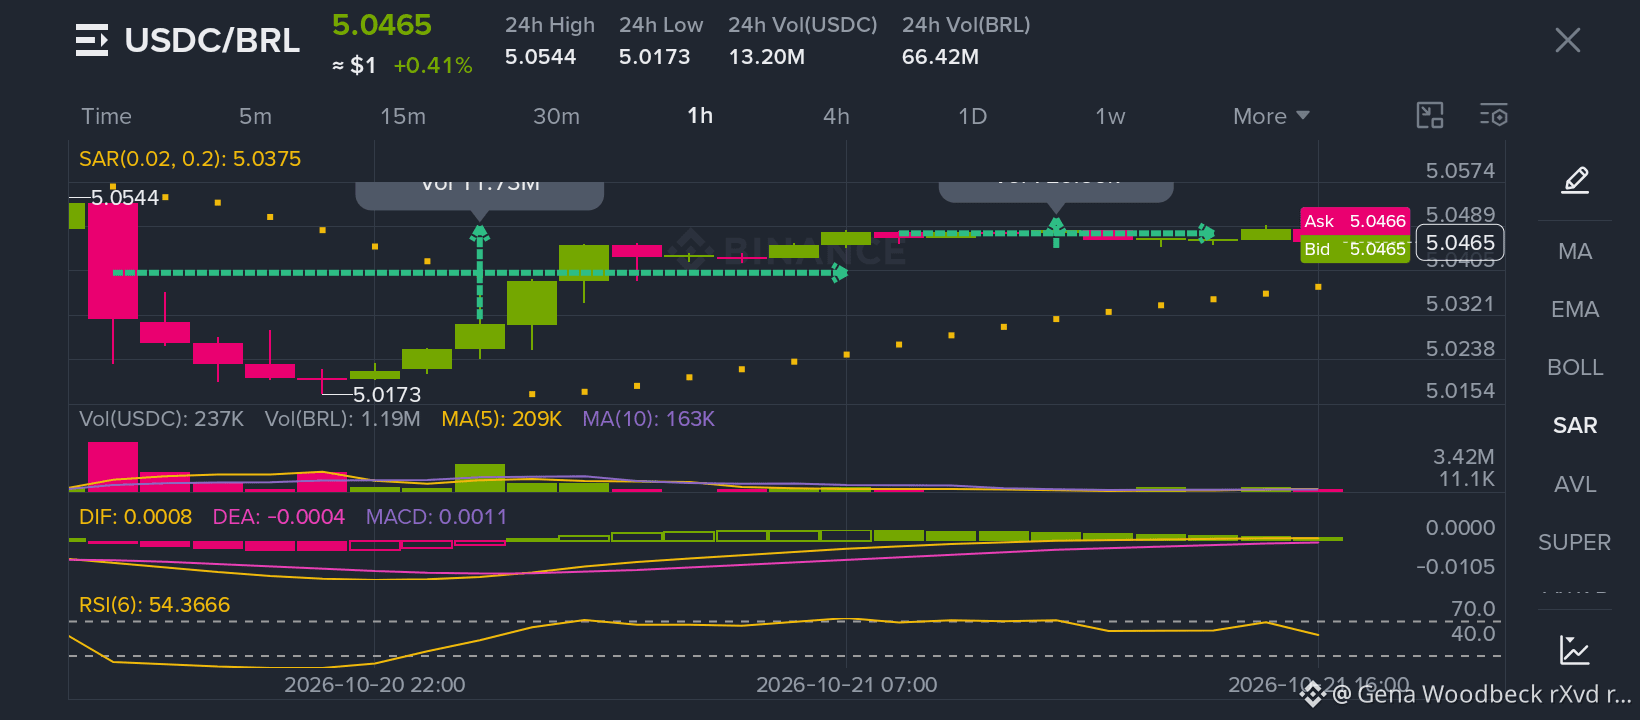
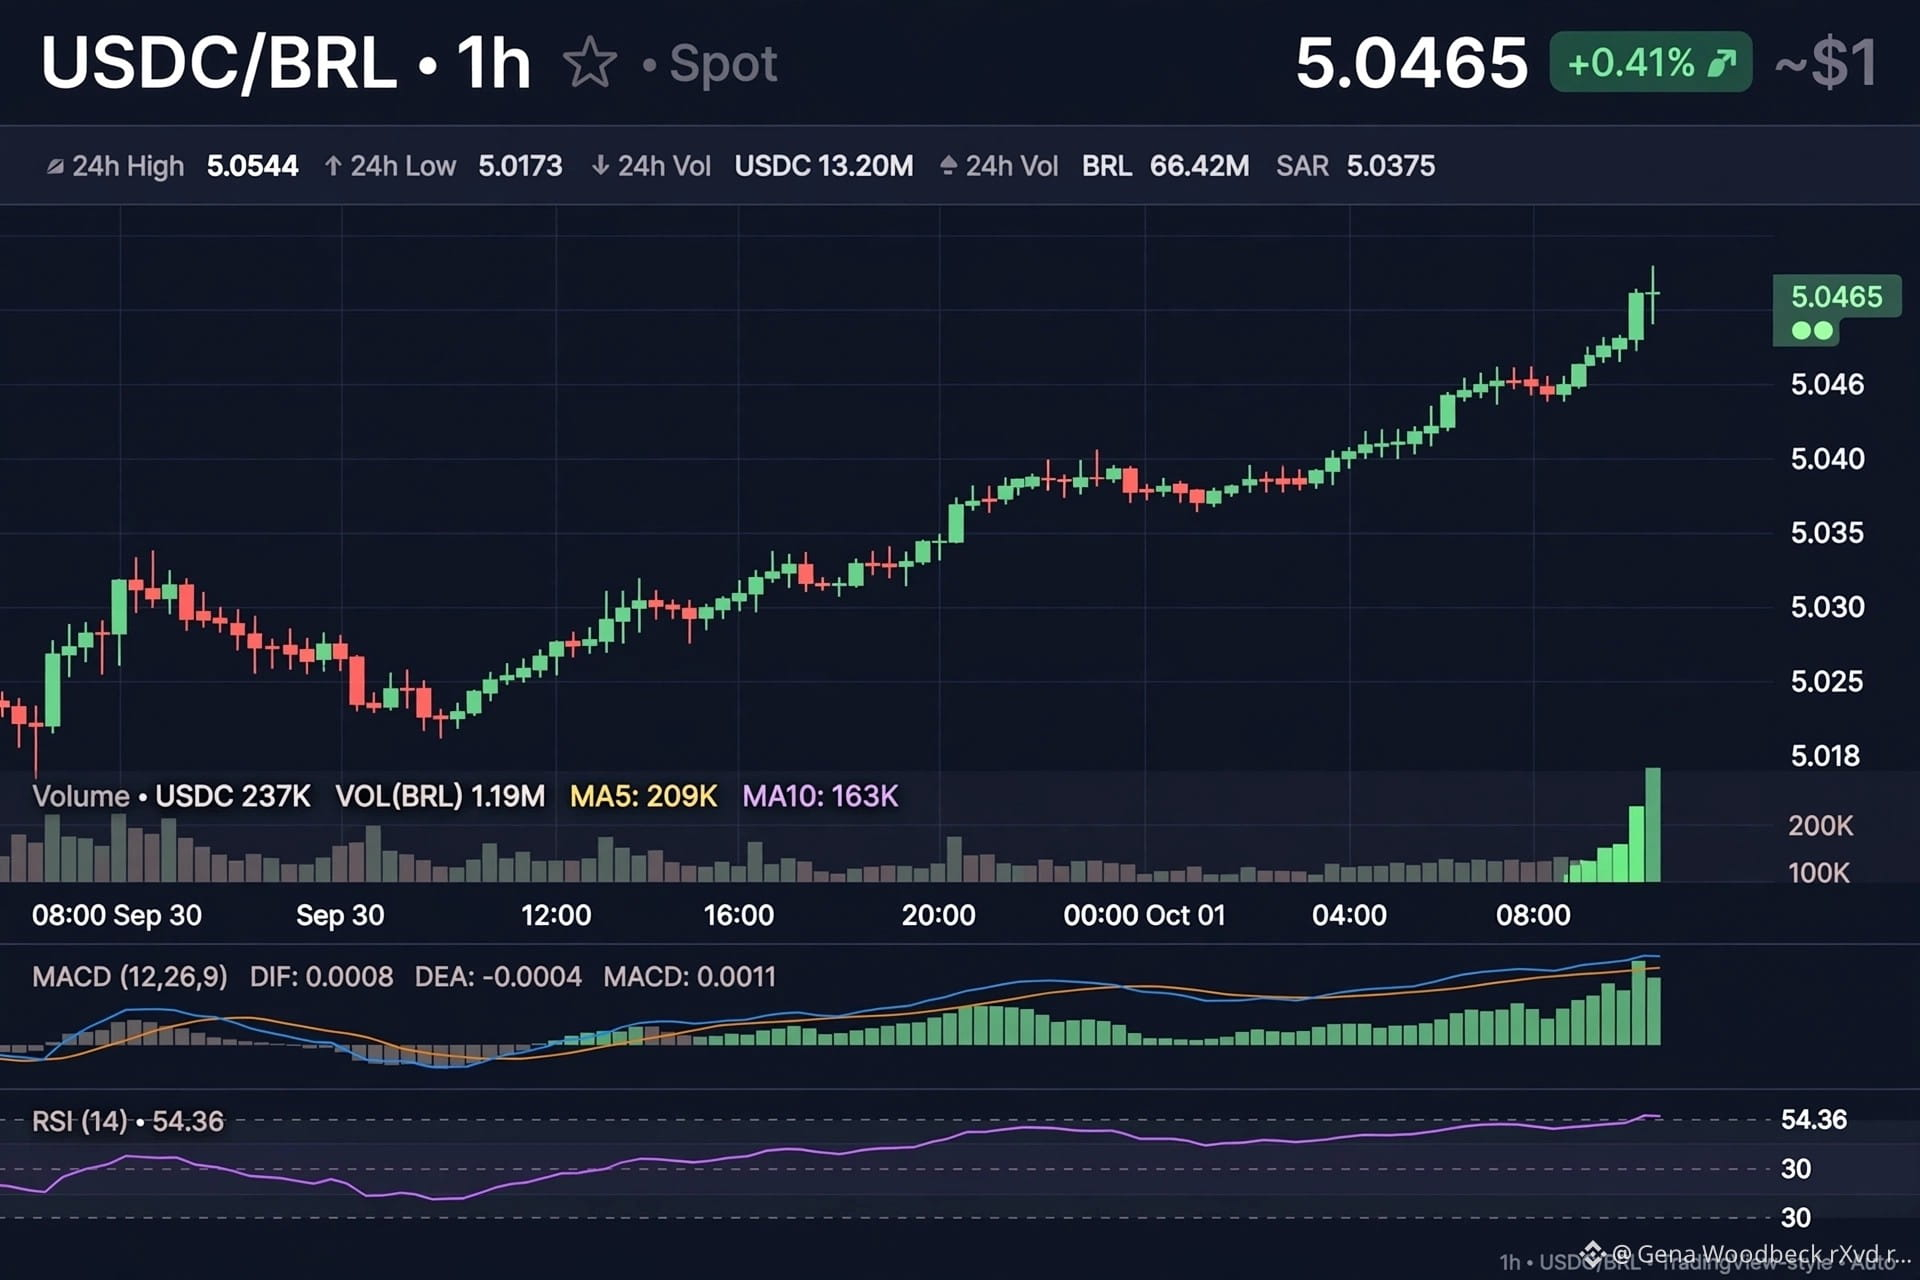
- Captaste la reversión perfecta. Desde el mínimo que marcaste, *5.0173 hasta 5.0465 = +0.0292 (+0.58% de recuperación)*. Marcaste un Vol de *11.79M* en la ruptura: esa es la vela de confirmación alcista.
- Ahora el precio, *5.0465*, está apenas *0.0079 por debajo del máximo de 24 h: 5.0544*. Tus niveles horizontales verdes muestran zonas de consolidación que se rompieron al alza.
- *SAR 5.0375*: los puntos están muy por debajo del precio; la fuerte tendencia alcista sigue intacta.
{spot}(USDCUSDT)
*Indicadores mejorando respecto al último gráfico:*
- *Vol USDC 237K / Vol BRL 1.19M / MA5 209K / MA10 163K*: el volumen está por encima de MA5 y MA10, y va en aumento en las últimas velas.
- *MACD DIF 0.0008 (era 0.0007) / DEA -0.0004 / MACD 0.0011*: DIF al alza, impulso fortaleciéndose y el histograma verde creciendo.
- *RSI(6) 54.36 (era 51.45)*: el RSI saltó de 51.4 a 54.3; el impulso alcista está aumentando, aunque todavía no está en sobrecompra. Avance saludable hacia 60.
*Veredicto:* Continuación alcista. El gráfico anterior mostraba consolidación; este muestra el inicio de una ruptura. Si cierra por encima del nivel Ask de 5.0466, el siguiente objetivo es *volver a probar el máximo de 5.0544*.
*Texto:*
> USDC/BRL 1h 5.0465 +0.41% Actualización 📈
> Reversión desde el mínimo de 5.0173 confirmada; Vol 11.79M en la ruptura.
> RSI al alza: 51.4 → 54.3; MACD 0.0011 alcista; SAR 5.0375 como soporte.
> Cerca del máximo de 24 h: 5.0544 — ¡ruptura en camino!
> #usdc#writetoearn #EarningsSeason #CryptocurrencyWealth #CryptoMarketAnalysis $USDC
*Acción del precio:*
- Captaste la reversión perfecta. Desde el mínimo que marcaste, *5.0173 hasta 5.0465 = +0.0292 (+0.58% de recuperación)*. Marcaste un Vol de *11.79M* en la ruptura: esa es la vela de confirmación alcista.
- Ahora el precio, *5.0465*, está apenas *0.0079 por debajo del máximo de 24 h: 5.0544*. Tus niveles horizontales verdes muestran zonas de consolidación que se rompieron al alza.
- *SAR 5.0375*: los puntos están muy por debajo del precio; la fuerte tendencia alcista sigue intacta.
*Indicadores mejorando respecto al último gráfico:*
- *Vol USDC 237K / Vol BRL 1.19M / MA5 209K / MA10 163K*: el volumen está por encima de MA5 y MA10, y va en aumento en las últimas velas.
- *MACD DIF 0.0008 (era 0.0007) / DEA -0.0004 / MACD 0.0011*: DIF al alza, impulso fortaleciéndose y el histograma verde creciendo.
- *RSI(6) 54.36 (era 51.45)*: el RSI saltó de 51.4 a 54.3; el impulso alcista está aumentando, aunque todavía no está en sobrecompra. Avance saludable hacia 60.
*Veredicto:* Continuación alcista. El gráfico anterior mostraba consolidación; este muestra el inicio de una ruptura. Si cierra por encima del nivel Ask de 5.0466, el siguiente objetivo es *volver a probar el máximo de 5.0544*.
*Texto:*
> USDC/BRL 1h 5.0465 +0.41% Actualización 📈
> Reversión desde el mínimo de 5.0173 confirmada; Vol 11.79M en la ruptura.
> RSI al alza: 51.4 → 54.3; MACD 0.0011 alcista; SAR 5.0375 como soporte.
> Cerca del máximo de 24 h: 5.0544 — ¡ruptura en camino!
> #usdc#writetoearn #EarningsSeason #CryptocurrencyWealth #CryptoMarketAnalysis $USDC
- Captaste la reversión perfecta. Desde el mínimo que marcaste, *5.0173 hasta 5.0465 = +0.0292 (+0.58% de recuperación)*. Marcaste un Vol de *11.79M* en la ruptura: esa es la vela de confirmación alcista.
- Ahora el precio, *5.0465*, está apenas *0.0079 por debajo del máximo de 24 h: 5.0544*. Tus niveles horizontales verdes muestran zonas de consolidación que se rompieron al alza.
- *SAR 5.0375*: los puntos están muy por debajo del precio; la fuerte tendencia alcista sigue intacta.
*Indicadores mejorando respecto al último gráfico:*
- *Vol USDC 237K / Vol BRL 1.19M / MA5 209K / MA10 163K*: el volumen está por encima de MA5 y MA10, y va en aumento en las últimas velas.
- *MACD DIF 0.0008 (era 0.0007) / DEA -0.0004 / MACD 0.0011*: DIF al alza, impulso fortaleciéndose y el histograma verde creciendo.
- *RSI(6) 54.36 (era 51.45)*: el RSI saltó de 51.4 a 54.3; el impulso alcista está aumentando, aunque todavía no está en sobrecompra. Avance saludable hacia 60.
*Veredicto:* Continuación alcista. El gráfico anterior mostraba consolidación; este muestra el inicio de una ruptura. Si cierra por encima del nivel Ask de 5.0466, el siguiente objetivo es *volver a probar el máximo de 5.0544*.
*Texto:*
> USDC/BRL 1h 5.0465 +0.41% Actualización 📈
> Reversión desde el mínimo de 5.0173 confirmada; Vol 11.79M en la ruptura.
> RSI al alza: 51.4 → 54.3; MACD 0.0011 alcista; SAR 5.0375 como soporte.
> Cerca del máximo de 24 h: 5.0544 — ¡ruptura en camino!
> #usdc#writetoearn #EarningsSeason #CryptocurrencyWealth #CryptoMarketAnalysis $USDC
38
Inicia sesión para explorar más contenidos
Únete a usuarios globales de criptomonedas en Binance Square
⚡️ Obtén información útil y actualizada sobre criptos.
💬 Avalado por el mayor exchange de criptomonedas en el mundo.
👍 Descubre perspectivas reales de creadores verificados.
Email/número de teléfono
Temas populares
1
#BinancePick
2.8M vistas
147,072 están debatiendo
2
#EarningsSeason
5.1M vistas
25,129 están debatiendo
3
#AnthropicTTMRevenueGrewAbout1200%
582 vistas
69 están debatiendo
4
#AnthropicS1ExpectedToday
2,605 vistas
93 están debatiendo
5
#SouthKoreaReportedlyWeighsFourthCryptoTaxDelay
11,154 vistas
261 están debatiendo
6
#FranklinTempletonFilesForTwoDividendToBitcoinETFs
18,027 vistas
386 están debatiendo
7
#StrategyMSTRSurpassesNasdaqInMarketCap
14,056 vistas
302 están debatiendo
8
#CanadaProposesStablecoinRedemptionWithin3BusinessDays
682 vistas
30 están debatiendo
9
#ElectrumWalletBugLetRogueServersStealFunds
19,209 vistas
400 están debatiendo
10
#ArgentineCourtDismissesLIBRACaseAgainstMilei
29,975 vistas
486 están debatiendo