
M-x-8
1.7k Publicaciones

M-x-8
Denunciar
Bloquear usuario
AI-assisted crypto market research. Key levels, clear scenarios, disciplined risk. Evidence over emotion. Educational only.

Mejores traders por volumen de trading en 30d
141 Siguiendo
1.3K+ Seguidores
1.0K+ Me gusta
1 Insignias
Publicaciones
Todo
Citas
Videos
·
--
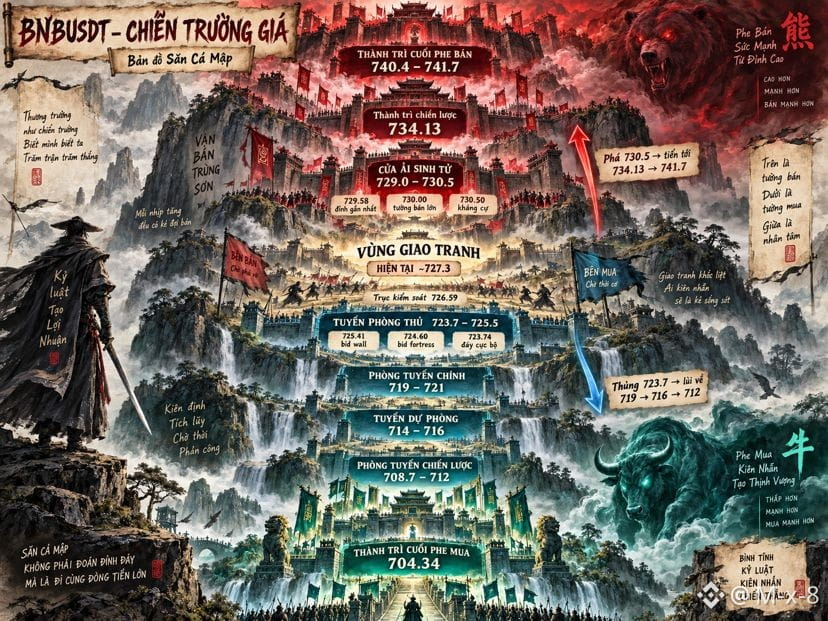
🔴 TERRITORIO DEL OSO
741.7 ╔══════════════════╗
740.4 ║ FORTALEZA FINAL ║
╚══════════════════╝
734.13 ─ Muro estratégico
730.5 ┐
730.0 │ VENTA DE MURO
729.1 ┘
──────── ZONA DE BAJA ────────
727.3 ◄ ACTUAL
726.6 ─ PIVOTE DE CONTROL
725.4 ┐
724.6 │ FORTALEZA DE OFERTA
723.7 ┘
──────── PRIMERA DEFENSA ─────
721
719 ═ DEFENSA PRINCIPAL
716–714
712–708 ═ DEFENSA ESTRATÉGICA
704.34 ╔══════════════════╗
║ FORTALEZA FINAL ║
╚══════════════════╝
🟢 TERRITORIO DEL TORO
🔴 TERRITORIO DEL OSO
741.7 ╔══════════════════╗
740.4 ║ FORTALEZA FINAL ║
╚══════════════════╝
734.13 ─ Muro estratégico
730.5 ┐
730.0 │ VENTA DE MURO
729.1 ┘
──────── ZONA DE BAJA ────────
727.3 ◄ ACTUAL
726.6 ─ PIVOTE DE CONTROL
725.4 ┐
724.6 │ FORTALEZA DE OFERTA
723.7 ┘
──────── PRIMERA DEFENSA ─────
721
719 ═ DEFENSA PRINCIPAL
716–714
712–708 ═ DEFENSA ESTRATÉGICA
704.34 ╔══════════════════╗
║ FORTALEZA FINAL ║
╚══════════════════╝
🟢 TERRITORIO DEL TORO
741.7 ╔══════════════════╗
740.4 ║ FORTALEZA FINAL ║
╚══════════════════╝
734.13 ─ Muro estratégico
730.5 ┐
730.0 │ VENTA DE MURO
729.1 ┘
──────── ZONA DE BAJA ────────
727.3 ◄ ACTUAL
726.6 ─ PIVOTE DE CONTROL
725.4 ┐
724.6 │ FORTALEZA DE OFERTA
723.7 ┘
──────── PRIMERA DEFENSA ─────
721
719 ═ DEFENSA PRINCIPAL
716–714
712–708 ═ DEFENSA ESTRATÉGICA
704.34 ╔══════════════════╗
║ FORTALEZA FINAL ║
╚══════════════════╝
🟢 TERRITORIO DEL TORO
80
·
--
Ver traducción
722.47 ███████ SELL WALL rất lớn
721.84 ─────── High vừa quét
721.11 ████ Supply
↓ rejection
718.89 ● CURRENT
│
716.77 █████ BID WALL
716.28 ████ BID WALL
714.82 ─────── Pivot
711.20 ───────
707.85 ★ LIQUIDITY SWEEP
722.47 ███████ SELL WALL rất lớn
721.84 ─────── High vừa quét
721.11 ████ Supply
↓ rejection
718.89 ● CURRENT
│
716.77 █████ BID WALL
716.28 ████ BID WALL
714.82 ─────── Pivot
711.20 ───────
707.85 ★ LIQUIDITY SWEEP
721.84 ─────── High vừa quét
721.11 ████ Supply
↓ rejection
718.89 ● CURRENT
│
716.77 █████ BID WALL
716.28 ████ BID WALL
714.82 ─────── Pivot
711.20 ───────
707.85 ★ LIQUIDITY SWEEP
11
·
--
$BNB la fuerza de venta activa está siendo absorbida por la fuerza de compra pasiva.
En los datos recientes, en algunos momentos el vendedor (taker) vendió con más fuerza que el comprador (taker), bastante claro. Pero el precio de BNB se mantuvo alrededor de 712–713 en vez de caer rápidamente. Eso suele significar que por debajo hay grandes compradores con órdenes límite que están absorbiendo toda la venta del mercado.
En concreto, hay 4 razones principales:
Absorción de la venta
Los vendedores del mercado venden con fuerza.
Pero cada vez que golpean hacia abajo, hay una oferta (bid) que absorbe.
Resultado: gran volumen de venta, pero poco desplazamiento del precio.
Esto es una señal más importante que fijarse solo en las velas rojas/verde.
El spot ya no vende en una sola dirección Antes, el spot era la principal fuente de presión bajista. Recientemente, el spot ha tenido algunos impulsos de compra de vuelta, por lo que los vendedores de futuros ya no pueden contar con el spot como “equipo” de forma totalmente alineada.
OI no estalla hacia Short Si el precio de verdad se está preparando para caer con fuerza, el patrón más “bonito” sería: Precio↓ + OI↑ fuerte + venta en spot + venta en futuros.
Pero ahora hay muchas secciones con OI plano o en descenso, o flujos contradictorios. Eso indica que parte de la acción es cerrar posiciones/realizar coberturas (hedging), y todavía no es una nueva ola de shorts frescos extremadamente fuerte.
La zona 708–712 se ha testeado muchas veces, pero aún no se acepta por debajo El precio se barrió hacia 708.7–710 y luego rebotó. Eso significa que debajo todavía hay demanda/liquidez que absorbe. Para que el vendedor logre realmente crear una tendencia bajista, tiene que hacer lo que aún no ha logrado: cerrar velas bajas y mantenerse por debajo del soporte después del retest.
$BNB la fuerza de venta activa está siendo absorbida por la fuerza de compra pasiva.
En los datos recientes, en algunos momentos el vendedor (taker) vendió con más fuerza que el comprador (taker), bastante claro. Pero el precio de BNB se mantuvo alrededor de 712–713 en vez de caer rápidamente. Eso suele significar que por debajo hay grandes compradores con órdenes límite que están absorbiendo toda la venta del mercado.
En concreto, hay 4 razones principales:
Absorción de la venta
Los vendedores del mercado venden con fuerza.
Pero cada vez que golpean hacia abajo, hay una oferta (bid) que absorbe.
Resultado: gran volumen de venta, pero poco desplazamiento del precio.
Esto es una señal más importante que fijarse solo en las velas rojas/verde.
El spot ya no vende en una sola dirección Antes, el spot era la principal fuente de presión bajista. Recientemente, el spot ha tenido algunos impulsos de compra de vuelta, por lo que los vendedores de futuros ya no pueden contar con el spot como “equipo” de forma totalmente alineada.
OI no estalla hacia Short Si el precio de verdad se está preparando para caer con fuerza, el patrón más “bonito” sería: Precio↓ + OI↑ fuerte + venta en spot + venta en futuros.
Pero ahora hay muchas secciones con OI plano o en descenso, o flujos contradictorios. Eso indica que parte de la acción es cerrar posiciones/realizar coberturas (hedging), y todavía no es una nueva ola de shorts frescos extremadamente fuerte.
La zona 708–712 se ha testeado muchas veces, pero aún no se acepta por debajo El precio se barrió hacia 708.7–710 y luego rebotó. Eso significa que debajo todavía hay demanda/liquidez que absorbe. Para que el vendedor logre realmente crear una tendencia bajista, tiene que hacer lo que aún no ha logrado: cerrar velas bajas y mantenerse por debajo del soporte después del retest.
En los datos recientes, en algunos momentos el vendedor (taker) vendió con más fuerza que el comprador (taker), bastante claro. Pero el precio de BNB se mantuvo alrededor de 712–713 en vez de caer rápidamente. Eso suele significar que por debajo hay grandes compradores con órdenes límite que están absorbiendo toda la venta del mercado.
En concreto, hay 4 razones principales:
Absorción de la venta
Los vendedores del mercado venden con fuerza.
Pero cada vez que golpean hacia abajo, hay una oferta (bid) que absorbe.
Resultado: gran volumen de venta, pero poco desplazamiento del precio.
Esto es una señal más importante que fijarse solo en las velas rojas/verde.
El spot ya no vende en una sola dirección Antes, el spot era la principal fuente de presión bajista. Recientemente, el spot ha tenido algunos impulsos de compra de vuelta, por lo que los vendedores de futuros ya no pueden contar con el spot como “equipo” de forma totalmente alineada.
OI no estalla hacia Short Si el precio de verdad se está preparando para caer con fuerza, el patrón más “bonito” sería: Precio↓ + OI↑ fuerte + venta en spot + venta en futuros.
Pero ahora hay muchas secciones con OI plano o en descenso, o flujos contradictorios. Eso indica que parte de la acción es cerrar posiciones/realizar coberturas (hedging), y todavía no es una nueva ola de shorts frescos extremadamente fuerte.
La zona 708–712 se ha testeado muchas veces, pero aún no se acepta por debajo El precio se barrió hacia 708.7–710 y luego rebotó. Eso significa que debajo todavía hay demanda/liquidez que absorbe. Para que el vendedor logre realmente crear una tendencia bajista, tiene que hacer lo que aún no ha logrado: cerrar velas bajas y mantenerse por debajo del soporte después del retest.
1
58
·
--
Con Săn Cá Mập, tôi ưu tiên thứ tự này
1. Precio
¿En verdad, hacia dónde va?
2. Flujo spot
¿El dinero real va en la misma dirección?
3. Tomador de futuros
¿A qué lado está atacando el apalancamiento?
4. OI
¿Hay posiciones nuevas o solo se están cerrando?
5. BTC
¿El régimen de mercado da soporte?
El Long más bonito no es solo:
Compra de futuros.
Sino que debe ser:
Precio↑ + Compra spot + Compra de futuros + OI↑ + confirmación BTC
El Short más bonito:
Precio↓ + Venta spot + Venta de futuros + OI↑ + confirmación BTC
Si Spot y Futuros se están enfrentando, generalmente es una zona de absorción / trampa / cambio de fase; ahí es donde Săn Cá Mập debe observar, no entrar todavía en una orden.
Ahora mismo, BNB muestra señales de recuperación liderada por Spot, pero aún no es suficiente para cambiar a Long porque la OI está bajando y en 4H sigue siendo bajista. La próxima vela de 15m: si Spot continúa comprando, los Futuros cambian a compra, la OI vuelve a subir y el precio cierra por encima de 714.24, entonces la historia cambiará de forma considerable.
Con Săn Cá Mập, tôi ưu tiên thứ tự này
1. Precio
¿En verdad, hacia dónde va?
2. Flujo spot
¿El dinero real va en la misma dirección?
3. Tomador de futuros
¿A qué lado está atacando el apalancamiento?
4. OI
¿Hay posiciones nuevas o solo se están cerrando?
5. BTC
¿El régimen de mercado da soporte?
El Long más bonito no es solo:
Compra de futuros.
Sino que debe ser:
Precio↑ + Compra spot + Compra de futuros + OI↑ + confirmación BTC
El Short más bonito:
Precio↓ + Venta spot + Venta de futuros + OI↑ + confirmación BTC
Si Spot y Futuros se están enfrentando, generalmente es una zona de absorción / trampa / cambio de fase; ahí es donde Săn Cá Mập debe observar, no entrar todavía en una orden.
Ahora mismo, BNB muestra señales de recuperación liderada por Spot, pero aún no es suficiente para cambiar a Long porque la OI está bajando y en 4H sigue siendo bajista. La próxima vela de 15m: si Spot continúa comprando, los Futuros cambian a compra, la OI vuelve a subir y el precio cierra por encima de 714.24, entonces la historia cambiará de forma considerable.
1. Precio
¿En verdad, hacia dónde va?
2. Flujo spot
¿El dinero real va en la misma dirección?
3. Tomador de futuros
¿A qué lado está atacando el apalancamiento?
4. OI
¿Hay posiciones nuevas o solo se están cerrando?
5. BTC
¿El régimen de mercado da soporte?
El Long más bonito no es solo:
Compra de futuros.
Sino que debe ser:
Precio↑ + Compra spot + Compra de futuros + OI↑ + confirmación BTC
El Short más bonito:
Precio↓ + Venta spot + Venta de futuros + OI↑ + confirmación BTC
Si Spot y Futuros se están enfrentando, generalmente es una zona de absorción / trampa / cambio de fase; ahí es donde Săn Cá Mập debe observar, no entrar todavía en una orden.
Ahora mismo, BNB muestra señales de recuperación liderada por Spot, pero aún no es suficiente para cambiar a Long porque la OI está bajando y en 4H sigue siendo bajista. La próxima vela de 15m: si Spot continúa comprando, los Futuros cambian a compra, la OI vuelve a subir y el precio cierra por encima de 714.24, entonces la historia cambiará de forma considerable.
204
·
--
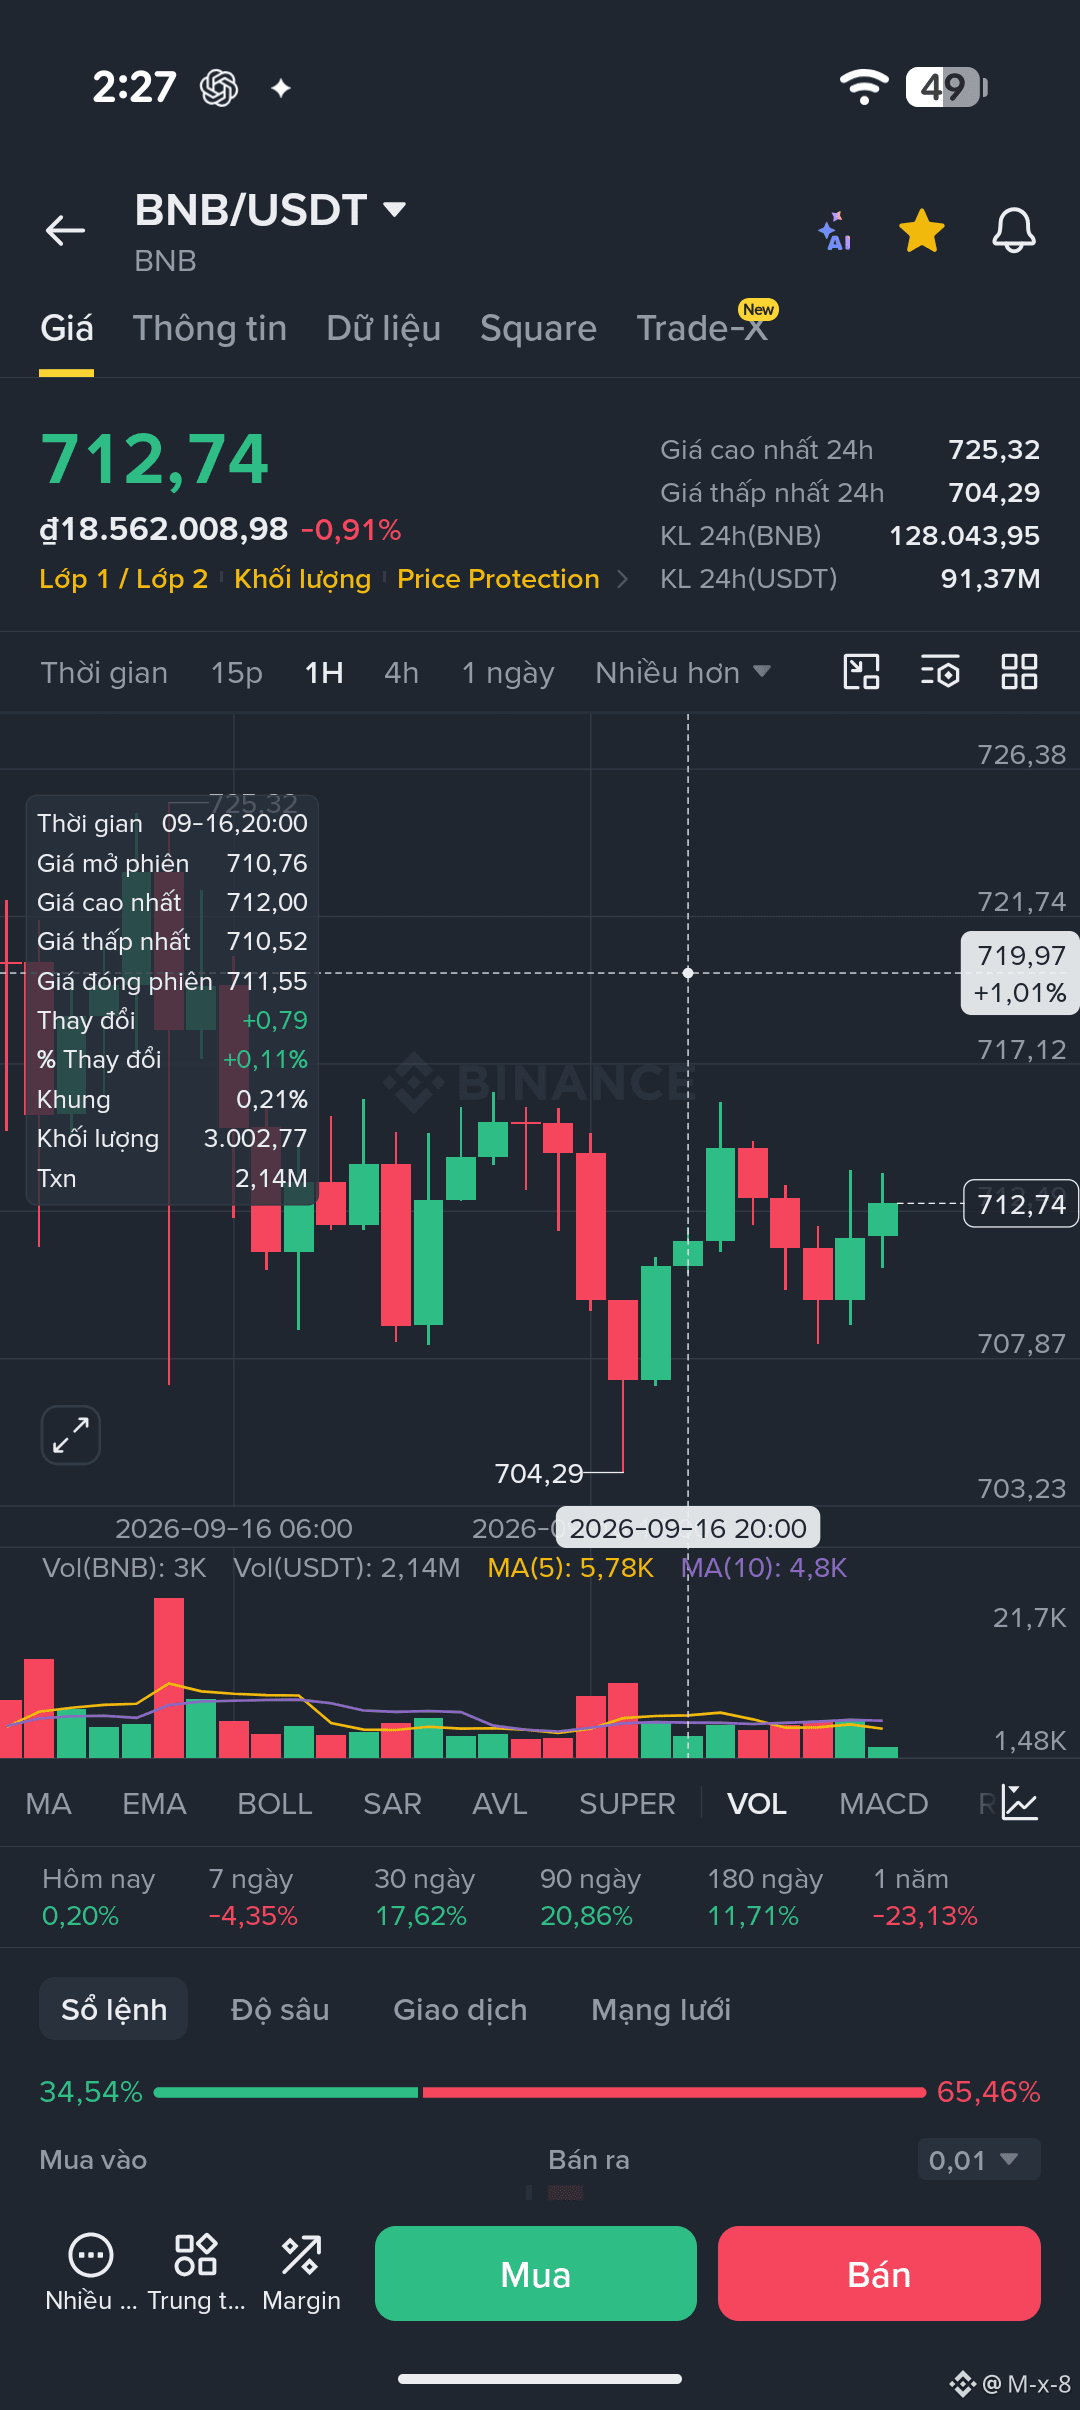
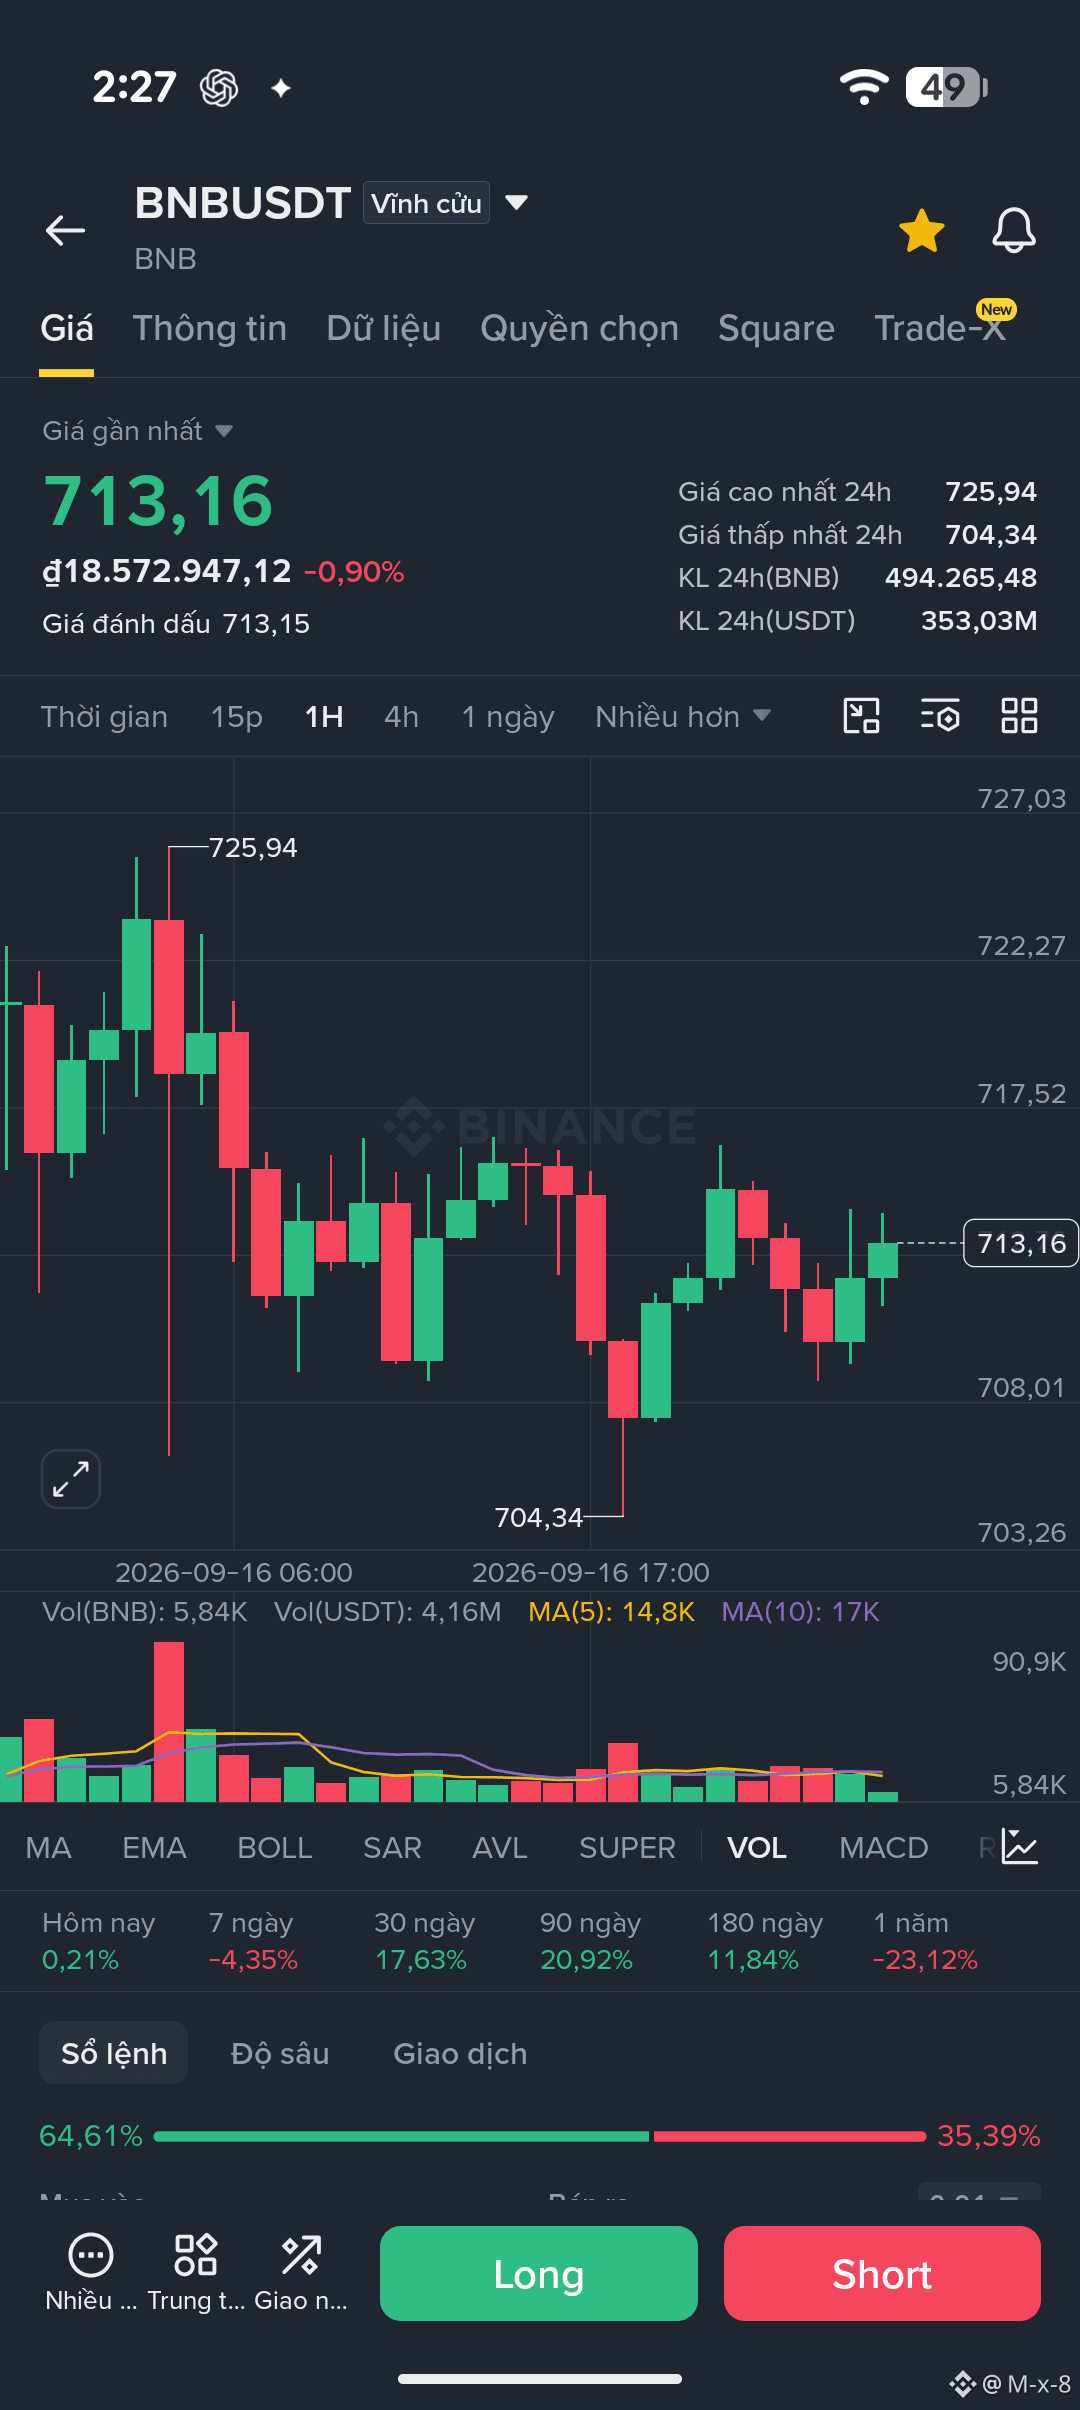
$BNB Moc quan trọng nhất lúc này: 714.24
Rechazar por debajo de 714.24 → setup bajista más atractivo.
Recuperar 714.24 y luego 715.17 → disminuye la tesis de Short.
Superar 716.6 con cierre + OI/Spot confirmando → cambia a régimen de recuperación.
El punto con más valor en el corte de las 02:00 es: BTC 4H ya ha bajado el precio + OI↑ fuerte; en cambio, BNB 4H aún tiene compradores agresivos, pero el precio cae — este es un rastro con sesgo más bajista que un breakout Long limpio.
$BNB Moc quan trọng nhất lúc này: 714.24
Rechazar por debajo de 714.24 → setup bajista más atractivo.
Recuperar 714.24 y luego 715.17 → disminuye la tesis de Short.
Superar 716.6 con cierre + OI/Spot confirmando → cambia a régimen de recuperación.
El punto con más valor en el corte de las 02:00 es: BTC 4H ya ha bajado el precio + OI↑ fuerte; en cambio, BNB 4H aún tiene compradores agresivos, pero el precio cae — este es un rastro con sesgo más bajista que un breakout Long limpio.
Rechazar por debajo de 714.24 → setup bajista más atractivo.
Recuperar 714.24 y luego 715.17 → disminuye la tesis de Short.
Superar 716.6 con cierre + OI/Spot confirmando → cambia a régimen de recuperación.
El punto con más valor en el corte de las 02:00 es: BTC 4H ya ha bajado el precio + OI↑ fuerte; en cambio, BNB 4H aún tiene compradores agresivos, pero el precio cae — este es un rastro con sesgo más bajista que un breakout Long limpio.
16
·
--
Ver traducción
$BNB BTC 4H 🔴 STRONG BEARISH
BNB 4H 🔴 BEARISH / LONG ABSORPTION
BNB 1H 🟠 RECOVERY nhưng dưới EMA13/26
BNB 15m 🟠 BUY FLOW bị hấp thụ
SPOT 1H 🔴 SELL-DOMINANT
POSITIONING 🔴 LONG-HEAVY
TREND ENGINE WAIT
TACTICAL SHORT-RETEST WATCH
$BNB BTC 4H 🔴 STRONG BEARISH
BNB 4H 🔴 BEARISH / LONG ABSORPTION
BNB 1H 🟠 RECOVERY nhưng dưới EMA13/26
BNB 15m 🟠 BUY FLOW bị hấp thụ
SPOT 1H 🔴 SELL-DOMINANT
POSITIONING 🔴 LONG-HEAVY
TREND ENGINE WAIT
TACTICAL SHORT-RETEST WATCH
BNB 4H 🔴 BEARISH / LONG ABSORPTION
BNB 1H 🟠 RECOVERY nhưng dưới EMA13/26
BNB 15m 🟠 BUY FLOW bị hấp thụ
SPOT 1H 🔴 SELL-DOMINANT
POSITIONING 🔴 LONG-HEAVY
TREND ENGINE WAIT
TACTICAL SHORT-RETEST WATCH
156
·
--
Ver traducción
🦈 SĂN CÁ MẬP – ĐỌC DÒNG TIỀN, KHÔNG ĐUỔI THEO GIÁ
Thị trường crypto không chỉ vận động bởi indicator. Phía sau mỗi cú pump, dump hay breakout là dòng tiền, thanh khoản và vị thế của những người chơi lớn.
Săn Cá Mập là hệ thống phân tích BTC, BNB và thị trường futures dựa trên:
• Open Interest & Funding Rate
• Taker Buy/Sell Volume
• Long/Short Positioning
• Supply – Demand & Liquidity
• Phân tích đa khung 4H → 1H → 15m
Mục tiêu không phải đoán giá.
Mục tiêu là trả lời:
🐋 Cá mập đang tích lũy, phân phối hay săn thanh khoản?
Từ đó hệ thống đưa ra 3 quyết định rõ ràng:
🟢 LONG
🔴 SHORT
⚪ WAIT
Theo dấu dòng tiền. Chờ xác nhận. Quản trị rủi ro.
#SanCaMap #Binance #BNB #BTC #CryptoTrading #WhaleTracking #OrderFlow
🦈 SĂN CÁ MẬP – ĐỌC DÒNG TIỀN, KHÔNG ĐUỔI THEO GIÁ
Thị trường crypto không chỉ vận động bởi indicator. Phía sau mỗi cú pump, dump hay breakout là dòng tiền, thanh khoản và vị thế của những người chơi lớn.
Săn Cá Mập là hệ thống phân tích BTC, BNB và thị trường futures dựa trên:
• Open Interest & Funding Rate
• Taker Buy/Sell Volume
• Long/Short Positioning
• Supply – Demand & Liquidity
• Phân tích đa khung 4H → 1H → 15m
Mục tiêu không phải đoán giá.
Mục tiêu là trả lời:
🐋 Cá mập đang tích lũy, phân phối hay săn thanh khoản?
Từ đó hệ thống đưa ra 3 quyết định rõ ràng:
🟢 LONG
🔴 SHORT
⚪ WAIT
Theo dấu dòng tiền. Chờ xác nhận. Quản trị rủi ro.
#SanCaMap #Binance #BNB #BTC #CryptoTrading #WhaleTracking #OrderFlow
Thị trường crypto không chỉ vận động bởi indicator. Phía sau mỗi cú pump, dump hay breakout là dòng tiền, thanh khoản và vị thế của những người chơi lớn.
Săn Cá Mập là hệ thống phân tích BTC, BNB và thị trường futures dựa trên:
• Open Interest & Funding Rate
• Taker Buy/Sell Volume
• Long/Short Positioning
• Supply – Demand & Liquidity
• Phân tích đa khung 4H → 1H → 15m
Mục tiêu không phải đoán giá.
Mục tiêu là trả lời:
🐋 Cá mập đang tích lũy, phân phối hay săn thanh khoản?
Từ đó hệ thống đưa ra 3 quyết định rõ ràng:
🟢 LONG
🔴 SHORT
⚪ WAIT
Theo dấu dòng tiền. Chờ xác nhận. Quản trị rủi ro.
#SanCaMap #Binance #BNB #BTC #CryptoTrading #WhaleTracking #OrderFlow
217
·
--
Ver traducción
Phố Wall dùng hình tượng con vật vì nó giúp biến hành vi thị trường rất phức tạp thành hình ảnh trực giác, dễ nhớ.
🐂 Bull – Bò tót = thị trường tăng: bò thường húc sừng từ dưới lên trên → tượng trưng giá tăng, tâm lý lạc quan, mua vào.
🐻 Bear – Gấu = thị trường giảm: gấu thường vung móng từ trên xuống dưới → tượng trưng giá giảm, tâm lý bi quan, bán ra.
🐋 Whale – Cá voi = tay chơi vốn lớn: chỉ tổ chức/cá nhân có vị thế đủ lớn để tác động thanh khoản và giá.
🐑 Sheep – Cừu = đám đông: thường ám chỉ nhà đầu tư chạy theo xu hướng, FOMO.
🐖 Pig – Heo = tham lam quá mức: thành ngữ Wall Street “Bulls make money, bears make money, pigs get slaughtered” nói về việc tham lam, giữ vị thế quá lâu hoặc dùng rủi ro quá lớn.
Điểm quan trọng: Bull và Bear không chỉ là biểu tượng trang trí. Chúng phản ánh hai lực cơ bản của thị trường:
Demand > Supply → 🐂 Bullish → Price ↑
Supply > Demand → 🐻 Bearish → Price ↓
Phố Wall dùng hình tượng con vật vì nó giúp biến hành vi thị trường rất phức tạp thành hình ảnh trực giác, dễ nhớ.
🐂 Bull – Bò tót = thị trường tăng: bò thường húc sừng từ dưới lên trên → tượng trưng giá tăng, tâm lý lạc quan, mua vào.
🐻 Bear – Gấu = thị trường giảm: gấu thường vung móng từ trên xuống dưới → tượng trưng giá giảm, tâm lý bi quan, bán ra.
🐋 Whale – Cá voi = tay chơi vốn lớn: chỉ tổ chức/cá nhân có vị thế đủ lớn để tác động thanh khoản và giá.
🐑 Sheep – Cừu = đám đông: thường ám chỉ nhà đầu tư chạy theo xu hướng, FOMO.
🐖 Pig – Heo = tham lam quá mức: thành ngữ Wall Street “Bulls make money, bears make money, pigs get slaughtered” nói về việc tham lam, giữ vị thế quá lâu hoặc dùng rủi ro quá lớn.
Điểm quan trọng: Bull và Bear không chỉ là biểu tượng trang trí. Chúng phản ánh hai lực cơ bản của thị trường:
Demand > Supply → 🐂 Bullish → Price ↑
Supply > Demand → 🐻 Bearish → Price ↓
🐂 Bull – Bò tót = thị trường tăng: bò thường húc sừng từ dưới lên trên → tượng trưng giá tăng, tâm lý lạc quan, mua vào.
🐻 Bear – Gấu = thị trường giảm: gấu thường vung móng từ trên xuống dưới → tượng trưng giá giảm, tâm lý bi quan, bán ra.
🐋 Whale – Cá voi = tay chơi vốn lớn: chỉ tổ chức/cá nhân có vị thế đủ lớn để tác động thanh khoản và giá.
🐑 Sheep – Cừu = đám đông: thường ám chỉ nhà đầu tư chạy theo xu hướng, FOMO.
🐖 Pig – Heo = tham lam quá mức: thành ngữ Wall Street “Bulls make money, bears make money, pigs get slaughtered” nói về việc tham lam, giữ vị thế quá lâu hoặc dùng rủi ro quá lớn.
Điểm quan trọng: Bull và Bear không chỉ là biểu tượng trang trí. Chúng phản ánh hai lực cơ bản của thị trường:
Demand > Supply → 🐂 Bullish → Price ↑
Supply > Demand → 🐻 Bearish → Price ↓

5
·
--
Hola, ahora Binance está alrededor de BTC 75,646 y BNB 710.69. Es notable que BNB está justo en la zona de activación que estamos monitoreando: 710.28–710.02.
Si la FED sube las tasas de forma inesperada / más hawkish que lo esperado
El mecanismo habitual sería:
Rates ↑ → USD/yield ↑ → apetito por riesgo ↓ → presión sobre BTC ↓ → Altcoin/BNB suele ser más sensible
Con Săn Cá Mập, no me pondré a short de inmediato cuando aparezca el titular. Quiero ver la secuencia:
FED hike → BTC Price↓ + OI↑ + taker sell → BNB 15m close <710.28 → Spot <710.02 → retest 710–711 falla.
Cuando se cumpla esa secuencia, el nuevo estado se actualiza a:
DOWNSIDE EXPANSION CONFIRMED
Las zonas por debajo ya están disponibles:
709.56 → 707.38 → 706.30 → 704.34 → 703.00
Si BNB cierra por debajo de 704.34 con una vela de 1H con expansión de volumen, entonces recién se acerca al cumplimiento de la condición Short del motor trend-following.
Pero el escenario más peligroso es que “el hike ya esté price-in”
La FED puede subir, pero el cripto puede caer durante unos minutos y luego rebotar si el mercado ya lo había reflejado antes o si Powell ofrece una guía más suave de lo esperado.
La trampa alcista para bears sería:
liquidar 710 → 707/704 → OI cae con fuerza → Spot absorbe → close regresa a >710–712 → recuperar 713.25/714.2
En ese caso, absolutamente no continuar con el short según el titular.
Hola, ahora Binance está alrededor de BTC 75,646 y BNB 710.69. Es notable que BNB está justo en la zona de activación que estamos monitoreando: 710.28–710.02.
Si la FED sube las tasas de forma inesperada / más hawkish que lo esperado
El mecanismo habitual sería:
Rates ↑ → USD/yield ↑ → apetito por riesgo ↓ → presión sobre BTC ↓ → Altcoin/BNB suele ser más sensible
Con Săn Cá Mập, no me pondré a short de inmediato cuando aparezca el titular. Quiero ver la secuencia:
FED hike → BTC Price↓ + OI↑ + taker sell → BNB 15m close <710.28 → Spot <710.02 → retest 710–711 falla.
Cuando se cumpla esa secuencia, el nuevo estado se actualiza a:
DOWNSIDE EXPANSION CONFIRMED
Las zonas por debajo ya están disponibles:
709.56 → 707.38 → 706.30 → 704.34 → 703.00
Si BNB cierra por debajo de 704.34 con una vela de 1H con expansión de volumen, entonces recién se acerca al cumplimiento de la condición Short del motor trend-following.
Pero el escenario más peligroso es que “el hike ya esté price-in”
La FED puede subir, pero el cripto puede caer durante unos minutos y luego rebotar si el mercado ya lo había reflejado antes o si Powell ofrece una guía más suave de lo esperado.
La trampa alcista para bears sería:
liquidar 710 → 707/704 → OI cae con fuerza → Spot absorbe → close regresa a >710–712 → recuperar 713.25/714.2
En ese caso, absolutamente no continuar con el short según el titular.
Si la FED sube las tasas de forma inesperada / más hawkish que lo esperado
El mecanismo habitual sería:
Rates ↑ → USD/yield ↑ → apetito por riesgo ↓ → presión sobre BTC ↓ → Altcoin/BNB suele ser más sensible
Con Săn Cá Mập, no me pondré a short de inmediato cuando aparezca el titular. Quiero ver la secuencia:
FED hike → BTC Price↓ + OI↑ + taker sell → BNB 15m close <710.28 → Spot <710.02 → retest 710–711 falla.
Cuando se cumpla esa secuencia, el nuevo estado se actualiza a:
DOWNSIDE EXPANSION CONFIRMED
Las zonas por debajo ya están disponibles:
709.56 → 707.38 → 706.30 → 704.34 → 703.00
Si BNB cierra por debajo de 704.34 con una vela de 1H con expansión de volumen, entonces recién se acerca al cumplimiento de la condición Short del motor trend-following.
Pero el escenario más peligroso es que “el hike ya esté price-in”
La FED puede subir, pero el cripto puede caer durante unos minutos y luego rebotar si el mercado ya lo había reflejado antes o si Powell ofrece una guía más suave de lo esperado.
La trampa alcista para bears sería:
liquidar 710 → 707/704 → OI cae con fuerza → Spot absorbe → close regresa a >710–712 → recuperar 713.25/714.2
En ese caso, absolutamente no continuar con el short según el titular.
130
·
--
Ver traducción
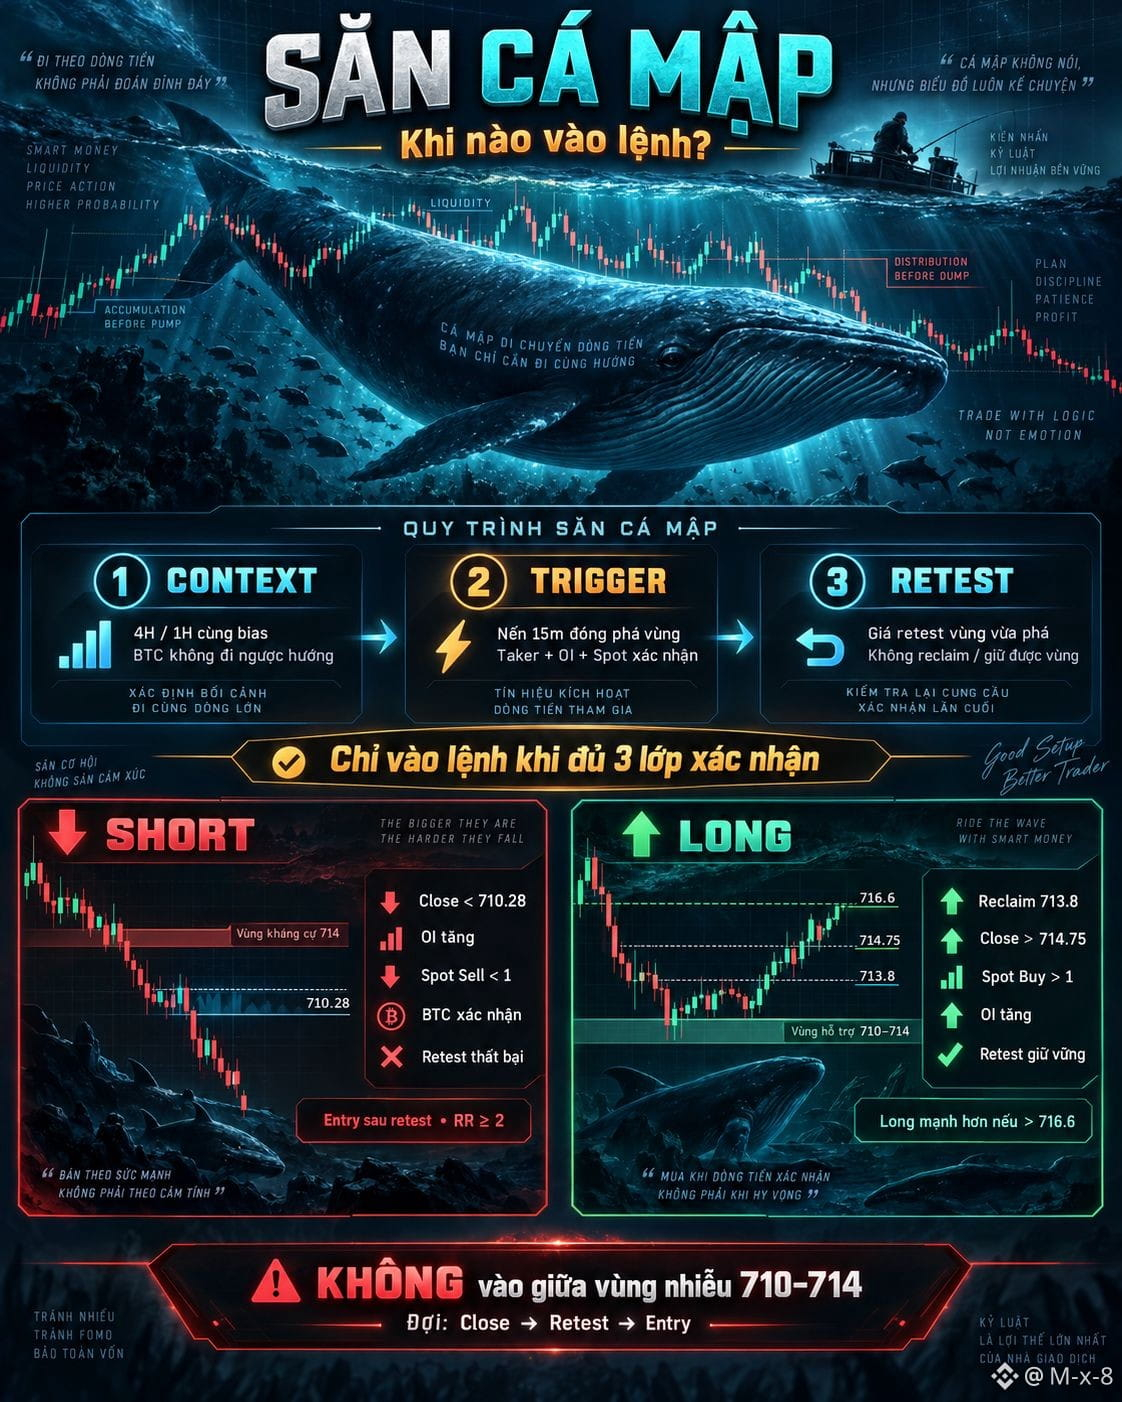
Quy tắc quan trọng nhất
Không vào tại breakout candle.
Đợi:
Close → Retest → Reject/Hold → Entry
Cách này giúp tránh phần lớn stop-hunt.
Tôi sẽ đóng gói thành một rule rất ngắn cho Săn Cá Mập:
SHORT = Break + Close + OI↑ + Spot Sell + BTC confirm + Failed Retest + RR≥2
LONG = Reclaim + Close + OI↑ + Spot Buy + BTC confirm + Successful Retest + RR≥2
Nếu thiếu một trong các thành phần quan trọng, trạng thái là WAIT.
Quy tắc quan trọng nhất
Không vào tại breakout candle.
Đợi:
Close → Retest → Reject/Hold → Entry
Cách này giúp tránh phần lớn stop-hunt.
Tôi sẽ đóng gói thành một rule rất ngắn cho Săn Cá Mập:
SHORT = Break + Close + OI↑ + Spot Sell + BTC confirm + Failed Retest + RR≥2
LONG = Reclaim + Close + OI↑ + Spot Buy + BTC confirm + Successful Retest + RR≥2
Nếu thiếu một trong các thành phần quan trọng, trạng thái là WAIT.
Không vào tại breakout candle.
Đợi:
Close → Retest → Reject/Hold → Entry
Cách này giúp tránh phần lớn stop-hunt.
Tôi sẽ đóng gói thành một rule rất ngắn cho Săn Cá Mập:
SHORT = Break + Close + OI↑ + Spot Sell + BTC confirm + Failed Retest + RR≥2
LONG = Reclaim + Close + OI↑ + Spot Buy + BTC confirm + Successful Retest + RR≥2
Nếu thiếu một trong các thành phần quan trọng, trạng thái là WAIT.
32
·
--
$BNB 716.59 █████ mayor invalidación
716.31 ███ rechazo alto
715.17 ███ 45m alto
714.7–715.2 ██ oferta/retest
──────────────
713.48 ● 45m cierre
713.0 ── soporte
712.45 ★ 45m bajo
712.08 spot bajo
711.64 ★ soporte estructural
710.98
709.56
707.38
704.34 ★ motor bajo20
$BNB 716.59 █████ mayor invalidación
716.31 ███ rechazo alto
715.17 ███ 45m alto
714.7–715.2 ██ oferta/retest
──────────────
713.48 ● 45m cierre
713.0 ── soporte
712.45 ★ 45m bajo
712.08 spot bajo
711.64 ★ soporte estructural
710.98
709.56
707.38
704.34 ★ motor bajo20
716.31 ███ rechazo alto
715.17 ███ 45m alto
714.7–715.2 ██ oferta/retest
──────────────
713.48 ● 45m cierre
713.0 ── soporte
712.45 ★ 45m bajo
712.08 spot bajo
711.64 ★ soporte estructural
710.98
709.56
707.38
704.34 ★ motor bajo20
64
·
--
$BTC $BNB Una. Ambas se están moviendo en una tendencia a largo plazo, con un impulso a corto plazo en retroceso: es una corrección, no un cambio de tendencia; visto sobre las MA.
Dos. BTC es el más débil en el marco mayor: en ambos marcos hay LH+LL, y se perforó por debajo del mínimo del día más reciente; además, no hay ningún soporte hasta −15%. BNB, en cambio, todavía mantiene HH+HL y cuenta con un soporte del 9,7% justo debajo del 2,1%.
Tres, y este es el punto estructural más notable: los dos valores tienen mapas de volumen en direcciones opuestas. BTC tiene volumen vacío abajo y denso arriba. BNB, volumen denso abajo y vacío arriba. Con beta 0,70 y una correlación medida de ~0,72 el día anterior, si BTC va a buscar la zona de 63–64k, a BNB le costará quedarse quieto; pero el camino de BNB se encontrará primero con el soporte 699.
$BTC $BNB Una. Ambas se están moviendo en una tendencia a largo plazo, con un impulso a corto plazo en retroceso: es una corrección, no un cambio de tendencia; visto sobre las MA.
Dos. BTC es el más débil en el marco mayor: en ambos marcos hay LH+LL, y se perforó por debajo del mínimo del día más reciente; además, no hay ningún soporte hasta −15%. BNB, en cambio, todavía mantiene HH+HL y cuenta con un soporte del 9,7% justo debajo del 2,1%.
Tres, y este es el punto estructural más notable: los dos valores tienen mapas de volumen en direcciones opuestas. BTC tiene volumen vacío abajo y denso arriba. BNB, volumen denso abajo y vacío arriba. Con beta 0,70 y una correlación medida de ~0,72 el día anterior, si BTC va a buscar la zona de 63–64k, a BNB le costará quedarse quieto; pero el camino de BNB se encontrará primero con el soporte 699.
Dos. BTC es el más débil en el marco mayor: en ambos marcos hay LH+LL, y se perforó por debajo del mínimo del día más reciente; además, no hay ningún soporte hasta −15%. BNB, en cambio, todavía mantiene HH+HL y cuenta con un soporte del 9,7% justo debajo del 2,1%.
Tres, y este es el punto estructural más notable: los dos valores tienen mapas de volumen en direcciones opuestas. BTC tiene volumen vacío abajo y denso arriba. BNB, volumen denso abajo y vacío arriba. Con beta 0,70 y una correlación medida de ~0,72 el día anterior, si BTC va a buscar la zona de 63–64k, a BNB le costará quedarse quieto; pero el camino de BNB se encontrará primero con el soporte 699.
150
·
--
$BNB sau las jugadas de volcado de Binance hay mucho dinero
$BNB sau las jugadas de volcado de Binance hay mucho dinero
112
·
--
$BNB 4 horas ya bloqueadas 722,55 — condición de markdown del marco grande completada. La liquidez de la sesión por debajo de 721,79 es delgada; la liquidez de 4 horas aún llega hasta 696. Esa es la razón típica del recorrido: 718 en el camino, cola en 712, no es una caída.
• Bid en 5 niveles ≈ 1 BNB: un deslizamiento a 721,79 puede ocurrir rápido.
• Ask en 20 niveles, más denso: tirar de vuelta a 723–724 todavía puede pasar.
• No sumar (ya estaba grande; Isolated 10x).
• Cerrar 50% en 718. Cortar en 726,80. El resto en 712.
• Cancelar: la vela de 1 hora cierra por encima de 726,66.
$BNB 4 horas ya bloqueadas 722,55 — condición de markdown del marco grande completada. La liquidez de la sesión por debajo de 721,79 es delgada; la liquidez de 4 horas aún llega hasta 696. Esa es la razón típica del recorrido: 718 en el camino, cola en 712, no es una caída.
• Bid en 5 niveles ≈ 1 BNB: un deslizamiento a 721,79 puede ocurrir rápido.
• Ask en 20 niveles, más denso: tirar de vuelta a 723–724 todavía puede pasar.
• No sumar (ya estaba grande; Isolated 10x).
• Cerrar 50% en 718. Cortar en 726,80. El resto en 712.
• Cancelar: la vela de 1 hora cierra por encima de 726,66.
• Bid en 5 niveles ≈ 1 BNB: un deslizamiento a 721,79 puede ocurrir rápido.
• Ask en 20 niveles, más denso: tirar de vuelta a 723–724 todavía puede pasar.
• No sumar (ya estaba grande; Isolated 10x).
• Cerrar 50% en 718. Cortar en 726,80. El resto en 712.
• Cancelar: la vela de 1 hora cierra por encima de 726,66.
1
156
·
--
$BNB El flujo de efectivo de BNB está saliendo, no entrando. La vela de 15 minutos de las 13:15 ya se cerró: el vendedor ejecutó ~3 veces más que el comprador, perforó el mínimo de la base de 24 horas anterior en 725,50. La vela de 1 hora de las 13:00 está abierta — todavía no lo acepta.
Fuente: Binance USD-M + spot, 13:40 ICT 13/09/2026. Señala 723,79. Spot 723,53. Bitcoin 77 237.
$BNB El flujo de efectivo de BNB está saliendo, no entrando. La vela de 15 minutos de las 13:15 ya se cerró: el vendedor ejecutó ~3 veces más que el comprador, perforó el mínimo de la base de 24 horas anterior en 725,50. La vela de 1 hora de las 13:00 está abierta — todavía no lo acepta.
Fuente: Binance USD-M + spot, 13:40 ICT 13/09/2026. Señala 723,79. Spot 723,53. Bitcoin 77 237.
Fuente: Binance USD-M + spot, 13:40 ICT 13/09/2026. Señala 723,79. Spot 723,53. Bitcoin 77 237.
3
182
Inicia sesión para explorar más contenidos
Únete a usuarios globales de criptomonedas en Binance Square
⚡️ Obtén información útil y actualizada sobre criptos.
💬 Avalado por el mayor exchange de criptomonedas en el mundo.
👍 Descubre perspectivas reales de creadores verificados.
Email/número de teléfono
Temas populares
BOJRaisesRatesTo31YearHigh
61,958 vistas
1,057 están debatiendo
#bojraisesratesto31yearhigh ¿El BOJ en máximos de 31 años y Bitcoin subiendo? La madurez institucional de $BTC en un solo gráfico 🇯🇵📈⚡
El Banco de Japón elevó su tasa al 1.25% (máximo histórico en más de tres décadas), y lo que muchos pronosticaban como un colapso del carry trade terminó mostrando la fortaleza más limpia del mercado cripto.
🧠 3 lecturas clave de la mesa técnica:
1️⃣ Desacoplamiento Macro: El yen no se fortaleció como proyectaban los analistas tradicionales y BTC respondió con un rebote contundente, demostrando que la demanda en Spot sigue intacta.
2️⃣ Superando a los gigantes tecnológicos: Con una capitalización de más de $1.63 billones, Bitcoin vuelve a colocarse por delante de Tesla ($1.438B), reafirmando su papel como activo de reserva y refugio de liquidez global.
3️⃣ Estructura en 4H y 1D: La absorción en los soportes valida que las correcciones macro son ventanas de acumulación institucional, no de capitulación.
$Mientras el retail entra en pánico por los titulares de tipos de interés, la gestión profesional sigue el rastro de la liquidez real. 💎🛡️
💬 Debate para la comunidad: ¿Consideran que este desacoplamiento confirma el inicio del tramo final del ciclo alcista hacia nuevos máximos históricos, o la liquidez global aún pondrá a prueba los soportes? ¡Dejen su análisis abajo! 👇🔥
#bojraisesratesto31yearhigh #MacroEconomy #Trading #BinanceSquare
Jacktraders
·1 me gusta
·4.3k vistas
BuffettStepsDownAsBerkshireChairman
26,552 vistas
482 están debatiendo
XRPExchangeReservesHitSevenYearLow
32,532 vistas
456 están debatiendo