

Ether Guru 1
146 Publicaciones

Ether Guru 1
Denunciar
Bloquear usuario
Where experience meets discipline. Crypto isn’t luck — it’s mindset 💭
0 Siguiendo
6 Seguidores
26 Me gusta
Publicaciones
·
--
Ver traducción
$BTC SHE EARNS $58,000. BUT WOULD QUITTING HER JOB ACTUALLY SAVE MONEY?
Her husband’s promotion changed the conversation at home.
He now earns around $186,000 annually, while she brings in $58,000. With a three-year-old daughter and daycare bills approaching $2,000 a month, he suggested she consider becoming a stay-at-home mom.
The idea sounds reasonable until you look beyond the monthly bills.
Daycare alone costs about $24,000 annually. Add commuting, work lunches, and other job expenses, and a meaningful portion of her paycheck may disappear before it reaches the family budget.
But there’s another side to this calculation.
If she leaves her job, the household loses more than a salary. It may also lose employer retirement contributions, opportunities for raises, and years of career growth.
And there’s a risk families sometimes underestimate: returning to work later might mean starting at a lower salary or spending months searching for the right position.
Meanwhile, relying on one income creates a different kind of financial exposure. If that paycheck disappears, the family has no second salary to fall back on.
Before deciding, they could calculate her actual take-home pay after work-related expenses, compare both household budgets, and explore flexible work or part-time childcare arrangements.
Because the question isn't simply whether daycare is expensive.
It's whether the family's long-term financial position would change after accounting for everything her job provides.
A paycheck has value beyond its monthly deposit.
$BTC SHE EARNS $58,000. BUT WOULD QUITTING HER JOB ACTUALLY SAVE MONEY?
Her husband’s promotion changed the conversation at home.
He now earns around $186,000 annually, while she brings in $58,000. With a three-year-old daughter and daycare bills approaching $2,000 a month, he suggested she consider becoming a stay-at-home mom.
The idea sounds reasonable until you look beyond the monthly bills.
Daycare alone costs about $24,000 annually. Add commuting, work lunches, and other job expenses, and a meaningful portion of her paycheck may disappear before it reaches the family budget.
But there’s another side to this calculation.
If she leaves her job, the household loses more than a salary. It may also lose employer retirement contributions, opportunities for raises, and years of career growth.
And there’s a risk families sometimes underestimate: returning to work later might mean starting at a lower salary or spending months searching for the right position.
Meanwhile, relying on one income creates a different kind of financial exposure. If that paycheck disappears, the family has no second salary to fall back on.
Before deciding, they could calculate her actual take-home pay after work-related expenses, compare both household budgets, and explore flexible work or part-time childcare arrangements.
Because the question isn't simply whether daycare is expensive.
It's whether the family's long-term financial position would change after accounting for everything her job provides.
A paycheck has value beyond its monthly deposit.
Her husband’s promotion changed the conversation at home.
He now earns around $186,000 annually, while she brings in $58,000. With a three-year-old daughter and daycare bills approaching $2,000 a month, he suggested she consider becoming a stay-at-home mom.
The idea sounds reasonable until you look beyond the monthly bills.
Daycare alone costs about $24,000 annually. Add commuting, work lunches, and other job expenses, and a meaningful portion of her paycheck may disappear before it reaches the family budget.
But there’s another side to this calculation.
If she leaves her job, the household loses more than a salary. It may also lose employer retirement contributions, opportunities for raises, and years of career growth.
And there’s a risk families sometimes underestimate: returning to work later might mean starting at a lower salary or spending months searching for the right position.
Meanwhile, relying on one income creates a different kind of financial exposure. If that paycheck disappears, the family has no second salary to fall back on.
Before deciding, they could calculate her actual take-home pay after work-related expenses, compare both household budgets, and explore flexible work or part-time childcare arrangements.
Because the question isn't simply whether daycare is expensive.
It's whether the family's long-term financial position would change after accounting for everything her job provides.
A paycheck has value beyond its monthly deposit.
54
·
--
Ver traducción
$BTC 3 BITCOIN COULD COST HIM MORE THAN MONEY.
A friend already owns 3+ BTC bought below $30,000, roughly $2 million in income-producing real estate with equity, and more than $400,000 in cash.
Now his wife wants him to buy another 3 BTC before Bitcoin climbs back above $100,000.
But he has three teenagers approaching college age.
And that changes the calculation.
Buying 3 BTC at $85,000 each would require about $255,000 before fees.
From $400,000 in cash, that leaves just $145,000.
If tuition, property repairs, vacancies or another unexpected expense arrives, he may have to sell assets at an inconvenient time.
His real estate may be valuable, but equity isn't the same as cash. Accessing it can take time, cost money and depend on financing conditions.
And Bitcoin could rise above $100,000—or fall sharply before it gets there.
Nobody knows which happens first.
The decision isn't simply whether 3 more BTC would be a good investment.
It's whether the potential upside justifies reducing the family's readily available financial cushion while major education expenses are approaching.
He could estimate the next several years of college costs, property expenses and household spending first, then determine how much cash is genuinely available for investing.
An opportunity matters less if it weakens your financial flexibility.
$BTC 3 BITCOIN COULD COST HIM MORE THAN MONEY.
A friend already owns 3+ BTC bought below $30,000, roughly $2 million in income-producing real estate with equity, and more than $400,000 in cash.
Now his wife wants him to buy another 3 BTC before Bitcoin climbs back above $100,000.
But he has three teenagers approaching college age.
And that changes the calculation.
Buying 3 BTC at $85,000 each would require about $255,000 before fees.
From $400,000 in cash, that leaves just $145,000.
If tuition, property repairs, vacancies or another unexpected expense arrives, he may have to sell assets at an inconvenient time.
His real estate may be valuable, but equity isn't the same as cash. Accessing it can take time, cost money and depend on financing conditions.
And Bitcoin could rise above $100,000—or fall sharply before it gets there.
Nobody knows which happens first.
The decision isn't simply whether 3 more BTC would be a good investment.
It's whether the potential upside justifies reducing the family's readily available financial cushion while major education expenses are approaching.
He could estimate the next several years of college costs, property expenses and household spending first, then determine how much cash is genuinely available for investing.
An opportunity matters less if it weakens your financial flexibility.
A friend already owns 3+ BTC bought below $30,000, roughly $2 million in income-producing real estate with equity, and more than $400,000 in cash.
Now his wife wants him to buy another 3 BTC before Bitcoin climbs back above $100,000.
But he has three teenagers approaching college age.
And that changes the calculation.
Buying 3 BTC at $85,000 each would require about $255,000 before fees.
From $400,000 in cash, that leaves just $145,000.
If tuition, property repairs, vacancies or another unexpected expense arrives, he may have to sell assets at an inconvenient time.
His real estate may be valuable, but equity isn't the same as cash. Accessing it can take time, cost money and depend on financing conditions.
And Bitcoin could rise above $100,000—or fall sharply before it gets there.
Nobody knows which happens first.
The decision isn't simply whether 3 more BTC would be a good investment.
It's whether the potential upside justifies reducing the family's readily available financial cushion while major education expenses are approaching.
He could estimate the next several years of college costs, property expenses and household spending first, then determine how much cash is genuinely available for investing.
An opportunity matters less if it weakens your financial flexibility.
64
·
--
Ver traducción
$BTC FOUR YEARS CAN CHANGE THE BITCOIN MATH FAST.
On September 27, 2022, Bitcoin was around $18,802.
Four years later, the reference price is about $84,625.
That works out to roughly a 46% annualized growth rate.
Now comes the interesting part.
If Bitcoin somehow repeated that exact 46% CAGR for another four years, the math would put BTC near $381,000 by September 2030.
Rounded up, that's the often-mentioned $385K scenario.
But there’s a huge difference between calculating a return and predicting one.
Bitcoin did not rise 46% every year.
Some periods were dramatically stronger, while others produced deep drawdowns.
So the $385K figure isn't a forecast.
It's simply what happens when you extend the previous four-year annualized growth rate forward for another four years.
That distinction matters whenever historical performance gets turned into future price targets.
Past compounding creates scenarios, not promises.
$BTC FOUR YEARS CAN CHANGE THE BITCOIN MATH FAST.
On September 27, 2022, Bitcoin was around $18,802.
Four years later, the reference price is about $84,625.
That works out to roughly a 46% annualized growth rate.
Now comes the interesting part.
If Bitcoin somehow repeated that exact 46% CAGR for another four years, the math would put BTC near $381,000 by September 2030.
Rounded up, that's the often-mentioned $385K scenario.
But there’s a huge difference between calculating a return and predicting one.
Bitcoin did not rise 46% every year.
Some periods were dramatically stronger, while others produced deep drawdowns.
So the $385K figure isn't a forecast.
It's simply what happens when you extend the previous four-year annualized growth rate forward for another four years.
That distinction matters whenever historical performance gets turned into future price targets.
Past compounding creates scenarios, not promises.
On September 27, 2022, Bitcoin was around $18,802.
Four years later, the reference price is about $84,625.
That works out to roughly a 46% annualized growth rate.
Now comes the interesting part.
If Bitcoin somehow repeated that exact 46% CAGR for another four years, the math would put BTC near $381,000 by September 2030.
Rounded up, that's the often-mentioned $385K scenario.
But there’s a huge difference between calculating a return and predicting one.
Bitcoin did not rise 46% every year.
Some periods were dramatically stronger, while others produced deep drawdowns.
So the $385K figure isn't a forecast.
It's simply what happens when you extend the previous four-year annualized growth rate forward for another four years.
That distinction matters whenever historical performance gets turned into future price targets.
Past compounding creates scenarios, not promises.
4
·
--
Ver traducción
$BTC WHAT IF AMERICAN WEALTH WERE MEASURED IN BTC?
Using a fixed Bitcoin price can make the numbers look surprisingly simple.
But there’s an important catch:
A net-worth threshold measured in BTC changes every time Bitcoin’s dollar price changes.
If a household has $1 million in net worth, that represents about 11.8 BTC at an $85,000 Bitcoin price.
At $170,000, the same $1 million would equal only about 5.9 BTC.
The household didn't become poorer.
The BTC measurement changed.
That’s why converting U.S. wealth percentiles into Bitcoin is more of a thought experiment than a permanent definition of being rich.
It also shows something important about Bitcoin:
As the BTC price rises, the amount of Bitcoin needed to represent the same dollar wealth falls.
Bitcoin can change the measuring stick without changing wealth.
$BTC WHAT IF AMERICAN WEALTH WERE MEASURED IN BTC?
Using a fixed Bitcoin price can make the numbers look surprisingly simple.
But there’s an important catch:
A net-worth threshold measured in BTC changes every time Bitcoin’s dollar price changes.
If a household has $1 million in net worth, that represents about 11.8 BTC at an $85,000 Bitcoin price.
At $170,000, the same $1 million would equal only about 5.9 BTC.
The household didn't become poorer.
The BTC measurement changed.
That’s why converting U.S. wealth percentiles into Bitcoin is more of a thought experiment than a permanent definition of being rich.
It also shows something important about Bitcoin:
As the BTC price rises, the amount of Bitcoin needed to represent the same dollar wealth falls.
Bitcoin can change the measuring stick without changing wealth.
Using a fixed Bitcoin price can make the numbers look surprisingly simple.
But there’s an important catch:
A net-worth threshold measured in BTC changes every time Bitcoin’s dollar price changes.
If a household has $1 million in net worth, that represents about 11.8 BTC at an $85,000 Bitcoin price.
At $170,000, the same $1 million would equal only about 5.9 BTC.
The household didn't become poorer.
The BTC measurement changed.
That’s why converting U.S. wealth percentiles into Bitcoin is more of a thought experiment than a permanent definition of being rich.
It also shows something important about Bitcoin:
As the BTC price rises, the amount of Bitcoin needed to represent the same dollar wealth falls.
Bitcoin can change the measuring stick without changing wealth.

66
·
--
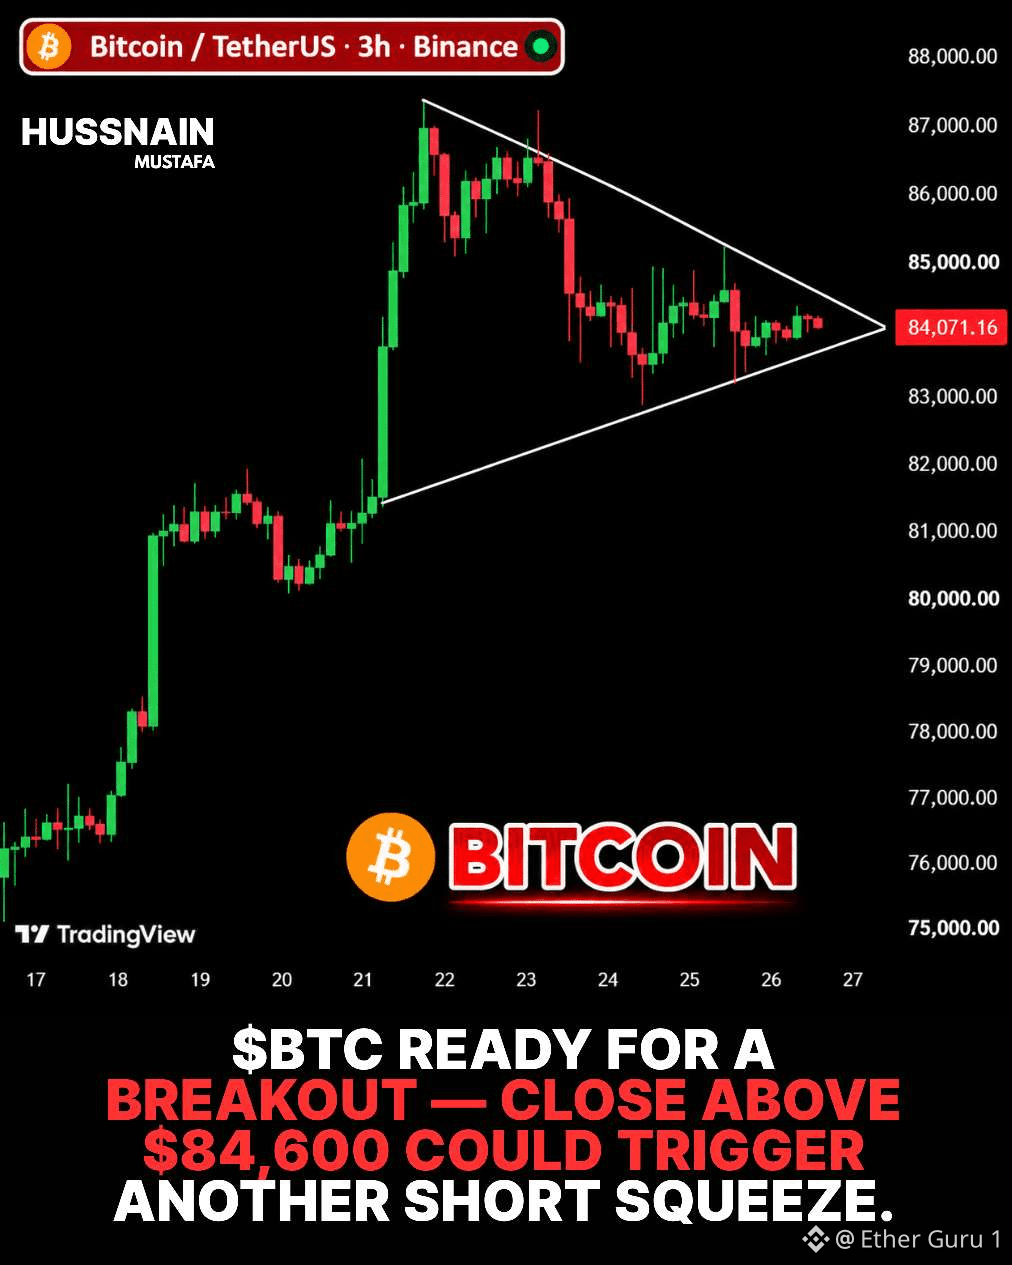
$BTC BITCOIN YA ROMPIÓ EL NIVEL.
La pregunta más interesante ahora es qué sucede después del apretón.
BTC atravesó la zona de $84,000 y alcanzó aproximadamente $87,000 esta semana.
Una razón importante de la rapidez fue la recompra forzada de posiciones cortas.
Cuando los cortos muy apalancados se liquidan, las bolsas cierran esas posiciones comprando nuevamente BTC.
Esa compra puede desencadenar una reacción en cadena:
Precio más alto.
Más liquidaciones.
Más compras forzadas.
Pero hay un detalle.
Las liquidaciones son combustible temporal.
Una vez que esas posiciones desaparecen, el mercado necesita compradores reales para mantener en marcha el movimiento.
Eso hace que las próximas sesiones sean más reveladoras que el titular del rompimiento en sí.
Un apretón puede iniciar un movimiento; la demanda debe sostenerlo.
$BTC BITCOIN YA ROMPIÓ EL NIVEL.
La pregunta más interesante ahora es qué sucede después del apretón.
BTC atravesó la zona de $84,000 y alcanzó aproximadamente $87,000 esta semana.
Una razón importante de la rapidez fue la recompra forzada de posiciones cortas.
Cuando los cortos muy apalancados se liquidan, las bolsas cierran esas posiciones comprando nuevamente BTC.
Esa compra puede desencadenar una reacción en cadena:
Precio más alto.
Más liquidaciones.
Más compras forzadas.
Pero hay un detalle.
Las liquidaciones son combustible temporal.
Una vez que esas posiciones desaparecen, el mercado necesita compradores reales para mantener en marcha el movimiento.
Eso hace que las próximas sesiones sean más reveladoras que el titular del rompimiento en sí.
Un apretón puede iniciar un movimiento; la demanda debe sostenerlo.
La pregunta más interesante ahora es qué sucede después del apretón.
BTC atravesó la zona de $84,000 y alcanzó aproximadamente $87,000 esta semana.
Una razón importante de la rapidez fue la recompra forzada de posiciones cortas.
Cuando los cortos muy apalancados se liquidan, las bolsas cierran esas posiciones comprando nuevamente BTC.
Esa compra puede desencadenar una reacción en cadena:
Precio más alto.
Más liquidaciones.
Más compras forzadas.
Pero hay un detalle.
Las liquidaciones son combustible temporal.
Una vez que esas posiciones desaparecen, el mercado necesita compradores reales para mantener en marcha el movimiento.
Eso hace que las próximas sesiones sean más reveladoras que el titular del rompimiento en sí.
Un apretón puede iniciar un movimiento; la demanda debe sostenerlo.
52
·
--
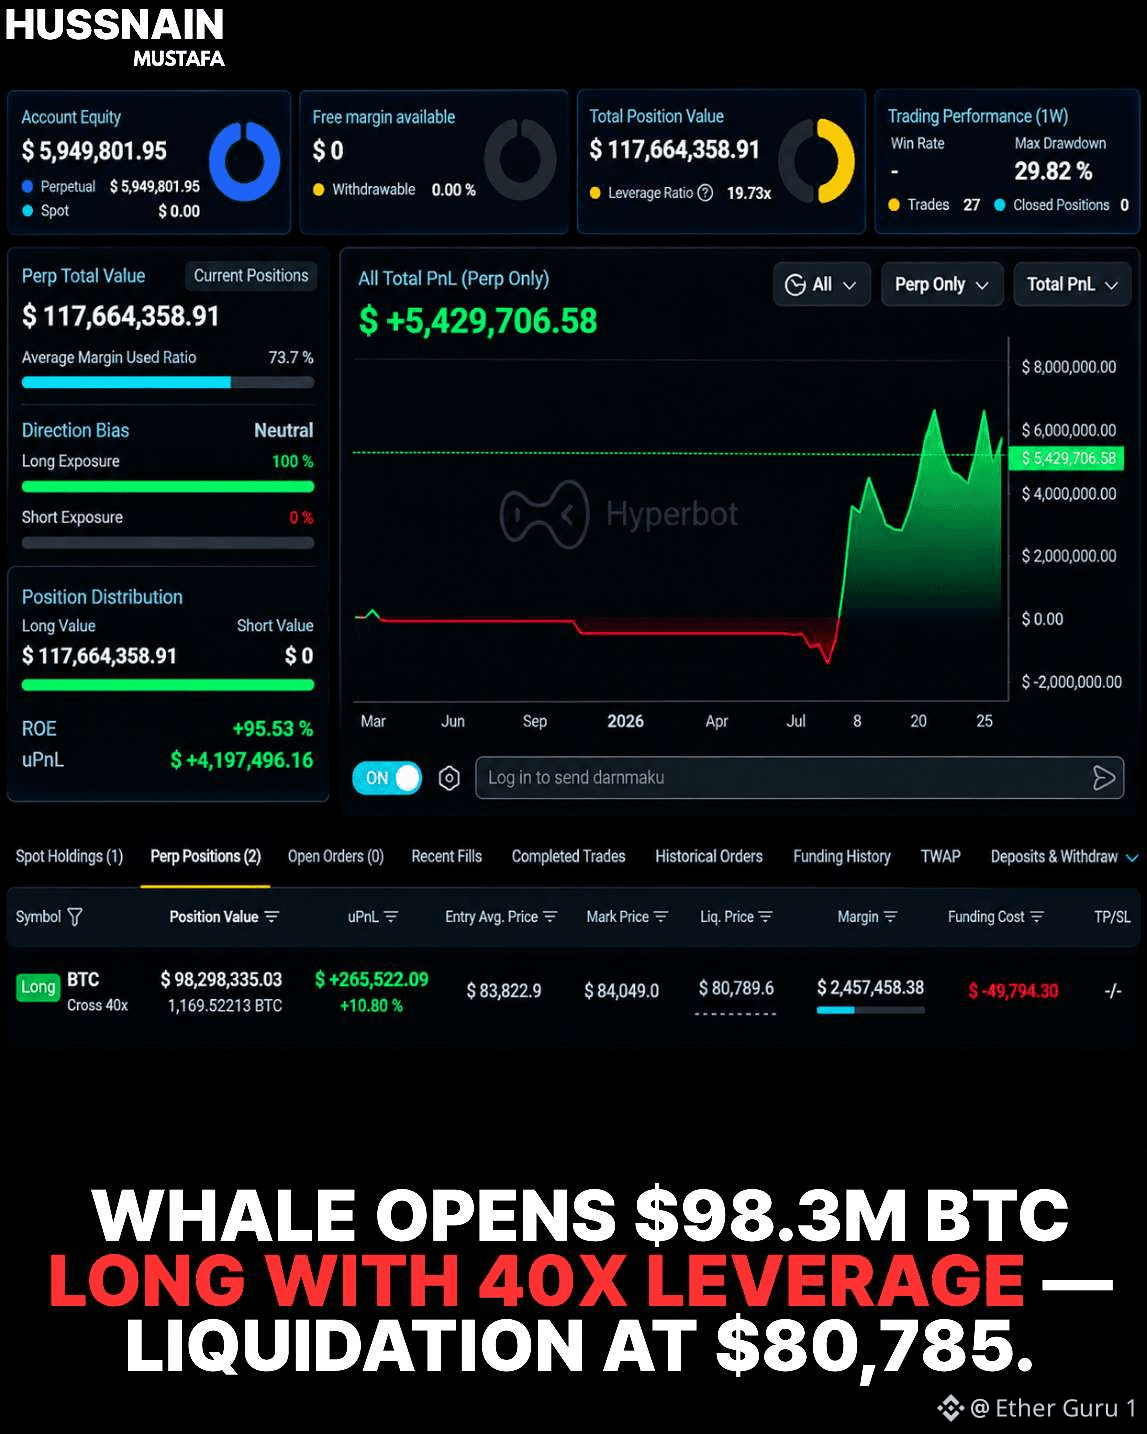
$BTC UN PEZ GORDO ACABA DE ABRIR UN LONG DE BITCOIN POR $98,3M
La posición, según se informa, utiliza un apalancamiento de 40×, con la liquidación alrededor de $80,785.
Con un apalancamiento de 40×, aproximadamente $2,46 millones de margen controlan una posición de $98,3 millones.
Eso crea una exposición enorme a partir de un capital relativamente bajo publicado.
Lo peligroso es la distancia hasta la liquidación.
Si BTC cae hacia $80,785, la posición puede verse forzada a cerrarse, potencialmente dejando pérdidas para el trader y aumentando la presión vendedora durante una caída.
El apalancamiento puede hacer que una posición parezca enorme sin requerir un capital inicial igualmente grande.
Las posiciones grandes pueden llevar colchones muy pequeños.
$BTC UN PEZ GORDO ACABA DE ABRIR UN LONG DE BITCOIN POR $98,3M
La posición, según se informa, utiliza un apalancamiento de 40×, con la liquidación alrededor de $80,785.
Con un apalancamiento de 40×, aproximadamente $2,46 millones de margen controlan una posición de $98,3 millones.
Eso crea una exposición enorme a partir de un capital relativamente bajo publicado.
Lo peligroso es la distancia hasta la liquidación.
Si BTC cae hacia $80,785, la posición puede verse forzada a cerrarse, potencialmente dejando pérdidas para el trader y aumentando la presión vendedora durante una caída.
El apalancamiento puede hacer que una posición parezca enorme sin requerir un capital inicial igualmente grande.
Las posiciones grandes pueden llevar colchones muy pequeños.
La posición, según se informa, utiliza un apalancamiento de 40×, con la liquidación alrededor de $80,785.
Con un apalancamiento de 40×, aproximadamente $2,46 millones de margen controlan una posición de $98,3 millones.
Eso crea una exposición enorme a partir de un capital relativamente bajo publicado.
Lo peligroso es la distancia hasta la liquidación.
Si BTC cae hacia $80,785, la posición puede verse forzada a cerrarse, potencialmente dejando pérdidas para el trader y aumentando la presión vendedora durante una caída.
El apalancamiento puede hacer que una posición parezca enorme sin requerir un capital inicial igualmente grande.
Las posiciones grandes pueden llevar colchones muy pequeños.
66
·
--
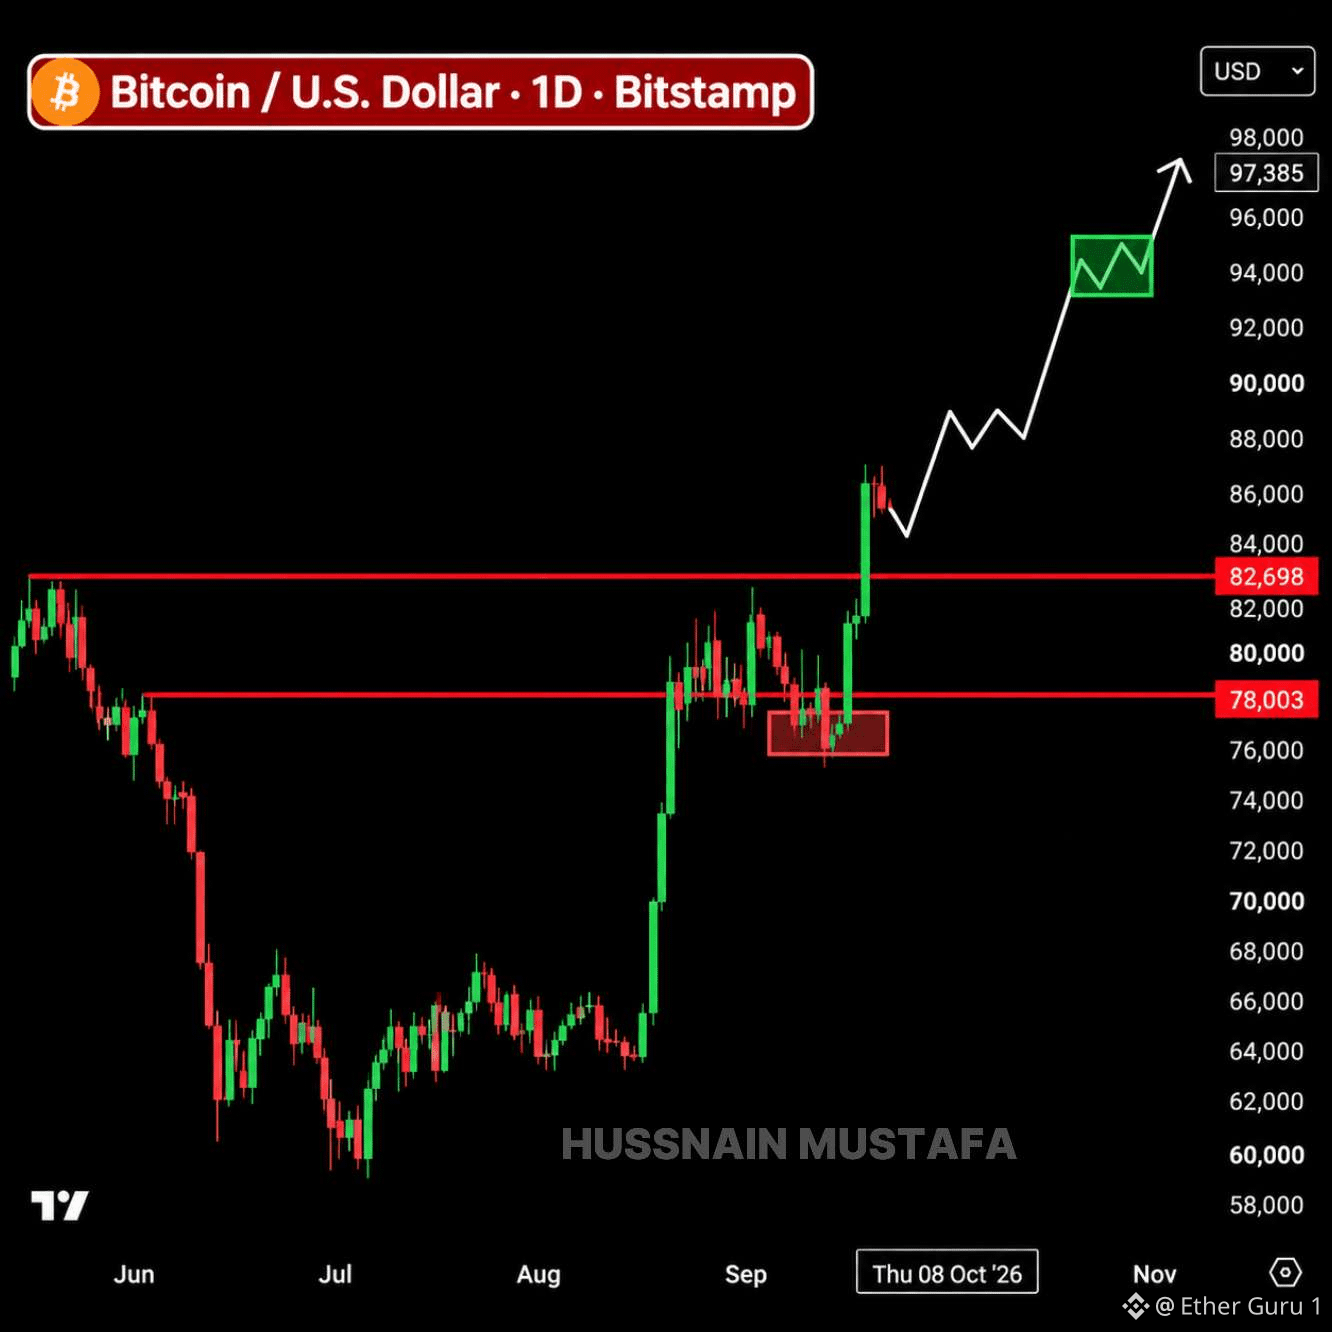
$BTC BITCOIN ACABA DE CONVERTIR DOS ZONAS DE RESISTENCIA ANTIGUAS EN SOPORTE.
Se recuperó $78K.
Luego $82.7K cedió.
Ahora BTC cotiza alrededor de $84K, y el mercado observa si los compradores pueden seguir defendiendo los niveles que antes mantenían el precio.
Esa distinción importa.
Un breakout es una cosa.
Mantenerse por encima de él cuando se disipa la euforia es otra.
Si $82.7K sigue actuando como soporte, $90K se vuelve un nivel mucho más evidente para que los traders lo vigilen.
Pero si ese nivel se pierde otra vez, todo el planteamiento empieza a verse diferente.
Por ahora, lo interesante no es el número de $90K en sí.
Sino si Bitcoin puede seguir construyendo mínimos más altos debajo de él.
El próximo movimiento depende de qué es lo que aguante.
$BTC BITCOIN ACABA DE CONVERTIR DOS ZONAS DE RESISTENCIA ANTIGUAS EN SOPORTE.
Se recuperó $78K.
Luego $82.7K cedió.
Ahora BTC cotiza alrededor de $84K, y el mercado observa si los compradores pueden seguir defendiendo los niveles que antes mantenían el precio.
Esa distinción importa.
Un breakout es una cosa.
Mantenerse por encima de él cuando se disipa la euforia es otra.
Si $82.7K sigue actuando como soporte, $90K se vuelve un nivel mucho más evidente para que los traders lo vigilen.
Pero si ese nivel se pierde otra vez, todo el planteamiento empieza a verse diferente.
Por ahora, lo interesante no es el número de $90K en sí.
Sino si Bitcoin puede seguir construyendo mínimos más altos debajo de él.
El próximo movimiento depende de qué es lo que aguante.
Se recuperó $78K.
Luego $82.7K cedió.
Ahora BTC cotiza alrededor de $84K, y el mercado observa si los compradores pueden seguir defendiendo los niveles que antes mantenían el precio.
Esa distinción importa.
Un breakout es una cosa.
Mantenerse por encima de él cuando se disipa la euforia es otra.
Si $82.7K sigue actuando como soporte, $90K se vuelve un nivel mucho más evidente para que los traders lo vigilen.
Pero si ese nivel se pierde otra vez, todo el planteamiento empieza a verse diferente.
Por ahora, lo interesante no es el número de $90K en sí.
Sino si Bitcoin puede seguir construyendo mínimos más altos debajo de él.
El próximo movimiento depende de qué es lo que aguante.
60
·
--
$BTC BITCOIN ETF VOLVIÓ A TOMAR SERIEDAD.
Los ETF de Bitcoin al contado de EE. UU. captaron aproximadamente 715 millones de dólares el martes.
Esa fue la cuarta sesión consecutiva en positivo, llevando la racha de cuatro días a unos 2,31 mil millones de dólares.
Solo IBIT de BlackRock atrajo aproximadamente 350 millones de dólares.
Fidelity añadió otros 257 millones de dólares.
Esto es importante porque los flujos de los ETF representan una demanda real de Bitcoin al contado, no solo gente hablando de forma alcista en redes sociales.
Después de semanas de flujos irregulares, miles de millones que regresan en pocas sesiones es un cambio notable en el comportamiento del mercado.
No garantiza el siguiente movimiento al alza.
Pero si esta demanda sigue apareciendo mientras Bitcoin mantiene las ganancias recientes, el mercado está recibiendo una señal muy diferente a la que vimos durante la reciente venta.
El capital está volviendo a entrar en Bitcoin.
$BTC BITCOIN ETF VOLVIÓ A TOMAR SERIEDAD.
Los ETF de Bitcoin al contado de EE. UU. captaron aproximadamente 715 millones de dólares el martes.
Esa fue la cuarta sesión consecutiva en positivo, llevando la racha de cuatro días a unos 2,31 mil millones de dólares.
Solo IBIT de BlackRock atrajo aproximadamente 350 millones de dólares.
Fidelity añadió otros 257 millones de dólares.
Esto es importante porque los flujos de los ETF representan una demanda real de Bitcoin al contado, no solo gente hablando de forma alcista en redes sociales.
Después de semanas de flujos irregulares, miles de millones que regresan en pocas sesiones es un cambio notable en el comportamiento del mercado.
No garantiza el siguiente movimiento al alza.
Pero si esta demanda sigue apareciendo mientras Bitcoin mantiene las ganancias recientes, el mercado está recibiendo una señal muy diferente a la que vimos durante la reciente venta.
El capital está volviendo a entrar en Bitcoin.
Los ETF de Bitcoin al contado de EE. UU. captaron aproximadamente 715 millones de dólares el martes.
Esa fue la cuarta sesión consecutiva en positivo, llevando la racha de cuatro días a unos 2,31 mil millones de dólares.
Solo IBIT de BlackRock atrajo aproximadamente 350 millones de dólares.
Fidelity añadió otros 257 millones de dólares.
Esto es importante porque los flujos de los ETF representan una demanda real de Bitcoin al contado, no solo gente hablando de forma alcista en redes sociales.
Después de semanas de flujos irregulares, miles de millones que regresan en pocas sesiones es un cambio notable en el comportamiento del mercado.
No garantiza el siguiente movimiento al alza.
Pero si esta demanda sigue apareciendo mientras Bitcoin mantiene las ganancias recientes, el mercado está recibiendo una señal muy diferente a la que vimos durante la reciente venta.
El capital está volviendo a entrar en Bitcoin.

BTC+1,54%
IBITETF+0,88%
68
·
--
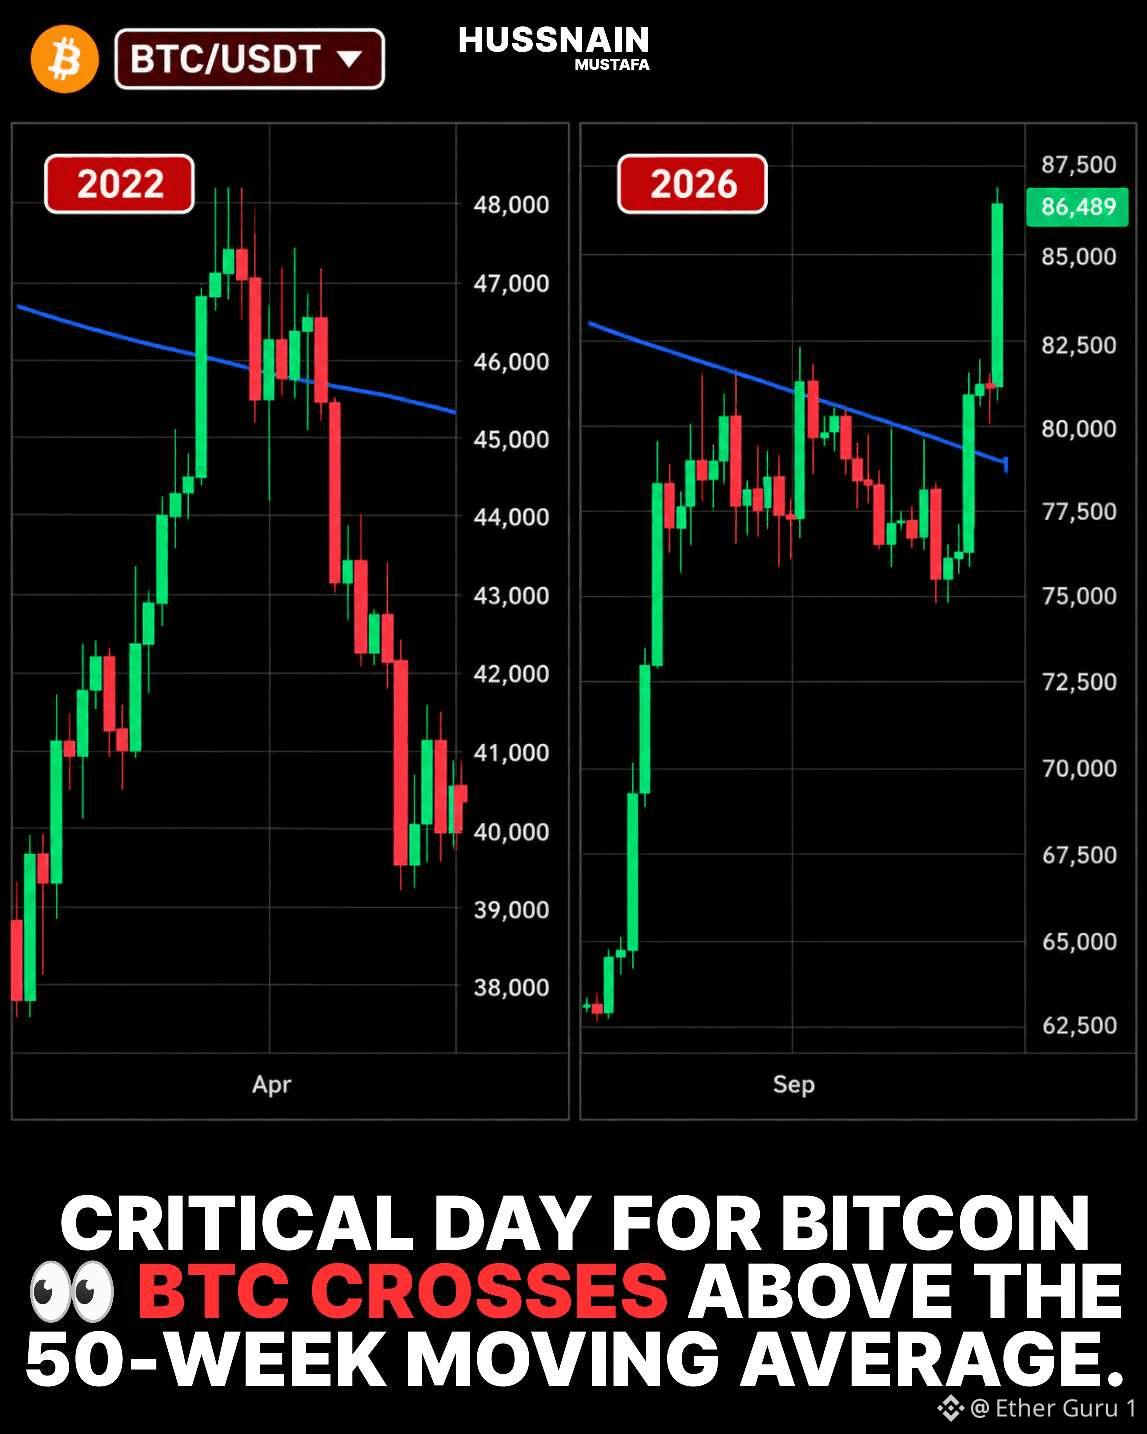
$BTC BITCOIN ACABA DE RECUPERAR UN NIVEL QUE IMPORTA.
BTC cerró alrededor de $81,159.
Su media móvil de 50 semanas estaba cerca de $78,788.
Eso sitúa a Bitcoin aproximadamente un 3% por encima de la línea.
Pero la historia hace que este escenario sea interesante.
Galaxy Research encontró 13 recuperaciones semanales previas.
Once no fueron seguidas por un nuevo mínimo de ciclo.
Dos fueron diferentes.
Diciembre de 2021 y marzo de 2022 recuperaron ambas la media antes de que Bitcoin finalmente cayera mucho más.
Así que un cierre exitoso no garantiza una reversión de tendencia.
La pregunta importante ahora es si BTC puede mantenerse por encima de la media móvil.
Ahí es donde esta señal se vuelve más útil.
Una recuperación fallida convertiría el mismo nivel nuevamente en resistencia.
Un movimiento sostenido por encima de ella fortalecería la idea de que la estructura del mercado ha cambiado.
Los indicadores técnicos funcionan mejor como evidencia, no como certeza.
Y ahora mismo, Bitcoin está justo sobre una de sus líneas de tendencia a largo plazo más vigiladas.
Los próximos cierres semanales pueden importar más que la ruptura de hoy.
$BTC BITCOIN ACABA DE RECUPERAR UN NIVEL QUE IMPORTA.
BTC cerró alrededor de $81,159.
Su media móvil de 50 semanas estaba cerca de $78,788.
Eso sitúa a Bitcoin aproximadamente un 3% por encima de la línea.
Pero la historia hace que este escenario sea interesante.
Galaxy Research encontró 13 recuperaciones semanales previas.
Once no fueron seguidas por un nuevo mínimo de ciclo.
Dos fueron diferentes.
Diciembre de 2021 y marzo de 2022 recuperaron ambas la media antes de que Bitcoin finalmente cayera mucho más.
Así que un cierre exitoso no garantiza una reversión de tendencia.
La pregunta importante ahora es si BTC puede mantenerse por encima de la media móvil.
Ahí es donde esta señal se vuelve más útil.
Una recuperación fallida convertiría el mismo nivel nuevamente en resistencia.
Un movimiento sostenido por encima de ella fortalecería la idea de que la estructura del mercado ha cambiado.
Los indicadores técnicos funcionan mejor como evidencia, no como certeza.
Y ahora mismo, Bitcoin está justo sobre una de sus líneas de tendencia a largo plazo más vigiladas.
Los próximos cierres semanales pueden importar más que la ruptura de hoy.
BTC cerró alrededor de $81,159.
Su media móvil de 50 semanas estaba cerca de $78,788.
Eso sitúa a Bitcoin aproximadamente un 3% por encima de la línea.
Pero la historia hace que este escenario sea interesante.
Galaxy Research encontró 13 recuperaciones semanales previas.
Once no fueron seguidas por un nuevo mínimo de ciclo.
Dos fueron diferentes.
Diciembre de 2021 y marzo de 2022 recuperaron ambas la media antes de que Bitcoin finalmente cayera mucho más.
Así que un cierre exitoso no garantiza una reversión de tendencia.
La pregunta importante ahora es si BTC puede mantenerse por encima de la media móvil.
Ahí es donde esta señal se vuelve más útil.
Una recuperación fallida convertiría el mismo nivel nuevamente en resistencia.
Un movimiento sostenido por encima de ella fortalecería la idea de que la estructura del mercado ha cambiado.
Los indicadores técnicos funcionan mejor como evidencia, no como certeza.
Y ahora mismo, Bitcoin está justo sobre una de sus líneas de tendencia a largo plazo más vigiladas.
Los próximos cierres semanales pueden importar más que la ruptura de hoy.
70
·
--
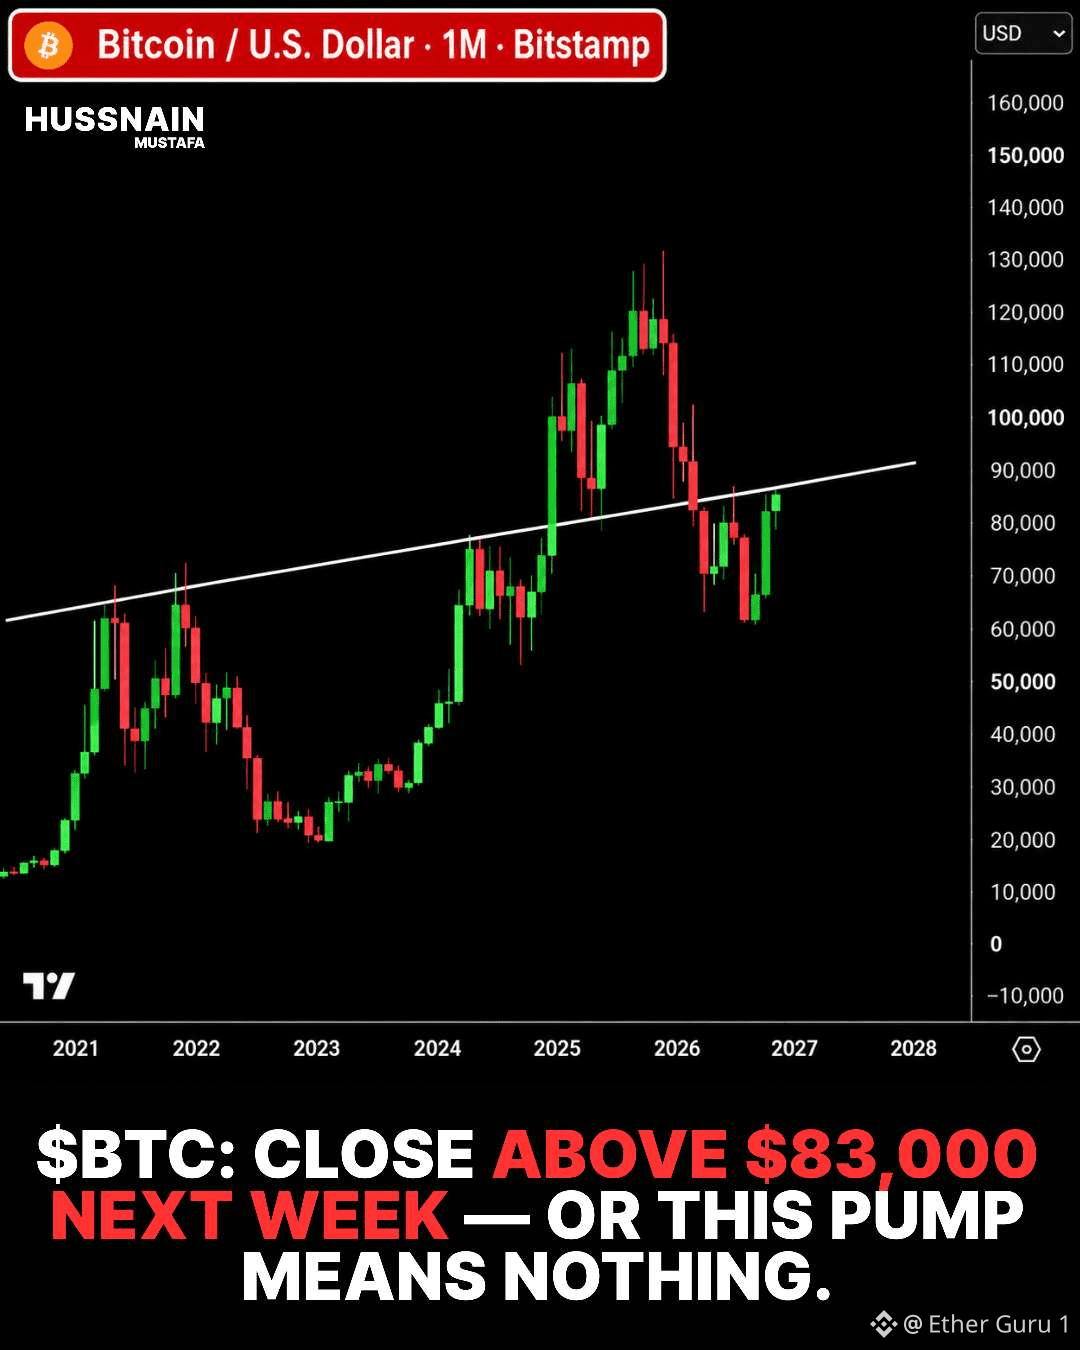
$BTC Bitcoin’s $83K Weekly Test
Un cierre semanal por encima de $83,000 pondría a Bitcoin en un nuevo hito a corto plazo.
El nivel importa porque los cierres semanales muestran dónde compradores y vendedores terminaron el período.
Un movimiento intradía por encima de $83K cuenta una historia distinta.
Un cierre sostenido brindaría una evidencia más sólida de aceptación por encima de ese precio.
El reciente rebote de Bitcoin ya lo ha alejado de sus mínimos de septiembre.
Pero el impulso a corto plazo puede desaparecer rápidamente en las criptomonedas.
El volumen, las entradas a los ETF y la liquidez pueden influir en la continuidad.
Un solo precio de cierre no puede confirmar todo un ciclo de mercado.
La próxima vela semanal revelará si $83K se convierte en soporte.
O si esta subida fue simplemente otro movimiento temporal.
$BTC Bitcoin’s $83K Weekly Test
Un cierre semanal por encima de $83,000 pondría a Bitcoin en un nuevo hito a corto plazo.
El nivel importa porque los cierres semanales muestran dónde compradores y vendedores terminaron el período.
Un movimiento intradía por encima de $83K cuenta una historia distinta.
Un cierre sostenido brindaría una evidencia más sólida de aceptación por encima de ese precio.
El reciente rebote de Bitcoin ya lo ha alejado de sus mínimos de septiembre.
Pero el impulso a corto plazo puede desaparecer rápidamente en las criptomonedas.
El volumen, las entradas a los ETF y la liquidez pueden influir en la continuidad.
Un solo precio de cierre no puede confirmar todo un ciclo de mercado.
La próxima vela semanal revelará si $83K se convierte en soporte.
O si esta subida fue simplemente otro movimiento temporal.
Un cierre semanal por encima de $83,000 pondría a Bitcoin en un nuevo hito a corto plazo.
El nivel importa porque los cierres semanales muestran dónde compradores y vendedores terminaron el período.
Un movimiento intradía por encima de $83K cuenta una historia distinta.
Un cierre sostenido brindaría una evidencia más sólida de aceptación por encima de ese precio.
El reciente rebote de Bitcoin ya lo ha alejado de sus mínimos de septiembre.
Pero el impulso a corto plazo puede desaparecer rápidamente en las criptomonedas.
El volumen, las entradas a los ETF y la liquidez pueden influir en la continuidad.
Un solo precio de cierre no puede confirmar todo un ciclo de mercado.
La próxima vela semanal revelará si $83K se convierte en soporte.
O si esta subida fue simplemente otro movimiento temporal.
63
·
--
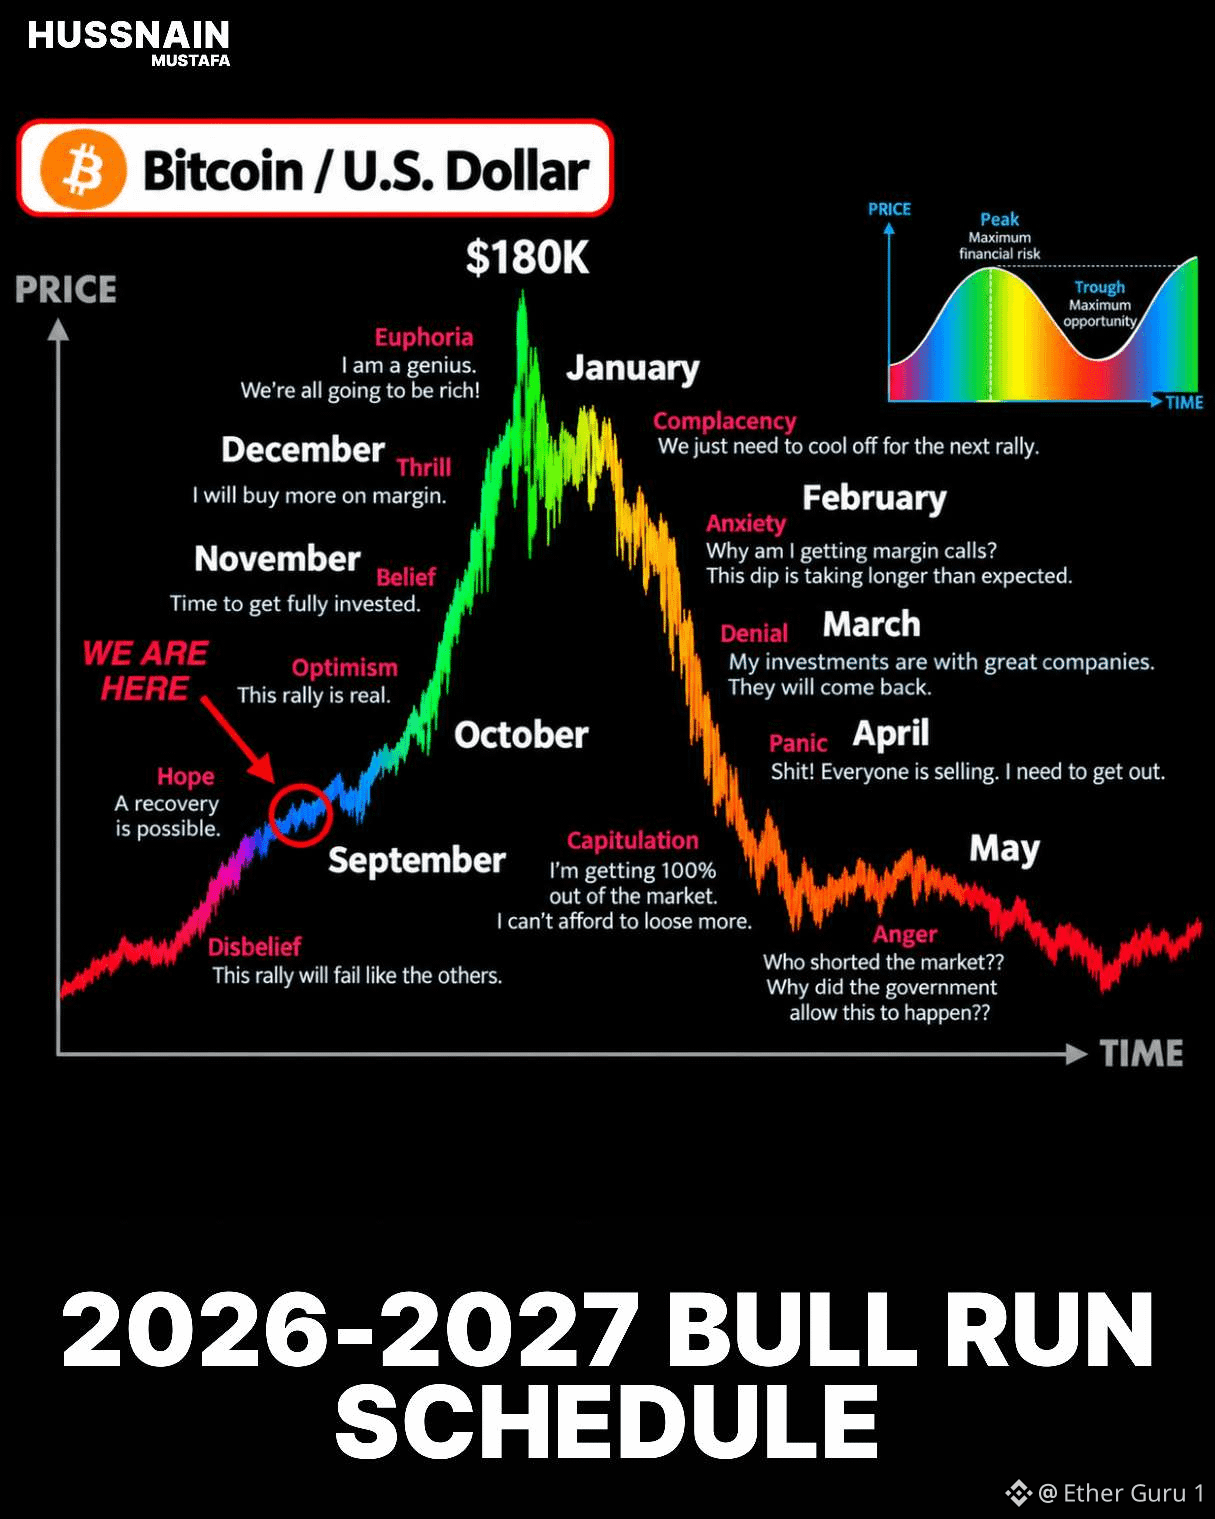
$BTC NO HAY UN NÚMERO MÁGICO DE BITCOIN PARA RETIRARTE.
Un gráfico viral dice 0.05 BTC a los 16.
Luego 0.25 BTC antes de cumplir los 30.
Y 5 BTC después de los 65.
Pero esos objetivos no son una regla financiera.
Bitcoin tiene un suministro máximo fijo de 21 millones de monedas.
Con 5 BTC por persona, solo unas 4.2 millones de personas podrían, en teoría, tener esa cantidad.
Eso ignora las monedas perdidas, las instituciones, los gobiernos, los exchanges y la propiedad desigual.
La lección más grande, en realidad, es sobre la acumulación.
Alguien que tiene 0.10 BTC hoy posee una parte diferente de la red que alguien que empieza diez años a partir de ahora.
Pero el precio de Bitcoin también puede caer de forma drástica.
Un objetivo medido solo en BTC ignora ingresos, deudas, ahorros para emergencias, impuestos, cuentas de jubilación y el patrimonio neto en general.
Para una persona, 0.25 BTC podría ser una pequeña asignación especulativa.
Para otra, podría representar una concentración desproporcionada de su riqueza.
Así que “ganar el juego” no puede definirse con un solo número de Bitcoin.
La pregunta útil es cuáse riesgo puede asumir una persona de manera responsable.
La propiedad de Bitcoin importa, pero el contexto financiero importa más.
$BTC NO HAY UN NÚMERO MÁGICO DE BITCOIN PARA RETIRARTE.
Un gráfico viral dice 0.05 BTC a los 16.
Luego 0.25 BTC antes de cumplir los 30.
Y 5 BTC después de los 65.
Pero esos objetivos no son una regla financiera.
Bitcoin tiene un suministro máximo fijo de 21 millones de monedas.
Con 5 BTC por persona, solo unas 4.2 millones de personas podrían, en teoría, tener esa cantidad.
Eso ignora las monedas perdidas, las instituciones, los gobiernos, los exchanges y la propiedad desigual.
La lección más grande, en realidad, es sobre la acumulación.
Alguien que tiene 0.10 BTC hoy posee una parte diferente de la red que alguien que empieza diez años a partir de ahora.
Pero el precio de Bitcoin también puede caer de forma drástica.
Un objetivo medido solo en BTC ignora ingresos, deudas, ahorros para emergencias, impuestos, cuentas de jubilación y el patrimonio neto en general.
Para una persona, 0.25 BTC podría ser una pequeña asignación especulativa.
Para otra, podría representar una concentración desproporcionada de su riqueza.
Así que “ganar el juego” no puede definirse con un solo número de Bitcoin.
La pregunta útil es cuáse riesgo puede asumir una persona de manera responsable.
La propiedad de Bitcoin importa, pero el contexto financiero importa más.
Un gráfico viral dice 0.05 BTC a los 16.
Luego 0.25 BTC antes de cumplir los 30.
Y 5 BTC después de los 65.
Pero esos objetivos no son una regla financiera.
Bitcoin tiene un suministro máximo fijo de 21 millones de monedas.
Con 5 BTC por persona, solo unas 4.2 millones de personas podrían, en teoría, tener esa cantidad.
Eso ignora las monedas perdidas, las instituciones, los gobiernos, los exchanges y la propiedad desigual.
La lección más grande, en realidad, es sobre la acumulación.
Alguien que tiene 0.10 BTC hoy posee una parte diferente de la red que alguien que empieza diez años a partir de ahora.
Pero el precio de Bitcoin también puede caer de forma drástica.
Un objetivo medido solo en BTC ignora ingresos, deudas, ahorros para emergencias, impuestos, cuentas de jubilación y el patrimonio neto en general.
Para una persona, 0.25 BTC podría ser una pequeña asignación especulativa.
Para otra, podría representar una concentración desproporcionada de su riqueza.
Así que “ganar el juego” no puede definirse con un solo número de Bitcoin.
La pregunta útil es cuáse riesgo puede asumir una persona de manera responsable.
La propiedad de Bitcoin importa, pero el contexto financiero importa más.
71
·
--
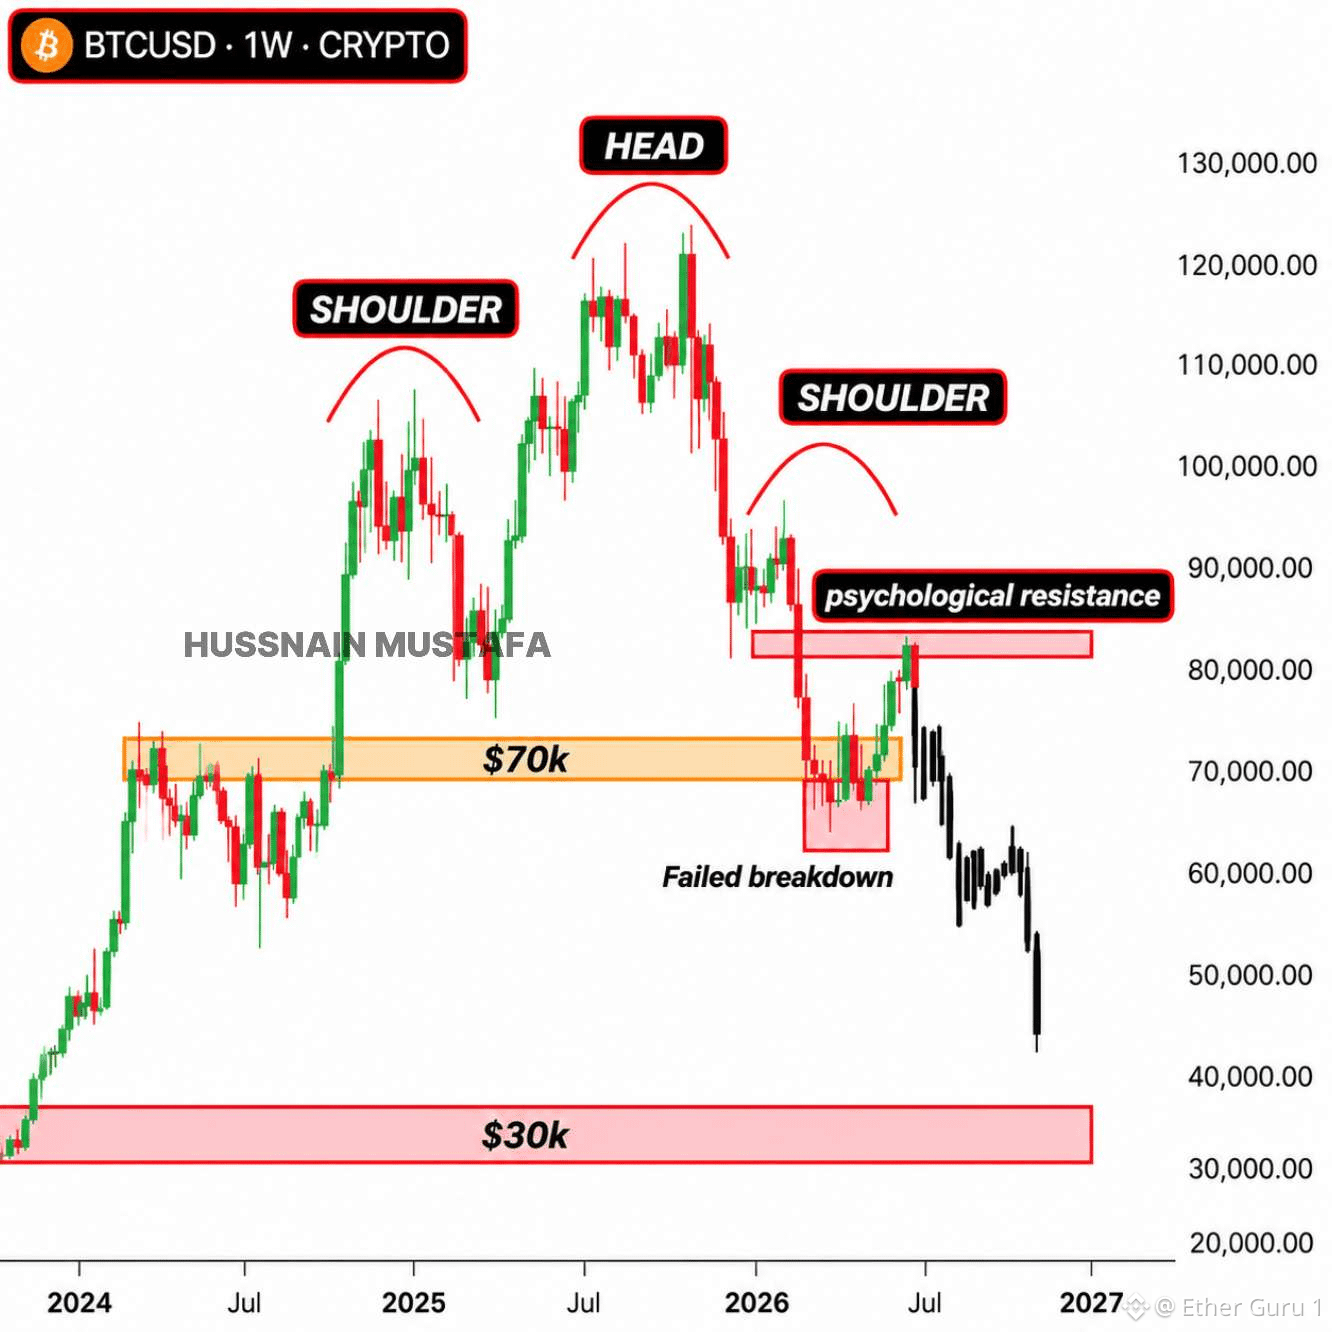
LA CAÍDA DEL $BTC BITCOIN NECESITA MÁS DE UNA EXPLICACIÓN.
Un proyecto de ley cripto rechazado puede dañar el sentimiento.
Pero eso no prueba el siguiente objetivo de precio.
Bitcoin reacciona a la liquidez, el apalancamiento, los flujos de ETF, las tasas de interés y la posición de los inversores.
Un movimiento de $75.000 a $70.000 sería una caída de aproximadamente 6,7%.
Una caída a $63.000 significaría otra bajada del 10% desde $70.000.
De $75.000 a $47.000, la pérdida alcanzaría alrededor del 37%.
Por eso, las previsiones precisas merecen cautela.
Un trader puede identificar correctamente un gran suelo.
Eso no hace que cada predicción futura sea fiable.
Los mercados pueden seguir un patrón durante semanas.
Luego, una decisión de política, un cambio en la liquidez o un titular inesperado puede alterar el rumbo.
La pregunta más importante no es quién señaló el último suelo.
Es si la tesis actual tiene evidencia medible que la respalde.
Observa los niveles de soporte, el volumen, el apalancamiento en derivados y los flujos institucionales.
Estas señales pueden aportar contexto sin prometer un punto de giro exacto.
Una predicción no es una estrategia sin control de riesgos.
LA CAÍDA DEL $BTC BITCOIN NECESITA MÁS DE UNA EXPLICACIÓN.
Un proyecto de ley cripto rechazado puede dañar el sentimiento.
Pero eso no prueba el siguiente objetivo de precio.
Bitcoin reacciona a la liquidez, el apalancamiento, los flujos de ETF, las tasas de interés y la posición de los inversores.
Un movimiento de $75.000 a $70.000 sería una caída de aproximadamente 6,7%.
Una caída a $63.000 significaría otra bajada del 10% desde $70.000.
De $75.000 a $47.000, la pérdida alcanzaría alrededor del 37%.
Por eso, las previsiones precisas merecen cautela.
Un trader puede identificar correctamente un gran suelo.
Eso no hace que cada predicción futura sea fiable.
Los mercados pueden seguir un patrón durante semanas.
Luego, una decisión de política, un cambio en la liquidez o un titular inesperado puede alterar el rumbo.
La pregunta más importante no es quién señaló el último suelo.
Es si la tesis actual tiene evidencia medible que la respalde.
Observa los niveles de soporte, el volumen, el apalancamiento en derivados y los flujos institucionales.
Estas señales pueden aportar contexto sin prometer un punto de giro exacto.
Una predicción no es una estrategia sin control de riesgos.
Un proyecto de ley cripto rechazado puede dañar el sentimiento.
Pero eso no prueba el siguiente objetivo de precio.
Bitcoin reacciona a la liquidez, el apalancamiento, los flujos de ETF, las tasas de interés y la posición de los inversores.
Un movimiento de $75.000 a $70.000 sería una caída de aproximadamente 6,7%.
Una caída a $63.000 significaría otra bajada del 10% desde $70.000.
De $75.000 a $47.000, la pérdida alcanzaría alrededor del 37%.
Por eso, las previsiones precisas merecen cautela.
Un trader puede identificar correctamente un gran suelo.
Eso no hace que cada predicción futura sea fiable.
Los mercados pueden seguir un patrón durante semanas.
Luego, una decisión de política, un cambio en la liquidez o un titular inesperado puede alterar el rumbo.
La pregunta más importante no es quién señaló el último suelo.
Es si la tesis actual tiene evidencia medible que la respalde.
Observa los niveles de soporte, el volumen, el apalancamiento en derivados y los flujos institucionales.
Estas señales pueden aportar contexto sin prometer un punto de giro exacto.
Una predicción no es una estrategia sin control de riesgos.
2
·
--
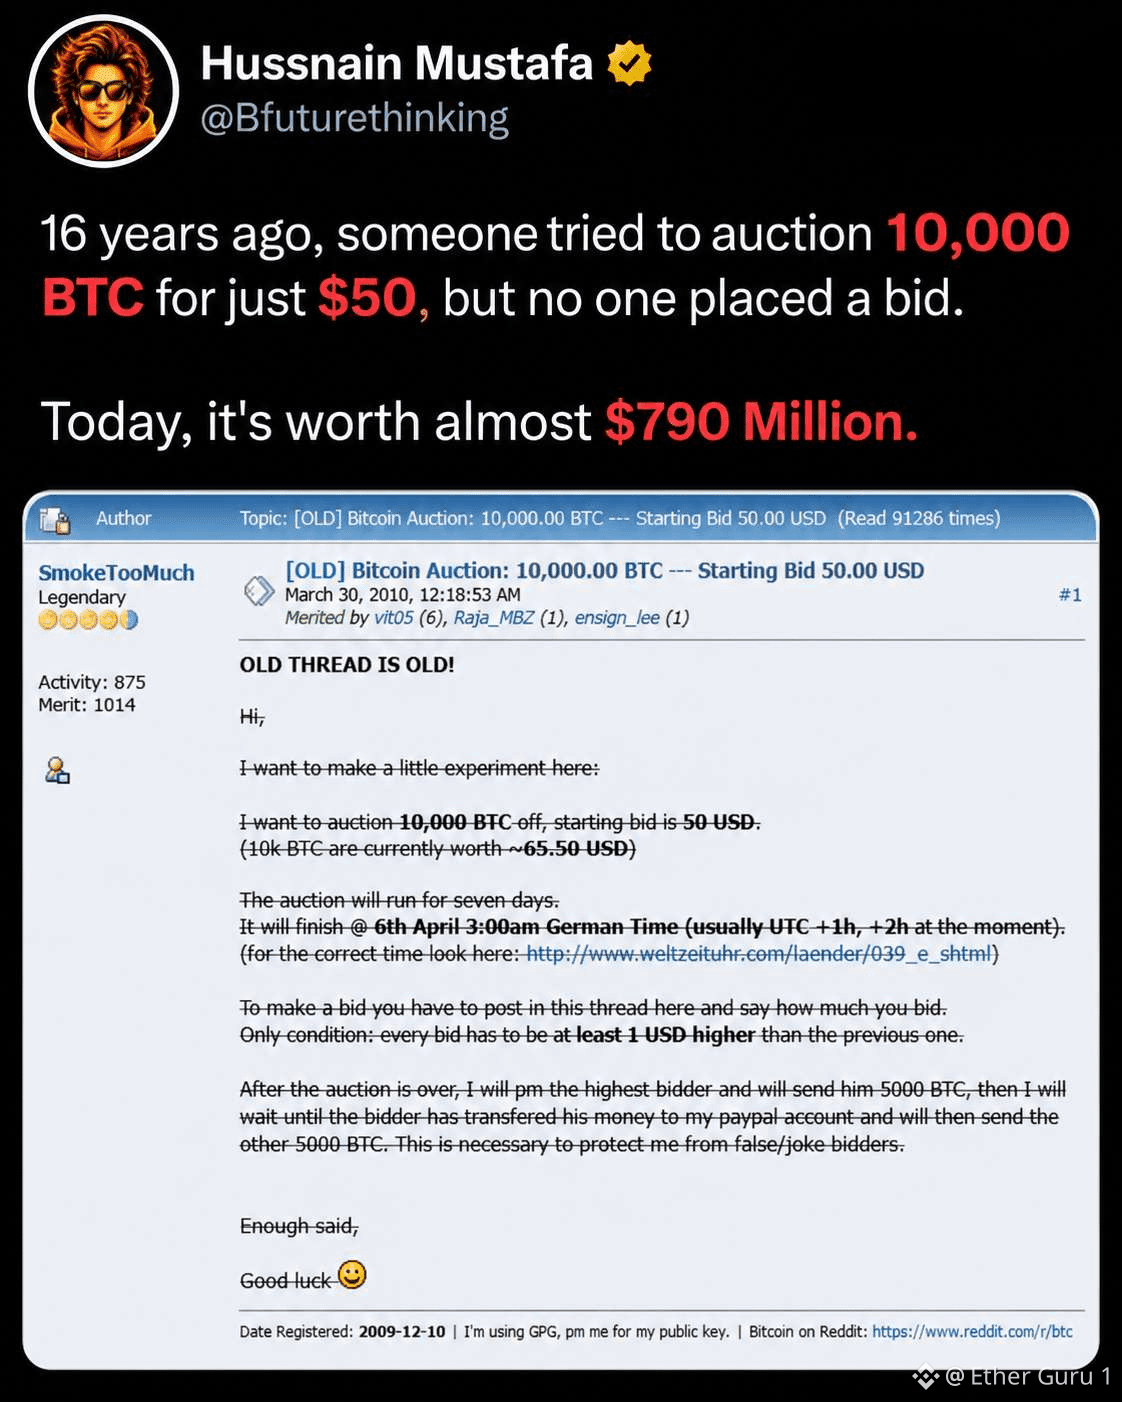
$BTC 10,000 BTC. Una subasta de $50. Cero ofertas.
Dieciséis años atrás, alguien supuestamente intentó vender un enorme lote de Bitcoin por solo $50.
Nadie lo quiso.
Hoy, esa misma cantidad de Bitcoin valdría cientos de millones de dólares.
$BTC 10,000 BTC. Una subasta de $50. Cero ofertas.
Dieciséis años atrás, alguien supuestamente intentó vender un enorme lote de Bitcoin por solo $50.
Nadie lo quiso.
Hoy, esa misma cantidad de Bitcoin valdría cientos de millones de dólares.
Dieciséis años atrás, alguien supuestamente intentó vender un enorme lote de Bitcoin por solo $50.
Nadie lo quiso.
Hoy, esa misma cantidad de Bitcoin valdría cientos de millones de dólares.
·
--
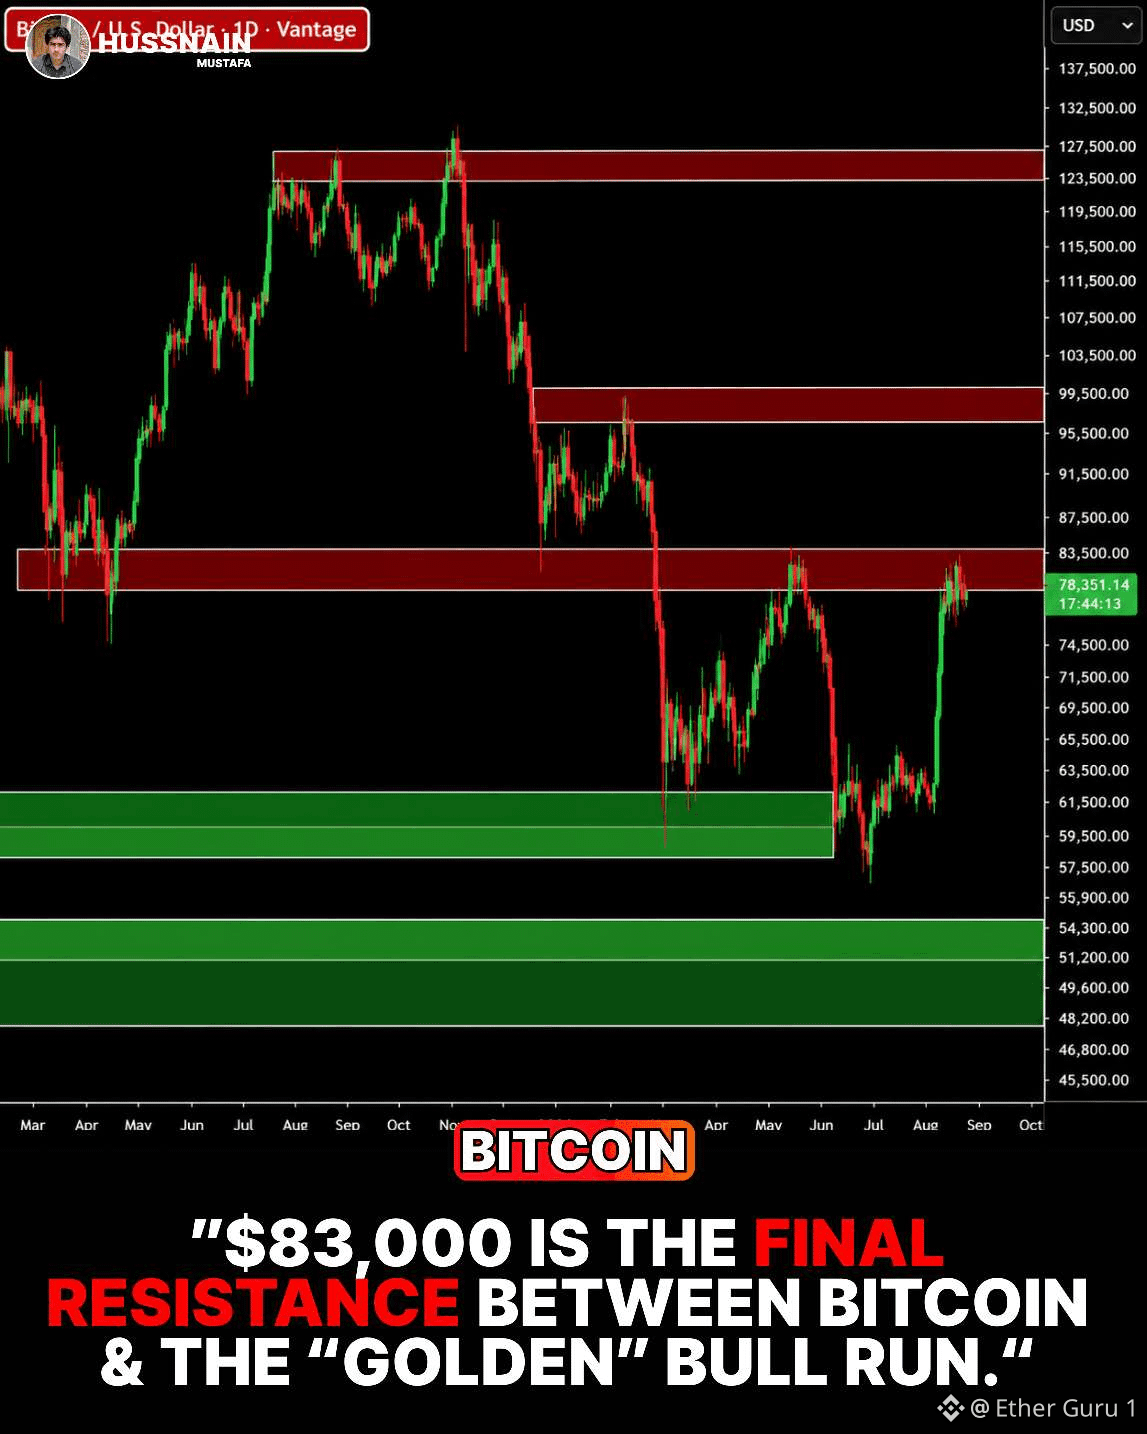
$BTC $83,000 es donde el gráfico se pone serio.
Esa zona coincide con el máximo de mayo de Bitcoin y se encuentra dentro de un área más amplia de oferta de $83K–$86K.
El panorama técnico también ha mejorado.
Bitcoin acaba de imprimir su primer cruce dorado de 50 días por encima de 200 días desde mayo de 2025.
Pero el cruce por sí solo no confirma una reversión de tendencia duradera.
Una ruptura decisiva por encima de $83K eliminaría una barrera técnica importante.
Hasta entonces, los vendedores siguen controlando la zona de resistencia más importante.
$83K sigue siendo la puerta.
$BTC $83,000 es donde el gráfico se pone serio.
Esa zona coincide con el máximo de mayo de Bitcoin y se encuentra dentro de un área más amplia de oferta de $83K–$86K.
El panorama técnico también ha mejorado.
Bitcoin acaba de imprimir su primer cruce dorado de 50 días por encima de 200 días desde mayo de 2025.
Pero el cruce por sí solo no confirma una reversión de tendencia duradera.
Una ruptura decisiva por encima de $83K eliminaría una barrera técnica importante.
Hasta entonces, los vendedores siguen controlando la zona de resistencia más importante.
$83K sigue siendo la puerta.
Esa zona coincide con el máximo de mayo de Bitcoin y se encuentra dentro de un área más amplia de oferta de $83K–$86K.
El panorama técnico también ha mejorado.
Bitcoin acaba de imprimir su primer cruce dorado de 50 días por encima de 200 días desde mayo de 2025.
Pero el cruce por sí solo no confirma una reversión de tendencia duradera.
Una ruptura decisiva por encima de $83K eliminaría una barrera técnica importante.
Hasta entonces, los vendedores siguen controlando la zona de resistencia más importante.
$83K sigue siendo la puerta.
52
·
--
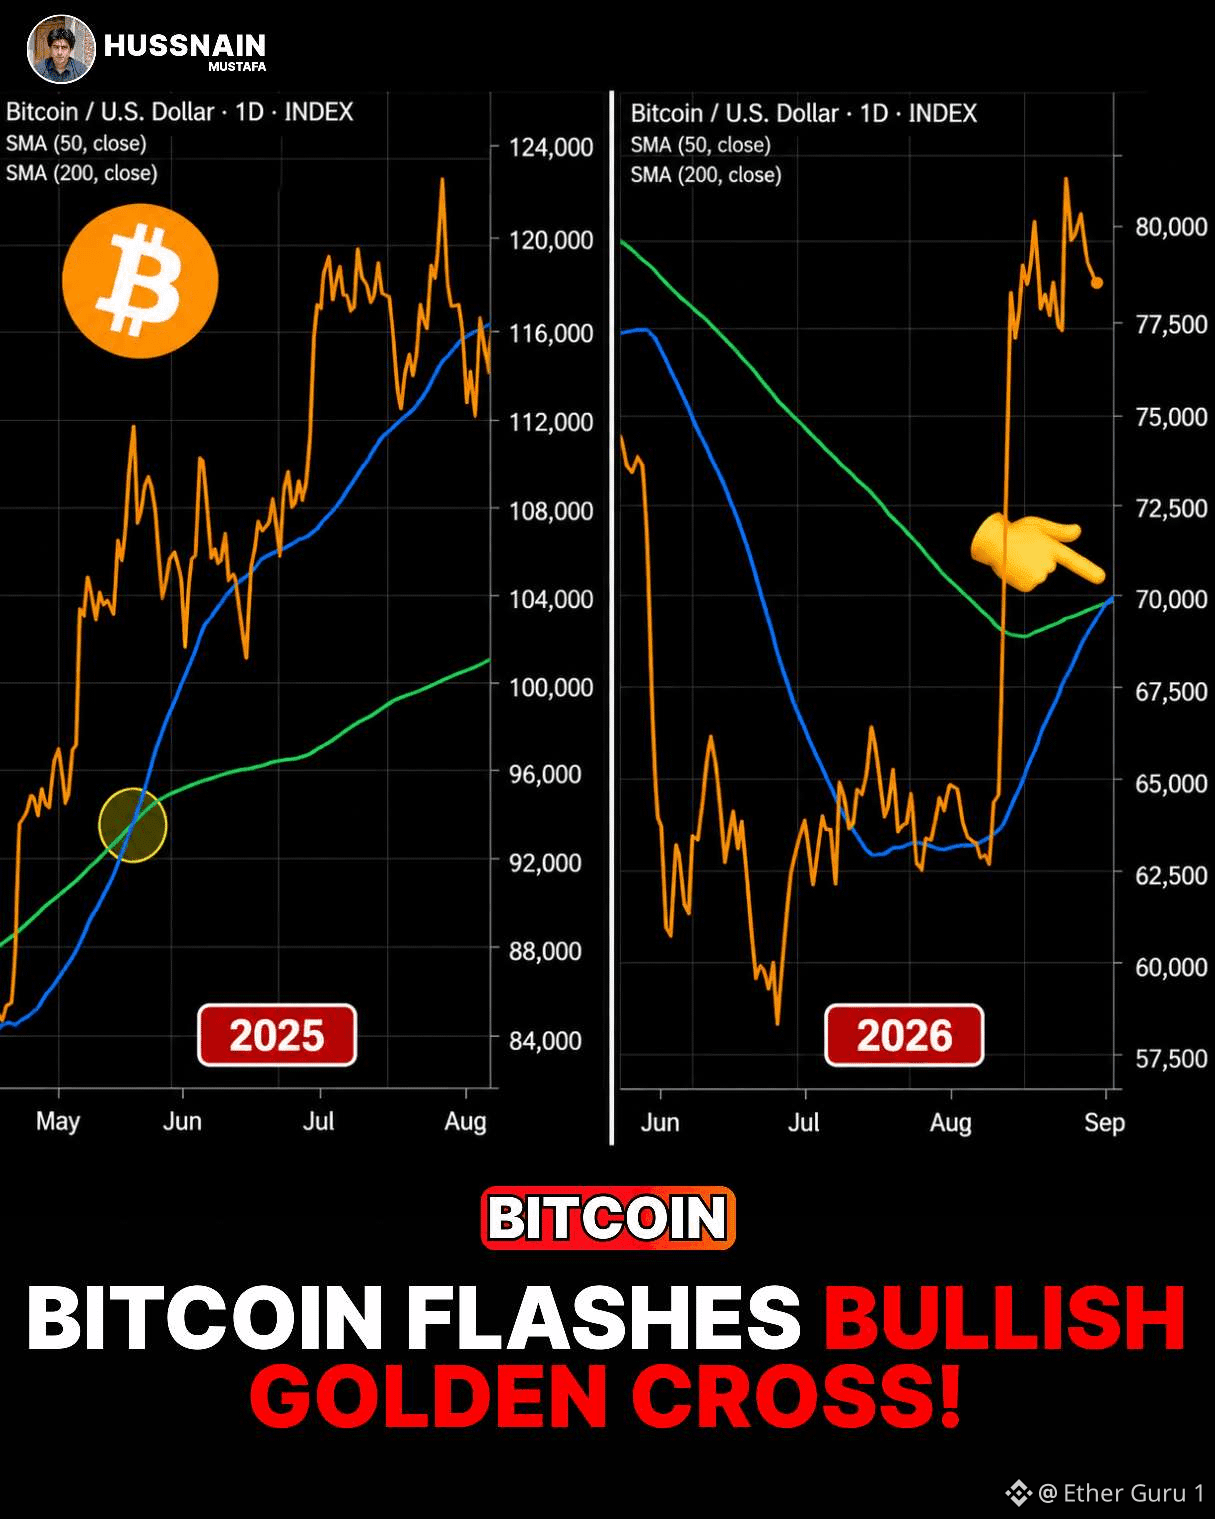
$BTC Bitcoin vuelve a mostrar un patrón de cruce dorado.
El mismo patrón técnico apareció en mayo de 2025 antes de que BTC finalmente subiera hasta su máximo histórico de $126,200.
Esta vez, el gráfico vuelve a llamar la atención sobre la relación entre las principales medias móviles de Bitcoin.
Pero la historia es una referencia, no una promesa.
Los cruces dorados pueden confirmar una mejora del impulso, pero no garantizan otra subida en línea recta. El análisis técnico reciente aún señala niveles de resistencia importantes que BTC tendría que superar.
La señal ha regresado.
Ahora el precio debe responder
$BTC Bitcoin vuelve a mostrar un patrón de cruce dorado.
El mismo patrón técnico apareció en mayo de 2025 antes de que BTC finalmente subiera hasta su máximo histórico de $126,200.
Esta vez, el gráfico vuelve a llamar la atención sobre la relación entre las principales medias móviles de Bitcoin.
Pero la historia es una referencia, no una promesa.
Los cruces dorados pueden confirmar una mejora del impulso, pero no garantizan otra subida en línea recta. El análisis técnico reciente aún señala niveles de resistencia importantes que BTC tendría que superar.
La señal ha regresado.
Ahora el precio debe responder
El mismo patrón técnico apareció en mayo de 2025 antes de que BTC finalmente subiera hasta su máximo histórico de $126,200.
Esta vez, el gráfico vuelve a llamar la atención sobre la relación entre las principales medias móviles de Bitcoin.
Pero la historia es una referencia, no una promesa.
Los cruces dorados pueden confirmar una mejora del impulso, pero no garantizan otra subida en línea recta. El análisis técnico reciente aún señala niveles de resistencia importantes que BTC tendría que superar.
La señal ha regresado.
Ahora el precio debe responder
73
·
--
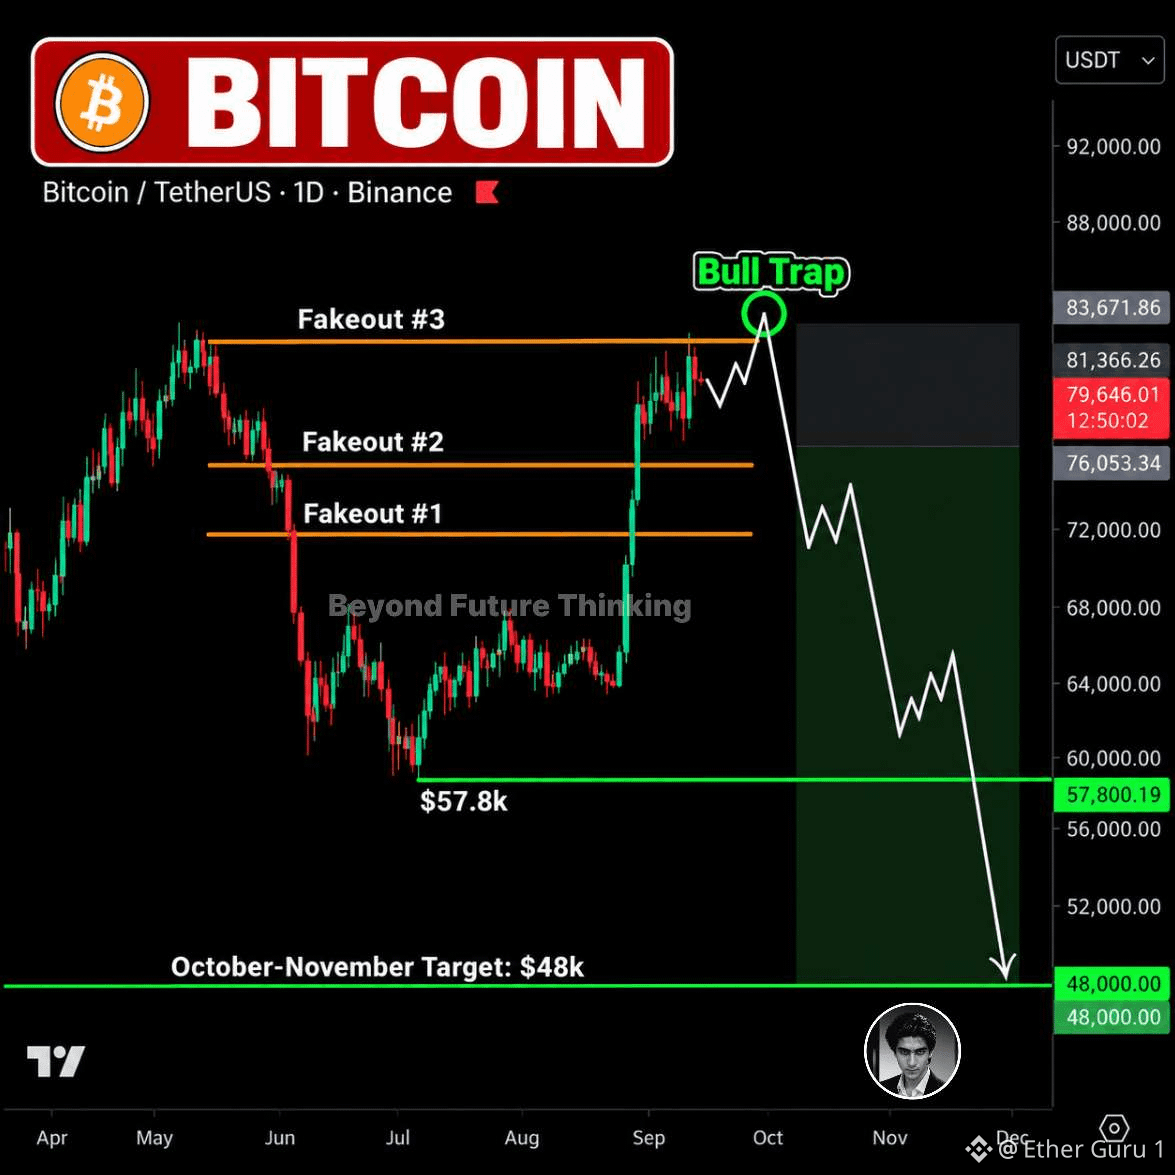
$BTC El área de $83K podría decidir el próximo gran movimiento del Bitcoin
Bitcoin recientemente volvió a acercarse a los $82K, devolviendo el sentimiento alcista al mercado.
Pero todavía hay una zona importante de liquidez alrededor de los $83K.
Eso significa que el precio podría potencialmente hacer un movimiento más al alza antes de que la dirección real quede clara.
Mi hoja de ruta actual sigue siendo:
$79K → $83K → $68K
Si el mercado pierde impulso después de ese rebote, los próximos niveles a la baja que estoy vigilando son:
$57.8K → $49K
La razón por la que no trato el último rebote como una recuperación confirmada es simple.
Un movimiento brusco hacia arriba puede atraer a nuevos compradores al mercado, especialmente después de semanas de miedo y ventas intensas.
Esa liquidez cerca de los $83K podría convertirse en un área importante para la próxima gran reacción.
Si el Bitcoin es rechazado allí, la estructura a la baja podría volver rápidamente al foco.
He estado vigilando estos niveles clave durante todo el ciclo, incluidos los movimientos de $98K → $60K y $83K → $57K.
Eso no significa que cada futura señal esté garantizada.
Pero la acción del precio, la liquidez y los niveles clave aún importan más que la emoción.
Los próximos movimientos podrían revelar si esto fue una recuperación genuina — o simplemente otra trampa antes de una caída más profunda.
$83K es la línea.
$BTC El área de $83K podría decidir el próximo gran movimiento del Bitcoin
Bitcoin recientemente volvió a acercarse a los $82K, devolviendo el sentimiento alcista al mercado.
Pero todavía hay una zona importante de liquidez alrededor de los $83K.
Eso significa que el precio podría potencialmente hacer un movimiento más al alza antes de que la dirección real quede clara.
Mi hoja de ruta actual sigue siendo:
$79K → $83K → $68K
Si el mercado pierde impulso después de ese rebote, los próximos niveles a la baja que estoy vigilando son:
$57.8K → $49K
La razón por la que no trato el último rebote como una recuperación confirmada es simple.
Un movimiento brusco hacia arriba puede atraer a nuevos compradores al mercado, especialmente después de semanas de miedo y ventas intensas.
Esa liquidez cerca de los $83K podría convertirse en un área importante para la próxima gran reacción.
Si el Bitcoin es rechazado allí, la estructura a la baja podría volver rápidamente al foco.
He estado vigilando estos niveles clave durante todo el ciclo, incluidos los movimientos de $98K → $60K y $83K → $57K.
Eso no significa que cada futura señal esté garantizada.
Pero la acción del precio, la liquidez y los niveles clave aún importan más que la emoción.
Los próximos movimientos podrían revelar si esto fue una recuperación genuina — o simplemente otra trampa antes de una caída más profunda.
$83K es la línea.
Bitcoin recientemente volvió a acercarse a los $82K, devolviendo el sentimiento alcista al mercado.
Pero todavía hay una zona importante de liquidez alrededor de los $83K.
Eso significa que el precio podría potencialmente hacer un movimiento más al alza antes de que la dirección real quede clara.
Mi hoja de ruta actual sigue siendo:
$79K → $83K → $68K
Si el mercado pierde impulso después de ese rebote, los próximos niveles a la baja que estoy vigilando son:
$57.8K → $49K
La razón por la que no trato el último rebote como una recuperación confirmada es simple.
Un movimiento brusco hacia arriba puede atraer a nuevos compradores al mercado, especialmente después de semanas de miedo y ventas intensas.
Esa liquidez cerca de los $83K podría convertirse en un área importante para la próxima gran reacción.
Si el Bitcoin es rechazado allí, la estructura a la baja podría volver rápidamente al foco.
He estado vigilando estos niveles clave durante todo el ciclo, incluidos los movimientos de $98K → $60K y $83K → $57K.
Eso no significa que cada futura señal esté garantizada.
Pero la acción del precio, la liquidez y los niveles clave aún importan más que la emoción.
Los próximos movimientos podrían revelar si esto fue una recuperación genuina — o simplemente otra trampa antes de una caída más profunda.
$83K es la línea.
134
·
--
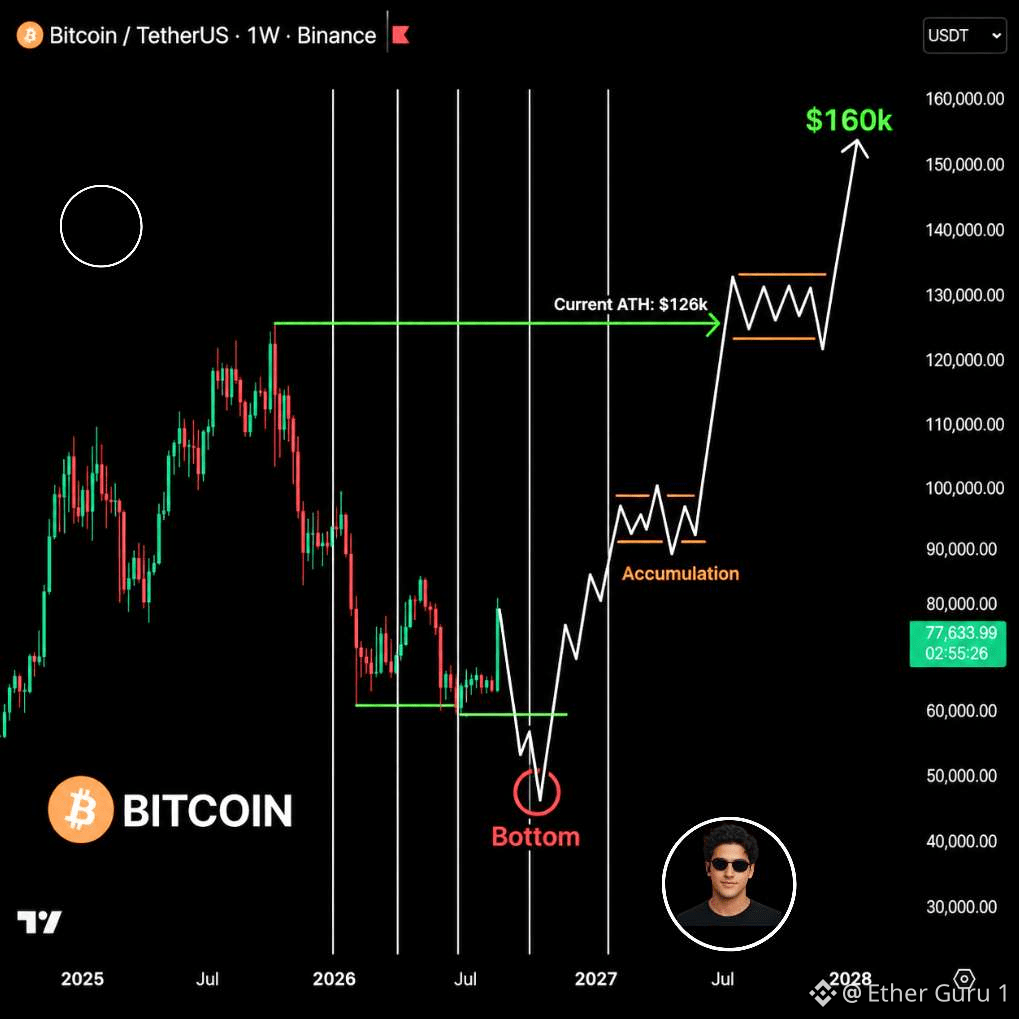
$BTC 🚨 EL REAJUSTE MACRO DE 2026–27
El 3T de 2026 podría convertirse en una gran prueba para los activos de riesgo si la política monetaria y el sentimiento cripto se debilitan al mismo tiempo.
BTC: fase de posible suelo
SPX: escenario de caída de ~7,3K
Un nuevo ciclo de liderazgo en la Fed podría reconfigurar las expectativas sobre tipos, liquidez y condiciones financieras.
El primer recorte de tipos no significaría automáticamente un mercado alcista.
Si aumentan los temores a una recesión, los mercados podrían interpretar inicialmente el relajamiento como una respuesta a la debilidad económica.
Sentimiento cripto: escenario de miedo extremo
El 4T podría traer un escenario diferente si Bitcoin recupera resistencias importantes y la demanda institucional se fortalece.
BTC: por encima de $84K
La claridad regulatoria podría convertirse en otro catalizador si la Ley CLARITY finalmente se convierte en ley.
La infraestructura de IA y la adopción cripto también podrían crear nuevas narrativas para la rotación de capital.
Escenario BTC 2027: $160K+
Tres recortes de la Fed representarían un cambio significativo en las condiciones monetarias si la debilidad económica se vuelve pronunciada.
Bitcoin podría empezar a considerarse cada vez más junto con otros activos escasos durante periodos de incertidumbre monetaria.
Pero el camino no será lineal.
Un retorno de 2x en 12 meses requeriría que Bitcoin alcance aproximadamente el doble del nivel de entrada del 3T.
Eso sigue siendo un escenario, no un resultado garantizado.
Las oportunidades más fuertes a menudo aparecen cuando el sentimiento es más débil.
El miedo crea el escenario.
La liquidez decide el momento.
$BTC 🚨 EL REAJUSTE MACRO DE 2026–27
El 3T de 2026 podría convertirse en una gran prueba para los activos de riesgo si la política monetaria y el sentimiento cripto se debilitan al mismo tiempo.
BTC: fase de posible suelo
SPX: escenario de caída de ~7,3K
Un nuevo ciclo de liderazgo en la Fed podría reconfigurar las expectativas sobre tipos, liquidez y condiciones financieras.
El primer recorte de tipos no significaría automáticamente un mercado alcista.
Si aumentan los temores a una recesión, los mercados podrían interpretar inicialmente el relajamiento como una respuesta a la debilidad económica.
Sentimiento cripto: escenario de miedo extremo
El 4T podría traer un escenario diferente si Bitcoin recupera resistencias importantes y la demanda institucional se fortalece.
BTC: por encima de $84K
La claridad regulatoria podría convertirse en otro catalizador si la Ley CLARITY finalmente se convierte en ley.
La infraestructura de IA y la adopción cripto también podrían crear nuevas narrativas para la rotación de capital.
Escenario BTC 2027: $160K+
Tres recortes de la Fed representarían un cambio significativo en las condiciones monetarias si la debilidad económica se vuelve pronunciada.
Bitcoin podría empezar a considerarse cada vez más junto con otros activos escasos durante periodos de incertidumbre monetaria.
Pero el camino no será lineal.
Un retorno de 2x en 12 meses requeriría que Bitcoin alcance aproximadamente el doble del nivel de entrada del 3T.
Eso sigue siendo un escenario, no un resultado garantizado.
Las oportunidades más fuertes a menudo aparecen cuando el sentimiento es más débil.
El miedo crea el escenario.
La liquidez decide el momento.
El 3T de 2026 podría convertirse en una gran prueba para los activos de riesgo si la política monetaria y el sentimiento cripto se debilitan al mismo tiempo.
BTC: fase de posible suelo
SPX: escenario de caída de ~7,3K
Un nuevo ciclo de liderazgo en la Fed podría reconfigurar las expectativas sobre tipos, liquidez y condiciones financieras.
El primer recorte de tipos no significaría automáticamente un mercado alcista.
Si aumentan los temores a una recesión, los mercados podrían interpretar inicialmente el relajamiento como una respuesta a la debilidad económica.
Sentimiento cripto: escenario de miedo extremo
El 4T podría traer un escenario diferente si Bitcoin recupera resistencias importantes y la demanda institucional se fortalece.
BTC: por encima de $84K
La claridad regulatoria podría convertirse en otro catalizador si la Ley CLARITY finalmente se convierte en ley.
La infraestructura de IA y la adopción cripto también podrían crear nuevas narrativas para la rotación de capital.
Escenario BTC 2027: $160K+
Tres recortes de la Fed representarían un cambio significativo en las condiciones monetarias si la debilidad económica se vuelve pronunciada.
Bitcoin podría empezar a considerarse cada vez más junto con otros activos escasos durante periodos de incertidumbre monetaria.
Pero el camino no será lineal.
Un retorno de 2x en 12 meses requeriría que Bitcoin alcance aproximadamente el doble del nivel de entrada del 3T.
Eso sigue siendo un escenario, no un resultado garantizado.
Las oportunidades más fuertes a menudo aparecen cuando el sentimiento es más débil.
El miedo crea el escenario.
La liquidez decide el momento.
118
·
--
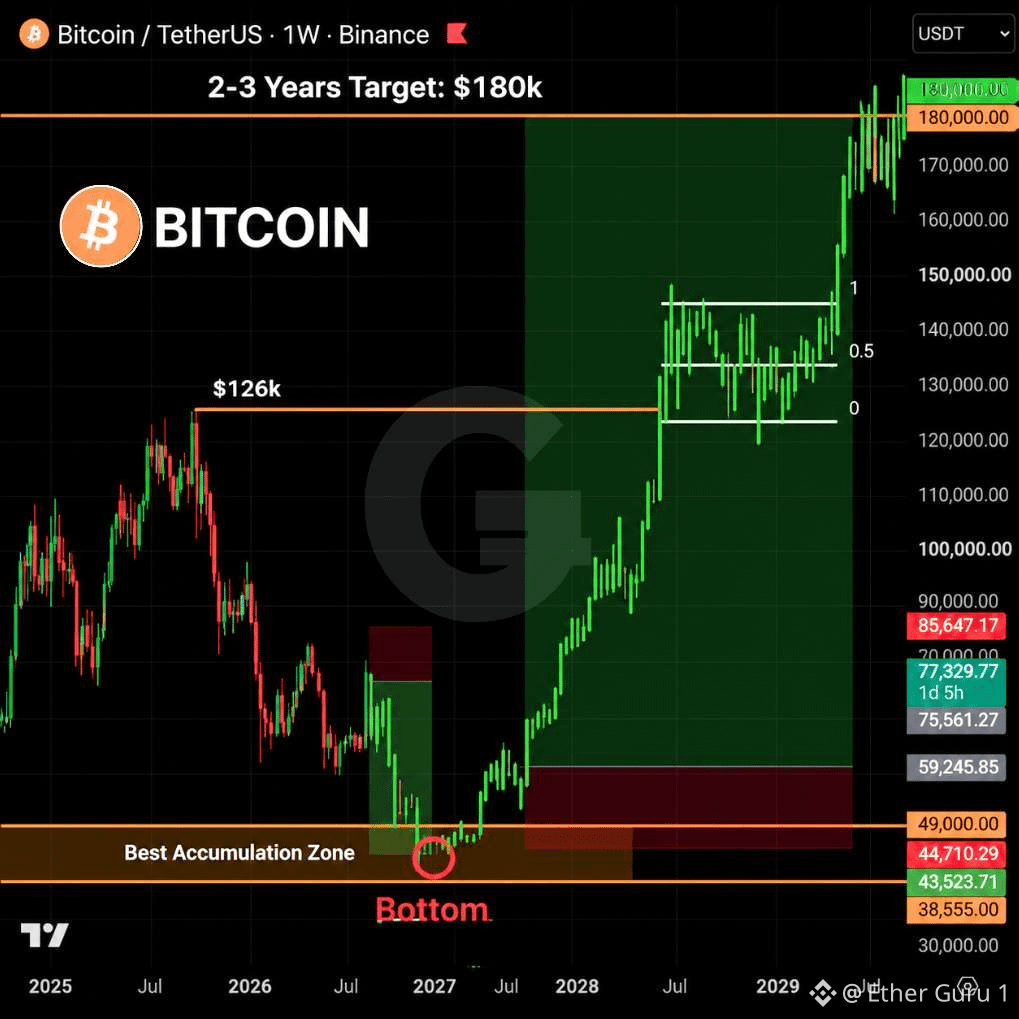
$BTC $BTC ROADMAP 🧭
El estado actual de Bitcoin se está mapeando a partir de un punto de inicio de $77K.
La proyección en caso bajista apunta a $39K–$49K para una posible zona de mínimo del ciclo.
Eso representaría una caída posible del 36%–49% desde $77K.
Luego, el caso alcista a largo plazo apunta a $180K en los próximos 2–3 años.
Desde un punto medio de $45K, $180K requeriría un crecimiento de aproximadamente 4×.
Este es un escenario técnico: la zona de $39K–$49K no es un mínimo confirmado.
La estrategia es observar el miedo, la liquidez y la estructura antes de tratar la zona como una oportunidad de acumulación.
$BTC $BTC ROADMAP 🧭
El estado actual de Bitcoin se está mapeando a partir de un punto de inicio de $77K.
La proyección en caso bajista apunta a $39K–$49K para una posible zona de mínimo del ciclo.
Eso representaría una caída posible del 36%–49% desde $77K.
Luego, el caso alcista a largo plazo apunta a $180K en los próximos 2–3 años.
Desde un punto medio de $45K, $180K requeriría un crecimiento de aproximadamente 4×.
Este es un escenario técnico: la zona de $39K–$49K no es un mínimo confirmado.
La estrategia es observar el miedo, la liquidez y la estructura antes de tratar la zona como una oportunidad de acumulación.
El estado actual de Bitcoin se está mapeando a partir de un punto de inicio de $77K.
La proyección en caso bajista apunta a $39K–$49K para una posible zona de mínimo del ciclo.
Eso representaría una caída posible del 36%–49% desde $77K.
Luego, el caso alcista a largo plazo apunta a $180K en los próximos 2–3 años.
Desde un punto medio de $45K, $180K requeriría un crecimiento de aproximadamente 4×.
Este es un escenario técnico: la zona de $39K–$49K no es un mínimo confirmado.
La estrategia es observar el miedo, la liquidez y la estructura antes de tratar la zona como una oportunidad de acumulación.
91
·
--
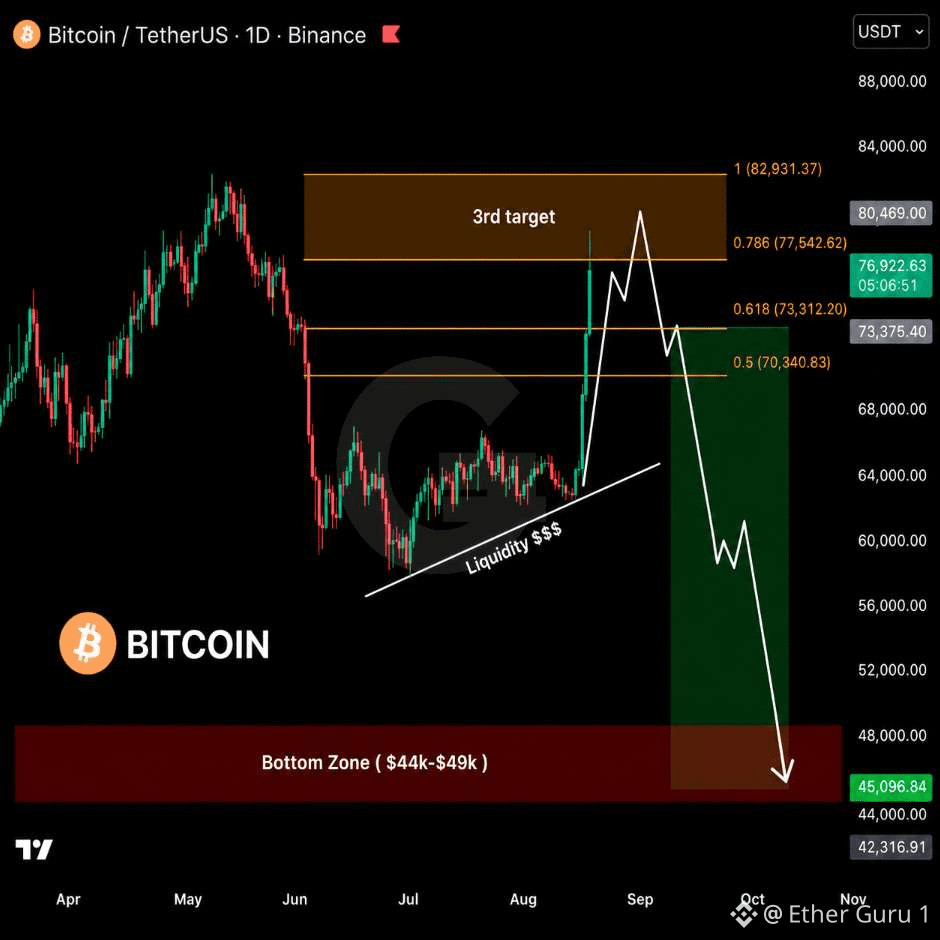
$BTC FLIP TÁCTICO 🧭
Todos Los Anteriores Objetivos De Long De $BTC Ya Han Sido Alcanzados — La Estrategia Ahora Se Ha Desplazado Hacia Un Posible Setup De Short.
Zona Long $52K–$63K: HECHO ✅
Ruptura Estructural Bajista 1H/4H: HECHO ✅
Zona Fibonacci 0.618–0.786: HECHO ✅
Formación De Bull Trap: HECHO ✅
Siguiente Disparador: Construir Shorts Solo Después De La Confirmación De La Estructura Bajista.
El Roadmap A La Baja Apunta A Un Barrido De Liquidez Por Debajo De $57K.
Escenario De Flush Final: $42K–$49K.
BTC Completó Todo El Roadmap Del Lado Long En Solo 2 Días, Acelerado Por Fuertes Liquidaciones De Shorts.
El Último Impulso De BTC También Ha Activado Grandes Rupturas En Varios Altcoins.
La Estrategia Ahora Depende De Si BTC Imprime Un Máximo Más Bajo Confirmado + Una Estructura Bajista Antes Del Próximo Movimiento.
$BTC FLIP TÁCTICO 🧭
Todos Los Anteriores Objetivos De Long De $BTC Ya Han Sido Alcanzados — La Estrategia Ahora Se Ha Desplazado Hacia Un Posible Setup De Short.
Zona Long $52K–$63K: HECHO ✅
Ruptura Estructural Bajista 1H/4H: HECHO ✅
Zona Fibonacci 0.618–0.786: HECHO ✅
Formación De Bull Trap: HECHO ✅
Siguiente Disparador: Construir Shorts Solo Después De La Confirmación De La Estructura Bajista.
El Roadmap A La Baja Apunta A Un Barrido De Liquidez Por Debajo De $57K.
Escenario De Flush Final: $42K–$49K.
BTC Completó Todo El Roadmap Del Lado Long En Solo 2 Días, Acelerado Por Fuertes Liquidaciones De Shorts.
El Último Impulso De BTC También Ha Activado Grandes Rupturas En Varios Altcoins.
La Estrategia Ahora Depende De Si BTC Imprime Un Máximo Más Bajo Confirmado + Una Estructura Bajista Antes Del Próximo Movimiento.
Todos Los Anteriores Objetivos De Long De $BTC Ya Han Sido Alcanzados — La Estrategia Ahora Se Ha Desplazado Hacia Un Posible Setup De Short.
Zona Long $52K–$63K: HECHO ✅
Ruptura Estructural Bajista 1H/4H: HECHO ✅
Zona Fibonacci 0.618–0.786: HECHO ✅
Formación De Bull Trap: HECHO ✅
Siguiente Disparador: Construir Shorts Solo Después De La Confirmación De La Estructura Bajista.
El Roadmap A La Baja Apunta A Un Barrido De Liquidez Por Debajo De $57K.
Escenario De Flush Final: $42K–$49K.
BTC Completó Todo El Roadmap Del Lado Long En Solo 2 Días, Acelerado Por Fuertes Liquidaciones De Shorts.
El Último Impulso De BTC También Ha Activado Grandes Rupturas En Varios Altcoins.
La Estrategia Ahora Depende De Si BTC Imprime Un Máximo Más Bajo Confirmado + Una Estructura Bajista Antes Del Próximo Movimiento.
64
·
--
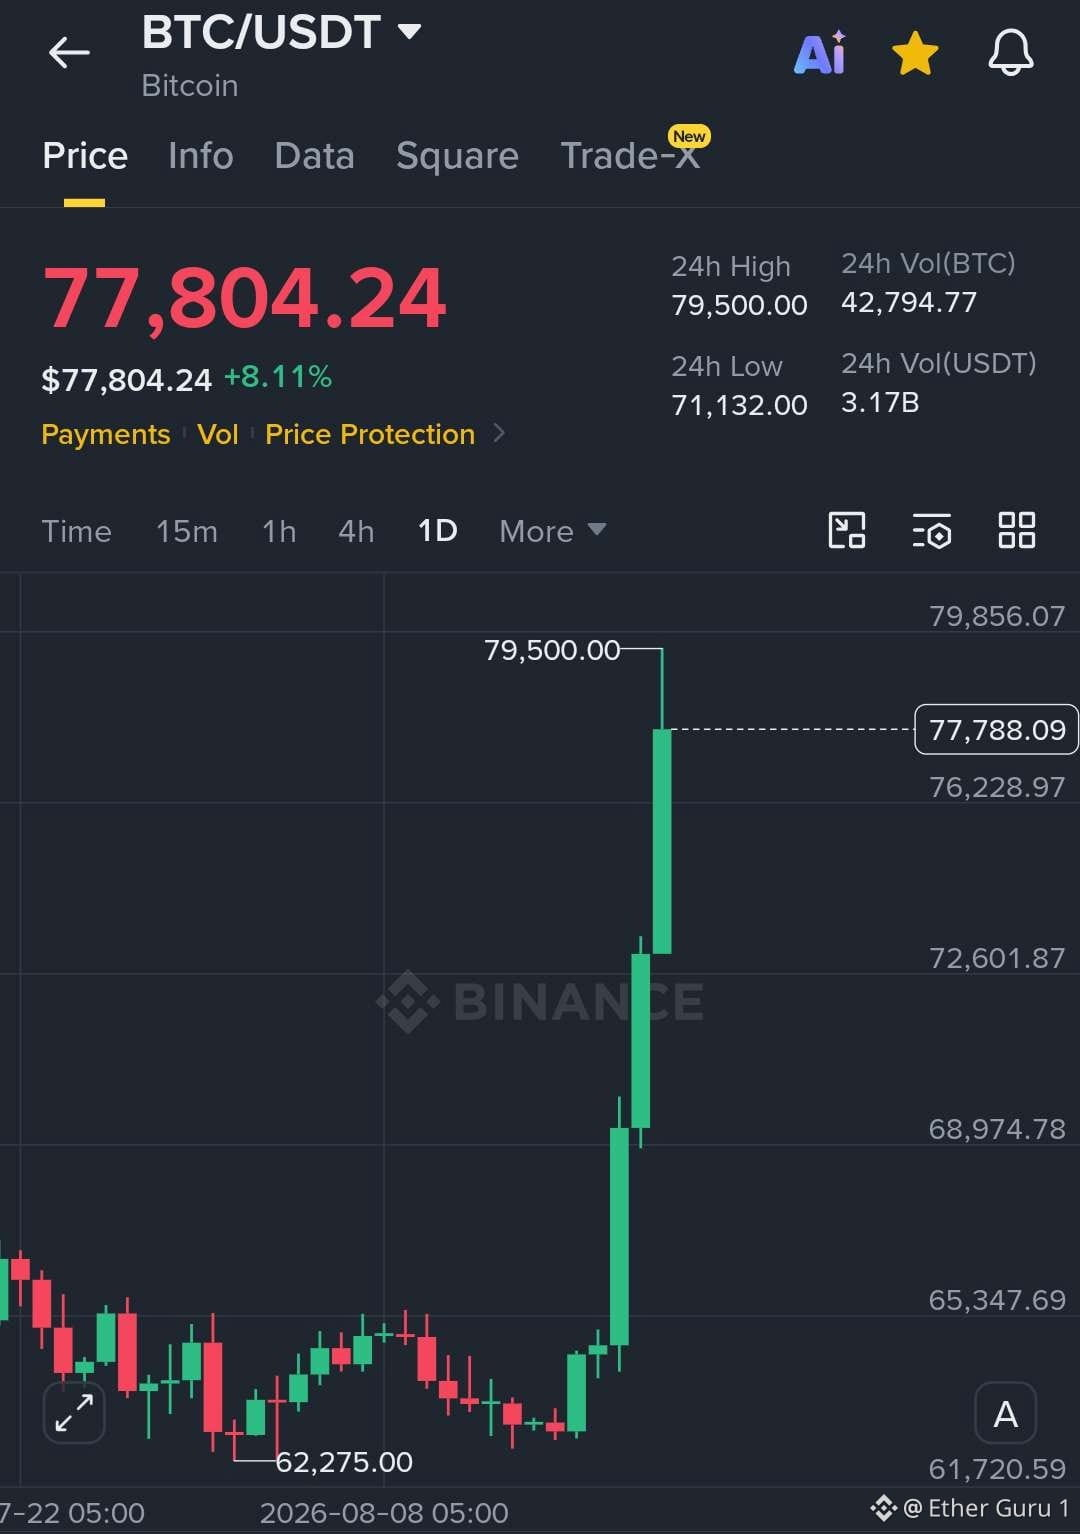
$BTC ENTRA EN NOTICIAS 🚀
Bitcoin Acaba De Tocar $78,000 Por Primera Vez En Casi Tres Meses.
El BTC Ha Subido Aproximadamente Un 24% Desde La Zona De $63K En Solo Unos Días.
El Movimiento Ha Forzado El Cierre De Miles De Millones De Dólares En Posiciones Cortas Apalancadas.
Un Short Squeeze Puede Acelerar Las Alzas De Precio Ya Que Los Cortos Liquidados Se Ven Forzados A Comprar BTC De Nuevo.
Llamarlo “El Mayor Short Squeeze De La Historia” Requeriría Una Comparación Con Un Récord Verificado.
Pero La Velocidad De Este Movimiento Está Claramente Reconfigurando La Posición Del Mercado Cripto.
$BTC ENTRA EN NOTICIAS 🚀
Bitcoin Acaba De Tocar $78,000 Por Primera Vez En Casi Tres Meses.
El BTC Ha Subido Aproximadamente Un 24% Desde La Zona De $63K En Solo Unos Días.
El Movimiento Ha Forzado El Cierre De Miles De Millones De Dólares En Posiciones Cortas Apalancadas.
Un Short Squeeze Puede Acelerar Las Alzas De Precio Ya Que Los Cortos Liquidados Se Ven Forzados A Comprar BTC De Nuevo.
Llamarlo “El Mayor Short Squeeze De La Historia” Requeriría Una Comparación Con Un Récord Verificado.
Pero La Velocidad De Este Movimiento Está Claramente Reconfigurando La Posición Del Mercado Cripto.
Bitcoin Acaba De Tocar $78,000 Por Primera Vez En Casi Tres Meses.
El BTC Ha Subido Aproximadamente Un 24% Desde La Zona De $63K En Solo Unos Días.
El Movimiento Ha Forzado El Cierre De Miles De Millones De Dólares En Posiciones Cortas Apalancadas.
Un Short Squeeze Puede Acelerar Las Alzas De Precio Ya Que Los Cortos Liquidados Se Ven Forzados A Comprar BTC De Nuevo.
Llamarlo “El Mayor Short Squeeze De La Historia” Requeriría Una Comparación Con Un Récord Verificado.
Pero La Velocidad De Este Movimiento Está Claramente Reconfigurando La Posición Del Mercado Cripto.
69
Inicia sesión para explorar más contenidos
Únete a usuarios globales de criptomonedas en Binance Square
⚡️ Obtén información útil y actualizada sobre criptos.
💬 Avalado por el mayor exchange de criptomonedas en el mundo.
👍 Descubre perspectivas reales de creadores verificados.
Email/número de teléfono
Temas populares
EarningsSeason
26,963 vistas
194 están debatiendo
Temporada de Resultados: Ganancias del 4T de Micron — ¿Alcista o Bajista?
Binance Square Official
·18 me gusta
·2.1k vistas
BitgetHackerFailsToMoveStolenFunds
1,775 vistas
116 están debatiendo
BitMineETHHoldingsTop6Million
5,075 vistas
270 están debatiendo