

Selma Kacvinsky BiXr
200 Publicaciones

Selma Kacvinsky BiXr
Denunciar
Bloquear usuario
Quero ajudar o mundo a colher os frutos das criptomoedas! Fazer com que todos passem a adotar o mundo cripto!
26 Siguiendo
715 Seguidores
644 Me gusta
Publicaciones
Todo
Citas
PINNED
·
--
Alcista
$AEVO Si acabas de ingresar al mundo criptográfico y tus intenciones son ser un ganador. Hoy con 1 dólar, comprarías AEVO en un segundo momento esta cripto por valor de $2.96, estarías comprando 0.33783783 de AEVO; Al venderlo a una vela alta de $3,45, obtendrías una ganancia de 16 centavos, ¡lo que te dejaría con $1,165 dólares!
¡Lo que quiero mostrarte con esto es que con 1 dólar no te harás rico en un día! Pero si realiza operaciones comerciales básicas, tendrá una cantidad razonable con solo 1 dólar.
Si eres novato, crees que comprar una criptomoneda vale 0,00000001 billonésimas de centavo; ¡te harás rico! ¡No lo será, ya que las posibilidades son mínimas!
$AEVO Si acabas de ingresar al mundo criptográfico y tus intenciones son ser un ganador. Hoy con 1 dólar, comprarías AEVO en un segundo momento esta cripto por valor de $2.96, estarías comprando 0.33783783 de AEVO; Al venderlo a una vela alta de $3,45, obtendrías una ganancia de 16 centavos, ¡lo que te dejaría con $1,165 dólares!
¡Lo que quiero mostrarte con esto es que con 1 dólar no te harás rico en un día! Pero si realiza operaciones comerciales básicas, tendrá una cantidad razonable con solo 1 dólar.
Si eres novato, crees que comprar una criptomoneda vale 0,00000001 billonésimas de centavo; ¡te harás rico! ¡No lo será, ya que las posibilidades son mínimas!
¡Lo que quiero mostrarte con esto es que con 1 dólar no te harás rico en un día! Pero si realiza operaciones comerciales básicas, tendrá una cantidad razonable con solo 1 dólar.
Si eres novato, crees que comprar una criptomoneda vale 0,00000001 billonésimas de centavo; ¡te harás rico! ¡No lo será, ya que las posibilidades son mínimas!
69
73
207.1k
PINNED
·
--
Bajista
$BTC $ETH $XRP Ahora mismo la mayoría de las criptos tienen una caída importante, a pesar de estar en alza. Motivo: los mismos de siempre, ¡las ballenas! Cuando se llega al final de la semana, hacia el fin de semana las ballenas venden y mueven parte de sus criptomonedas para sacar un poco de ganancia y pagar sus cuentas.
Las sardinas sienten más cada gran movimiento descendente. Compre en la parte inferior y venda en la parte superior de la vela.
Compre criptomonedas en las velas más bajas y verá grandes ganancias en las velas más altas.
Trate las criptomonedas hoy como acciones, en eso se están convirtiendo. ¡Esto de pensar que la criptomoneda elegida solo subirá y llegará a la luna 🌙, es más un mito que un hecho!
$BTC $ETH $XRP Ahora mismo la mayoría de las criptos tienen una caída importante, a pesar de estar en alza. Motivo: los mismos de siempre, ¡las ballenas! Cuando se llega al final de la semana, hacia el fin de semana las ballenas venden y mueven parte de sus criptomonedas para sacar un poco de ganancia y pagar sus cuentas.
Las sardinas sienten más cada gran movimiento descendente. Compre en la parte inferior y venda en la parte superior de la vela.
Compre criptomonedas en las velas más bajas y verá grandes ganancias en las velas más altas.
Trate las criptomonedas hoy como acciones, en eso se están convirtiendo. ¡Esto de pensar que la criptomoneda elegida solo subirá y llegará a la luna 🌙, es más un mito que un hecho!
Las sardinas sienten más cada gran movimiento descendente. Compre en la parte inferior y venda en la parte superior de la vela.
Compre criptomonedas en las velas más bajas y verá grandes ganancias en las velas más altas.
Trate las criptomonedas hoy como acciones, en eso se están convirtiendo. ¡Esto de pensar que la criptomoneda elegida solo subirá y llegará a la luna 🌙, es más un mito que un hecho!
22
53
56.5k
Verificado
$MOVR Catalizador de migración del token (Alto): La ventana de migración de Moonriver a la red Base se cerró el 30 de septiembre → desencadenó cambios estructurales en la demanda del mercado secundario y acumulación especulativa.
Los principales tenedores ampliaron sus saldos en más de un 11% a finales de septiembre, impulsando el impulso de compra.
Ruptura del impulso alcista (Medio): El volumen se expandió hasta más de 23 millones de dólares, mientras el precio cotizaba por encima de la EMA-7 (2,77 USD) y de la EMA-25 (2,30 USD) → sostuvo una fuerte tendencia alcista.
Expiración de la liquidez de la migración (Alto): Tras el vencimiento del plazo, las restricciones de liquidez en diversas casas de cambio centralizadas representan riesgos inmediatos de bloqueo y reducción de liquidez para los tenedores antiguos.
Impulso sobrecomprado (Medio): El RSI de 6 horas en 75,5 y el RSI de 12 horas en 75,3 señalan condiciones de recalentamiento → aumenta la probabilidad de una reversión brusca hacia la media.
$MOVR Catalizador de migración del token (Alto): La ventana de migración de Moonriver a la red Base se cerró el 30 de septiembre → desencadenó cambios estructurales en la demanda del mercado secundario y acumulación especulativa.
Los principales tenedores ampliaron sus saldos en más de un 11% a finales de septiembre, impulsando el impulso de compra.
Ruptura del impulso alcista (Medio): El volumen se expandió hasta más de 23 millones de dólares, mientras el precio cotizaba por encima de la EMA-7 (2,77 USD) y de la EMA-25 (2,30 USD) → sostuvo una fuerte tendencia alcista.
Expiración de la liquidez de la migración (Alto): Tras el vencimiento del plazo, las restricciones de liquidez en diversas casas de cambio centralizadas representan riesgos inmediatos de bloqueo y reducción de liquidez para los tenedores antiguos.
Impulso sobrecomprado (Medio): El RSI de 6 horas en 75,5 y el RSI de 12 horas en 75,3 señalan condiciones de recalentamiento → aumenta la probabilidad de una reversión brusca hacia la media.
Los principales tenedores ampliaron sus saldos en más de un 11% a finales de septiembre, impulsando el impulso de compra.
Ruptura del impulso alcista (Medio): El volumen se expandió hasta más de 23 millones de dólares, mientras el precio cotizaba por encima de la EMA-7 (2,77 USD) y de la EMA-25 (2,30 USD) → sostuvo una fuerte tendencia alcista.
Expiración de la liquidez de la migración (Alto): Tras el vencimiento del plazo, las restricciones de liquidez en diversas casas de cambio centralizadas representan riesgos inmediatos de bloqueo y reducción de liquidez para los tenedores antiguos.
Impulso sobrecomprado (Medio): El RSI de 6 horas en 75,5 y el RSI de 12 horas en 75,3 señalan condiciones de recalentamiento → aumenta la probabilidad de una reversión brusca hacia la media.
2
593
¿Qué mantiene el $BTC em alto después de las peores noticias!
Tesla impulsa el mercado de criptomonedas principalmente a través de su estrategia de reserva de tesorería a largo plazo (HODL), de la fuerte influencia de su CEO, Elon Musk, y del impacto de sus reportes financieros en la percepción institucional.
El impacto actual de Tesla en el mercado cripto se sostiene sobre tres pilares:
📌 1. Estrategia de "HODL" Institucional
Tesla mantiene un saldo estático de 11.509 Bitcoins (BTC) en su balance. Incluso ante fuertes oscilaciones del mercado, la empresa optó por no vender ninguna moneda.
* Resiliencia Contable: La postura de Tesla sirve como una valiosa señal de confianza para el mercado institucional. Muestra que las grandes corporaciones ven la criptomoneda como una reserva de valor a largo plazo, y no solo como un activo especulativo de corto plazo.
📊 2. Impacto en los Balances Trimestrales
Los resultados financieros de Tesla generan mucha volatilidad y funcionan como termómetro para el mercado cripto.
* Reglas Contables: Con la adopción de nuevas directrices contables (como la valoración a mercado), las ganancias y pérdidas no realizadas de Tesla con el Bitcoin impactan directamente los balances publicados en cada trimestre. El mercado cripto sigue de cerca estas divulgaciones, ya que cualquier comentario o señalización de la directiva puede redefinir el sentimiento de los inversores en pocas horas.
💡 3. Aceptación de Activos y el Efecto Elon Musk
Históricamente, las decisiones comerciales y los posicionamientos públicos de Elon Musk marcan tendencias en el sector: [9, 10]
Tesla impulsa el uso práctico de las memecoins al permitir que los productos y mercancías (merchandise) de su tienda oficial se adquieran utilizando $DOGE Dogecoin.
* Efecto en los Medios: Cualquier mención de Musk o actualizaciones en plataformas de medios activan algoritmos de negociación rápida, elevando temporalmente los volúmenes de transacción y los precios.
¿Qué mantiene el $BTC em alto después de las peores noticias!
Tesla impulsa el mercado de criptomonedas principalmente a través de su estrategia de reserva de tesorería a largo plazo (HODL), de la fuerte influencia de su CEO, Elon Musk, y del impacto de sus reportes financieros en la percepción institucional.
El impacto actual de Tesla en el mercado cripto se sostiene sobre tres pilares:
📌 1. Estrategia de "HODL" Institucional
Tesla mantiene un saldo estático de 11.509 Bitcoins (BTC) en su balance. Incluso ante fuertes oscilaciones del mercado, la empresa optó por no vender ninguna moneda.
* Resiliencia Contable: La postura de Tesla sirve como una valiosa señal de confianza para el mercado institucional. Muestra que las grandes corporaciones ven la criptomoneda como una reserva de valor a largo plazo, y no solo como un activo especulativo de corto plazo.
📊 2. Impacto en los Balances Trimestrales
Los resultados financieros de Tesla generan mucha volatilidad y funcionan como termómetro para el mercado cripto.
* Reglas Contables: Con la adopción de nuevas directrices contables (como la valoración a mercado), las ganancias y pérdidas no realizadas de Tesla con el Bitcoin impactan directamente los balances publicados en cada trimestre. El mercado cripto sigue de cerca estas divulgaciones, ya que cualquier comentario o señalización de la directiva puede redefinir el sentimiento de los inversores en pocas horas.
💡 3. Aceptación de Activos y el Efecto Elon Musk
Históricamente, las decisiones comerciales y los posicionamientos públicos de Elon Musk marcan tendencias en el sector: [9, 10]
Tesla impulsa el uso práctico de las memecoins al permitir que los productos y mercancías (merchandise) de su tienda oficial se adquieran utilizando $DOGE Dogecoin.
* Efecto en los Medios: Cualquier mención de Musk o actualizaciones en plataformas de medios activan algoritmos de negociación rápida, elevando temporalmente los volúmenes de transacción y los precios.
Tesla impulsa el mercado de criptomonedas principalmente a través de su estrategia de reserva de tesorería a largo plazo (HODL), de la fuerte influencia de su CEO, Elon Musk, y del impacto de sus reportes financieros en la percepción institucional.
El impacto actual de Tesla en el mercado cripto se sostiene sobre tres pilares:
📌 1. Estrategia de "HODL" Institucional
Tesla mantiene un saldo estático de 11.509 Bitcoins (BTC) en su balance. Incluso ante fuertes oscilaciones del mercado, la empresa optó por no vender ninguna moneda.
* Resiliencia Contable: La postura de Tesla sirve como una valiosa señal de confianza para el mercado institucional. Muestra que las grandes corporaciones ven la criptomoneda como una reserva de valor a largo plazo, y no solo como un activo especulativo de corto plazo.
📊 2. Impacto en los Balances Trimestrales
Los resultados financieros de Tesla generan mucha volatilidad y funcionan como termómetro para el mercado cripto.
* Reglas Contables: Con la adopción de nuevas directrices contables (como la valoración a mercado), las ganancias y pérdidas no realizadas de Tesla con el Bitcoin impactan directamente los balances publicados en cada trimestre. El mercado cripto sigue de cerca estas divulgaciones, ya que cualquier comentario o señalización de la directiva puede redefinir el sentimiento de los inversores en pocas horas.
💡 3. Aceptación de Activos y el Efecto Elon Musk
Históricamente, las decisiones comerciales y los posicionamientos públicos de Elon Musk marcan tendencias en el sector: [9, 10]
Tesla impulsa el uso práctico de las memecoins al permitir que los productos y mercancías (merchandise) de su tienda oficial se adquieran utilizando $DOGE Dogecoin.
* Efecto en los Medios: Cualquier mención de Musk o actualizaciones en plataformas de medios activan algoritmos de negociación rápida, elevando temporalmente los volúmenes de transacción y los precios.
1
458
$AR uma capa de computación de IA verificable y la introducción del token AO (36% destinados a los titulares de AR) desencadenó una demanda especulativa masiva.
Las liquidas alcanzaron su punto máximo en +US$ 2,69 millones en USDT, acompañadas de un aumento de 15 veces en el volumen, lo que impulsó una subida del 43% en el precio, llevándolo a US$ 4,42.
Momentum del Sector en Desvanecimiento (Medio): El volumen de negociación del sector de almacenamiento en general cayó 7,3%, lo que sugiere que la actual racha aislada puede carecer de un respaldo macro sostenible.
$AR uma capa de computación de IA verificable y la introducción del token AO (36% destinados a los titulares de AR) desencadenó una demanda especulativa masiva.
Las liquidas alcanzaron su punto máximo en +US$ 2,69 millones en USDT, acompañadas de un aumento de 15 veces en el volumen, lo que impulsó una subida del 43% en el precio, llevándolo a US$ 4,42.
Momentum del Sector en Desvanecimiento (Medio): El volumen de negociación del sector de almacenamiento en general cayó 7,3%, lo que sugiere que la actual racha aislada puede carecer de un respaldo macro sostenible.
Las liquidas alcanzaron su punto máximo en +US$ 2,69 millones en USDT, acompañadas de un aumento de 15 veces en el volumen, lo que impulsó una subida del 43% en el precio, llevándolo a US$ 4,42.
Momentum del Sector en Desvanecimiento (Medio): El volumen de negociación del sector de almacenamiento en general cayó 7,3%, lo que sugiere que la actual racha aislada puede carecer de un respaldo macro sostenible.
2
497
·
--
Alcista
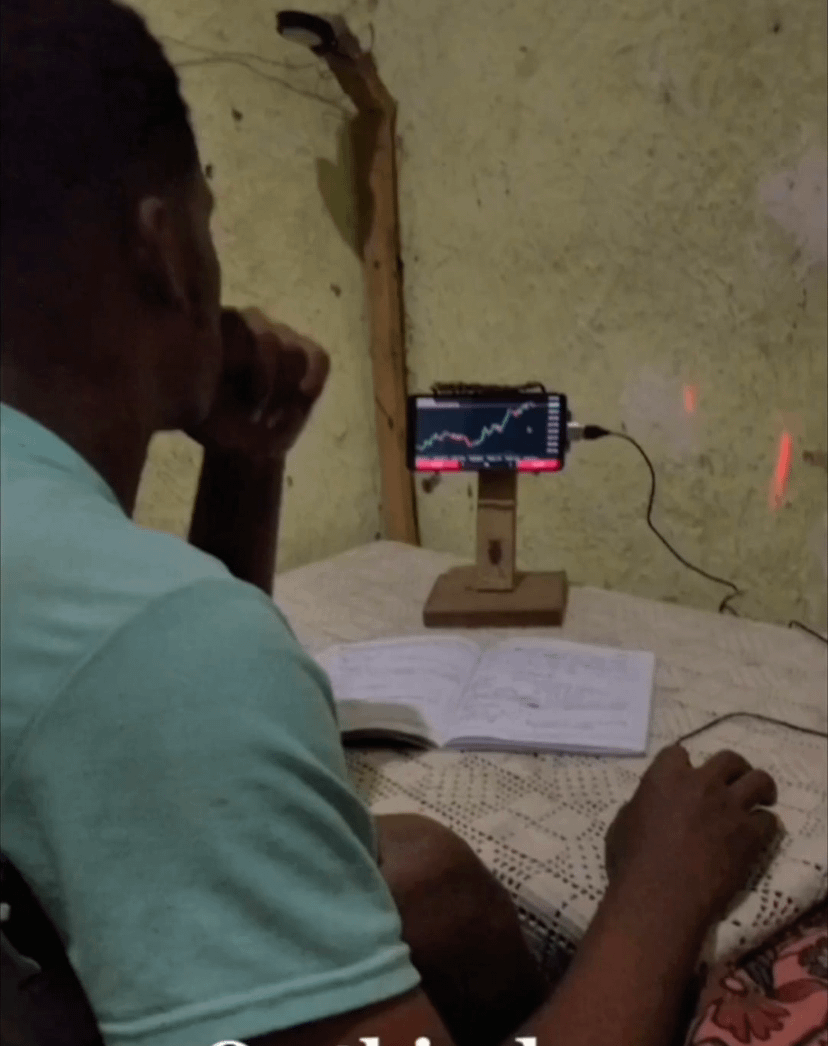
Observando atentamente os graficos do $BTC e viendo él hacer techo y suelo con claridad!
Observando atentamente os graficos do $BTC e viendo él hacer techo y suelo con claridad!
3
11
5.6k
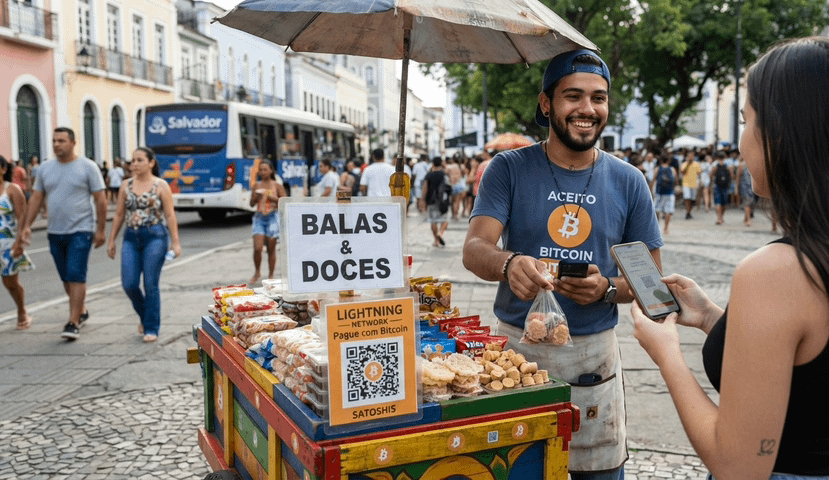
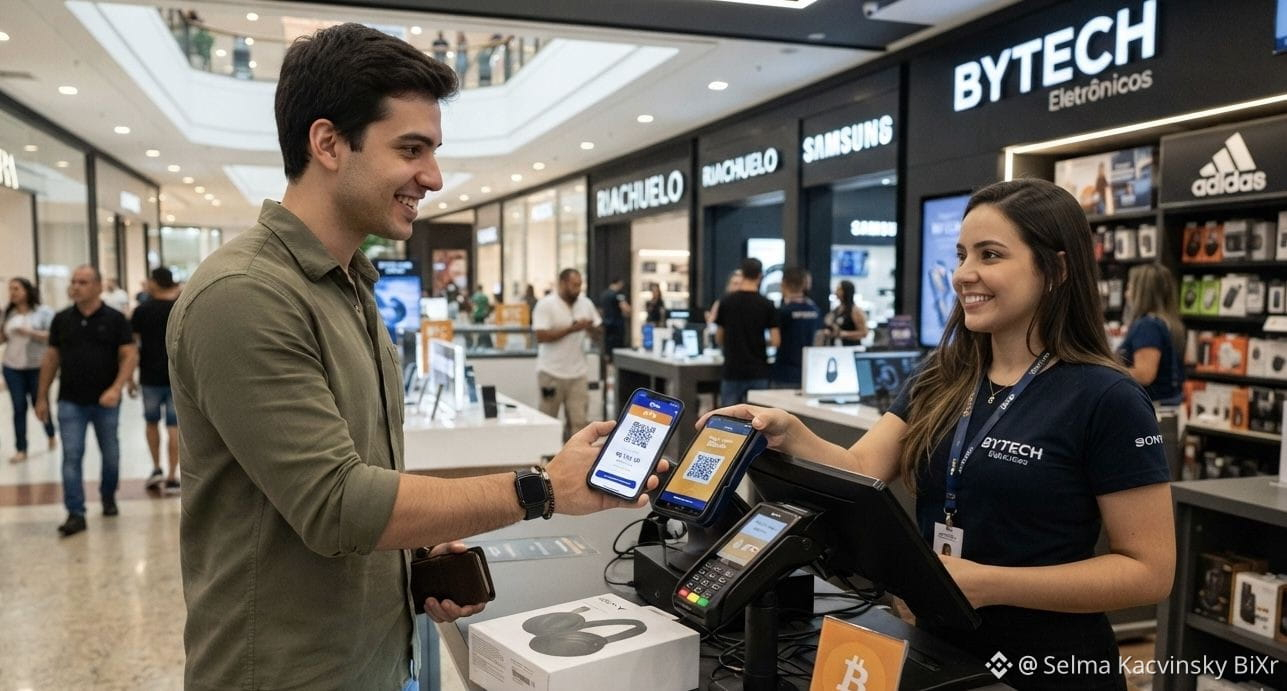
Ganar $BTC vendiendo caramelos en la calle
Es totalmente posible ganar Bitcoin vendiendo caramelos en la calle, convirtiendo un negocio tradicional de comercio ambulante en una puerta de entrada a la economía digital.
Para que esto funcione, el secreto es facilitar al máximo el pago al cliente y usar las herramientas correctas para no perder dinero con comisiones.
🛠️ Cómo estructurar el negocio
Acepte la Lightning Network: No use la red principal de Bitcoin (On-chain) para vender caramelos, porque las comisiones serían más caras que el propio dulce. Use la Lightning Network, que permite transacciones instantáneas y con comisiones que cuestan fracciones de centavo.
Elija una Wallet práctica: Descargue aplicaciones enfocadas en Lightning que facilitan recibir en el día a día, como Blink, Muun, Phoenix o Wallet of Satoshi. Generan un Código QR en la pantalla de su celular para que el cliente lo escanee.
Cree un Código QR fijo (impreso): Para agilizar, puede imprimir un Código QR fijo (usando el estándar LNURL-Pay o Lightning Address, que funciona como un “Pix de Bitcoin”) y pegarlo en su cajita de dulces. El cliente elige el valor en reales, escribe y envía.
Marketing visual con impacto: Use la marca de Bitcoin a su favor. Carteles como “Acepto Bitcoin” o “Gana descuento pagando con BTC” atraen la atención de curiosos, entusiastas de la tecnología y creadores de contenido, lo que puede aumentar mucho sus ventas.
Ganar $BTC vendiendo caramelos en la calle
Es totalmente posible ganar Bitcoin vendiendo caramelos en la calle, convirtiendo un negocio tradicional de comercio ambulante en una puerta de entrada a la economía digital.
Para que esto funcione, el secreto es facilitar al máximo el pago al cliente y usar las herramientas correctas para no perder dinero con comisiones.
🛠️ Cómo estructurar el negocio
Acepte la Lightning Network: No use la red principal de Bitcoin (On-chain) para vender caramelos, porque las comisiones serían más caras que el propio dulce. Use la Lightning Network, que permite transacciones instantáneas y con comisiones que cuestan fracciones de centavo.
Elija una Wallet práctica: Descargue aplicaciones enfocadas en Lightning que facilitan recibir en el día a día, como Blink, Muun, Phoenix o Wallet of Satoshi. Generan un Código QR en la pantalla de su celular para que el cliente lo escanee.
Cree un Código QR fijo (impreso): Para agilizar, puede imprimir un Código QR fijo (usando el estándar LNURL-Pay o Lightning Address, que funciona como un “Pix de Bitcoin”) y pegarlo en su cajita de dulces. El cliente elige el valor en reales, escribe y envía.
Marketing visual con impacto: Use la marca de Bitcoin a su favor. Carteles como “Acepto Bitcoin” o “Gana descuento pagando con BTC” atraen la atención de curiosos, entusiastas de la tecnología y creadores de contenido, lo que puede aumentar mucho sus ventas.
Es totalmente posible ganar Bitcoin vendiendo caramelos en la calle, convirtiendo un negocio tradicional de comercio ambulante en una puerta de entrada a la economía digital.
Para que esto funcione, el secreto es facilitar al máximo el pago al cliente y usar las herramientas correctas para no perder dinero con comisiones.
🛠️ Cómo estructurar el negocio
Acepte la Lightning Network: No use la red principal de Bitcoin (On-chain) para vender caramelos, porque las comisiones serían más caras que el propio dulce. Use la Lightning Network, que permite transacciones instantáneas y con comisiones que cuestan fracciones de centavo.
Elija una Wallet práctica: Descargue aplicaciones enfocadas en Lightning que facilitan recibir en el día a día, como Blink, Muun, Phoenix o Wallet of Satoshi. Generan un Código QR en la pantalla de su celular para que el cliente lo escanee.
Cree un Código QR fijo (impreso): Para agilizar, puede imprimir un Código QR fijo (usando el estándar LNURL-Pay o Lightning Address, que funciona como un “Pix de Bitcoin”) y pegarlo en su cajita de dulces. El cliente elige el valor en reales, escribe y envía.
Marketing visual con impacto: Use la marca de Bitcoin a su favor. Carteles como “Acepto Bitcoin” o “Gana descuento pagando con BTC” atraen la atención de curiosos, entusiastas de la tecnología y creadores de contenido, lo que puede aumentar mucho sus ventas.
3
714
·
--
Alcista
$ONE
1. O ONE disparou mais de 90% em 24 horas, impulsionado por uma mudança estratégica para o setor de IA e por fluxos massivos de capital, mas enfrenta elevados riscos de recuo.
Principales factores
1. - **Cambio de Narrativa hacia la IA (Alto)**: La reorientación estratégica de Harmony, que dejó de centrarse en el tradicional sharding de la capa 1 para enfocarse en el sector de IA en auge, fue el principal catalizador fundamental del rally.
- **Entradas de Capital y Pico en el Volumen (Alto)**: El volumen de negociación explotó junto con enormes entradas de capital, alcanzando un pico superior a +634 mil USDT en solo una hora, impulsando una revalorización de más del 90% en el precio.
- **Expansión del Ecosistema (Medio)**: El lanzamiento de nuevos juegos en ONEquest y campañas promocionales, como el Desafío de Pre-registro de Gemini Seed, aumentaron la participación de los usuarios y la utilidad del token.
Evaluación de riesgo
1. - **Técnicamente Sobrecomprado (Alto)**: El RSI horario alcanzó niveles extremadamente sobrecomprados, cerca de 99, antes de retroceder a 71, lo que indica un rally muy estirado y vulnerable a fuertes tomas de ganancias.
- **Vientos en Contra Macroeconómicos (Medio)**: Las preocupaciones sobre la postura de la Reserva Federal con respecto a las tasas de interés y los posibles efectos colaterales de la volatilidad del mercado chino amenazan el sentimiento más amplio hacia los activos de riesgo.
- **Riesgo de Reversión (Medio)**: Los participantes del mercado alertan sobre patrones irregulares de negociación y sobre el potencial de una caída repentina de los precios tras las rápidas ganancias parabólicas.
de Insights ONE Spot
$ONE
1. O ONE disparou mais de 90% em 24 horas, impulsionado por uma mudança estratégica para o setor de IA e por fluxos massivos de capital, mas enfrenta elevados riscos de recuo.
Principales factores
1. - **Cambio de Narrativa hacia la IA (Alto)**: La reorientación estratégica de Harmony, que dejó de centrarse en el tradicional sharding de la capa 1 para enfocarse en el sector de IA en auge, fue el principal catalizador fundamental del rally.
- **Entradas de Capital y Pico en el Volumen (Alto)**: El volumen de negociación explotó junto con enormes entradas de capital, alcanzando un pico superior a +634 mil USDT en solo una hora, impulsando una revalorización de más del 90% en el precio.
- **Expansión del Ecosistema (Medio)**: El lanzamiento de nuevos juegos en ONEquest y campañas promocionales, como el Desafío de Pre-registro de Gemini Seed, aumentaron la participación de los usuarios y la utilidad del token.
Evaluación de riesgo
1. - **Técnicamente Sobrecomprado (Alto)**: El RSI horario alcanzó niveles extremadamente sobrecomprados, cerca de 99, antes de retroceder a 71, lo que indica un rally muy estirado y vulnerable a fuertes tomas de ganancias.
- **Vientos en Contra Macroeconómicos (Medio)**: Las preocupaciones sobre la postura de la Reserva Federal con respecto a las tasas de interés y los posibles efectos colaterales de la volatilidad del mercado chino amenazan el sentimiento más amplio hacia los activos de riesgo.
- **Riesgo de Reversión (Medio)**: Los participantes del mercado alertan sobre patrones irregulares de negociación y sobre el potencial de una caída repentina de los precios tras las rápidas ganancias parabólicas.
de Insights ONE Spot
1. O ONE disparou mais de 90% em 24 horas, impulsionado por uma mudança estratégica para o setor de IA e por fluxos massivos de capital, mas enfrenta elevados riscos de recuo.
Principales factores
1. - **Cambio de Narrativa hacia la IA (Alto)**: La reorientación estratégica de Harmony, que dejó de centrarse en el tradicional sharding de la capa 1 para enfocarse en el sector de IA en auge, fue el principal catalizador fundamental del rally.
- **Entradas de Capital y Pico en el Volumen (Alto)**: El volumen de negociación explotó junto con enormes entradas de capital, alcanzando un pico superior a +634 mil USDT en solo una hora, impulsando una revalorización de más del 90% en el precio.
- **Expansión del Ecosistema (Medio)**: El lanzamiento de nuevos juegos en ONEquest y campañas promocionales, como el Desafío de Pre-registro de Gemini Seed, aumentaron la participación de los usuarios y la utilidad del token.
Evaluación de riesgo
1. - **Técnicamente Sobrecomprado (Alto)**: El RSI horario alcanzó niveles extremadamente sobrecomprados, cerca de 99, antes de retroceder a 71, lo que indica un rally muy estirado y vulnerable a fuertes tomas de ganancias.
- **Vientos en Contra Macroeconómicos (Medio)**: Las preocupaciones sobre la postura de la Reserva Federal con respecto a las tasas de interés y los posibles efectos colaterales de la volatilidad del mercado chino amenazan el sentimiento más amplio hacia los activos de riesgo.
- **Riesgo de Reversión (Medio)**: Los participantes del mercado alertan sobre patrones irregulares de negociación y sobre el potencial de una caída repentina de los precios tras las rápidas ganancias parabólicas.
de Insights ONE Spot
4
1.4k
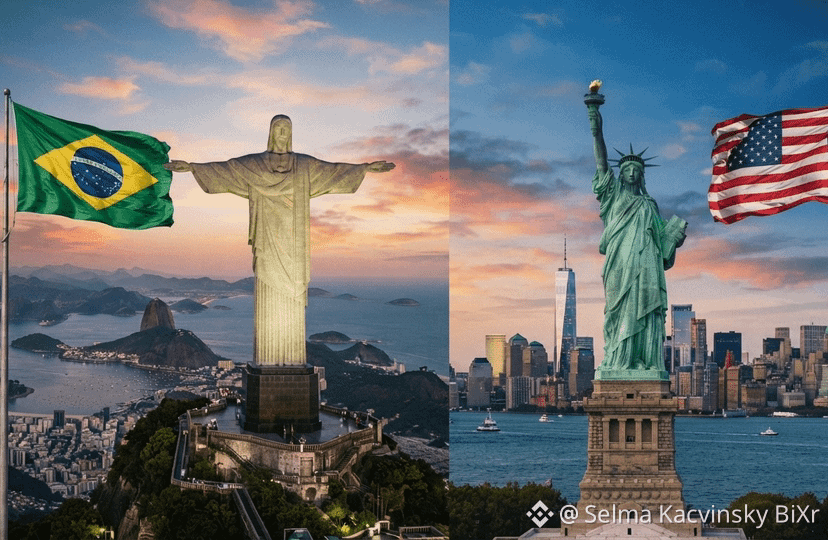
$ARK A "Superquarta" es el día en que los Bancos Centrales de Brasil y de Estados Unidos publican sus decisiones sobre las tasas básicas de interés simultáneamente.
Este evento ocurre pocas veces al año y mueve mucho las inversiones, las bolsas de valores y el valor del dólar. Esta semana, la Superquarta ocurre el 16 de septiembre de 2026.
El gran punto destacado de esta edición es que ambos países deben tomar rumbos opuestos en sus políticas monetarias:
En Brasil (Tasa Selic): La expectativa predominante del mercado es otra reducción de 0,25 puntos porcentuales. Con eso, la tasa básica de interés (Selic) debería bajar del 14% al 13,75% anual, impulsada por datos recientes de inflación más moderados en el país.
En Estados Unidos (Fed Funds Rate): El movimiento esperado es el inverso. Cerca del 86,5% de los analistas apuestan por un aumento de 0,25 puntos porcentuales en los intereses estadounidenses, elevando el rango de tasas al intervalo entre 3,75% y 4% anual. Esta será la primera gran reunión bajo la presión de los indicadores de inflación recientes de Estados Unidos y bajo el liderazgo de Kevin Warsh en la Reserva Federal.
Cuando los intereses cambian en las dos mayores economías de las Américas, el dinero se mueve globalmente.
Renta Fija y Variable: En Brasil, la reducción de la Selic tiende a disminuir levemente la rentabilidad de nuevos títulos indexados y suele dar margen a las acciones en la bolsa (Ibovespa) a largo plazo.
Los intereses más altos en EE. UU. atraen capital global hacia los títulos públicos estadounidenses (Treasuries), lo cual tiende a fortalecer el dólar globalmente y presionar las monedas de países emergentes como el Real.
Los anuncios oficiales se realizan por la tarde del miércoles: primero la decisión estadounidense (Federal Reserve) y, al inicio de la noche, la decisión brasileña (Copom) $BTC
$ARK A "Superquarta" es el día en que los Bancos Centrales de Brasil y de Estados Unidos publican sus decisiones sobre las tasas básicas de interés simultáneamente.
Este evento ocurre pocas veces al año y mueve mucho las inversiones, las bolsas de valores y el valor del dólar. Esta semana, la Superquarta ocurre el 16 de septiembre de 2026.
El gran punto destacado de esta edición es que ambos países deben tomar rumbos opuestos en sus políticas monetarias:
En Brasil (Tasa Selic): La expectativa predominante del mercado es otra reducción de 0,25 puntos porcentuales. Con eso, la tasa básica de interés (Selic) debería bajar del 14% al 13,75% anual, impulsada por datos recientes de inflación más moderados en el país.
En Estados Unidos (Fed Funds Rate): El movimiento esperado es el inverso. Cerca del 86,5% de los analistas apuestan por un aumento de 0,25 puntos porcentuales en los intereses estadounidenses, elevando el rango de tasas al intervalo entre 3,75% y 4% anual. Esta será la primera gran reunión bajo la presión de los indicadores de inflación recientes de Estados Unidos y bajo el liderazgo de Kevin Warsh en la Reserva Federal.
Cuando los intereses cambian en las dos mayores economías de las Américas, el dinero se mueve globalmente.
Renta Fija y Variable: En Brasil, la reducción de la Selic tiende a disminuir levemente la rentabilidad de nuevos títulos indexados y suele dar margen a las acciones en la bolsa (Ibovespa) a largo plazo.
Los intereses más altos en EE. UU. atraen capital global hacia los títulos públicos estadounidenses (Treasuries), lo cual tiende a fortalecer el dólar globalmente y presionar las monedas de países emergentes como el Real.
Los anuncios oficiales se realizan por la tarde del miércoles: primero la decisión estadounidense (Federal Reserve) y, al inicio de la noche, la decisión brasileña (Copom) $BTC
Este evento ocurre pocas veces al año y mueve mucho las inversiones, las bolsas de valores y el valor del dólar. Esta semana, la Superquarta ocurre el 16 de septiembre de 2026.
El gran punto destacado de esta edición es que ambos países deben tomar rumbos opuestos en sus políticas monetarias:
En Brasil (Tasa Selic): La expectativa predominante del mercado es otra reducción de 0,25 puntos porcentuales. Con eso, la tasa básica de interés (Selic) debería bajar del 14% al 13,75% anual, impulsada por datos recientes de inflación más moderados en el país.
En Estados Unidos (Fed Funds Rate): El movimiento esperado es el inverso. Cerca del 86,5% de los analistas apuestan por un aumento de 0,25 puntos porcentuales en los intereses estadounidenses, elevando el rango de tasas al intervalo entre 3,75% y 4% anual. Esta será la primera gran reunión bajo la presión de los indicadores de inflación recientes de Estados Unidos y bajo el liderazgo de Kevin Warsh en la Reserva Federal.
Cuando los intereses cambian en las dos mayores economías de las Américas, el dinero se mueve globalmente.
Renta Fija y Variable: En Brasil, la reducción de la Selic tiende a disminuir levemente la rentabilidad de nuevos títulos indexados y suele dar margen a las acciones en la bolsa (Ibovespa) a largo plazo.
Los intereses más altos en EE. UU. atraen capital global hacia los títulos públicos estadounidenses (Treasuries), lo cual tiende a fortalecer el dólar globalmente y presionar las monedas de países emergentes como el Real.
Los anuncios oficiales se realizan por la tarde del miércoles: primero la decisión estadounidense (Federal Reserve) y, al inicio de la noche, la decisión brasileña (Copom) $BTC
2
171
$BTC ‼️‼️‼️FALTAN ALGUNAS HORAS PARA LA DECISIÓN DE LOS INTERESES AMERICANOS‼️‼️‼️
Semana decisiva de eventos: El mercado opera con cautela, ya que el miércoles habrá la decisión de tipos de interés de la Fed (banco central de EE. UU.), donde hay una fuerte expectativa de aumento de las tasas. Además, mañana se votará en el Senado estadounidense un importante proyecto de ley de regulación cripto, el Clarity Act.
$BTC ‼️‼️‼️FALTAN ALGUNAS HORAS PARA LA DECISIÓN DE LOS INTERESES AMERICANOS‼️‼️‼️
Semana decisiva de eventos: El mercado opera con cautela, ya que el miércoles habrá la decisión de tipos de interés de la Fed (banco central de EE. UU.), donde hay una fuerte expectativa de aumento de las tasas. Además, mañana se votará en el Senado estadounidense un importante proyecto de ley de regulación cripto, el Clarity Act.
Semana decisiva de eventos: El mercado opera con cautela, ya que el miércoles habrá la decisión de tipos de interés de la Fed (banco central de EE. UU.), donde hay una fuerte expectativa de aumento de las tasas. Además, mañana se votará en el Senado estadounidense un importante proyecto de ley de regulación cripto, el Clarity Act.
2
436
·
--
Alcista
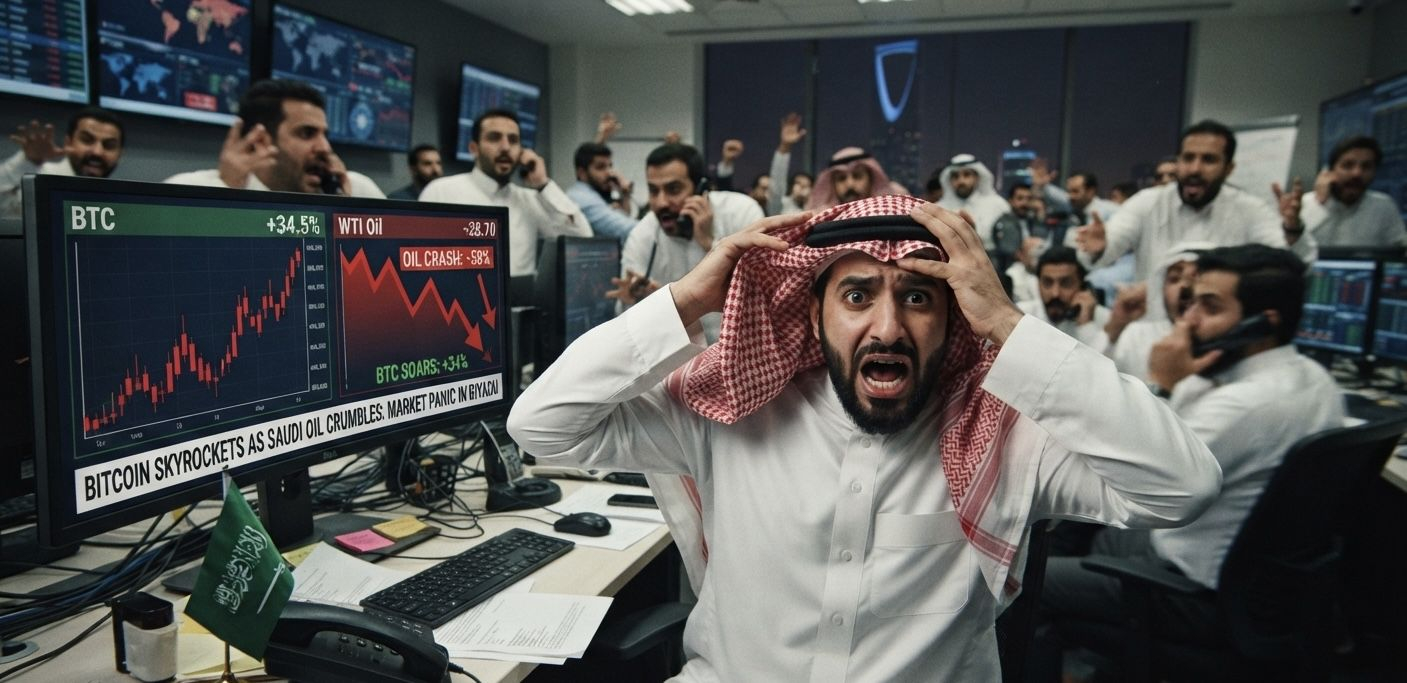
$BTC O movimiento de valorización ocurre en un día atípico, donde el mercado de criptomonedas está ignorando y separándose de la fuerte caída en las bolsas tradicionales.
Los principales factores que mueven el BTC este lunes son:
Refugio ante la caída de las acciones de IA: Grandes líderes de inteligencia artificial (como los CEO de OpenAI y Anthropic) pidieron públicamente una desaceleración en el desarrollo de modelos de IA por motivos de seguridad. Esto provocó un fuerte desplome en las bolsas globales y en acciones tecnológicas. El Bitcoin, que venía sufriendo este año por la migración de capital hacia proyectos de IA, terminó beneficiándose y recibiendo nuevamente ese flujo.
Tensiones geopolíticas y alza del petróleo: Un ataque con drones en Arabia Saudita cerró un oleoducto importante, haciendo que el petróleo Brent se dispare. Mientras el mercado tradicional teme el impacto inflacionario, el Bitcoin ha funcionado como una especie de refugio seguro momentáneo. #BitcoinHoldsAbove$77000
$BTC O movimiento de valorización ocurre en un día atípico, donde el mercado de criptomonedas está ignorando y separándose de la fuerte caída en las bolsas tradicionales.
Los principales factores que mueven el BTC este lunes son:
Refugio ante la caída de las acciones de IA: Grandes líderes de inteligencia artificial (como los CEO de OpenAI y Anthropic) pidieron públicamente una desaceleración en el desarrollo de modelos de IA por motivos de seguridad. Esto provocó un fuerte desplome en las bolsas globales y en acciones tecnológicas. El Bitcoin, que venía sufriendo este año por la migración de capital hacia proyectos de IA, terminó beneficiándose y recibiendo nuevamente ese flujo.
Tensiones geopolíticas y alza del petróleo: Un ataque con drones en Arabia Saudita cerró un oleoducto importante, haciendo que el petróleo Brent se dispare. Mientras el mercado tradicional teme el impacto inflacionario, el Bitcoin ha funcionado como una especie de refugio seguro momentáneo. #BitcoinHoldsAbove$77000
Los principales factores que mueven el BTC este lunes son:
Refugio ante la caída de las acciones de IA: Grandes líderes de inteligencia artificial (como los CEO de OpenAI y Anthropic) pidieron públicamente una desaceleración en el desarrollo de modelos de IA por motivos de seguridad. Esto provocó un fuerte desplome en las bolsas globales y en acciones tecnológicas. El Bitcoin, que venía sufriendo este año por la migración de capital hacia proyectos de IA, terminó beneficiándose y recibiendo nuevamente ese flujo.
Tensiones geopolíticas y alza del petróleo: Un ataque con drones en Arabia Saudita cerró un oleoducto importante, haciendo que el petróleo Brent se dispare. Mientras el mercado tradicional teme el impacto inflacionario, el Bitcoin ha funcionado como una especie de refugio seguro momentáneo. #BitcoinHoldsAbove$77000
1
3
86
$DOGE A opinión de Elon Musk
Afecto por Dogecoin (DOGE)
Dogecoin sigue siendo descrito por él como su criptomoneda favorita, por un tema de humor y atractivo popular. Musk a menudo la llama "la criptomoneda del pueblo". A pesar de desaconsejar que la gente apueste grandes cantidades de dinero con ella.
Portafolio personal
El multimillonario ya ha confirmado en varias ocasiones que su portafolio personal de criptoactivos está compuesto estrictamente por solo tres monedas:
1. Bitcoin ($BTC )
2. Ethereum (ETH)
3. Dogecoin (DOGE)
Consejo general
Recomienda extrema cautela y aconseja no apostar mucho en criptoactivos.
$DOGE A opinión de Elon Musk
Afecto por Dogecoin (DOGE)
Dogecoin sigue siendo descrito por él como su criptomoneda favorita, por un tema de humor y atractivo popular. Musk a menudo la llama "la criptomoneda del pueblo". A pesar de desaconsejar que la gente apueste grandes cantidades de dinero con ella.
Portafolio personal
El multimillonario ya ha confirmado en varias ocasiones que su portafolio personal de criptoactivos está compuesto estrictamente por solo tres monedas:
1. Bitcoin ($BTC )
2. Ethereum (ETH)
3. Dogecoin (DOGE)
Consejo general
Recomienda extrema cautela y aconseja no apostar mucho en criptoactivos.
Afecto por Dogecoin (DOGE)
Dogecoin sigue siendo descrito por él como su criptomoneda favorita, por un tema de humor y atractivo popular. Musk a menudo la llama "la criptomoneda del pueblo". A pesar de desaconsejar que la gente apueste grandes cantidades de dinero con ella.
Portafolio personal
El multimillonario ya ha confirmado en varias ocasiones que su portafolio personal de criptoactivos está compuesto estrictamente por solo tres monedas:
1. Bitcoin ($BTC )
2. Ethereum (ETH)
3. Dogecoin (DOGE)
Consejo general
Recomienda extrema cautela y aconseja no apostar mucho en criptoactivos.

4
979
$T Entradas de capital (Alta): Las entradas líquidas subieron a +US$ 354 mil en USDT, con un volumen de negociación horario superior a 4,1 millones de USDT, impulsando el fuerte aumento del precio.
Compra concentrada (Media): La proporción de grandes órdenes de entrada se disparó a 17,2% cuando el índice de concentración alcanzó temporalmente niveles medios, lo que indica la participación de ballenas.
Momentum social (Baja): La expectativa de la
comunidad sobre el movimiento alcista estimuló la participación de los pequeños inversores durante la fase inicial de la subida.
Evaluación de riesgo
Toma de beneficios (Alta): Las grandes entradas de capital se revirtieron abruptamente a una salida de US$ 110 mil en USDT, indicando que los primeros compradores están saliendo activamente de sus posiciones.
Técnicos sobrecomprados (Alta): El RSI alcanzó un extremo de 98 antes de caer a 51, acompañado de un fuerte rechazo por encima de la banda superior de Bollinger.
Volatilidad de micro-cap (Media): Con una capitalización de mercado de US$ 58 millones, el token sigue siendo altamente vulnerable a actividades de negociación concentradas y a cambios repentinos de liquidez.
La extrema extenuación técnica y los flujos negativos de capital sugieren que el retroceso actual podría profundizarse.
$T Entradas de capital (Alta): Las entradas líquidas subieron a +US$ 354 mil en USDT, con un volumen de negociación horario superior a 4,1 millones de USDT, impulsando el fuerte aumento del precio.
Compra concentrada (Media): La proporción de grandes órdenes de entrada se disparó a 17,2% cuando el índice de concentración alcanzó temporalmente niveles medios, lo que indica la participación de ballenas.
Momentum social (Baja): La expectativa de la
comunidad sobre el movimiento alcista estimuló la participación de los pequeños inversores durante la fase inicial de la subida.
Evaluación de riesgo
Toma de beneficios (Alta): Las grandes entradas de capital se revirtieron abruptamente a una salida de US$ 110 mil en USDT, indicando que los primeros compradores están saliendo activamente de sus posiciones.
Técnicos sobrecomprados (Alta): El RSI alcanzó un extremo de 98 antes de caer a 51, acompañado de un fuerte rechazo por encima de la banda superior de Bollinger.
Volatilidad de micro-cap (Media): Con una capitalización de mercado de US$ 58 millones, el token sigue siendo altamente vulnerable a actividades de negociación concentradas y a cambios repentinos de liquidez.
La extrema extenuación técnica y los flujos negativos de capital sugieren que el retroceso actual podría profundizarse.
Compra concentrada (Media): La proporción de grandes órdenes de entrada se disparó a 17,2% cuando el índice de concentración alcanzó temporalmente niveles medios, lo que indica la participación de ballenas.
Momentum social (Baja): La expectativa de la
comunidad sobre el movimiento alcista estimuló la participación de los pequeños inversores durante la fase inicial de la subida.
Evaluación de riesgo
Toma de beneficios (Alta): Las grandes entradas de capital se revirtieron abruptamente a una salida de US$ 110 mil en USDT, indicando que los primeros compradores están saliendo activamente de sus posiciones.
Técnicos sobrecomprados (Alta): El RSI alcanzó un extremo de 98 antes de caer a 51, acompañado de un fuerte rechazo por encima de la banda superior de Bollinger.
Volatilidad de micro-cap (Media): Con una capitalización de mercado de US$ 58 millones, el token sigue siendo altamente vulnerable a actividades de negociación concentradas y a cambios repentinos de liquidez.
La extrema extenuación técnica y los flujos negativos de capital sugieren que el retroceso actual podría profundizarse.
1
105
$BTC
Acumulación institucional (Alta): Compras corporativas estratégicas, incluida una adquisición reciente de 469 BTC por US$ 36,6 millones, a un precio promedio de US$ 77.954, refuerzan la confianza institucional sostenida al establecer sólidas bases de precios.
Catalizadores regulatorios (Media): Creciente optimismo en torno a la votación del proyecto de ley CLARITY en el Senado, programada para el 15 de septiembre, lo que potencialmente puede liberar un capital institucional significativo al proporcionar seguridad jurídica.
Momentum técnico (Media): Recuperación intradía del precio, de US$ 76,7 mil a US$ 77,7 mil, respaldada por un cruce positivo del MACD y volúmenes de compra estables por hora.
Evaluación de riesgo
Ajuste macroeconómico (Alta): Probabilidad del 86,5% de un aumento de 25 puntos básicos en la tasa de interés de la Reserva Federal el 17 de septiembre → amenaza la liquidez de corto plazo y presiona los activos de riesgo.
Inestabilidad geopolítica (Media): Ataques con drones contra infraestructura petrolera y escalada de tensiones en Oriente Medio; riesgo de choques económicos más amplios y de huida de capitales hacia refugios tradicionales seguros.
Vulnerabilidades del ecosistema (Baja): Múltiples explotaciones en wrappers respaldados por Bitcoin y un robo reciente de US$ 240 millones mediante ingeniería social ponen de relieve riesgos estructurales en la infraestructura de capas secundarias.
$BTC
Acumulación institucional (Alta): Compras corporativas estratégicas, incluida una adquisición reciente de 469 BTC por US$ 36,6 millones, a un precio promedio de US$ 77.954, refuerzan la confianza institucional sostenida al establecer sólidas bases de precios.
Catalizadores regulatorios (Media): Creciente optimismo en torno a la votación del proyecto de ley CLARITY en el Senado, programada para el 15 de septiembre, lo que potencialmente puede liberar un capital institucional significativo al proporcionar seguridad jurídica.
Momentum técnico (Media): Recuperación intradía del precio, de US$ 76,7 mil a US$ 77,7 mil, respaldada por un cruce positivo del MACD y volúmenes de compra estables por hora.
Evaluación de riesgo
Ajuste macroeconómico (Alta): Probabilidad del 86,5% de un aumento de 25 puntos básicos en la tasa de interés de la Reserva Federal el 17 de septiembre → amenaza la liquidez de corto plazo y presiona los activos de riesgo.
Inestabilidad geopolítica (Media): Ataques con drones contra infraestructura petrolera y escalada de tensiones en Oriente Medio; riesgo de choques económicos más amplios y de huida de capitales hacia refugios tradicionales seguros.
Vulnerabilidades del ecosistema (Baja): Múltiples explotaciones en wrappers respaldados por Bitcoin y un robo reciente de US$ 240 millones mediante ingeniería social ponen de relieve riesgos estructurales en la infraestructura de capas secundarias.
Acumulación institucional (Alta): Compras corporativas estratégicas, incluida una adquisición reciente de 469 BTC por US$ 36,6 millones, a un precio promedio de US$ 77.954, refuerzan la confianza institucional sostenida al establecer sólidas bases de precios.
Catalizadores regulatorios (Media): Creciente optimismo en torno a la votación del proyecto de ley CLARITY en el Senado, programada para el 15 de septiembre, lo que potencialmente puede liberar un capital institucional significativo al proporcionar seguridad jurídica.
Momentum técnico (Media): Recuperación intradía del precio, de US$ 76,7 mil a US$ 77,7 mil, respaldada por un cruce positivo del MACD y volúmenes de compra estables por hora.
Evaluación de riesgo
Ajuste macroeconómico (Alta): Probabilidad del 86,5% de un aumento de 25 puntos básicos en la tasa de interés de la Reserva Federal el 17 de septiembre → amenaza la liquidez de corto plazo y presiona los activos de riesgo.
Inestabilidad geopolítica (Media): Ataques con drones contra infraestructura petrolera y escalada de tensiones en Oriente Medio; riesgo de choques económicos más amplios y de huida de capitales hacia refugios tradicionales seguros.
Vulnerabilidades del ecosistema (Baja): Múltiples explotaciones en wrappers respaldados por Bitcoin y un robo reciente de US$ 240 millones mediante ingeniería social ponen de relieve riesgos estructurales en la infraestructura de capas secundarias.
2
155
Verificado
$LSK Reducción de la oferta (Alta): La DAO de Lisk aprobó una quema masiva de 100 millones de tokens (25% de la oferta total) → generó un fuerte impulso comprador y elevó los precios al máximo en 24 horas, alcanzando 1,17 USD.
Pivote estratégico (Media): La transición a una plataforma de operaciones financieras corporativas, con enfoque en pagos y stablecoins, revitalizó la utilidad fundamental como token de fidelidad y recompensas.
Entradas de capital (Media): Las entradas netas aumentaron junto con el volumen de negociación, alcanzando un pico de 3,78 millones de USD en flujo horario durante la subida de precios, lo que señala una fuerte acumulación.
Evaluación de riesgo
Ventas de insiders (Alta): Una cartera vinculada al CEO transfirió 3,3 millones de LSK (3,79 millones de USD) a una exchange centralizada después de la subida → eleva riesgos inmediatos de presión descendente concentrada.
Impacto tardío de la quema (Media): La quema de 100 millones de tokens apunta a cronogramas futuros de liberación (2027-2033), y no a la oferta circulante actual → puede decepcionar a los inversores minoristas que esperan escasez inmediata.
Agotamiento técnico (Media): El RSI superó 98 durante el pico, lo que indica condiciones severas de sobrecompra, y que ya resultó en una retracción por debajo de 1,00 USD.
Migración de red (Baja): El cierre inminente de la Lisk Chain el 31 de octubre exige migrar a Celo/Ethereum, introduciendo fricciones.
$LSK Reducción de la oferta (Alta): La DAO de Lisk aprobó una quema masiva de 100 millones de tokens (25% de la oferta total) → generó un fuerte impulso comprador y elevó los precios al máximo en 24 horas, alcanzando 1,17 USD.
Pivote estratégico (Media): La transición a una plataforma de operaciones financieras corporativas, con enfoque en pagos y stablecoins, revitalizó la utilidad fundamental como token de fidelidad y recompensas.
Entradas de capital (Media): Las entradas netas aumentaron junto con el volumen de negociación, alcanzando un pico de 3,78 millones de USD en flujo horario durante la subida de precios, lo que señala una fuerte acumulación.
Evaluación de riesgo
Ventas de insiders (Alta): Una cartera vinculada al CEO transfirió 3,3 millones de LSK (3,79 millones de USD) a una exchange centralizada después de la subida → eleva riesgos inmediatos de presión descendente concentrada.
Impacto tardío de la quema (Media): La quema de 100 millones de tokens apunta a cronogramas futuros de liberación (2027-2033), y no a la oferta circulante actual → puede decepcionar a los inversores minoristas que esperan escasez inmediata.
Agotamiento técnico (Media): El RSI superó 98 durante el pico, lo que indica condiciones severas de sobrecompra, y que ya resultó en una retracción por debajo de 1,00 USD.
Migración de red (Baja): El cierre inminente de la Lisk Chain el 31 de octubre exige migrar a Celo/Ethereum, introduciendo fricciones.
Pivote estratégico (Media): La transición a una plataforma de operaciones financieras corporativas, con enfoque en pagos y stablecoins, revitalizó la utilidad fundamental como token de fidelidad y recompensas.
Entradas de capital (Media): Las entradas netas aumentaron junto con el volumen de negociación, alcanzando un pico de 3,78 millones de USD en flujo horario durante la subida de precios, lo que señala una fuerte acumulación.
Evaluación de riesgo
Ventas de insiders (Alta): Una cartera vinculada al CEO transfirió 3,3 millones de LSK (3,79 millones de USD) a una exchange centralizada después de la subida → eleva riesgos inmediatos de presión descendente concentrada.
Impacto tardío de la quema (Media): La quema de 100 millones de tokens apunta a cronogramas futuros de liberación (2027-2033), y no a la oferta circulante actual → puede decepcionar a los inversores minoristas que esperan escasez inmediata.
Agotamiento técnico (Media): El RSI superó 98 durante el pico, lo que indica condiciones severas de sobrecompra, y que ya resultó en una retracción por debajo de 1,00 USD.
Migración de red (Baja): El cierre inminente de la Lisk Chain el 31 de octubre exige migrar a Celo/Ethereum, introduciendo fricciones.
1
721
$BTC
Salidas de ETF (Altas): Los ETF de Bitcoin al contado de EE. UU. registraron alrededor de 461 millones de USD en salidas netas esta semana, revirtiendo los flujos anteriores y señalando una reducción en la demanda institucional.
Ansiedad Macroeconómica (Alta): Las expectativas sobre la reunión del FOMC del 15 al 16 de septiembre están impulsando el sentimiento de aversión al riesgo, ya que los mercados descuentan una probabilidad del 69% al 90% de una postura más restrictiva.
Debilidad Técnica (Media): Los indicadores a corto plazo muestran impulso bajista: el MACD está profundamente en territorio negativo y el RSI se acerca a niveles de sobreventa, cerca de 30.
Evaluación de riesgo
Impacto en las Tasas de Interés (Alta): La próxima decisión del FOMC representa el principal obstáculo a corto plazo y podría desencadenar nuevas caídas si la Fed sorprende con un aumento de tasas.
Volatilidad Regulatoria (Media): La votación de la Ley de Claridad (Clarity Act) el 15 de septiembre constituye un evento binario; aunque la posibilidad de un fracaso ya está ampliamente descontada, la incertidumbre sigue limitando el potencial alcista.
Capitulación de los Mineros (Baja): La tasa de hash permanece por debajo de los picos de finales de 2025 desde hace más de 300 días debido a márgenes ajustados. Esto eleva el riesgo de ventas forzadas por parte de los mineros y genera preocupaciones sobre la seguridad.
$BTC
Salidas de ETF (Altas): Los ETF de Bitcoin al contado de EE. UU. registraron alrededor de 461 millones de USD en salidas netas esta semana, revirtiendo los flujos anteriores y señalando una reducción en la demanda institucional.
Ansiedad Macroeconómica (Alta): Las expectativas sobre la reunión del FOMC del 15 al 16 de septiembre están impulsando el sentimiento de aversión al riesgo, ya que los mercados descuentan una probabilidad del 69% al 90% de una postura más restrictiva.
Debilidad Técnica (Media): Los indicadores a corto plazo muestran impulso bajista: el MACD está profundamente en territorio negativo y el RSI se acerca a niveles de sobreventa, cerca de 30.
Evaluación de riesgo
Impacto en las Tasas de Interés (Alta): La próxima decisión del FOMC representa el principal obstáculo a corto plazo y podría desencadenar nuevas caídas si la Fed sorprende con un aumento de tasas.
Volatilidad Regulatoria (Media): La votación de la Ley de Claridad (Clarity Act) el 15 de septiembre constituye un evento binario; aunque la posibilidad de un fracaso ya está ampliamente descontada, la incertidumbre sigue limitando el potencial alcista.
Capitulación de los Mineros (Baja): La tasa de hash permanece por debajo de los picos de finales de 2025 desde hace más de 300 días debido a márgenes ajustados. Esto eleva el riesgo de ventas forzadas por parte de los mineros y genera preocupaciones sobre la seguridad.
Salidas de ETF (Altas): Los ETF de Bitcoin al contado de EE. UU. registraron alrededor de 461 millones de USD en salidas netas esta semana, revirtiendo los flujos anteriores y señalando una reducción en la demanda institucional.
Ansiedad Macroeconómica (Alta): Las expectativas sobre la reunión del FOMC del 15 al 16 de septiembre están impulsando el sentimiento de aversión al riesgo, ya que los mercados descuentan una probabilidad del 69% al 90% de una postura más restrictiva.
Debilidad Técnica (Media): Los indicadores a corto plazo muestran impulso bajista: el MACD está profundamente en territorio negativo y el RSI se acerca a niveles de sobreventa, cerca de 30.
Evaluación de riesgo
Impacto en las Tasas de Interés (Alta): La próxima decisión del FOMC representa el principal obstáculo a corto plazo y podría desencadenar nuevas caídas si la Fed sorprende con un aumento de tasas.
Volatilidad Regulatoria (Media): La votación de la Ley de Claridad (Clarity Act) el 15 de septiembre constituye un evento binario; aunque la posibilidad de un fracaso ya está ampliamente descontada, la incertidumbre sigue limitando el potencial alcista.
Capitulación de los Mineros (Baja): La tasa de hash permanece por debajo de los picos de finales de 2025 desde hace más de 300 días debido a márgenes ajustados. Esto eleva el riesgo de ventas forzadas por parte de los mineros y genera preocupaciones sobre la seguridad.
1
4
359
Aviso importante a todos los que leerse $BTC
Aviso importante a todos los que leerse $BTC


Binance Brasil Official
·
--
El Bitcoin cayó durante 4 sesiones seguidas. 📉
Pero si solo miras el precio, perderás buena parte de lo que ocurrió en el mercado cripto esta semana.
Aquí van 5 movimientos que vale la pena seguir 🧵👇
📉 Bitcoin bajo presión
La inflación, el petróleo y las expectativas sobre las tasas de interés han aumentado la presión sobre el mercado.
El contexto macro sigue influyendo en el corto plazo.
🏦 La tokenización ganó fuerza
Se anunció una inversión de US$ 100 millones para infraestructura de tokenización.
El mercado tradicional continúa explorando nuevas formas de usar blockchain.
⚖️ Blockchain entró aún más en la mira regulatoria
Una propuesta de la SEC podría permitir el uso de registros en blockchain como registro oficial de propiedad de valores mobiliarios.
Aún es una propuesta, pero el debate avanza.
₿ ¿Y los ETFs de Bitcoin?
En los dos días analizados, los ETFs registraron salidas por US$ 166,8 millones.
Ahora, vale la pena observar si los flujos institucionales vuelven a acelerarse.
🌎 La tokenización también avanza fuera de EE. UU.
Un proyecto en India comenzó a probar la tokenización de títulos corporativos y su liquidación usando moneda digital del banco central.
El movimiento es mayor que simplemente poner un activo en blockchain.
La discusión pasa por:
Tokenizar
↓
Registrar
↓
Movilizar
↓
Liquidar
En el mercado cripto, el precio es solo una parte de la historia.
El contexto macro, las instituciones, la regulación y la infraestructura también ayudan a entender lo que está pasando.
¿Cuál de estos movimientos vas a seguir de cerca? 👀
Aviso de riesgo: Los precios de los activos digitales pueden ser volátiles y es posible que no recuperes el valor invertido. Lee nuestro Aviso de riesgo.
Pero si solo miras el precio, perderás buena parte de lo que ocurrió en el mercado cripto esta semana.
Aquí van 5 movimientos que vale la pena seguir 🧵👇
📉 Bitcoin bajo presión
La inflación, el petróleo y las expectativas sobre las tasas de interés han aumentado la presión sobre el mercado.
El contexto macro sigue influyendo en el corto plazo.
🏦 La tokenización ganó fuerza
Se anunció una inversión de US$ 100 millones para infraestructura de tokenización.
El mercado tradicional continúa explorando nuevas formas de usar blockchain.
⚖️ Blockchain entró aún más en la mira regulatoria
Una propuesta de la SEC podría permitir el uso de registros en blockchain como registro oficial de propiedad de valores mobiliarios.
Aún es una propuesta, pero el debate avanza.
₿ ¿Y los ETFs de Bitcoin?
En los dos días analizados, los ETFs registraron salidas por US$ 166,8 millones.
Ahora, vale la pena observar si los flujos institucionales vuelven a acelerarse.
🌎 La tokenización también avanza fuera de EE. UU.
Un proyecto en India comenzó a probar la tokenización de títulos corporativos y su liquidación usando moneda digital del banco central.
El movimiento es mayor que simplemente poner un activo en blockchain.
La discusión pasa por:
Tokenizar
↓
Registrar
↓
Movilizar
↓
Liquidar
En el mercado cripto, el precio es solo una parte de la historia.
El contexto macro, las instituciones, la regulación y la infraestructura también ayudan a entender lo que está pasando.
¿Cuál de estos movimientos vas a seguir de cerca? 👀
Aviso de riesgo: Los precios de los activos digitales pueden ser volátiles y es posible que no recuperes el valor invertido. Lee nuestro Aviso de riesgo.
2
195
$BTC "De tanto ver triunfar as nulidades, de tanto ver prosperar a la desonra, de tanto ver crecer a la injusticia, de tanto ver hacerse más grandes los poderes en manos de los malos, el hombre llega a desanimarse de la virtud, a reírse de la honra, a avergonzarse de ser honesto." Rui Barbosa
$BTC "De tanto ver triunfar as nulidades, de tanto ver prosperar a la desonra, de tanto ver crecer a la injusticia, de tanto ver hacerse más grandes los poderes en manos de los malos, el hombre llega a desanimarse de la virtud, a reírse de la honra, a avergonzarse de ser honesto." Rui Barbosa

2
9
3k
$LABU.ETF fechou o último pregão negociado a US$ 261,30, apresentando uma caída de 1,77% en el día. El fondo operó con alta volatilidad a lo largo del día, abriendo a US$ 273,29, alcanzando un máximo de US$ 278,74 y retrocediendo hasta el mínimo cerca del cierre.
El escenario reciente para el ETF y el sector de biotecnología está marcado por un fuerte movimiento:Corrección en el Sector de Biotecnología: Recientemente, el sector de biotecnología en su conjunto enfrentó una fuerte presión de venta. El retroceso se acentuó después de que la farmacéutica Novartis sufriera reveses consecutivos en ensayos clínicos avanzados (especialmente con un tratamiento para la atrofia muscular), lo que generó un efecto dominó de aversión al riesgo. La caída de empresas de peso de la industria, como Dyne Therapeutics y Amgen, terminó amplificada en 3 veces por LABU.
Volatilidad de Corto Plazo vs. Recuperación: A pesar de las tomas de ganancias recientes provocadas por noticias corporativas desfavorables de grandes laboratorios, el ETF acumula una recuperación considerable en ventanas más largas en comparación con los mínimos del último año (cuando llegó a tocar el rango de US$ 74,95).
$LABU.ETF fechou o último pregão negociado a US$ 261,30, apresentando uma caída de 1,77% en el día. El fondo operó con alta volatilidad a lo largo del día, abriendo a US$ 273,29, alcanzando un máximo de US$ 278,74 y retrocediendo hasta el mínimo cerca del cierre.
El escenario reciente para el ETF y el sector de biotecnología está marcado por un fuerte movimiento:Corrección en el Sector de Biotecnología: Recientemente, el sector de biotecnología en su conjunto enfrentó una fuerte presión de venta. El retroceso se acentuó después de que la farmacéutica Novartis sufriera reveses consecutivos en ensayos clínicos avanzados (especialmente con un tratamiento para la atrofia muscular), lo que generó un efecto dominó de aversión al riesgo. La caída de empresas de peso de la industria, como Dyne Therapeutics y Amgen, terminó amplificada en 3 veces por LABU.
Volatilidad de Corto Plazo vs. Recuperación: A pesar de las tomas de ganancias recientes provocadas por noticias corporativas desfavorables de grandes laboratorios, el ETF acumula una recuperación considerable en ventanas más largas en comparación con los mínimos del último año (cuando llegó a tocar el rango de US$ 74,95).
El escenario reciente para el ETF y el sector de biotecnología está marcado por un fuerte movimiento:Corrección en el Sector de Biotecnología: Recientemente, el sector de biotecnología en su conjunto enfrentó una fuerte presión de venta. El retroceso se acentuó después de que la farmacéutica Novartis sufriera reveses consecutivos en ensayos clínicos avanzados (especialmente con un tratamiento para la atrofia muscular), lo que generó un efecto dominó de aversión al riesgo. La caída de empresas de peso de la industria, como Dyne Therapeutics y Amgen, terminó amplificada en 3 veces por LABU.
Volatilidad de Corto Plazo vs. Recuperación: A pesar de las tomas de ganancias recientes provocadas por noticias corporativas desfavorables de grandes laboratorios, el ETF acumula una recuperación considerable en ventanas más largas en comparación con los mínimos del último año (cuando llegó a tocar el rango de US$ 74,95).
1
100
$TRX Insights de TRX
¿Cuál es el impacto del ETF Canary Staked TRX en Cboe BZX?
El ETF Canary Staked TRX en Cboe BZX representa un hito crucial para TRON, ampliando significativamente su alcance y legitimidad.
Impacto institucional y demanda
La cotización de este ETF ofrece acceso regulado al mercado de EE. UU., abriendo puertas a capital institucional que antes dudaba en invertir directamente en criptoactivos. Esto impulsa la demanda fundamental de TRX, integrándolo en vehículos de inversión tradicionales y aumentando la liquidez.
Legitimidad y adopción
La aprobación y la negociación en una bolsa como Cboe BZX otorgan mayor credibilidad a TRON, señalando una aceptación creciente en el panorama financiero convencional.
En resumen, el ETF Canary Staked TRX es un poderoso catalizador para la adopción institucional y el crecimiento sostenido del ecosistema TRON.
$TRX Insights de TRX
¿Cuál es el impacto del ETF Canary Staked TRX en Cboe BZX?
El ETF Canary Staked TRX en Cboe BZX representa un hito crucial para TRON, ampliando significativamente su alcance y legitimidad.
Impacto institucional y demanda
La cotización de este ETF ofrece acceso regulado al mercado de EE. UU., abriendo puertas a capital institucional que antes dudaba en invertir directamente en criptoactivos. Esto impulsa la demanda fundamental de TRX, integrándolo en vehículos de inversión tradicionales y aumentando la liquidez.
Legitimidad y adopción
La aprobación y la negociación en una bolsa como Cboe BZX otorgan mayor credibilidad a TRON, señalando una aceptación creciente en el panorama financiero convencional.
En resumen, el ETF Canary Staked TRX es un poderoso catalizador para la adopción institucional y el crecimiento sostenido del ecosistema TRON.
¿Cuál es el impacto del ETF Canary Staked TRX en Cboe BZX?
El ETF Canary Staked TRX en Cboe BZX representa un hito crucial para TRON, ampliando significativamente su alcance y legitimidad.
Impacto institucional y demanda
La cotización de este ETF ofrece acceso regulado al mercado de EE. UU., abriendo puertas a capital institucional que antes dudaba en invertir directamente en criptoactivos. Esto impulsa la demanda fundamental de TRX, integrándolo en vehículos de inversión tradicionales y aumentando la liquidez.
Legitimidad y adopción
La aprobación y la negociación en una bolsa como Cboe BZX otorgan mayor credibilidad a TRON, señalando una aceptación creciente en el panorama financiero convencional.
En resumen, el ETF Canary Staked TRX es un poderoso catalizador para la adopción institucional y el crecimiento sostenido del ecosistema TRON.

1
356
Inicia sesión para explorar más contenidos
Únete a usuarios globales de criptomonedas en Binance Square
⚡️ Obtén información útil y actualizada sobre criptos.
💬 Avalado por el mayor exchange de criptomonedas en el mundo.
👍 Descubre perspectivas reales de creadores verificados.
Email/número de teléfono
Temas populares
BinanceLaunchesBinanceIntelligence
107 vistas
15 están debatiendo
$#BinanceLaunchesBinanceIntelligence
🤖 EL FUTURO DEL TRADING: ¡Binance lanza Binance Intelligence! 🚀
Binance ha presentado oficialmente Binance Intelligence, un conjunto integral de productos de IA diseñado para incorporar la inteligencia artificial directamente al trading de criptomonedas, acciones y ETF.
Esto es lo que incluye el nuevo ecosistema:
🔹 Binance AI: feeds personalizados «Para ti» basados en IA, sugerencias inteligentes y resúmenes automatizados de 4 horas sobre los mercados y la macroeconomía.
🔹 Binance AI Pro: Convierte instrucciones en texto sin formato en estrategias de trading totalmente ejecutables y probadas retrospectivamente, con la seguridad de una subcuenta aislada.
🔹 Binance Agent OS: Un ecosistema para desarrolladores que conecta agentes de IA directamente mediante API, Skill Hub y herramientas Web3.
¿Te entusiasma crear estrategias de trading con instrucciones en lenguaje natural? 👇
#CryptoAi #BİNANCE #CryptoNews #BinanceSquare
舍利子 crypto24india
·1 me gusta
·1 vistas
EvernorthXRPTreasuryCompletesSPACMerger
324 vistas
32 están debatiendo
ADAGains10%Above$0.27
16,570 vistas
183 están debatiendo