

REACHER _Crypto
8.6k Publicaciones

REACHER _Crypto
Denunciar
Bloquear usuario
Web3 boy I Crypto never sleeps neither do profits Turning volatility into opportunity I Think. Trade. Earn. Repeat. #BinanceLife
488 Siguiendo
19.8K+ Seguidores
11.3K+ Me gusta
Publicaciones
Todo
Citas
Videos
Live
JUST IN: Los clientes de BlackRock compran bienes por 108,44 millones de $BTC .
#BTCBreaks80K #BitcoinMarketCapTopsTesla #SOLJumpsAbout10% #SECReceivesAmendedInjectiveETFFiling
JUST IN: Los clientes de BlackRock compran bienes por 108,44 millones de $BTC .
#BTCBreaks80K #BitcoinMarketCapTopsTesla #SOLJumpsAbout10% #SECReceivesAmendedInjectiveETFFiling
#BTCBreaks80K #BitcoinMarketCapTopsTesla #SOLJumpsAbout10% #SECReceivesAmendedInjectiveETFFiling
90
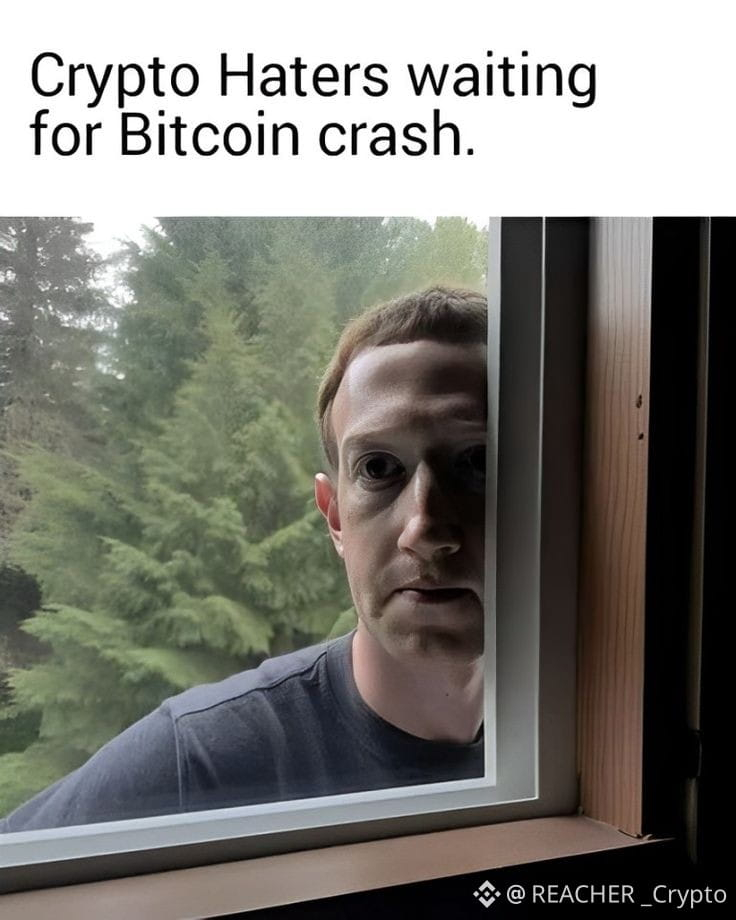
Todavía esperando ese crac de Bitcoin… 👀😂
$BTC
#AnthropicCEOCallsForAISlowdown #US10YearTreasuryYieldNears5% #TokenizedStockHoldersUp619.1% #RevolutConfirmsFakeGovEmailDataBreach
Todavía esperando ese crac de Bitcoin… 👀😂
$BTC
#AnthropicCEOCallsForAISlowdown #US10YearTreasuryYieldNears5% #TokenizedStockHoldersUp619.1% #RevolutConfirmsFakeGovEmailDataBreach
$BTC
#AnthropicCEOCallsForAISlowdown #US10YearTreasuryYieldNears5% #TokenizedStockHoldersUp619.1% #RevolutConfirmsFakeGovEmailDataBreach
113
Creo que la gente se está enfocando en la parte equivocada de las últimas cifras de ETF de Bitcoin.
No es solo que $1.01B haya entrado en los ETF estadounidenses de Bitcoin spot durante tres días de negociación.
Es quién tuvo que vender el BTC del otro lado.
Solo el 3 de septiembre, las entradas a los ETF alcanzaron $730.8M.
A unos $78K–$79K por BTC, eso equivale aproximadamente a 13,000 BTC en demanda.
Y aquí es donde se pone interesante.
La oferta de tenedores a largo plazo ha subido hasta alrededor de 16.5M BTC.
Eso es cerca del 79% del suministro eventual de 21M de Bitcoin.
Pero no creo que la conclusión deba ser:
“79% de BTC está bloqueado, así que se está acabando el suministro.”
Eso es demasiado simple.
Los tenedores a largo plazo pueden vender.
Lo que me interesa es qué tan rápido distribuyen cuando llega una nueva demanda.
Porque si los ETF siguen absorbiendo miles de millones mientras los tenedores a largo plazo continúan aferrados a sus monedas, el mercado no necesita una escasez de oferta enorme para subir.
Solo necesita que la nueva demanda crezca más rápido que los vendedores dispuestos.
Esa es la parte oculta de este planteamiento.
Y hay otra cara.
Si BTC sigue empujando más alto, esos tenedores a largo plazo de repente tienen un incentivo mucho mayor para tomar ganancias.
Así que ahora estoy vigilando tres cosas:
• Flujos de ETF: ¿el estallido de $1B continúa?
• Distribución de LTH: ¿los tenedores más antiguos realmente están vendiendo ante esta demanda?
• Reacción del precio: ¿puede BTC superar la zona de $82.8K sin un aumento importante de la presión de venta?
Si la demanda de ETF se mantiene fuerte y las ventas de LTH siguen controladas, Bitcoin podría volverse cada vez más sensible a cambios relativamente pequeños en la demanda.
Pero si los tenedores antiguos empiezan a distribuir con agresividad, ese relato de “apretón de oferta” puede desaparecer muy rápidamente.
Por eso estoy vigilando al vendedor, no solo al comprador.
$BTC
{future}(BTCUSDT)
Creo que la gente se está enfocando en la parte equivocada de las últimas cifras de ETF de Bitcoin.
No es solo que $1.01B haya entrado en los ETF estadounidenses de Bitcoin spot durante tres días de negociación.
Es quién tuvo que vender el BTC del otro lado.
Solo el 3 de septiembre, las entradas a los ETF alcanzaron $730.8M.
A unos $78K–$79K por BTC, eso equivale aproximadamente a 13,000 BTC en demanda.
Y aquí es donde se pone interesante.
La oferta de tenedores a largo plazo ha subido hasta alrededor de 16.5M BTC.
Eso es cerca del 79% del suministro eventual de 21M de Bitcoin.
Pero no creo que la conclusión deba ser:
“79% de BTC está bloqueado, así que se está acabando el suministro.”
Eso es demasiado simple.
Los tenedores a largo plazo pueden vender.
Lo que me interesa es qué tan rápido distribuyen cuando llega una nueva demanda.
Porque si los ETF siguen absorbiendo miles de millones mientras los tenedores a largo plazo continúan aferrados a sus monedas, el mercado no necesita una escasez de oferta enorme para subir.
Solo necesita que la nueva demanda crezca más rápido que los vendedores dispuestos.
Esa es la parte oculta de este planteamiento.
Y hay otra cara.
Si BTC sigue empujando más alto, esos tenedores a largo plazo de repente tienen un incentivo mucho mayor para tomar ganancias.
Así que ahora estoy vigilando tres cosas:
• Flujos de ETF: ¿el estallido de $1B continúa?
• Distribución de LTH: ¿los tenedores más antiguos realmente están vendiendo ante esta demanda?
• Reacción del precio: ¿puede BTC superar la zona de $82.8K sin un aumento importante de la presión de venta?
Si la demanda de ETF se mantiene fuerte y las ventas de LTH siguen controladas, Bitcoin podría volverse cada vez más sensible a cambios relativamente pequeños en la demanda.
Pero si los tenedores antiguos empiezan a distribuir con agresividad, ese relato de “apretón de oferta” puede desaparecer muy rápidamente.
Por eso estoy vigilando al vendedor, no solo al comprador.
$BTC
No es solo que $1.01B haya entrado en los ETF estadounidenses de Bitcoin spot durante tres días de negociación.
Es quién tuvo que vender el BTC del otro lado.
Solo el 3 de septiembre, las entradas a los ETF alcanzaron $730.8M.
A unos $78K–$79K por BTC, eso equivale aproximadamente a 13,000 BTC en demanda.
Y aquí es donde se pone interesante.
La oferta de tenedores a largo plazo ha subido hasta alrededor de 16.5M BTC.
Eso es cerca del 79% del suministro eventual de 21M de Bitcoin.
Pero no creo que la conclusión deba ser:
“79% de BTC está bloqueado, así que se está acabando el suministro.”
Eso es demasiado simple.
Los tenedores a largo plazo pueden vender.
Lo que me interesa es qué tan rápido distribuyen cuando llega una nueva demanda.
Porque si los ETF siguen absorbiendo miles de millones mientras los tenedores a largo plazo continúan aferrados a sus monedas, el mercado no necesita una escasez de oferta enorme para subir.
Solo necesita que la nueva demanda crezca más rápido que los vendedores dispuestos.
Esa es la parte oculta de este planteamiento.
Y hay otra cara.
Si BTC sigue empujando más alto, esos tenedores a largo plazo de repente tienen un incentivo mucho mayor para tomar ganancias.
Así que ahora estoy vigilando tres cosas:
• Flujos de ETF: ¿el estallido de $1B continúa?
• Distribución de LTH: ¿los tenedores más antiguos realmente están vendiendo ante esta demanda?
• Reacción del precio: ¿puede BTC superar la zona de $82.8K sin un aumento importante de la presión de venta?
Si la demanda de ETF se mantiene fuerte y las ventas de LTH siguen controladas, Bitcoin podría volverse cada vez más sensible a cambios relativamente pequeños en la demanda.
Pero si los tenedores antiguos empiezan a distribuir con agresividad, ese relato de “apretón de oferta” puede desaparecer muy rápidamente.
Por eso estoy vigilando al vendedor, no solo al comprador.
$BTC
96
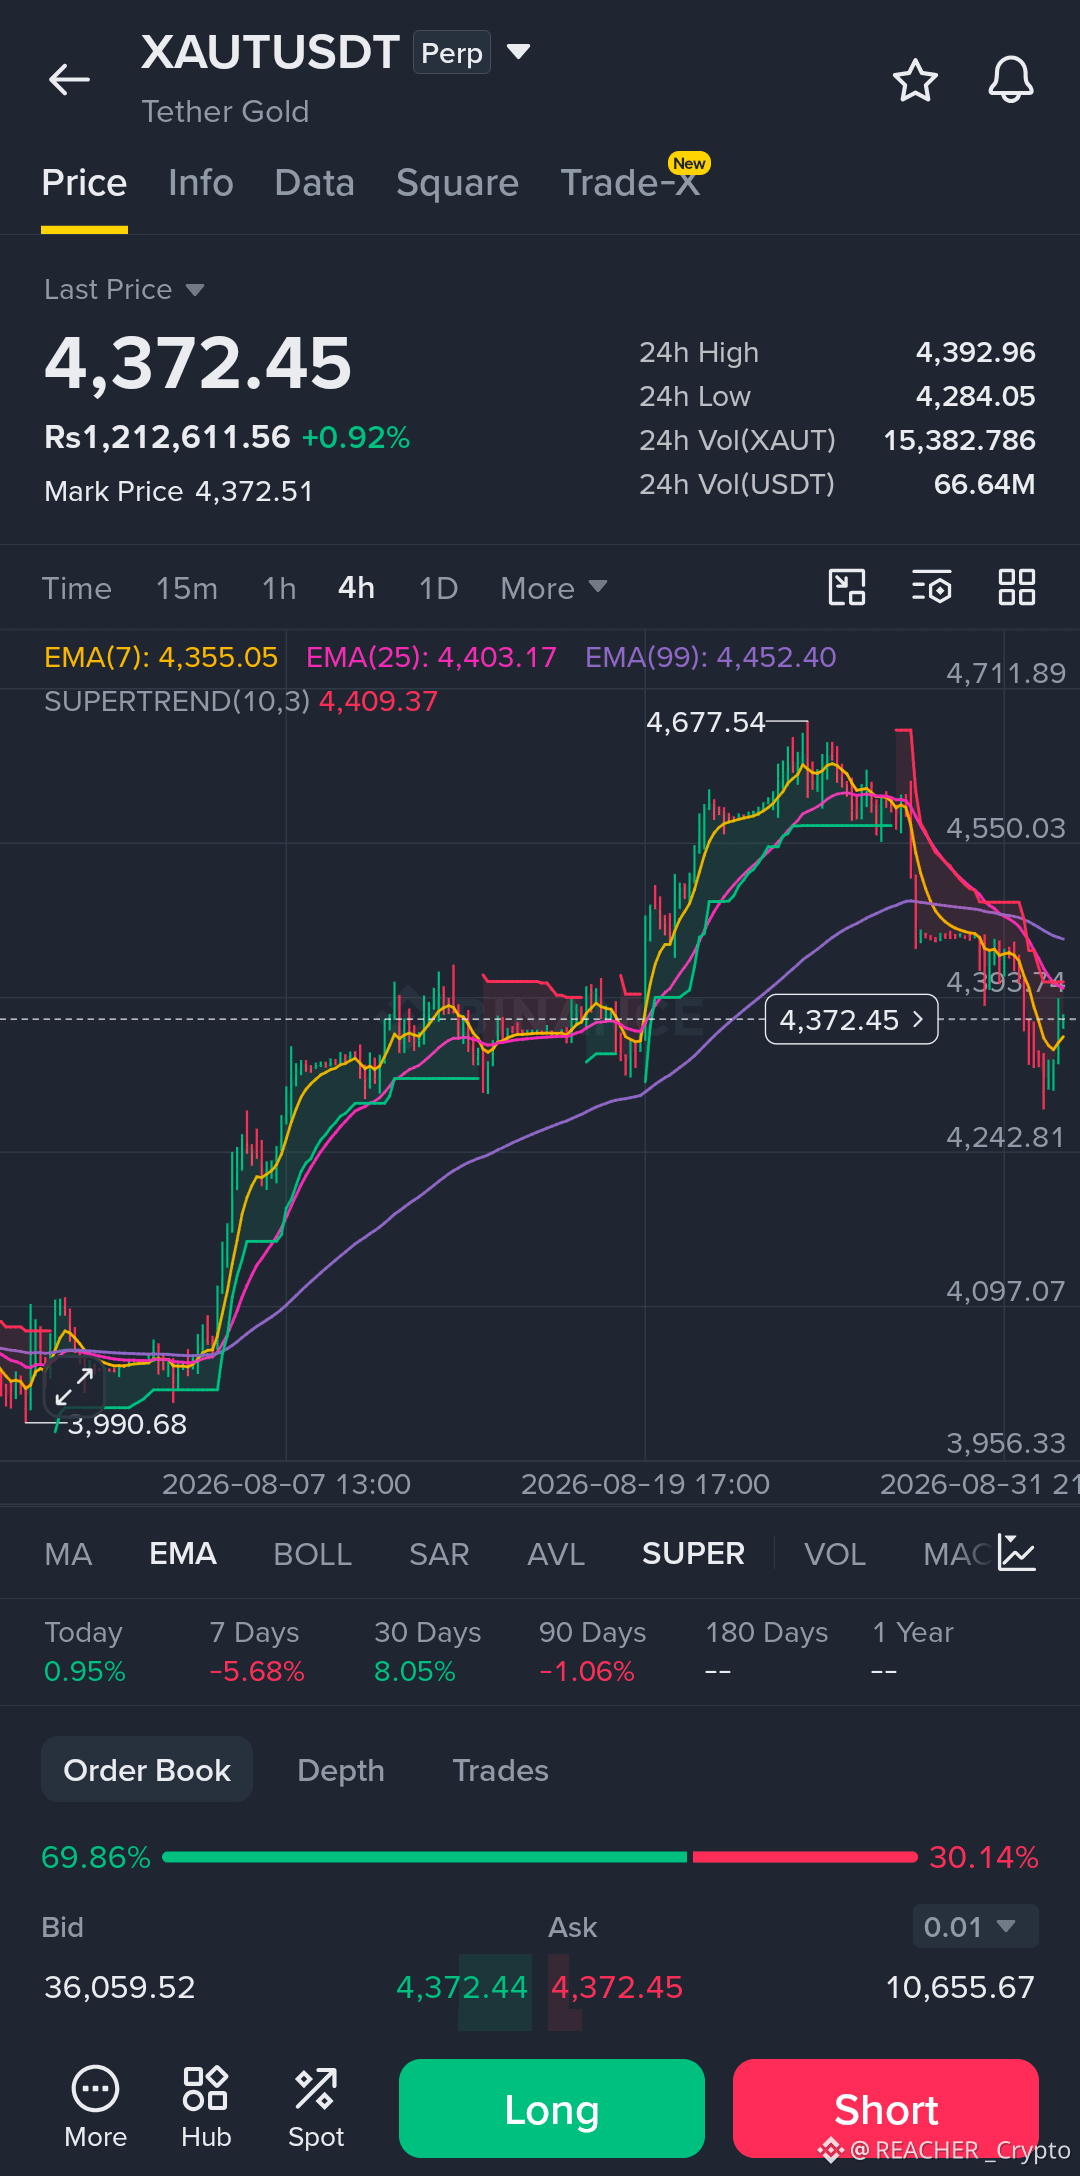
He estado observando XAUTUSDT desde hace un tiempo y algo sobre la acción actual del precio se siente como un momento decisivo. Estamos en un punto crítico alrededor del nivel de $4,372, que actualmente está funcionando tanto como soporte como resistencia.
La zona de soporte inmediata que hay que vigilar es el mínimo reciente cerca de $4,284. Una ruptura por debajo de este nivel podría provocar una caída hacia el siguiente soporte significativo en $4,200, que coincide con el mínimo de 90 días y la Banda de Bollinger inferior. Por el contrario, para un movimiento alcista, el precio necesita romper y mantenerse por encima de la EMA(25) en $4,403 y de la resistencia del SuperTrend en $4,409. Un cierre decisivo por encima de estos niveles podría confirmar una reversión alcista y abrir la puerta a volver a probar la EMA(99) en $4,452 y el máximo reciente cerca de $4,677.
También es crucial tener en cuenta el volumen de 24 horas, que muestra una participación significativa, haciendo que estos niveles clave sean aún más importantes. Una lección que he aprendido después de demasiadas entradas tempranas es que esperar la confirmación normalmente ahorra más dinero que perseguir las velas. Así que no estoy entrando a la carrera en una posición.
Estoy buscando una ruptura clara por encima de $4,410 con un volumen fuerte para una posible entrada larga, con objetivo en $4,450 y $4,677. Mi riesgo estaría definido por un stop-loss por debajo del mínimo de $4,284. Alternativamente, una caída por debajo de $4,284 podría ser una oportunidad para considerar un short, pero querría ver un cierre limpio por debajo de ese nivel para confirmar el movimiento. Recuerda siempre respetar tu stop loss; no hay ninguna configuración garantizada en este mercado.
¿Qué piensas que es el nivel más significativo en este gráfico que podría determinar el próximo gran movimiento?
$XAUT
{future}(XAUTUSDT)
#SolanaFallsOver3% #DellSurges8%OnEarningsBeat #USAugADPJobsSmallestGainSinceJan #OpenAISaysAstraFindsFlawsAutonomously
He estado observando XAUTUSDT desde hace un tiempo y algo sobre la acción actual del precio se siente como un momento decisivo. Estamos en un punto crítico alrededor del nivel de $4,372, que actualmente está funcionando tanto como soporte como resistencia.
La zona de soporte inmediata que hay que vigilar es el mínimo reciente cerca de $4,284. Una ruptura por debajo de este nivel podría provocar una caída hacia el siguiente soporte significativo en $4,200, que coincide con el mínimo de 90 días y la Banda de Bollinger inferior. Por el contrario, para un movimiento alcista, el precio necesita romper y mantenerse por encima de la EMA(25) en $4,403 y de la resistencia del SuperTrend en $4,409. Un cierre decisivo por encima de estos niveles podría confirmar una reversión alcista y abrir la puerta a volver a probar la EMA(99) en $4,452 y el máximo reciente cerca de $4,677.
También es crucial tener en cuenta el volumen de 24 horas, que muestra una participación significativa, haciendo que estos niveles clave sean aún más importantes. Una lección que he aprendido después de demasiadas entradas tempranas es que esperar la confirmación normalmente ahorra más dinero que perseguir las velas. Así que no estoy entrando a la carrera en una posición.
Estoy buscando una ruptura clara por encima de $4,410 con un volumen fuerte para una posible entrada larga, con objetivo en $4,450 y $4,677. Mi riesgo estaría definido por un stop-loss por debajo del mínimo de $4,284. Alternativamente, una caída por debajo de $4,284 podría ser una oportunidad para considerar un short, pero querría ver un cierre limpio por debajo de ese nivel para confirmar el movimiento. Recuerda siempre respetar tu stop loss; no hay ninguna configuración garantizada en este mercado.
¿Qué piensas que es el nivel más significativo en este gráfico que podría determinar el próximo gran movimiento?
$XAUT
#SolanaFallsOver3% #DellSurges8%OnEarningsBeat #USAugADPJobsSmallestGainSinceJan #OpenAISaysAstraFindsFlawsAutonomously
La zona de soporte inmediata que hay que vigilar es el mínimo reciente cerca de $4,284. Una ruptura por debajo de este nivel podría provocar una caída hacia el siguiente soporte significativo en $4,200, que coincide con el mínimo de 90 días y la Banda de Bollinger inferior. Por el contrario, para un movimiento alcista, el precio necesita romper y mantenerse por encima de la EMA(25) en $4,403 y de la resistencia del SuperTrend en $4,409. Un cierre decisivo por encima de estos niveles podría confirmar una reversión alcista y abrir la puerta a volver a probar la EMA(99) en $4,452 y el máximo reciente cerca de $4,677.
También es crucial tener en cuenta el volumen de 24 horas, que muestra una participación significativa, haciendo que estos niveles clave sean aún más importantes. Una lección que he aprendido después de demasiadas entradas tempranas es que esperar la confirmación normalmente ahorra más dinero que perseguir las velas. Así que no estoy entrando a la carrera en una posición.
Estoy buscando una ruptura clara por encima de $4,410 con un volumen fuerte para una posible entrada larga, con objetivo en $4,450 y $4,677. Mi riesgo estaría definido por un stop-loss por debajo del mínimo de $4,284. Alternativamente, una caída por debajo de $4,284 podría ser una oportunidad para considerar un short, pero querría ver un cierre limpio por debajo de ese nivel para confirmar el movimiento. Recuerda siempre respetar tu stop loss; no hay ninguna configuración garantizada en este mercado.
¿Qué piensas que es el nivel más significativo en este gráfico que podría determinar el próximo gran movimiento?
$XAUT
#SolanaFallsOver3% #DellSurges8%OnEarningsBeat #USAugADPJobsSmallestGainSinceJan #OpenAISaysAstraFindsFlawsAutonomously
158
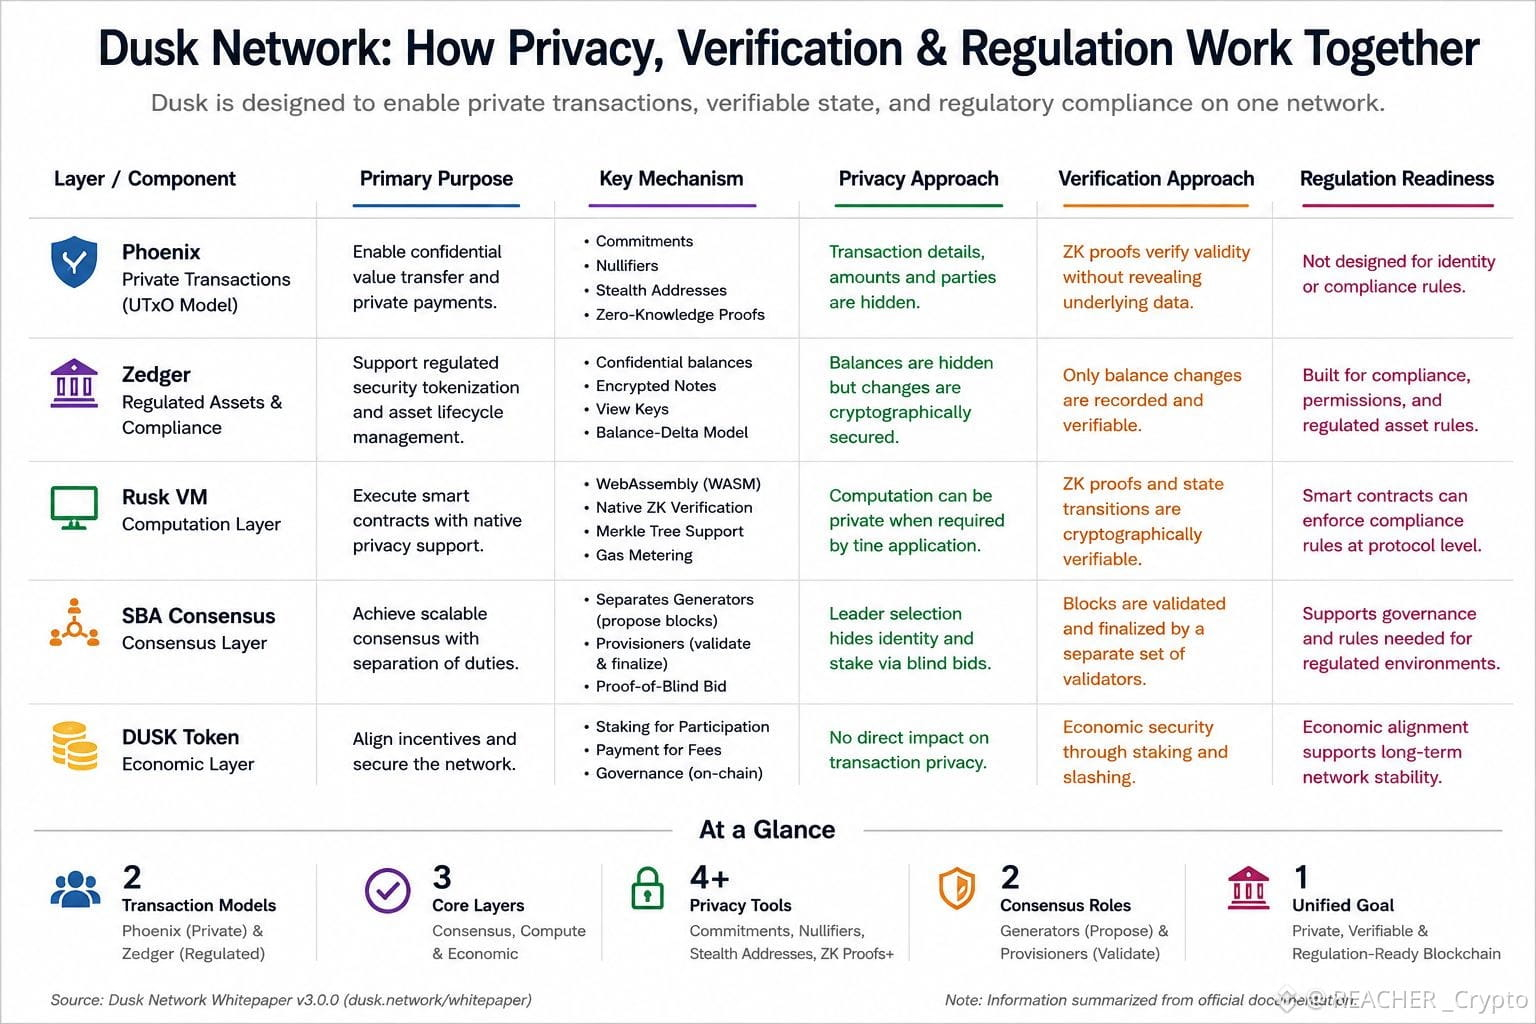
#dusk $DUSK @Dusk_Foundation Empecé a mirar Dusk por su historia sobre la privacidad.
Pero después de revisar el whitepaper, creo que en realidad es una forma demasiado estrecha de verlo.
Lo que llamó mi atención es el problema más grande que Dusk está intentando resolver:
¿Puede la información financiera mantenerse privada sin volver el sistema imposible de verificar o regular?
Ese es un problema mucho más difícil.
Dusk lo aborda con distintas piezas que hacen trabajos diferentes. Phoenix gestiona el gasto confidencial mediante un modelo basado en UTxO, mientras que Zedger está diseñado para la tokenización de valores regulados y la gestión de su ciclo de vida. Luego, la VM Rusk incorpora cosas como la verificación de pruebas de conocimiento cero nativas y el soporte de árboles de Merkle en la capa de cómputo.
Incluso el diseño del consenso sigue el mismo razonamiento.
SBA separa la producción de bloques de la validación y la finalización. Los generadores se seleccionan mediante Proof-of-Blind Bid, mientras que los Provisioners validan y finalizan los bloques.
Así que la idea interesante no es simplemente “Dusk hace la blockchain privada”.
Está más cerca de:
No necesariamente necesitas exponerlo todo para demostrar que todo es válido.
Esa distinción podría importar muchísimo para los mercados financieros regulados.
Pero aquí es donde tampoco estoy listo para sacar conclusiones.
Un protocolo bien diseñado sobre el papel no significa automáticamente que el mismo diseño funcione con fluidez con reguladores reales, instituciones reales, liquidez real y usuarios reales.
Esa es la parte que estaría observando.
Porque la prueba real para Dusk no es si puede hacer que las transacciones sean privadas.
La cuestión es si la privacidad, la verificación y los requisitos regulatorios pueden realmente coexistir cuando la red tiene que operar a una escala financiera real.
#dusk $DUSK @Dusk Empecé a mirar Dusk por su historia sobre la privacidad.
Pero después de revisar el whitepaper, creo que en realidad es una forma demasiado estrecha de verlo.
Lo que llamó mi atención es el problema más grande que Dusk está intentando resolver:
¿Puede la información financiera mantenerse privada sin volver el sistema imposible de verificar o regular?
Ese es un problema mucho más difícil.
Dusk lo aborda con distintas piezas que hacen trabajos diferentes. Phoenix gestiona el gasto confidencial mediante un modelo basado en UTxO, mientras que Zedger está diseñado para la tokenización de valores regulados y la gestión de su ciclo de vida. Luego, la VM Rusk incorpora cosas como la verificación de pruebas de conocimiento cero nativas y el soporte de árboles de Merkle en la capa de cómputo.
Incluso el diseño del consenso sigue el mismo razonamiento.
SBA separa la producción de bloques de la validación y la finalización. Los generadores se seleccionan mediante Proof-of-Blind Bid, mientras que los Provisioners validan y finalizan los bloques.
Así que la idea interesante no es simplemente “Dusk hace la blockchain privada”.
Está más cerca de:
No necesariamente necesitas exponerlo todo para demostrar que todo es válido.
Esa distinción podría importar muchísimo para los mercados financieros regulados.
Pero aquí es donde tampoco estoy listo para sacar conclusiones.
Un protocolo bien diseñado sobre el papel no significa automáticamente que el mismo diseño funcione con fluidez con reguladores reales, instituciones reales, liquidez real y usuarios reales.
Esa es la parte que estaría observando.
Porque la prueba real para Dusk no es si puede hacer que las transacciones sean privadas.
La cuestión es si la privacidad, la verificación y los requisitos regulatorios pueden realmente coexistir cuando la red tiene que operar a una escala financiera real.
Pero después de revisar el whitepaper, creo que en realidad es una forma demasiado estrecha de verlo.
Lo que llamó mi atención es el problema más grande que Dusk está intentando resolver:
¿Puede la información financiera mantenerse privada sin volver el sistema imposible de verificar o regular?
Ese es un problema mucho más difícil.
Dusk lo aborda con distintas piezas que hacen trabajos diferentes. Phoenix gestiona el gasto confidencial mediante un modelo basado en UTxO, mientras que Zedger está diseñado para la tokenización de valores regulados y la gestión de su ciclo de vida. Luego, la VM Rusk incorpora cosas como la verificación de pruebas de conocimiento cero nativas y el soporte de árboles de Merkle en la capa de cómputo.
Incluso el diseño del consenso sigue el mismo razonamiento.
SBA separa la producción de bloques de la validación y la finalización. Los generadores se seleccionan mediante Proof-of-Blind Bid, mientras que los Provisioners validan y finalizan los bloques.
Así que la idea interesante no es simplemente “Dusk hace la blockchain privada”.
Está más cerca de:
No necesariamente necesitas exponerlo todo para demostrar que todo es válido.
Esa distinción podría importar muchísimo para los mercados financieros regulados.
Pero aquí es donde tampoco estoy listo para sacar conclusiones.
Un protocolo bien diseñado sobre el papel no significa automáticamente que el mismo diseño funcione con fluidez con reguladores reales, instituciones reales, liquidez real y usuarios reales.
Esa es la parte que estaría observando.
Porque la prueba real para Dusk no es si puede hacer que las transacciones sean privadas.
La cuestión es si la privacidad, la verificación y los requisitos regulatorios pueden realmente coexistir cuando la red tiene que operar a una escala financiera real.
1
242
#dusk $DUSK @Dusk_Foundation I inicialmente pensé que la utilidad de DUSK se basaba básicamente en dos cosas: apostar y gas.
Luego empecé a mapear los roles más pequeños en la propia documentación de Dusk, y esa suposición se volvió más difícil de defender.
DUSK asegura el consenso, paga comisiones de transacciones, financia el despliegue de smart contracts y liquida pagos de servicios para dApps. Incluso el lado del gas tiene más estructura de la que esperaba: Dusk usa una subasta generalizada de primera puja, donde los usuarios ofertan un gasprice y los bloques aceptan transacciones dentro de su límite de gas.
Pero la parte a la que sigo volviendo se encuentra fuera de esas funciones evidentes.
También se documenta que DUSK es la moneda objetivo para los pagos de dividendos dentro de contratos XSC, y como un depósito de seguridad requerido para emitir activos digitales regulados.
Eso se siente diferente de la utilidad ordinaria de un L1.
Esos roles colocan a DUSK dentro de reglas económicas específicas en torno a activos regulados, no solo dentro de la maquinaria necesaria para ejecutar la red.
Aun así, no lo convertiría en una tesis de demanda. No he encontrado una descomposición clara que muestre cuánta actividad real proviene de dividendos o depósitos de seguridad frente a la apuesta y las comisiones básicas.
Y quizá esa sea la brecha más interesante.
La documentación me dice dónde DUSK puede importar.
Todavía no me dice cuál de esos roles importa económicamente.
Esa es la distinción que querría medir a continuación.
#dusk
#dusk $DUSK @Dusk I inicialmente pensé que la utilidad de DUSK se basaba básicamente en dos cosas: apostar y gas.
Luego empecé a mapear los roles más pequeños en la propia documentación de Dusk, y esa suposición se volvió más difícil de defender.
DUSK asegura el consenso, paga comisiones de transacciones, financia el despliegue de smart contracts y liquida pagos de servicios para dApps. Incluso el lado del gas tiene más estructura de la que esperaba: Dusk usa una subasta generalizada de primera puja, donde los usuarios ofertan un gasprice y los bloques aceptan transacciones dentro de su límite de gas.
Pero la parte a la que sigo volviendo se encuentra fuera de esas funciones evidentes.
También se documenta que DUSK es la moneda objetivo para los pagos de dividendos dentro de contratos XSC, y como un depósito de seguridad requerido para emitir activos digitales regulados.
Eso se siente diferente de la utilidad ordinaria de un L1.
Esos roles colocan a DUSK dentro de reglas económicas específicas en torno a activos regulados, no solo dentro de la maquinaria necesaria para ejecutar la red.
Aun así, no lo convertiría en una tesis de demanda. No he encontrado una descomposición clara que muestre cuánta actividad real proviene de dividendos o depósitos de seguridad frente a la apuesta y las comisiones básicas.
Y quizá esa sea la brecha más interesante.
La documentación me dice dónde DUSK puede importar.
Todavía no me dice cuál de esos roles importa económicamente.
Esa es la distinción que querría medir a continuación.
#dusk
Luego empecé a mapear los roles más pequeños en la propia documentación de Dusk, y esa suposición se volvió más difícil de defender.
DUSK asegura el consenso, paga comisiones de transacciones, financia el despliegue de smart contracts y liquida pagos de servicios para dApps. Incluso el lado del gas tiene más estructura de la que esperaba: Dusk usa una subasta generalizada de primera puja, donde los usuarios ofertan un gasprice y los bloques aceptan transacciones dentro de su límite de gas.
Pero la parte a la que sigo volviendo se encuentra fuera de esas funciones evidentes.
También se documenta que DUSK es la moneda objetivo para los pagos de dividendos dentro de contratos XSC, y como un depósito de seguridad requerido para emitir activos digitales regulados.
Eso se siente diferente de la utilidad ordinaria de un L1.
Esos roles colocan a DUSK dentro de reglas económicas específicas en torno a activos regulados, no solo dentro de la maquinaria necesaria para ejecutar la red.
Aun así, no lo convertiría en una tesis de demanda. No he encontrado una descomposición clara que muestre cuánta actividad real proviene de dividendos o depósitos de seguridad frente a la apuesta y las comisiones básicas.
Y quizá esa sea la brecha más interesante.
La documentación me dice dónde DUSK puede importar.
Todavía no me dice cuál de esos roles importa económicamente.
Esa es la distinción que querría medir a continuación.
#dusk
4
2
216
#dusk $DUSK @Dusk_Foundation I seguí volviendo a una cosa en el desarrollo reciente de Dusk, y no es la criptografía en sí.
Es el esfuerzo por hacer que la misma criptografía funcione mejor.
El trabajo de rendimiento de PLONK no reemplazó las matemáticas subyacentes, el transcripto ni el formato de la prueba. En cambio, Dusk fue tras el trabajo desperdiciado alrededor de ellos: almacenar en caché datos deterministas, agrupar inversiones y operaciones de MSM, paralelizar tareas independientes de FFT y evitar cómputos repetidos.
El resultado me llamó la atención: el tiempo de prueba bajó 58%, aproximadamente 2.4x el rendimiento de pruebas, la verificación fue 44% más rápida y la compilación 25% más rápida.
Pero, honestamente, los números son casi secundarios.
Lo que me interesa es lo que revelan sobre el siguiente problema.
La privacidad puede ser matemáticamente sólida y aun así volverse poco práctica si la generación, la verificación o la ejecución no logran seguir el ritmo.
Veo una pregunta similar en las pruebas de DuskEVM × DuskDS. Se están empujando diferentes modelos de ejecución y de estado a través de cargas de trabajo mixtas en lugar de juzgarlos por separado.
Eso se siente más cercano al desafío real: no si cada pieza funciona, sino si siguen funcionando juntas cuando el sistema se pone ocupado.
Así que empiezo a preguntarme si el problema de ingeniería más difícil de Dusk ya no es hacer que funcione la privacidad.
Es lograr que la privacidad, la ejecución y la coordinación se sientan casi invisibles para el usuario.
Probablemente esa sea la prueba más interesante.
#dusk
#dusk $DUSK @Dusk I seguí volviendo a una cosa en el desarrollo reciente de Dusk, y no es la criptografía en sí.
Es el esfuerzo por hacer que la misma criptografía funcione mejor.
El trabajo de rendimiento de PLONK no reemplazó las matemáticas subyacentes, el transcripto ni el formato de la prueba. En cambio, Dusk fue tras el trabajo desperdiciado alrededor de ellos: almacenar en caché datos deterministas, agrupar inversiones y operaciones de MSM, paralelizar tareas independientes de FFT y evitar cómputos repetidos.
El resultado me llamó la atención: el tiempo de prueba bajó 58%, aproximadamente 2.4x el rendimiento de pruebas, la verificación fue 44% más rápida y la compilación 25% más rápida.
Pero, honestamente, los números son casi secundarios.
Lo que me interesa es lo que revelan sobre el siguiente problema.
La privacidad puede ser matemáticamente sólida y aun así volverse poco práctica si la generación, la verificación o la ejecución no logran seguir el ritmo.
Veo una pregunta similar en las pruebas de DuskEVM × DuskDS. Se están empujando diferentes modelos de ejecución y de estado a través de cargas de trabajo mixtas en lugar de juzgarlos por separado.
Eso se siente más cercano al desafío real: no si cada pieza funciona, sino si siguen funcionando juntas cuando el sistema se pone ocupado.
Así que empiezo a preguntarme si el problema de ingeniería más difícil de Dusk ya no es hacer que funcione la privacidad.
Es lograr que la privacidad, la ejecución y la coordinación se sientan casi invisibles para el usuario.
Probablemente esa sea la prueba más interesante.
#dusk
Es el esfuerzo por hacer que la misma criptografía funcione mejor.
El trabajo de rendimiento de PLONK no reemplazó las matemáticas subyacentes, el transcripto ni el formato de la prueba. En cambio, Dusk fue tras el trabajo desperdiciado alrededor de ellos: almacenar en caché datos deterministas, agrupar inversiones y operaciones de MSM, paralelizar tareas independientes de FFT y evitar cómputos repetidos.
El resultado me llamó la atención: el tiempo de prueba bajó 58%, aproximadamente 2.4x el rendimiento de pruebas, la verificación fue 44% más rápida y la compilación 25% más rápida.
Pero, honestamente, los números son casi secundarios.
Lo que me interesa es lo que revelan sobre el siguiente problema.
La privacidad puede ser matemáticamente sólida y aun así volverse poco práctica si la generación, la verificación o la ejecución no logran seguir el ritmo.
Veo una pregunta similar en las pruebas de DuskEVM × DuskDS. Se están empujando diferentes modelos de ejecución y de estado a través de cargas de trabajo mixtas en lugar de juzgarlos por separado.
Eso se siente más cercano al desafío real: no si cada pieza funciona, sino si siguen funcionando juntas cuando el sistema se pone ocupado.
Así que empiezo a preguntarme si el problema de ingeniería más difícil de Dusk ya no es hacer que funcione la privacidad.
Es lograr que la privacidad, la ejecución y la coordinación se sientan casi invisibles para el usuario.
Probablemente esa sea la prueba más interesante.
#dusk
218
#dusk $DUSK @Dusk_Foundation I inicialmente pensé que la parte interesante del Zedger de Dusk era simplemente poner activos regulados en la cadena.
Después de profundizar, estoy menos convencido de que esa sea la parte difícil.
Los valores ya vienen con reglas que los tokens ordinarios no. Las posiciones pueden emitirse o quemarse, los dividendos y las acciones corporativas tienen que ejecutarse correctamente, las transferencias pueden restringirse e incluso las transferencias forzadas pueden formar parte del ciclo de vida del activo.
Así que la normativa no puede ser realmente una capa de reporte que esté junto al libro mayor.
Tiene que formar parte de cómo se comporta el activo.
Pero eso me plantea un problema más interesante:
Si una posición regulada necesita ser auditable, ¿cuánto del wallet realmente tiene que hacerse visible?
Una revisión legal podría necesitar la prueba de que una posición existe, se movió o fue congelada.
Eso no justifica automáticamente exponer notas blindadas no relacionadas o el historial de transacciones alrededor de ella.
Aquí es donde la arquitectura de Dusk empieza a sentirse más matizada.
El verdadero desafío puede no ser hacer que los RWA sean compatibles.
Puede ser hacer que la compatibilidad sea precisa.
Demuestra la afirmación regulada. Mantén todo lo que esté fuera de esa afirmación en privado.
Porque, una vez que una divulgación más amplia se convierte en la opción conveniente, la privacidad puede desaparecer sin que el protocolo elija explícitamente eliminarla.
Sigo volviendo a ese límite.
¿Puede Dusk hacer que los activos regulados sean auditables sin hacer que las personas que los mantienen sean innecesariamente transparentes?
#dusk
#dusk $DUSK @Dusk I inicialmente pensé que la parte interesante del Zedger de Dusk era simplemente poner activos regulados en la cadena.
Después de profundizar, estoy menos convencido de que esa sea la parte difícil.
Los valores ya vienen con reglas que los tokens ordinarios no. Las posiciones pueden emitirse o quemarse, los dividendos y las acciones corporativas tienen que ejecutarse correctamente, las transferencias pueden restringirse e incluso las transferencias forzadas pueden formar parte del ciclo de vida del activo.
Así que la normativa no puede ser realmente una capa de reporte que esté junto al libro mayor.
Tiene que formar parte de cómo se comporta el activo.
Pero eso me plantea un problema más interesante:
Si una posición regulada necesita ser auditable, ¿cuánto del wallet realmente tiene que hacerse visible?
Una revisión legal podría necesitar la prueba de que una posición existe, se movió o fue congelada.
Eso no justifica automáticamente exponer notas blindadas no relacionadas o el historial de transacciones alrededor de ella.
Aquí es donde la arquitectura de Dusk empieza a sentirse más matizada.
El verdadero desafío puede no ser hacer que los RWA sean compatibles.
Puede ser hacer que la compatibilidad sea precisa.
Demuestra la afirmación regulada. Mantén todo lo que esté fuera de esa afirmación en privado.
Porque, una vez que una divulgación más amplia se convierte en la opción conveniente, la privacidad puede desaparecer sin que el protocolo elija explícitamente eliminarla.
Sigo volviendo a ese límite.
¿Puede Dusk hacer que los activos regulados sean auditables sin hacer que las personas que los mantienen sean innecesariamente transparentes?
#dusk
Después de profundizar, estoy menos convencido de que esa sea la parte difícil.
Los valores ya vienen con reglas que los tokens ordinarios no. Las posiciones pueden emitirse o quemarse, los dividendos y las acciones corporativas tienen que ejecutarse correctamente, las transferencias pueden restringirse e incluso las transferencias forzadas pueden formar parte del ciclo de vida del activo.
Así que la normativa no puede ser realmente una capa de reporte que esté junto al libro mayor.
Tiene que formar parte de cómo se comporta el activo.
Pero eso me plantea un problema más interesante:
Si una posición regulada necesita ser auditable, ¿cuánto del wallet realmente tiene que hacerse visible?
Una revisión legal podría necesitar la prueba de que una posición existe, se movió o fue congelada.
Eso no justifica automáticamente exponer notas blindadas no relacionadas o el historial de transacciones alrededor de ella.
Aquí es donde la arquitectura de Dusk empieza a sentirse más matizada.
El verdadero desafío puede no ser hacer que los RWA sean compatibles.
Puede ser hacer que la compatibilidad sea precisa.
Demuestra la afirmación regulada. Mantén todo lo que esté fuera de esa afirmación en privado.
Porque, una vez que una divulgación más amplia se convierte en la opción conveniente, la privacidad puede desaparecer sin que el protocolo elija explícitamente eliminarla.
Sigo volviendo a ese límite.
¿Puede Dusk hacer que los activos regulados sean auditables sin hacer que las personas que los mantienen sean innecesariamente transparentes?
#dusk
1
269
#dusk $DUSK @Dusk_Foundation 1Sigo volviendo a una contradicción en @Dusk que inicialmente pasé por alto:
Cuanto más se vuelve privada la conformidad, más importante se vuelve la confianza detrás de esa conformidad.
$DUSK está alrededor de 0,087 USD, aproximadamente un 21% arriba en 24H, con unos 10,8M de volumen. El movimiento se nota, pero el precio sigue siendo la parte más fácil de explicar.
Lo que me resulta más difícil de ignorar es Citadel.
La idea es que un usuario pueda demostrar que tiene la credencial requerida o que cumple una condición de elegibilidad sin revelar la información personal subyacente en la cadena.
Al principio, lo vi principalmente como una mejora de la privacidad.
Creo que el problema más profundo es diferente.
Una prueba de conocimiento cero puede mostrar que se cumplió una condición. No te dice si el emisor de la credencial era confiable, si los datos subyacentes eran precisos o si la política que se estaba haciendo cumplir realmente era la adecuada.
Así que la privacidad elimina un problema—la exposición innecesaria de datos—, mientras hace más visible otra pregunta:
¿Quién decide qué cuenta como cumplimiento válido?
Ahí es donde NPEX se vuelve interesante para mí. Le da a Dusk una conexión real con mercados regulados, pero una sola sede sigue siendo solo un punto de datos. Me gustaría ver si otras sedes reguladas siguen el ejemplo, si el uso se expande más allá de despliegues controlados y cómo resisten estas pruebas cuando algo realmente sale mal.
Porque esa puede ser la prueba real.
¿Puede Dusk reducir lo que las instituciones necesitan revelar sin reducir lo que los reguladores pueden verificar?
Si puede, la privacidad deja de verse como una función.
Empieza a verse como parte del propio registro financiero.
@Dusk_Foundation
#dusk $DUSK @Dusk 1Sigo volviendo a una contradicción en @Dusk que inicialmente pasé por alto:
Cuanto más se vuelve privada la conformidad, más importante se vuelve la confianza detrás de esa conformidad.
$DUSK está alrededor de 0,087 USD, aproximadamente un 21% arriba en 24H, con unos 10,8M de volumen. El movimiento se nota, pero el precio sigue siendo la parte más fácil de explicar.
Lo que me resulta más difícil de ignorar es Citadel.
La idea es que un usuario pueda demostrar que tiene la credencial requerida o que cumple una condición de elegibilidad sin revelar la información personal subyacente en la cadena.
Al principio, lo vi principalmente como una mejora de la privacidad.
Creo que el problema más profundo es diferente.
Una prueba de conocimiento cero puede mostrar que se cumplió una condición. No te dice si el emisor de la credencial era confiable, si los datos subyacentes eran precisos o si la política que se estaba haciendo cumplir realmente era la adecuada.
Así que la privacidad elimina un problema—la exposición innecesaria de datos—, mientras hace más visible otra pregunta:
¿Quién decide qué cuenta como cumplimiento válido?
Ahí es donde NPEX se vuelve interesante para mí. Le da a Dusk una conexión real con mercados regulados, pero una sola sede sigue siendo solo un punto de datos. Me gustaría ver si otras sedes reguladas siguen el ejemplo, si el uso se expande más allá de despliegues controlados y cómo resisten estas pruebas cuando algo realmente sale mal.
Porque esa puede ser la prueba real.
¿Puede Dusk reducir lo que las instituciones necesitan revelar sin reducir lo que los reguladores pueden verificar?
Si puede, la privacidad deja de verse como una función.
Empieza a verse como parte del propio registro financiero.
@Dusk
Cuanto más se vuelve privada la conformidad, más importante se vuelve la confianza detrás de esa conformidad.
$DUSK está alrededor de 0,087 USD, aproximadamente un 21% arriba en 24H, con unos 10,8M de volumen. El movimiento se nota, pero el precio sigue siendo la parte más fácil de explicar.
Lo que me resulta más difícil de ignorar es Citadel.
La idea es que un usuario pueda demostrar que tiene la credencial requerida o que cumple una condición de elegibilidad sin revelar la información personal subyacente en la cadena.
Al principio, lo vi principalmente como una mejora de la privacidad.
Creo que el problema más profundo es diferente.
Una prueba de conocimiento cero puede mostrar que se cumplió una condición. No te dice si el emisor de la credencial era confiable, si los datos subyacentes eran precisos o si la política que se estaba haciendo cumplir realmente era la adecuada.
Así que la privacidad elimina un problema—la exposición innecesaria de datos—, mientras hace más visible otra pregunta:
¿Quién decide qué cuenta como cumplimiento válido?
Ahí es donde NPEX se vuelve interesante para mí. Le da a Dusk una conexión real con mercados regulados, pero una sola sede sigue siendo solo un punto de datos. Me gustaría ver si otras sedes reguladas siguen el ejemplo, si el uso se expande más allá de despliegues controlados y cómo resisten estas pruebas cuando algo realmente sale mal.
Porque esa puede ser la prueba real.
¿Puede Dusk reducir lo que las instituciones necesitan revelar sin reducir lo que los reguladores pueden verificar?
Si puede, la privacidad deja de verse como una función.
Empieza a verse como parte del propio registro financiero.
@Dusk
2
3
242
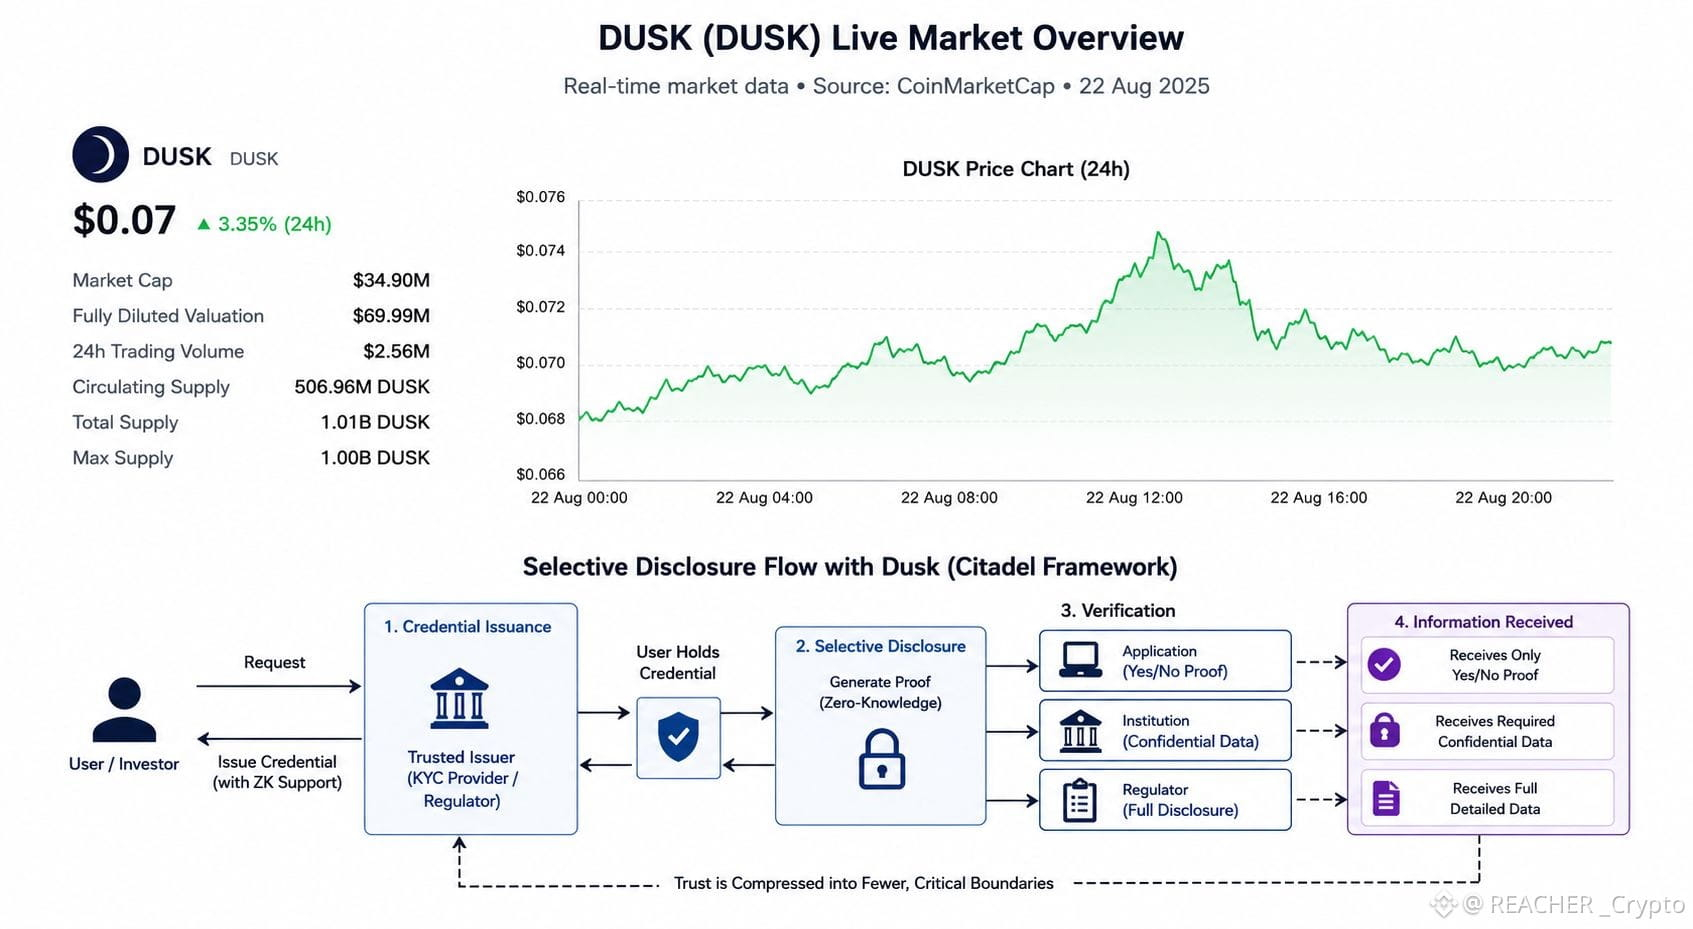
#dusk $DUSK @Dusk_Foundation i solía pensar que más transparencia significaba más confianza. luego miré el @Dusk_Foundation y noté una contradIcción que no había considerado realmente.
DUSK se está negociando alrededor de 0,07 USD con aproximadamente 2–3 millones en volumen diario recientemente. en esa escala, me interesa menos si la arquitectura de privacidad suena bien en el papel y más qué tipo de estructura de confianza se le está pidiendo al mercado que acepte.
eso es lo que me hizo interesante a citadel.
no parece tratar la privacidad como si hiciera todo invisible. la idea es más bien reducir cuánta información necesita realmente recibir cada participante.
Puedo demostrar que pasé KYC o que cumplo un requisito de elegibilidad sin entregar cada solicitud con mis datos de identidad subyacentes.
un regulador podría necesitar una divulgación detallada.
un institución podría necesitar confidencialidad.
una aplicación podría solo necesitar una prueba de sí/no.
Misma actividad financiera. visibilidad diferente.
pero aquí está la parte sobre la que sigo pensando:
cuanta menos información recibe una solicitud, más importante se vuelve la información que decide confiar.
Una prueba de conocimiento cero puede establecer que una credencial es válida. no puede establecer si el emisor era confiable, si la credencial se emitió correctamente o si la propia política de verificación tiene sentido.
así que Dusk tal vez no esté eliminando el problema de la confianza.
Tal vez esté comprimiendo la confianza en menos límites, pero más importantes.
y eso cambia cómo veo la tesis de privacidad.
la pregunta real no es si Dusk puede ocultar información financiera.
es si la divulgación selectiva puede reducir la cantidad de confianza expuesta en todo el sistema sin hacer que los puntos de confianza restantes se vuelvan peligrosamente importantes.
esa compensación me parece mucho más interesante que simplemente llamar a Dusk una blockchain de privacidad.
#dusk
#dusk $DUSK @Dusk i solía pensar que más transparencia significaba más confianza. luego miré el @Dusk y noté una contradIcción que no había considerado realmente.
DUSK se está negociando alrededor de 0,07 USD con aproximadamente 2–3 millones en volumen diario recientemente. en esa escala, me interesa menos si la arquitectura de privacidad suena bien en el papel y más qué tipo de estructura de confianza se le está pidiendo al mercado que acepte.
eso es lo que me hizo interesante a citadel.
no parece tratar la privacidad como si hiciera todo invisible. la idea es más bien reducir cuánta información necesita realmente recibir cada participante.
Puedo demostrar que pasé KYC o que cumplo un requisito de elegibilidad sin entregar cada solicitud con mis datos de identidad subyacentes.
un regulador podría necesitar una divulgación detallada.
un institución podría necesitar confidencialidad.
una aplicación podría solo necesitar una prueba de sí/no.
Misma actividad financiera. visibilidad diferente.
pero aquí está la parte sobre la que sigo pensando:
cuanta menos información recibe una solicitud, más importante se vuelve la información que decide confiar.
Una prueba de conocimiento cero puede establecer que una credencial es válida. no puede establecer si el emisor era confiable, si la credencial se emitió correctamente o si la propia política de verificación tiene sentido.
así que Dusk tal vez no esté eliminando el problema de la confianza.
Tal vez esté comprimiendo la confianza en menos límites, pero más importantes.
y eso cambia cómo veo la tesis de privacidad.
la pregunta real no es si Dusk puede ocultar información financiera.
es si la divulgación selectiva puede reducir la cantidad de confianza expuesta en todo el sistema sin hacer que los puntos de confianza restantes se vuelvan peligrosamente importantes.
esa compensación me parece mucho más interesante que simplemente llamar a Dusk una blockchain de privacidad.
#dusk
DUSK se está negociando alrededor de 0,07 USD con aproximadamente 2–3 millones en volumen diario recientemente. en esa escala, me interesa menos si la arquitectura de privacidad suena bien en el papel y más qué tipo de estructura de confianza se le está pidiendo al mercado que acepte.
eso es lo que me hizo interesante a citadel.
no parece tratar la privacidad como si hiciera todo invisible. la idea es más bien reducir cuánta información necesita realmente recibir cada participante.
Puedo demostrar que pasé KYC o que cumplo un requisito de elegibilidad sin entregar cada solicitud con mis datos de identidad subyacentes.
un regulador podría necesitar una divulgación detallada.
un institución podría necesitar confidencialidad.
una aplicación podría solo necesitar una prueba de sí/no.
Misma actividad financiera. visibilidad diferente.
pero aquí está la parte sobre la que sigo pensando:
cuanta menos información recibe una solicitud, más importante se vuelve la información que decide confiar.
Una prueba de conocimiento cero puede establecer que una credencial es válida. no puede establecer si el emisor era confiable, si la credencial se emitió correctamente o si la propia política de verificación tiene sentido.
así que Dusk tal vez no esté eliminando el problema de la confianza.
Tal vez esté comprimiendo la confianza en menos límites, pero más importantes.
y eso cambia cómo veo la tesis de privacidad.
la pregunta real no es si Dusk puede ocultar información financiera.
es si la divulgación selectiva puede reducir la cantidad de confianza expuesta en todo el sistema sin hacer que los puntos de confianza restantes se vuelvan peligrosamente importantes.
esa compensación me parece mucho más interesante que simplemente llamar a Dusk una blockchain de privacidad.
#dusk
3
5
207
#termmax @termmax
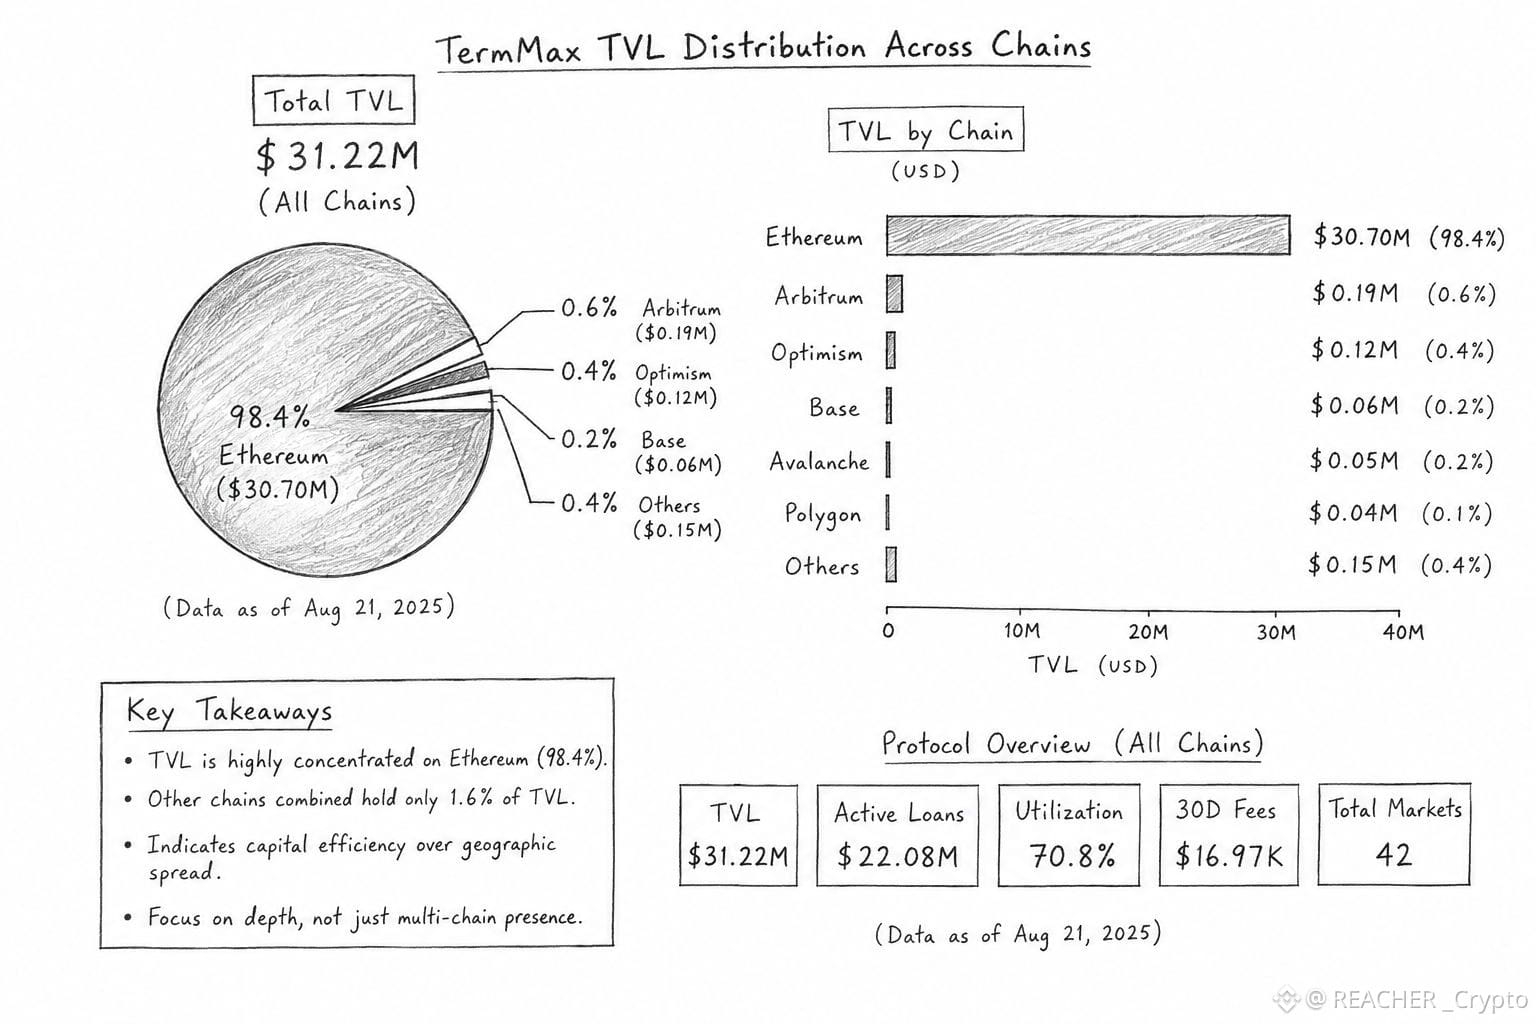
algo sobre los números de TermMax me tomó por sorpresa.
el protocolo puede colocar mercados de préstamos con tasa fija casi en cualquier lugar, pero el capital no parece importar la simetría geográfica.
las cifras más recientes que estoy mirando muestran cerca de $31.22M en TVL, con aproximadamente 98.4% concentrado en Ethereum. a primera vista, eso parece una brecha de adopción multichain.
creo que hay una interpretación más útil.
TermMax podría estar separando la disponibilidad del mercado de la eficiencia del capital.
agregar otra cadena le da a los usuarios otro lugar para pedir prestado, prestar o desplegar colateral. pero si la liquidez es escasa ahí, repartir el capital solo porque el mercado existe puede hacer que el sistema sea peor. los mercados de tasa fija, en especial, necesitan suficiente profundidad para que el pricing y el emparejamiento funcionen correctamente.
así que la concentración en Ethereum podría ser menos una señal de que la expansión falló, y más una señal de que el capital está siendo selectivo.
eso crea un intercambio sutil.
TermMax puede expandir su mercado direccionable sin expandir inmediatamente su liquidez utilizable. la red se vuelve más amplia, mientras el centro económico se mantiene sorprendentemente estrecho.
por eso me interesa menos el próximo anuncio de la cadena.
quiero ver si el segundo centro de liquidez más grande empieza a volverse significativo.
y lo rastrearía a través de más que el TVL: préstamos activos, utilización, generación de comisiones y si el capital realmente se queda después de que las bonificaciones o el lanzamiento de nuevos mercados se apagan.
porque la verdadera prueba de un protocolo de préstamos multichain no es cuántos lugares puede alcanzar.
es si la liquidez finalmente decide que vale la pena salir de casa.
¿la concentración en Ethereum es una debilidad que TermMax necesita resolver, o el resultado natural de que el capital elige el mercado más eficiente?
#TermMax
#termmax @TermMax
algo sobre los números de TermMax me tomó por sorpresa.
el protocolo puede colocar mercados de préstamos con tasa fija casi en cualquier lugar, pero el capital no parece importar la simetría geográfica.
las cifras más recientes que estoy mirando muestran cerca de $31.22M en TVL, con aproximadamente 98.4% concentrado en Ethereum. a primera vista, eso parece una brecha de adopción multichain.
creo que hay una interpretación más útil.
TermMax podría estar separando la disponibilidad del mercado de la eficiencia del capital.
agregar otra cadena le da a los usuarios otro lugar para pedir prestado, prestar o desplegar colateral. pero si la liquidez es escasa ahí, repartir el capital solo porque el mercado existe puede hacer que el sistema sea peor. los mercados de tasa fija, en especial, necesitan suficiente profundidad para que el pricing y el emparejamiento funcionen correctamente.
así que la concentración en Ethereum podría ser menos una señal de que la expansión falló, y más una señal de que el capital está siendo selectivo.
eso crea un intercambio sutil.
TermMax puede expandir su mercado direccionable sin expandir inmediatamente su liquidez utilizable. la red se vuelve más amplia, mientras el centro económico se mantiene sorprendentemente estrecho.
por eso me interesa menos el próximo anuncio de la cadena.
quiero ver si el segundo centro de liquidez más grande empieza a volverse significativo.
y lo rastrearía a través de más que el TVL: préstamos activos, utilización, generación de comisiones y si el capital realmente se queda después de que las bonificaciones o el lanzamiento de nuevos mercados se apagan.
porque la verdadera prueba de un protocolo de préstamos multichain no es cuántos lugares puede alcanzar.
es si la liquidez finalmente decide que vale la pena salir de casa.
¿la concentración en Ethereum es una debilidad que TermMax necesita resolver, o el resultado natural de que el capital elige el mercado más eficiente?
#TermMax
algo sobre los números de TermMax me tomó por sorpresa.
el protocolo puede colocar mercados de préstamos con tasa fija casi en cualquier lugar, pero el capital no parece importar la simetría geográfica.
las cifras más recientes que estoy mirando muestran cerca de $31.22M en TVL, con aproximadamente 98.4% concentrado en Ethereum. a primera vista, eso parece una brecha de adopción multichain.
creo que hay una interpretación más útil.
TermMax podría estar separando la disponibilidad del mercado de la eficiencia del capital.
agregar otra cadena le da a los usuarios otro lugar para pedir prestado, prestar o desplegar colateral. pero si la liquidez es escasa ahí, repartir el capital solo porque el mercado existe puede hacer que el sistema sea peor. los mercados de tasa fija, en especial, necesitan suficiente profundidad para que el pricing y el emparejamiento funcionen correctamente.
así que la concentración en Ethereum podría ser menos una señal de que la expansión falló, y más una señal de que el capital está siendo selectivo.
eso crea un intercambio sutil.
TermMax puede expandir su mercado direccionable sin expandir inmediatamente su liquidez utilizable. la red se vuelve más amplia, mientras el centro económico se mantiene sorprendentemente estrecho.
por eso me interesa menos el próximo anuncio de la cadena.
quiero ver si el segundo centro de liquidez más grande empieza a volverse significativo.
y lo rastrearía a través de más que el TVL: préstamos activos, utilización, generación de comisiones y si el capital realmente se queda después de que las bonificaciones o el lanzamiento de nuevos mercados se apagan.
porque la verdadera prueba de un protocolo de préstamos multichain no es cuántos lugares puede alcanzar.
es si la liquidez finalmente decide que vale la pena salir de casa.
¿la concentración en Ethereum es una debilidad que TermMax necesita resolver, o el resultado natural de que el capital elige el mercado más eficiente?
#TermMax
2
2
140
#dusk $DUSK @Dusk_Foundation
Al principio pensé que tokenizar un activo regulado consistía sobre todo en poner la propiedad en cadena y añadir las verificaciones de cumplimiento adecuadas.
pero cuanto más profundicé en Dusk, más me di cuenta de que esa visión pasaba por alto algo importante.
lo que captó mi atención fue Zedger. no trata una seguridad como si fuera solo un token que se mueve de una billetera a otra. el diseño incluye usuarios en lista blanca, aceptación de transferencias, liquidación, reclamaciones, votación y dividendos.
eso me hizo replantearme lo que realmente significa “infraestructura RWA”.
Un bono o un fondo no se convierte en un activo financiero funcional simplemente porque la propiedad se registre en una blockchain. la red aún necesita entender quién tiene permitido poseerlo, quién puede receIbirlo, cuándo se acepta una transferencia, cuándo se liquida la propiedad y qué derechos tiene el titular después.
y por eso la forma en que Dusk plantea la tokenización de valores y la gestión del ciclo de vida captó mi atención. el whitepaper dice que esta era una necesidad de uso central para el protocolo, en lugar de algo añadido después.
pero aquí es donde todavía me mantengo cauteloso.
llevar más del ciclo de vida financiero a la cadena podría reducir procesos fragmentados. también podría hacer que la blockchain sea responsable de un conjunto mucho más grande de reglas y casos límite.
así que quizá la prueba real para Dusk no sea:
¿Puedes tokenizar un activo financiero?
es:
¿Puedes hacer que todas las reglas en torno a ese activo funcionen juntas sin convertir la propia blockchaIn en otra capa de complejidad financiera?
esa es la pregunta que estoy observando. 🤔
#dusk
#dusk $DUSK @Dusk
Al principio pensé que tokenizar un activo regulado consistía sobre todo en poner la propiedad en cadena y añadir las verificaciones de cumplimiento adecuadas.
pero cuanto más profundicé en Dusk, más me di cuenta de que esa visión pasaba por alto algo importante.
lo que captó mi atención fue Zedger. no trata una seguridad como si fuera solo un token que se mueve de una billetera a otra. el diseño incluye usuarios en lista blanca, aceptación de transferencias, liquidación, reclamaciones, votación y dividendos.
eso me hizo replantearme lo que realmente significa “infraestructura RWA”.
Un bono o un fondo no se convierte en un activo financiero funcional simplemente porque la propiedad se registre en una blockchain. la red aún necesita entender quién tiene permitido poseerlo, quién puede receIbirlo, cuándo se acepta una transferencia, cuándo se liquida la propiedad y qué derechos tiene el titular después.
y por eso la forma en que Dusk plantea la tokenización de valores y la gestión del ciclo de vida captó mi atención. el whitepaper dice que esta era una necesidad de uso central para el protocolo, en lugar de algo añadido después.
pero aquí es donde todavía me mantengo cauteloso.
llevar más del ciclo de vida financiero a la cadena podría reducir procesos fragmentados. también podría hacer que la blockchain sea responsable de un conjunto mucho más grande de reglas y casos límite.
así que quizá la prueba real para Dusk no sea:
¿Puedes tokenizar un activo financiero?
es:
¿Puedes hacer que todas las reglas en torno a ese activo funcionen juntas sin convertir la propia blockchaIn en otra capa de complejidad financiera?
esa es la pregunta que estoy observando. 🤔
#dusk
Al principio pensé que tokenizar un activo regulado consistía sobre todo en poner la propiedad en cadena y añadir las verificaciones de cumplimiento adecuadas.
pero cuanto más profundicé en Dusk, más me di cuenta de que esa visión pasaba por alto algo importante.
lo que captó mi atención fue Zedger. no trata una seguridad como si fuera solo un token que se mueve de una billetera a otra. el diseño incluye usuarios en lista blanca, aceptación de transferencias, liquidación, reclamaciones, votación y dividendos.
eso me hizo replantearme lo que realmente significa “infraestructura RWA”.
Un bono o un fondo no se convierte en un activo financiero funcional simplemente porque la propiedad se registre en una blockchain. la red aún necesita entender quién tiene permitido poseerlo, quién puede receIbirlo, cuándo se acepta una transferencia, cuándo se liquida la propiedad y qué derechos tiene el titular después.
y por eso la forma en que Dusk plantea la tokenización de valores y la gestión del ciclo de vida captó mi atención. el whitepaper dice que esta era una necesidad de uso central para el protocolo, en lugar de algo añadido después.
pero aquí es donde todavía me mantengo cauteloso.
llevar más del ciclo de vida financiero a la cadena podría reducir procesos fragmentados. también podría hacer que la blockchain sea responsable de un conjunto mucho más grande de reglas y casos límite.
así que quizá la prueba real para Dusk no sea:
¿Puedes tokenizar un activo financiero?
es:
¿Puedes hacer que todas las reglas en torno a ese activo funcionen juntas sin convertir la propia blockchaIn en otra capa de complejidad financiera?
esa es la pregunta que estoy observando. 🤔
#dusk
4
4
207
#termmax @termmax
Sigo volviendo a TermMax porque el número interesante quizá no sea el TVL en absoluto.
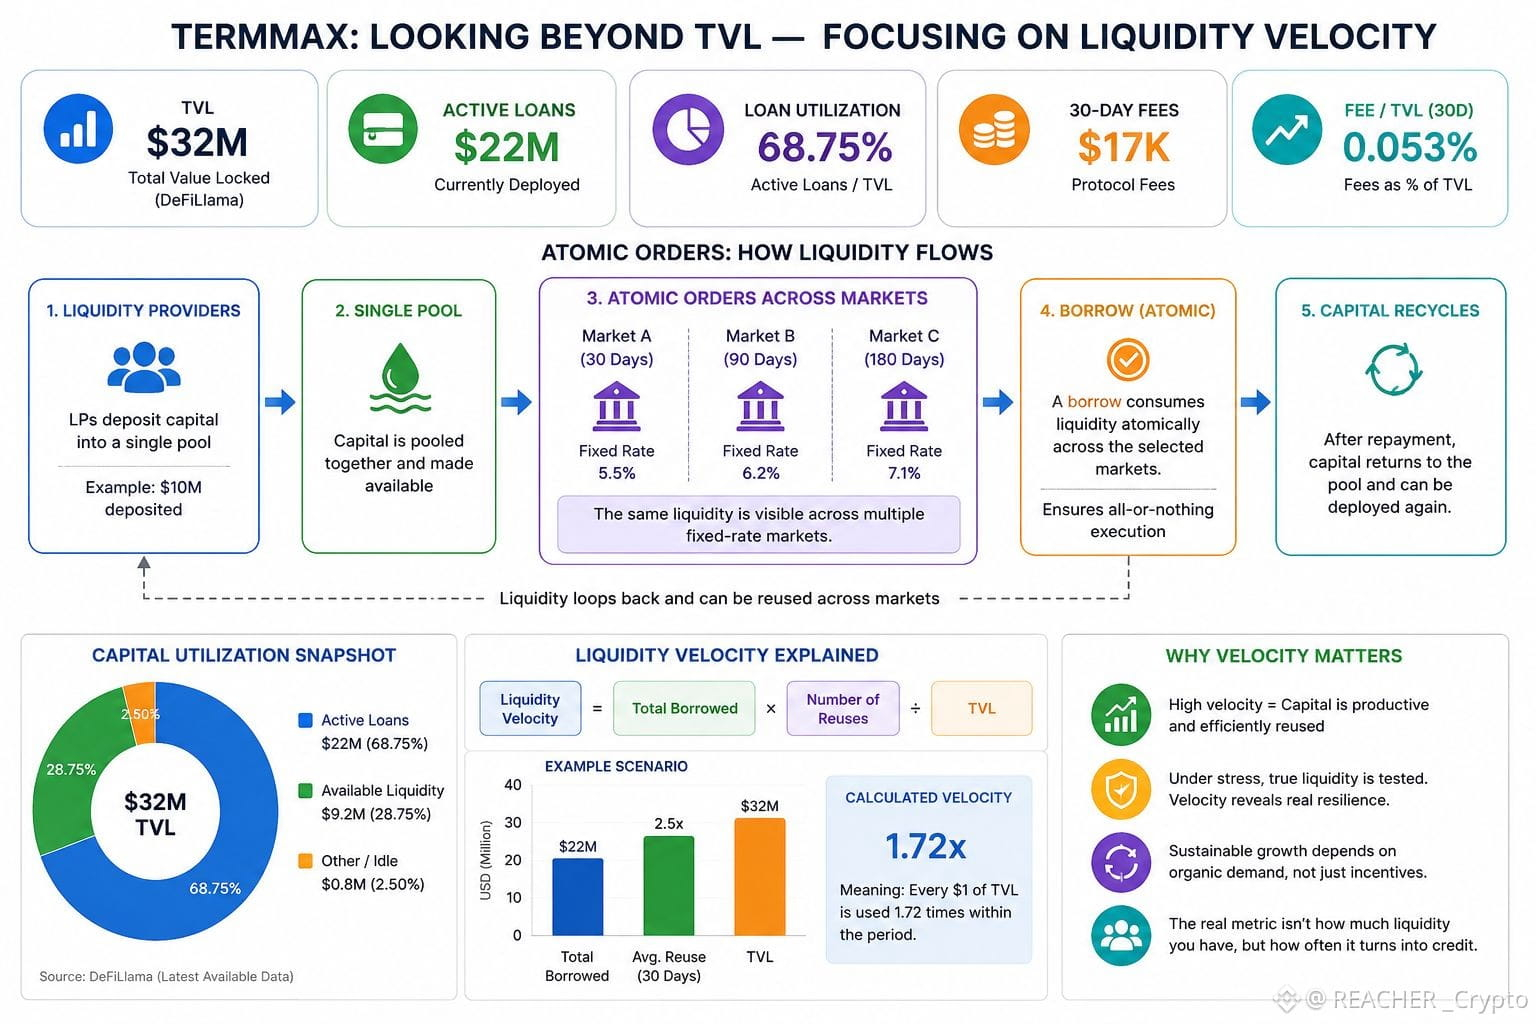
DeFiLlama actualmente muestra aproximadamente $32M de TVL, $22M en préstamos activos y solo unos $17K en comisiones de 30 días. Eso crea una imagen extraña: la mayor parte del capital ya está trabajando, pero el flujo de comisiones aún se ve relativamente pequeño.
Luego miré con más detenimiento Atomic Orders.
El diseño es simple, pero la implicación no lo es: un solo pool puede exponer el mismo capital en varios mercados de tasa fija, mientras que un préstamo consume esa liquidez de forma atómica entre los demás. TermMax afirma que esto está pensado para reducir la fragmentación y permitir que el mismo capital gire con más eficiencia.
Eso genera una contradicción que no había considerado.
La liquidez más visible no necesariamente significa que exista más liquidez. Puede significar que la misma liquidez se está contabilizando en más oportunidades.
Así que me interesa menos si el TVL crece a partir de aquí. Quiero saber qué tan rápido cada dólar se convierte en crédito real, con qué frecuencia se reutiliza y qué ocurre cuando varios mercados lo necesitan simultáneamente.
Porque $22M de préstamos activos contra ~$32M de TVL ya sugiere un uso significativo.
La pregunta más difícil es si esa eficiencia se vuelve actividad económica sostenible cuando las incentivos dejan de hacer parte del trabajo.
Quizá la métrica real de TermMax no sea la profundidad de liquidez.
Es la velocidad de la liquidez bajo estrés.
#TermMax
#termmax @TermMax
Sigo volviendo a TermMax porque el número interesante quizá no sea el TVL en absoluto.
DeFiLlama actualmente muestra aproximadamente $32M de TVL, $22M en préstamos activos y solo unos $17K en comisiones de 30 días. Eso crea una imagen extraña: la mayor parte del capital ya está trabajando, pero el flujo de comisiones aún se ve relativamente pequeño.
Luego miré con más detenimiento Atomic Orders.
El diseño es simple, pero la implicación no lo es: un solo pool puede exponer el mismo capital en varios mercados de tasa fija, mientras que un préstamo consume esa liquidez de forma atómica entre los demás. TermMax afirma que esto está pensado para reducir la fragmentación y permitir que el mismo capital gire con más eficiencia.
Eso genera una contradicción que no había considerado.
La liquidez más visible no necesariamente significa que exista más liquidez. Puede significar que la misma liquidez se está contabilizando en más oportunidades.
Así que me interesa menos si el TVL crece a partir de aquí. Quiero saber qué tan rápido cada dólar se convierte en crédito real, con qué frecuencia se reutiliza y qué ocurre cuando varios mercados lo necesitan simultáneamente.
Porque $22M de préstamos activos contra ~$32M de TVL ya sugiere un uso significativo.
La pregunta más difícil es si esa eficiencia se vuelve actividad económica sostenible cuando las incentivos dejan de hacer parte del trabajo.
Quizá la métrica real de TermMax no sea la profundidad de liquidez.
Es la velocidad de la liquidez bajo estrés.
#TermMax
Sigo volviendo a TermMax porque el número interesante quizá no sea el TVL en absoluto.
DeFiLlama actualmente muestra aproximadamente $32M de TVL, $22M en préstamos activos y solo unos $17K en comisiones de 30 días. Eso crea una imagen extraña: la mayor parte del capital ya está trabajando, pero el flujo de comisiones aún se ve relativamente pequeño.
Luego miré con más detenimiento Atomic Orders.
El diseño es simple, pero la implicación no lo es: un solo pool puede exponer el mismo capital en varios mercados de tasa fija, mientras que un préstamo consume esa liquidez de forma atómica entre los demás. TermMax afirma que esto está pensado para reducir la fragmentación y permitir que el mismo capital gire con más eficiencia.
Eso genera una contradicción que no había considerado.
La liquidez más visible no necesariamente significa que exista más liquidez. Puede significar que la misma liquidez se está contabilizando en más oportunidades.
Así que me interesa menos si el TVL crece a partir de aquí. Quiero saber qué tan rápido cada dólar se convierte en crédito real, con qué frecuencia se reutiliza y qué ocurre cuando varios mercados lo necesitan simultáneamente.
Porque $22M de préstamos activos contra ~$32M de TVL ya sugiere un uso significativo.
La pregunta más difícil es si esa eficiencia se vuelve actividad económica sostenible cuando las incentivos dejan de hacer parte del trabajo.
Quizá la métrica real de TermMax no sea la profundidad de liquidez.
Es la velocidad de la liquidez bajo estrés.
#TermMax
3
4
203
#dusk $DUSK @Dusk_Foundation He estado mirando hoy Dusk trade, y la contradicción que no termino de sacudirme es que un mejor cumplimiento podría, en realidad, hacer que un mercado RWA sea más difícil de negociar.
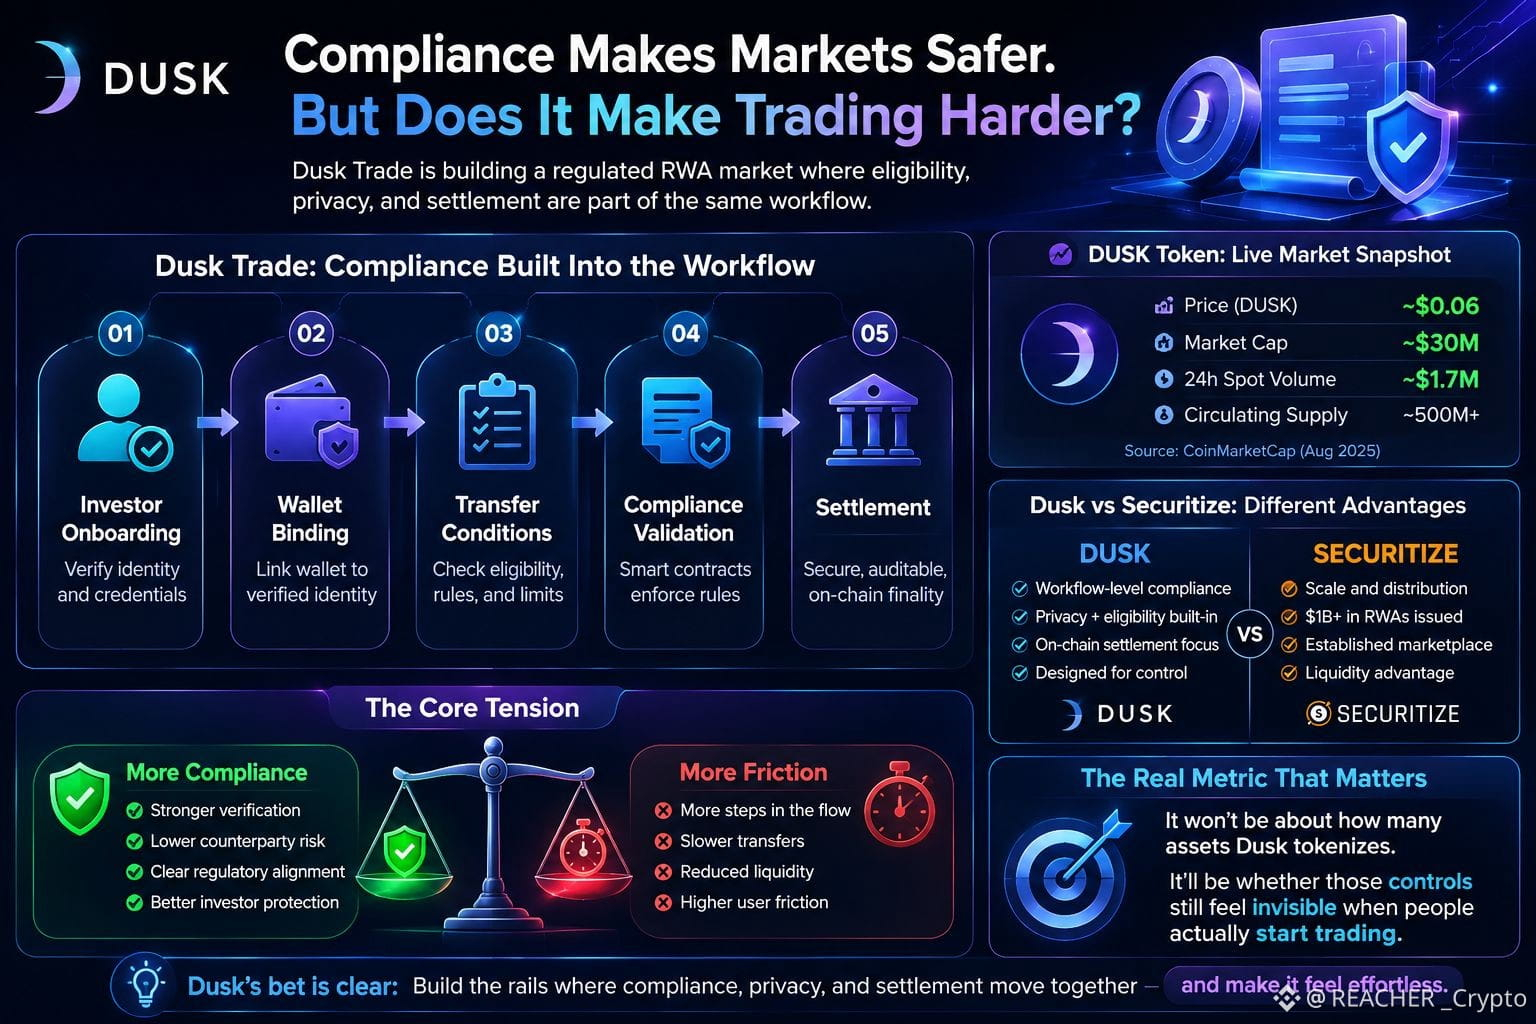
El diseño de Dusk empuja la elegibilidad al propio flujo de trabajo: incorporar al inversor, vincular la wallet, comprobar las condiciones de transferencia y luego liquidar. La documentación lo deja bastante claro: la wallet no es solo donde reside el activo; puede convertirse en parte de quién está autorizado a poseerlo o moverlo.
Eso tiene sentido para los mercados regulados.
Pero las cifras en vivo me hacen detenerme.
DUSK ronda los $0.06 con una capitalización de mercado de aproximadamente $30M, mientras que el volumen al contado en 24 h está en torno a $1.7M.
así que ya existe un mercado pequeño pero real poniendo a prueba la liquidez alrededor del token en sí, mientras Dusk intenta construir un entorno mucho más controlado para los activos regulados.
eso crea una tensión interesante.
más comprobaciones pueden hacer que la propiedad sea más segura y más fácil de verificar. Pero cada paso adicional también puede ralentizar el movimiento que necesita un mercado secundario.
Securitize ya tiene la ventaja de la escala, con más de $1B en RWAs emitidos a través de su plataforma.
Dusk está apostando por otra parte del problema: coordinar la elegibilidad, la privacidad y la liquidación en el mismo flujo de trabajo.
Estoy empezando a pensar que la métrica real no será cuántos activos tokeniza Dusk.
será si esos controles siguen pareciendo invisibles cuando la gente realmente empiece a negociar.
#dusk
#dusk $DUSK @Dusk He estado mirando hoy Dusk trade, y la contradicción que no termino de sacudirme es que un mejor cumplimiento podría, en realidad, hacer que un mercado RWA sea más difícil de negociar.
El diseño de Dusk empuja la elegibilidad al propio flujo de trabajo: incorporar al inversor, vincular la wallet, comprobar las condiciones de transferencia y luego liquidar. La documentación lo deja bastante claro: la wallet no es solo donde reside el activo; puede convertirse en parte de quién está autorizado a poseerlo o moverlo.
Eso tiene sentido para los mercados regulados.
Pero las cifras en vivo me hacen detenerme.
DUSK ronda los $0.06 con una capitalización de mercado de aproximadamente $30M, mientras que el volumen al contado en 24 h está en torno a $1.7M.
así que ya existe un mercado pequeño pero real poniendo a prueba la liquidez alrededor del token en sí, mientras Dusk intenta construir un entorno mucho más controlado para los activos regulados.
eso crea una tensión interesante.
más comprobaciones pueden hacer que la propiedad sea más segura y más fácil de verificar. Pero cada paso adicional también puede ralentizar el movimiento que necesita un mercado secundario.
Securitize ya tiene la ventaja de la escala, con más de $1B en RWAs emitidos a través de su plataforma.
Dusk está apostando por otra parte del problema: coordinar la elegibilidad, la privacidad y la liquidación en el mismo flujo de trabajo.
Estoy empezando a pensar que la métrica real no será cuántos activos tokeniza Dusk.
será si esos controles siguen pareciendo invisibles cuando la gente realmente empiece a negociar.
#dusk
El diseño de Dusk empuja la elegibilidad al propio flujo de trabajo: incorporar al inversor, vincular la wallet, comprobar las condiciones de transferencia y luego liquidar. La documentación lo deja bastante claro: la wallet no es solo donde reside el activo; puede convertirse en parte de quién está autorizado a poseerlo o moverlo.
Eso tiene sentido para los mercados regulados.
Pero las cifras en vivo me hacen detenerme.
DUSK ronda los $0.06 con una capitalización de mercado de aproximadamente $30M, mientras que el volumen al contado en 24 h está en torno a $1.7M.
así que ya existe un mercado pequeño pero real poniendo a prueba la liquidez alrededor del token en sí, mientras Dusk intenta construir un entorno mucho más controlado para los activos regulados.
eso crea una tensión interesante.
más comprobaciones pueden hacer que la propiedad sea más segura y más fácil de verificar. Pero cada paso adicional también puede ralentizar el movimiento que necesita un mercado secundario.
Securitize ya tiene la ventaja de la escala, con más de $1B en RWAs emitidos a través de su plataforma.
Dusk está apostando por otra parte del problema: coordinar la elegibilidad, la privacidad y la liquidación en el mismo flujo de trabajo.
Estoy empezando a pensar que la métrica real no será cuántos activos tokeniza Dusk.
será si esos controles siguen pareciendo invisibles cuando la gente realmente empiece a negociar.
#dusk
4
3
240
#termmax @termmax Antes pensaba que los criptofondos DeFi eran bastante sencillos.
tú depositas fondos, la estrategia busca rendimiento y tú te quedas con la ganancia. Tan simple.
pero mientras más miré el modelo de la Bóveda TermMax y del Curator, más me di cuenta de que me faltaba una parte importante.
el curador no solo busca el APY más alto.
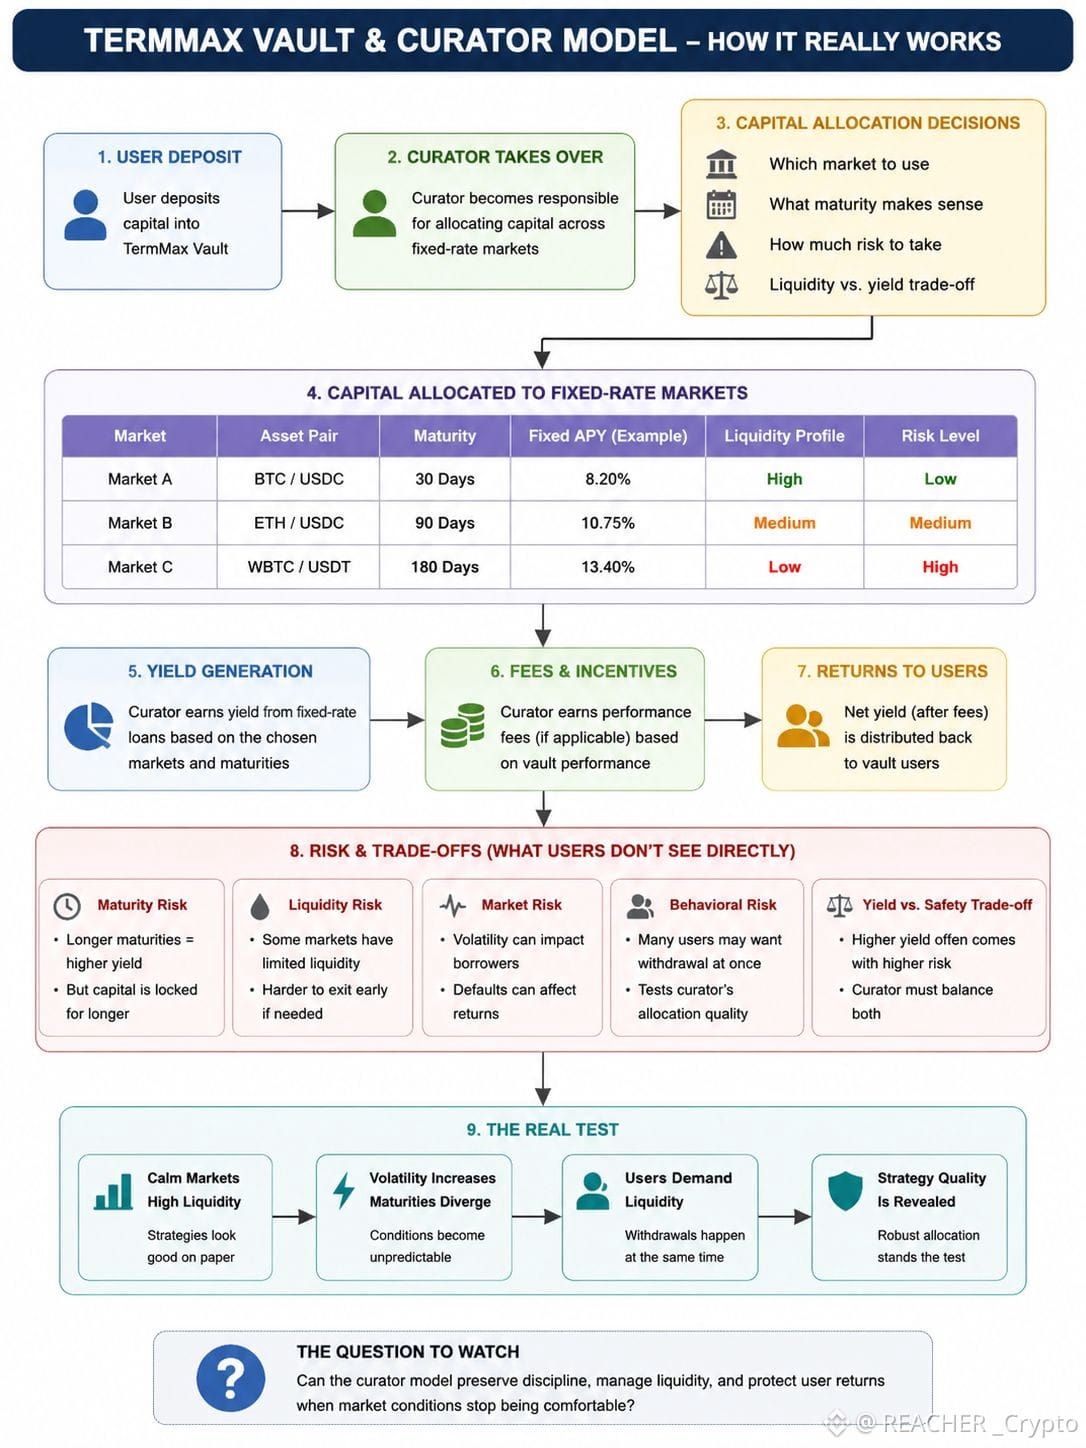
ellos deciden a dónde va el capital, qué mercado usar, qué vencimiento tiene sentido y cuánto riesgo vale la pena asumir. En mercados de tasa fija, esa última parte resulta incluso más interesante porque el tiempo forma parte de la decisión de asignación.
Un rendimiento más alto puede verse atractivo en una pantalla, pero no me dice si el vencimiento es adecuado o si el intercambio de liquidez tiene sentido.
Eso cambió la forma en que pienso sobre el “rendimiento” pasivo.
el usuario puede ser pasivo, pero el riesgo no ha desaparecido. Alguien todavía tiene que tomar esas decisiones de asignación de capital. la dIferencia es que el usuario confía en que el curador las tome.
y creo que ahí es donde empieza la prueba real.
Una estrategia puede parecer perfectamente razonable cuando la liquidez es fuerte y los mercados están tranquilos. Me interesa mucho más lo que ocurre cuando sube la volatilidad, los vencimientos empiezan a divergir y los usuarios repentinamente quieren liquidez al mismo tiempo.
ahí es cuando descubres si el proceso de asignación era realmente sólido o solo se veía bien en condiciones fáciles.
así que me interesa menos juzgar una bóveda TermMax solo por su APY.
Quiero entender de dónde proviene ese rendimiento, qué renuncia el curador para lograrlo y cómo se comporta la estrategia cuando las condiciones se vuelven incómodas.
porque el rendimiento pasivo no significa riesgo pasivo.
significa que otra persona está tomando las decisiones por ti.
#TermMax
#termmax @TermMax Antes pensaba que los criptofondos DeFi eran bastante sencillos.
tú depositas fondos, la estrategia busca rendimiento y tú te quedas con la ganancia. Tan simple.
pero mientras más miré el modelo de la Bóveda TermMax y del Curator, más me di cuenta de que me faltaba una parte importante.
el curador no solo busca el APY más alto.
ellos deciden a dónde va el capital, qué mercado usar, qué vencimiento tiene sentido y cuánto riesgo vale la pena asumir. En mercados de tasa fija, esa última parte resulta incluso más interesante porque el tiempo forma parte de la decisión de asignación.
Un rendimiento más alto puede verse atractivo en una pantalla, pero no me dice si el vencimiento es adecuado o si el intercambio de liquidez tiene sentido.
Eso cambió la forma en que pienso sobre el “rendimiento” pasivo.
el usuario puede ser pasivo, pero el riesgo no ha desaparecido. Alguien todavía tiene que tomar esas decisiones de asignación de capital. la dIferencia es que el usuario confía en que el curador las tome.
y creo que ahí es donde empieza la prueba real.
Una estrategia puede parecer perfectamente razonable cuando la liquidez es fuerte y los mercados están tranquilos. Me interesa mucho más lo que ocurre cuando sube la volatilidad, los vencimientos empiezan a divergir y los usuarios repentinamente quieren liquidez al mismo tiempo.
ahí es cuando descubres si el proceso de asignación era realmente sólido o solo se veía bien en condiciones fáciles.
así que me interesa menos juzgar una bóveda TermMax solo por su APY.
Quiero entender de dónde proviene ese rendimiento, qué renuncia el curador para lograrlo y cómo se comporta la estrategia cuando las condiciones se vuelven incómodas.
porque el rendimiento pasivo no significa riesgo pasivo.
significa que otra persona está tomando las decisiones por ti.
#TermMax
tú depositas fondos, la estrategia busca rendimiento y tú te quedas con la ganancia. Tan simple.
pero mientras más miré el modelo de la Bóveda TermMax y del Curator, más me di cuenta de que me faltaba una parte importante.
el curador no solo busca el APY más alto.
ellos deciden a dónde va el capital, qué mercado usar, qué vencimiento tiene sentido y cuánto riesgo vale la pena asumir. En mercados de tasa fija, esa última parte resulta incluso más interesante porque el tiempo forma parte de la decisión de asignación.
Un rendimiento más alto puede verse atractivo en una pantalla, pero no me dice si el vencimiento es adecuado o si el intercambio de liquidez tiene sentido.
Eso cambió la forma en que pienso sobre el “rendimiento” pasivo.
el usuario puede ser pasivo, pero el riesgo no ha desaparecido. Alguien todavía tiene que tomar esas decisiones de asignación de capital. la dIferencia es que el usuario confía en que el curador las tome.
y creo que ahí es donde empieza la prueba real.
Una estrategia puede parecer perfectamente razonable cuando la liquidez es fuerte y los mercados están tranquilos. Me interesa mucho más lo que ocurre cuando sube la volatilidad, los vencimientos empiezan a divergir y los usuarios repentinamente quieren liquidez al mismo tiempo.
ahí es cuando descubres si el proceso de asignación era realmente sólido o solo se veía bien en condiciones fáciles.
así que me interesa menos juzgar una bóveda TermMax solo por su APY.
Quiero entender de dónde proviene ese rendimiento, qué renuncia el curador para lograrlo y cómo se comporta la estrategia cuando las condiciones se vuelven incómodas.
porque el rendimiento pasivo no significa riesgo pasivo.
significa que otra persona está tomando las decisiones por ti.
#TermMax
1
2
153
#dusk $DUSK @Dusk_Foundation
Al principio pensé que la historia de privacidad de Dusk trataba principalmente de ocultar transacciones.
Luego miré con más profundidad en la arquitectura y noté algo más interesante: la privacidad no se trata como algo que se agrega al final. Puede comenzar incluso antes de que una transacción se procese.
Lo que captó mi atención fue la Prueba de puja ciega, utilizada dentro del diseño de consenso Acuerdo Bizantino Segregado (SBA) de Dusk.
Lo interesante es que la selección de líderes puede ocurrir sin exponer simplemente toda la información sobre quién compite para producir el siguiente bloque.
Eso cambió la forma en que veo Dusk.
Luego está Phoenix, que aborda el gasto confidencial mediante un diseño basado en UTxO, mientras que Zedger toma una ruta diferente hacia la privacidad para la actividad de tokens de seguridad regulados.
Así que para mí la pregunta más grande no es:
¿Dusk tiene privacidad?
Es:
¿Cuánta información del protocolo puede permanecer privada mientras la red aún llega a un acuerdo y prueba que todo es válido?
Ese es un problema mucho más difícil.
Sigo observando cómo se desempeñan estos componentes en el uso del mundo real, especialmente cuando la escalabilidad y la adopción se convierten en la prueba real.
Pero la arquitectura en sí misma realmente merece la pena prestar atención.
¿Crees que la privacidad debería comenzar en la capa de transacción o también debería diseñarse el consenso en torno a la privacidad?
#dusk
¿Dónde debería comenzar la privacidad?
#dusk $DUSK @Dusk
Al principio pensé que la historia de privacidad de Dusk trataba principalmente de ocultar transacciones.
Luego miré con más profundidad en la arquitectura y noté algo más interesante: la privacidad no se trata como algo que se agrega al final. Puede comenzar incluso antes de que una transacción se procese.
Lo que captó mi atención fue la Prueba de puja ciega, utilizada dentro del diseño de consenso Acuerdo Bizantino Segregado (SBA) de Dusk.
Lo interesante es que la selección de líderes puede ocurrir sin exponer simplemente toda la información sobre quién compite para producir el siguiente bloque.
Eso cambió la forma en que veo Dusk.
Luego está Phoenix, que aborda el gasto confidencial mediante un diseño basado en UTxO, mientras que Zedger toma una ruta diferente hacia la privacidad para la actividad de tokens de seguridad regulados.
Así que para mí la pregunta más grande no es:
¿Dusk tiene privacidad?
Es:
¿Cuánta información del protocolo puede permanecer privada mientras la red aún llega a un acuerdo y prueba que todo es válido?
Ese es un problema mucho más difícil.
Sigo observando cómo se desempeñan estos componentes en el uso del mundo real, especialmente cuando la escalabilidad y la adopción se convierten en la prueba real.
Pero la arquitectura en sí misma realmente merece la pena prestar atención.
¿Crees que la privacidad debería comenzar en la capa de transacción o también debería diseñarse el consenso en torno a la privacidad?
#dusk
¿Dónde debería comenzar la privacidad?
Al principio pensé que la historia de privacidad de Dusk trataba principalmente de ocultar transacciones.
Luego miré con más profundidad en la arquitectura y noté algo más interesante: la privacidad no se trata como algo que se agrega al final. Puede comenzar incluso antes de que una transacción se procese.
Lo que captó mi atención fue la Prueba de puja ciega, utilizada dentro del diseño de consenso Acuerdo Bizantino Segregado (SBA) de Dusk.
Lo interesante es que la selección de líderes puede ocurrir sin exponer simplemente toda la información sobre quién compite para producir el siguiente bloque.
Eso cambió la forma en que veo Dusk.
Luego está Phoenix, que aborda el gasto confidencial mediante un diseño basado en UTxO, mientras que Zedger toma una ruta diferente hacia la privacidad para la actividad de tokens de seguridad regulados.
Así que para mí la pregunta más grande no es:
¿Dusk tiene privacidad?
Es:
¿Cuánta información del protocolo puede permanecer privada mientras la red aún llega a un acuerdo y prueba que todo es válido?
Ese es un problema mucho más difícil.
Sigo observando cómo se desempeñan estos componentes en el uso del mundo real, especialmente cuando la escalabilidad y la adopción se convierten en la prueba real.
Pero la arquitectura en sí misma realmente merece la pena prestar atención.
¿Crees que la privacidad debería comenzar en la capa de transacción o también debería diseñarse el consenso en torno a la privacidad?
#dusk
¿Dónde debería comenzar la privacidad?
Transactions
0%
Consensus
0%
0 Voto(s) • Votación cerrada
7
3
194
#termmax @termmax
Al principio miré la estructura FT/XT de @termmax FT y pensé: vale, esto es principalmente otra forma de estructurar las tasas de préstamo.
Luego empecé a pensar en el propio endeudamiento, y eso cambió mi punto de vista.
La relación es bastante simple:
1 FT + 1 XT = 1 token de deuda.
FT proporciona el derecho al valor fijo al vencimiento, mientras que XT es el otro lado de esa misma posición.
Lo que captó mi atención es lo que ocurre cuando esto se encuentra con una necesidad real de liquidez.
El prestamista puede conservar el lado del valor fijo, mientras que el prestatario puede potencialmente separar la otra parte y venderla para obtener liquidez.
Eso se siente más grande que solo cambiar cómo se expresa el interés.
Estás haciendo que el derecho de deuda sea más modular.
Me gusta esa idea. pero sigo sin estar seguro de una cosa: ¿esto realmente simplifica las finanzas para los usuarios, o solo traslada la complejidad a entender dos activos en lugar de uno?
Probablemente esa sea la pregunta más interesante.
#TermMax
¿FT/XT mejora la flexibilidad de la deuda?
#termmax @TermMax
Al principio miré la estructura FT/XT de @TermMax FT y pensé: vale, esto es principalmente otra forma de estructurar las tasas de préstamo.
Luego empecé a pensar en el propio endeudamiento, y eso cambió mi punto de vista.
La relación es bastante simple:
1 FT + 1 XT = 1 token de deuda.
FT proporciona el derecho al valor fijo al vencimiento, mientras que XT es el otro lado de esa misma posición.
Lo que captó mi atención es lo que ocurre cuando esto se encuentra con una necesidad real de liquidez.
El prestamista puede conservar el lado del valor fijo, mientras que el prestatario puede potencialmente separar la otra parte y venderla para obtener liquidez.
Eso se siente más grande que solo cambiar cómo se expresa el interés.
Estás haciendo que el derecho de deuda sea más modular.
Me gusta esa idea. pero sigo sin estar seguro de una cosa: ¿esto realmente simplifica las finanzas para los usuarios, o solo traslada la complejidad a entender dos activos en lugar de uno?
Probablemente esa sea la pregunta más interesante.
#TermMax
¿FT/XT mejora la flexibilidad de la deuda?
Al principio miré la estructura FT/XT de @TermMax FT y pensé: vale, esto es principalmente otra forma de estructurar las tasas de préstamo.
Luego empecé a pensar en el propio endeudamiento, y eso cambió mi punto de vista.
La relación es bastante simple:
1 FT + 1 XT = 1 token de deuda.
FT proporciona el derecho al valor fijo al vencimiento, mientras que XT es el otro lado de esa misma posición.
Lo que captó mi atención es lo que ocurre cuando esto se encuentra con una necesidad real de liquidez.
El prestamista puede conservar el lado del valor fijo, mientras que el prestatario puede potencialmente separar la otra parte y venderla para obtener liquidez.
Eso se siente más grande que solo cambiar cómo se expresa el interés.
Estás haciendo que el derecho de deuda sea más modular.
Me gusta esa idea. pero sigo sin estar seguro de una cosa: ¿esto realmente simplifica las finanzas para los usuarios, o solo traslada la complejidad a entender dos activos en lugar de uno?
Probablemente esa sea la pregunta más interesante.
#TermMax
¿FT/XT mejora la flexibilidad de la deuda?
🚀 More flexibility
100%
🤔 More complexity
0%
3 Voto(s) • Votación cerrada
6
10
274
Antes pensaba… que la mayoría de los proyectos cripto solo intentaban reconstruir cosas que ya funcionaban, añadiendo un token en algún punto del medio.
Luego empecé a investigar @termmax , y esa visión comenzó a cambiar.
Lo que llamó mi atención fue que no era una gran promesa de cambiar las finanzas. Era la conexión entre la infraestructura blockchain y algo que las finanzas tradicionales han entendido desde hace años: el préstamo a plazo fijo, los rendimientos fijos y las posiciones financieras estructuradas.
El detalle que para mí hizo que se sintiera diferente fue la forma en que la deuda de tasa fija puede representarse y negociarse on-chain. Me hizo pensar que la blockchain no siempre tiene que reemplazar a las finanzas tradicionales. Quizá también pueda reconstruir ciertas partes de ellas de una manera más abierta y componible.
Aun así, me quedan preguntas. ¿Cuánta liquidez real y demanda pueden mantener estos mercados de tasa fija con el paso del tiempo? ¿Y qué tan bien puede el sistema gestionar los riesgos de contratos inteligentes, del mercado y de la liquidación a medida que crece el uso?
Así que no me voy pensando que encontré un ganador garantizado.
Me voy con una mejor pregunta: ¿qué más he descartado porque estaba mirando el cripto con las mismas suposiciones?
Para mí, aprender se está volviendo menos sobre encontrar respuestas y más sobre aprender a cuestionar mi propio pensamiento.
@termmax #TermMax
¿Lo que más importa para que un proyecto cripto se sienta real?
Antes pensaba… que la mayoría de los proyectos cripto solo intentaban reconstruir cosas que ya funcionaban, añadiendo un token en algún punto del medio.
Luego empecé a investigar @TermMax , y esa visión comenzó a cambiar.
Lo que llamó mi atención fue que no era una gran promesa de cambiar las finanzas. Era la conexión entre la infraestructura blockchain y algo que las finanzas tradicionales han entendido desde hace años: el préstamo a plazo fijo, los rendimientos fijos y las posiciones financieras estructuradas.
El detalle que para mí hizo que se sintiera diferente fue la forma en que la deuda de tasa fija puede representarse y negociarse on-chain. Me hizo pensar que la blockchain no siempre tiene que reemplazar a las finanzas tradicionales. Quizá también pueda reconstruir ciertas partes de ellas de una manera más abierta y componible.
Aun así, me quedan preguntas. ¿Cuánta liquidez real y demanda pueden mantener estos mercados de tasa fija con el paso del tiempo? ¿Y qué tan bien puede el sistema gestionar los riesgos de contratos inteligentes, del mercado y de la liquidación a medida que crece el uso?
Así que no me voy pensando que encontré un ganador garantizado.
Me voy con una mejor pregunta: ¿qué más he descartado porque estaba mirando el cripto con las mismas suposiciones?
Para mí, aprender se está volviendo menos sobre encontrar respuestas y más sobre aprender a cuestionar mi propio pensamiento.
@TermMax #TermMax
¿Lo que más importa para que un proyecto cripto se sienta real?
Luego empecé a investigar @TermMax , y esa visión comenzó a cambiar.
Lo que llamó mi atención fue que no era una gran promesa de cambiar las finanzas. Era la conexión entre la infraestructura blockchain y algo que las finanzas tradicionales han entendido desde hace años: el préstamo a plazo fijo, los rendimientos fijos y las posiciones financieras estructuradas.
El detalle que para mí hizo que se sintiera diferente fue la forma en que la deuda de tasa fija puede representarse y negociarse on-chain. Me hizo pensar que la blockchain no siempre tiene que reemplazar a las finanzas tradicionales. Quizá también pueda reconstruir ciertas partes de ellas de una manera más abierta y componible.
Aun así, me quedan preguntas. ¿Cuánta liquidez real y demanda pueden mantener estos mercados de tasa fija con el paso del tiempo? ¿Y qué tan bien puede el sistema gestionar los riesgos de contratos inteligentes, del mercado y de la liquidación a medida que crece el uso?
Así que no me voy pensando que encontré un ganador garantizado.
Me voy con una mejor pregunta: ¿qué más he descartado porque estaba mirando el cripto con las mismas suposiciones?
Para mí, aprender se está volviendo menos sobre encontrar respuestas y más sobre aprender a cuestionar mi propio pensamiento.
@TermMax #TermMax
¿Lo que más importa para que un proyecto cripto se sienta real?
Real-world utility
0%
Strong infrastructure
0%
Adoption & liquidity
0%
Regulatory clarity
0%
0 Voto(s) • Votación cerrada
2
2
190
Solía pensar que la parte difícil de poner valores en la cadena era simplemente crear el token.
Después de mirar más a fondo el @Dusk_Foundation , empiezo a pensar que el problema más difícil es decidir qué debería ser visible y qué debería permanecer privado.
Un valor regulado necesita reglas.
¿Quién puede tenerlo?
¿Quién puede transferirlo?
¿Se aprobó al inversor?
¿Se puede verificar o recuperar legalmente la titularidad?
Pero eso no significa que todo el mundo deba ver los detalles financieros del inversor.
Aquí es donde el enfoque de Dusk se volvió interesante para mí.
Con XSC y contratos inteligentes confidenciales, el objetivo no es simplemente ocultarlo todo. Es más bien una divulgación selectiva.
La red puede potencialmente demostrar que se cumplieron ciertas reglas mientras la información sensible permanece protegida.
Para los mercados financieros, esa distinción importa.
Un banco puede querer que los reguladores verifiquen el cumplimiento sin exponer toda su actividad de trading al público.
Pero hay un equilibrio.
Las pruebas de conocimiento cero y la ejecución confidencial añaden complejidad criptográfica y trabajo computacional. Más privacidad puede significar una infraestructura más difícil para que los desarrolladores construyan y mantengan.
Así que no miro a Dusk y pienso: “la privacidad resuelve las finanzas reguladas”.
Estoy preguntando algo más importante:
¿Puede Dusk encontrar el equilibrio adecuado entre privacidad, cumplimiento, usabilidad y descentralización?
Porque si puede, el producto interesante tal vez no sea una blockchain privada.
Podría ser una blockchain en la que la información correcta sea visible para las personas adecuadas en el momento adecuado.
Esa es la parte de Dusk que estoy observando más de cerca.
@Dusk_Foundation #dusk $DUSK
¿Cuál es el mayor desafío de Dusk?
Solía pensar que la parte difícil de poner valores en la cadena era simplemente crear el token.
Después de mirar más a fondo el @Dusk , empiezo a pensar que el problema más difícil es decidir qué debería ser visible y qué debería permanecer privado.
Un valor regulado necesita reglas.
¿Quién puede tenerlo?
¿Quién puede transferirlo?
¿Se aprobó al inversor?
¿Se puede verificar o recuperar legalmente la titularidad?
Pero eso no significa que todo el mundo deba ver los detalles financieros del inversor.
Aquí es donde el enfoque de Dusk se volvió interesante para mí.
Con XSC y contratos inteligentes confidenciales, el objetivo no es simplemente ocultarlo todo. Es más bien una divulgación selectiva.
La red puede potencialmente demostrar que se cumplieron ciertas reglas mientras la información sensible permanece protegida.
Para los mercados financieros, esa distinción importa.
Un banco puede querer que los reguladores verifiquen el cumplimiento sin exponer toda su actividad de trading al público.
Pero hay un equilibrio.
Las pruebas de conocimiento cero y la ejecución confidencial añaden complejidad criptográfica y trabajo computacional. Más privacidad puede significar una infraestructura más difícil para que los desarrolladores construyan y mantengan.
Así que no miro a Dusk y pienso: “la privacidad resuelve las finanzas reguladas”.
Estoy preguntando algo más importante:
¿Puede Dusk encontrar el equilibrio adecuado entre privacidad, cumplimiento, usabilidad y descentralización?
Porque si puede, el producto interesante tal vez no sea una blockchain privada.
Podría ser una blockchain en la que la información correcta sea visible para las personas adecuadas en el momento adecuado.
Esa es la parte de Dusk que estoy observando más de cerca.
@Dusk #dusk $DUSK
¿Cuál es el mayor desafío de Dusk?
Después de mirar más a fondo el @Dusk , empiezo a pensar que el problema más difícil es decidir qué debería ser visible y qué debería permanecer privado.
Un valor regulado necesita reglas.
¿Quién puede tenerlo?
¿Quién puede transferirlo?
¿Se aprobó al inversor?
¿Se puede verificar o recuperar legalmente la titularidad?
Pero eso no significa que todo el mundo deba ver los detalles financieros del inversor.
Aquí es donde el enfoque de Dusk se volvió interesante para mí.
Con XSC y contratos inteligentes confidenciales, el objetivo no es simplemente ocultarlo todo. Es más bien una divulgación selectiva.
La red puede potencialmente demostrar que se cumplieron ciertas reglas mientras la información sensible permanece protegida.
Para los mercados financieros, esa distinción importa.
Un banco puede querer que los reguladores verifiquen el cumplimiento sin exponer toda su actividad de trading al público.
Pero hay un equilibrio.
Las pruebas de conocimiento cero y la ejecución confidencial añaden complejidad criptográfica y trabajo computacional. Más privacidad puede significar una infraestructura más difícil para que los desarrolladores construyan y mantengan.
Así que no miro a Dusk y pienso: “la privacidad resuelve las finanzas reguladas”.
Estoy preguntando algo más importante:
¿Puede Dusk encontrar el equilibrio adecuado entre privacidad, cumplimiento, usabilidad y descentralización?
Porque si puede, el producto interesante tal vez no sea una blockchain privada.
Podría ser una blockchain en la que la información correcta sea visible para las personas adecuadas en el momento adecuado.
Esa es la parte de Dusk que estoy observando más de cerca.
@Dusk #dusk $DUSK
¿Cuál es el mayor desafío de Dusk?
🔘 Privacy vs compliance
100%
🔘 Scalability
0%
🔘 Decentralization
0%
🔘 Developer adoption
0%
1 Voto(s) • Votación cerrada
10
8
184
Antes miraba el $DUSK y pensaba que la gran pregunta era: ¿cuándo van a usarlo finalmente las instituciones?
después de pasar tiempo en el explorador y además apostar una cantidad pequeña por mi cuenta, ahora me estoy haciendo una pregunta diferente.
si las instituciones llegan, ¿cuánta demanda real eso crearía para DUSK?
me gusta la idea detrás de la red. Privacidad, divulgación selectiva, Contratos de Seguridad Confidenciales y la dirección hacia la EVM todo tiene sentido para las finanzas reguladas.
pero luego miré lo que está pasando en la cadena.
los bloques siguen avanzando, pero la actividad aún se siente fuertemente ligada al staking. la liquidez de DeFi es escasa, y la oportunidad NPEX aún no se ha convertido en una actividad de liquidación constante que yo quisiera ver.
el propio staking también me sorprendió. Solo el 90% se vuelve activo de inmediato, mientras que el resto queda inactivo. Luego hay un período de madurez de 4,320 bloques antes de que una nueva apuesta pueda participar en el consenso.
ahí fue cuando me quedó claro:
DUSK puede tener la infraestructura antes de tener el uso.
y hasta que empiece a aparecer una actividad real, creo que esa brecha importa más que el relato.
@Dusk_Foundation #dusk $DUSK
¿Qué es lo que más importa para la siguiente fase de crecimiento de DUSK?
Antes miraba el $DUSK y pensaba que la gran pregunta era: ¿cuándo van a usarlo finalmente las instituciones?
después de pasar tiempo en el explorador y además apostar una cantidad pequeña por mi cuenta, ahora me estoy haciendo una pregunta diferente.
si las instituciones llegan, ¿cuánta demanda real eso crearía para DUSK?
me gusta la idea detrás de la red. Privacidad, divulgación selectiva, Contratos de Seguridad Confidenciales y la dirección hacia la EVM todo tiene sentido para las finanzas reguladas.
pero luego miré lo que está pasando en la cadena.
los bloques siguen avanzando, pero la actividad aún se siente fuertemente ligada al staking. la liquidez de DeFi es escasa, y la oportunidad NPEX aún no se ha convertido en una actividad de liquidación constante que yo quisiera ver.
el propio staking también me sorprendió. Solo el 90% se vuelve activo de inmediato, mientras que el resto queda inactivo. Luego hay un período de madurez de 4,320 bloques antes de que una nueva apuesta pueda participar en el consenso.
ahí fue cuando me quedó claro:
DUSK puede tener la infraestructura antes de tener el uso.
y hasta que empiece a aparecer una actividad real, creo que esa brecha importa más que el relato.
@Dusk #dusk $DUSK
¿Qué es lo que más importa para la siguiente fase de crecimiento de DUSK?
después de pasar tiempo en el explorador y además apostar una cantidad pequeña por mi cuenta, ahora me estoy haciendo una pregunta diferente.
si las instituciones llegan, ¿cuánta demanda real eso crearía para DUSK?
me gusta la idea detrás de la red. Privacidad, divulgación selectiva, Contratos de Seguridad Confidenciales y la dirección hacia la EVM todo tiene sentido para las finanzas reguladas.
pero luego miré lo que está pasando en la cadena.
los bloques siguen avanzando, pero la actividad aún se siente fuertemente ligada al staking. la liquidez de DeFi es escasa, y la oportunidad NPEX aún no se ha convertido en una actividad de liquidación constante que yo quisiera ver.
el propio staking también me sorprendió. Solo el 90% se vuelve activo de inmediato, mientras que el resto queda inactivo. Luego hay un período de madurez de 4,320 bloques antes de que una nueva apuesta pueda participar en el consenso.
ahí fue cuando me quedó claro:
DUSK puede tener la infraestructura antes de tener el uso.
y hasta que empiece a aparecer una actividad real, creo que esa brecha importa más que el relato.
@Dusk #dusk $DUSK
¿Qué es lo que más importa para la siguiente fase de crecimiento de DUSK?
Real on-chain usage
0%
Institutional adoption
0%
Stronger token demand
0%
Better staking UX
0%
0 Voto(s) • Votación cerrada
7
6
182
Inicia sesión para explorar más contenidos
Únete a usuarios globales de criptomonedas en Binance Square
⚡️ Obtén información útil y actualizada sobre criptos.
💬 Avalado por el mayor exchange de criptomonedas en el mundo.
👍 Descubre perspectivas reales de creadores verificados.
Email/número de teléfono
Temas populares
BitMineETHHoldingsTop6Million
1,364 vistas
102 están debatiendo
#bitmineethholdingstop6million
🚨 Acumulación Institucional: ¡Las tenencias de Bitmine en ETH superan los 6 millones!
La actualización del mercado: El seguimiento on-chain y los informes de tesorería confirman un hito masivo en la acumulación de activos digitales institucionales, ya que las tenencias totales de Ethereum de Bitmine superan oficialmente los 6 millones de ETH (con un valor de más de $6 mil millones). A medida que las entidades corporativas e institucionales escalan agresivamente su exposición al balance para la infraestructura de prueba de participación, la oferta líquida en las principales bolsas enfrenta una presión sostenida a la baja. 📊
¿Qué significa esto para los traders:
La acumulación masiva por parte de tesorerías corporativas ajusta considerablemente la oferta circulante y afecta la profundidad del mercado. Los participantes del mercado supervisan de cerca los saldos de reservas en exchange, los rendimientos de staking y la posición en derivados, ya que grandes tenencias bloquean porciones significativas de la oferta circulante.
Criptomonedas destacadas que debes vigilar para operar:
$ETH (Ethereum): El activo principal bajo acumulación institucional; seguimiento del crecimiento de validadores, entradas de staking y métricas de absorción de suministro.
$BTC (Bitcoin): El ancla macro de liquidez; observar tendencias más amplias de asignación de activos institucionales en los principales “store of value” digitales.
$SOL (Solana): Referente de red de alta rotación de velocidad; monitorear la rotación de liquidez hacia alternativas capa-1 y la expansión del volumen del ecosistema.
¿Cómo ves el impacto de las tesorerías institucionales de tokens por varios millones en la liquidez y la volatilidad del mercado a largo plazo? ¡Hablemos de tu estrategia en los comentarios abajo! 👇
#ETH #InstitutionalCrypto #CryptoTreasury #blockchain
Axiom AlphA
·0 me gusta
·721 vistas
StrategyAdds1666BTCHoldingsReach847666
816 vistas
76 están debatiendo
NvidiaApproves$150BBuyback
1,963 vistas
51 están debatiendo