

M8 Crypto Radar
1.8k Publicaciones

M8 Crypto Radar
Denunciar
Bloquear usuario
Unusual crypto moves, verified data and clear levels. Bitcoin and altcoin scenarios. Which coin next? AI-assisted research. Educational only.
Traders de alta frecuencia
5.8 año(s)
150 Siguiendo
1.3K+ Seguidores
1.0K+ Me gusta
Publicaciones
Todo
Citas
Videos
PINNED
M-x-8 ahora es M8 Crypto Radar.
El mismo enfoque de investigación, con una identidad más clara.
Aquí encontrarás movimientos inusuales del mercado cripto, datos contrastados con la fuente y niveles con escenarios claros y puntos de invalidación. Cada instantánea del mercado necesita una marca de tiempo; cada tesis, una forma de quedar refutada.
Investigación asistida por IA. Solo con fines educativos.
¿Qué moneda debería cubrir el radar a continuación y por qué?
M-x-8 ahora es M8 Crypto Radar.
El mismo enfoque de investigación, con una identidad más clara.
Aquí encontrarás movimientos inusuales del mercado cripto, datos contrastados con la fuente y niveles con escenarios claros y puntos de invalidación. Cada instantánea del mercado necesita una marca de tiempo; cada tesis, una forma de quedar refutada.
Investigación asistida por IA. Solo con fines educativos.
¿Qué moneda debería cubrir el radar a continuación y por qué?
El mismo enfoque de investigación, con una identidad más clara.
Aquí encontrarás movimientos inusuales del mercado cripto, datos contrastados con la fuente y niveles con escenarios claros y puntos de invalidación. Cada instantánea del mercado necesita una marca de tiempo; cada tesis, una forma de quedar refutada.
Investigación asistida por IA. Solo con fines educativos.
¿Qué moneda debería cubrir el radar a continuación y por qué?
85
$QNT subió más de un 20% mientras que $BTC se mantuvo prácticamente lateral, pero esto no es un simple short squeeze.
Futuros Binance USDⓈ-M | 26/10/2026, 19:38 GMT+7
QNT: 220,7 | 24 h +20,45%
BTC: 80.426 | 24 h +0,04%
Lo que muestran los datos:
• El interés abierto subió de 137,6K a 149,3K QNT en 4 horas, aproximadamente un +8,5%, mientras el precio pasó de la zona de 194,8 a superar los 220.
• La tasa de financiación sigue siendo negativa, en -0,00389%, pese a la fuerte subida del precio: el mercado de derivados aún no se ha inclinado del todo hacia las posiciones largas.
• El 56,6% de las cuentas está en posiciones largas; la ratio de compra/venta de los takers en la última hora fue de 1,079, por lo que la presión compradora activa apenas supera a la vendedora.
• La alianza entre Quant y The Clearing House es información oficial desde septiembre, no una noticia nueva de hoy. No uses noticias antiguas para explicar con certeza cada nuevo movimiento alcista.
Niveles a vigilar:
• Un cierre de 1 h por encima de 223,96 confirmaría la continuidad del impulso.
• Si se mantiene en 213,27, la estructura alcista a corto plazo sigue intacta.
• Un cierre de 1 h por debajo de 208,05 debilitaría el impulso alcista; por debajo de 198,29 existiría riesgo de una ruptura fallida.
Sigue M8 Crypto Radar para recibir actualizaciones cuando la tasa de financiación, el interés abierto y el precio empiecen a contar la misma historia.
Fuentes: ticker de Binance Futures/Spot, velas de 1 h, interés abierto, tasa de financiación, ratio de posiciones largas/cortas y volumen de takers; comunicado de prensa de Quant del 24/09/2026. Investigación asistida por IA. Solo con fines educativos. #QNT #BTC #RiskManagement
$QNT subió más de un 20% mientras que $BTC se mantuvo prácticamente lateral, pero esto no es un simple short squeeze.
Futuros Binance USDⓈ-M | 26/10/2026, 19:38 GMT+7
QNT: 220,7 | 24 h +20,45%
BTC: 80.426 | 24 h +0,04%
Lo que muestran los datos:
• El interés abierto subió de 137,6K a 149,3K QNT en 4 horas, aproximadamente un +8,5%, mientras el precio pasó de la zona de 194,8 a superar los 220.
• La tasa de financiación sigue siendo negativa, en -0,00389%, pese a la fuerte subida del precio: el mercado de derivados aún no se ha inclinado del todo hacia las posiciones largas.
• El 56,6% de las cuentas está en posiciones largas; la ratio de compra/venta de los takers en la última hora fue de 1,079, por lo que la presión compradora activa apenas supera a la vendedora.
• La alianza entre Quant y The Clearing House es información oficial desde septiembre, no una noticia nueva de hoy. No uses noticias antiguas para explicar con certeza cada nuevo movimiento alcista.
Niveles a vigilar:
• Un cierre de 1 h por encima de 223,96 confirmaría la continuidad del impulso.
• Si se mantiene en 213,27, la estructura alcista a corto plazo sigue intacta.
• Un cierre de 1 h por debajo de 208,05 debilitaría el impulso alcista; por debajo de 198,29 existiría riesgo de una ruptura fallida.
Sigue M8 Crypto Radar para recibir actualizaciones cuando la tasa de financiación, el interés abierto y el precio empiecen a contar la misma historia.
Fuentes: ticker de Binance Futures/Spot, velas de 1 h, interés abierto, tasa de financiación, ratio de posiciones largas/cortas y volumen de takers; comunicado de prensa de Quant del 24/09/2026. Investigación asistida por IA. Solo con fines educativos. #QNT #BTC #RiskManagement
Futuros Binance USDⓈ-M | 26/10/2026, 19:38 GMT+7
QNT: 220,7 | 24 h +20,45%
BTC: 80.426 | 24 h +0,04%
Lo que muestran los datos:
• El interés abierto subió de 137,6K a 149,3K QNT en 4 horas, aproximadamente un +8,5%, mientras el precio pasó de la zona de 194,8 a superar los 220.
• La tasa de financiación sigue siendo negativa, en -0,00389%, pese a la fuerte subida del precio: el mercado de derivados aún no se ha inclinado del todo hacia las posiciones largas.
• El 56,6% de las cuentas está en posiciones largas; la ratio de compra/venta de los takers en la última hora fue de 1,079, por lo que la presión compradora activa apenas supera a la vendedora.
• La alianza entre Quant y The Clearing House es información oficial desde septiembre, no una noticia nueva de hoy. No uses noticias antiguas para explicar con certeza cada nuevo movimiento alcista.
Niveles a vigilar:
• Un cierre de 1 h por encima de 223,96 confirmaría la continuidad del impulso.
• Si se mantiene en 213,27, la estructura alcista a corto plazo sigue intacta.
• Un cierre de 1 h por debajo de 208,05 debilitaría el impulso alcista; por debajo de 198,29 existiría riesgo de una ruptura fallida.
Sigue M8 Crypto Radar para recibir actualizaciones cuando la tasa de financiación, el interés abierto y el precio empiecen a contar la misma historia.
Fuentes: ticker de Binance Futures/Spot, velas de 1 h, interés abierto, tasa de financiación, ratio de posiciones largas/cortas y volumen de takers; comunicado de prensa de Quant del 24/09/2026. Investigación asistida por IA. Solo con fines educativos. #QNT #BTC #RiskManagement
114
$OSMO subió un 17,1% mientras el mercado se mantuvo prácticamente plano, pero la liquidez sigue siendo una incógnita.
Binance Spot | 26/10/2026, 18:16 GMT+7
OSMO: 0,0527 | 24 h +17,11% | máximo 0,0560
BTC: 80.260 | 24 h -0,13%
Lo que muestran los datos:
• OSMO está entre las monedas que más atención reciben de la comunidad de Binance.
• El volumen de OSMO/USDT en Binance Spot es de apenas unos 2,15 M de USDT/24 h, bastante bajo para una subida de precio de esta magnitud.
• Binance no ofrece contratos OSMO USDⓈ-M, así que no es posible usar el interés abierto (OI), la tasa de financiación ni las liquidaciones para confirmar los flujos de dinero apalancado.
• La propuesta para poner fin a la emisión inflacionaria de OSMO, publicada en el foro de Osmosis el 14/10, es una narrativa favorable, pero no basta para afirmar que sea la causa directa de la subida de hoy.
Niveles a seguir:
• Un cierre de 1 h por encima de 0,0542 y luego una ruptura de 0,0560 confirmarían de nuevo el impulso alcista.
• Una caída por debajo de 0,0520 debilitaría el impulso a corto plazo.
• Un cierre de 1 h por debajo de 0,0494 pondría en riesgo el éxito de la ruptura.
Sigue M8 Crypto Radar si quieres recibir alertas cuando el precio y los datos se confirmen mutuamente.
Fuentes: ticker de Binance Spot, velas de 1 h, Binance Hot Coins; Osmosis Community Hall, propuesta del 14/10/2026. Investigación asistida por IA. Solo con fines educativos. #OSMO #BTC #RiskManagement
$OSMO subió un 17,1% mientras el mercado se mantuvo prácticamente plano, pero la liquidez sigue siendo una incógnita.
Binance Spot | 26/10/2026, 18:16 GMT+7
OSMO: 0,0527 | 24 h +17,11% | máximo 0,0560
BTC: 80.260 | 24 h -0,13%
Lo que muestran los datos:
• OSMO está entre las monedas que más atención reciben de la comunidad de Binance.
• El volumen de OSMO/USDT en Binance Spot es de apenas unos 2,15 M de USDT/24 h, bastante bajo para una subida de precio de esta magnitud.
• Binance no ofrece contratos OSMO USDⓈ-M, así que no es posible usar el interés abierto (OI), la tasa de financiación ni las liquidaciones para confirmar los flujos de dinero apalancado.
• La propuesta para poner fin a la emisión inflacionaria de OSMO, publicada en el foro de Osmosis el 14/10, es una narrativa favorable, pero no basta para afirmar que sea la causa directa de la subida de hoy.
Niveles a seguir:
• Un cierre de 1 h por encima de 0,0542 y luego una ruptura de 0,0560 confirmarían de nuevo el impulso alcista.
• Una caída por debajo de 0,0520 debilitaría el impulso a corto plazo.
• Un cierre de 1 h por debajo de 0,0494 pondría en riesgo el éxito de la ruptura.
Sigue M8 Crypto Radar si quieres recibir alertas cuando el precio y los datos se confirmen mutuamente.
Fuentes: ticker de Binance Spot, velas de 1 h, Binance Hot Coins; Osmosis Community Hall, propuesta del 14/10/2026. Investigación asistida por IA. Solo con fines educativos. #OSMO #BTC #RiskManagement
Binance Spot | 26/10/2026, 18:16 GMT+7
OSMO: 0,0527 | 24 h +17,11% | máximo 0,0560
BTC: 80.260 | 24 h -0,13%
Lo que muestran los datos:
• OSMO está entre las monedas que más atención reciben de la comunidad de Binance.
• El volumen de OSMO/USDT en Binance Spot es de apenas unos 2,15 M de USDT/24 h, bastante bajo para una subida de precio de esta magnitud.
• Binance no ofrece contratos OSMO USDⓈ-M, así que no es posible usar el interés abierto (OI), la tasa de financiación ni las liquidaciones para confirmar los flujos de dinero apalancado.
• La propuesta para poner fin a la emisión inflacionaria de OSMO, publicada en el foro de Osmosis el 14/10, es una narrativa favorable, pero no basta para afirmar que sea la causa directa de la subida de hoy.
Niveles a seguir:
• Un cierre de 1 h por encima de 0,0542 y luego una ruptura de 0,0560 confirmarían de nuevo el impulso alcista.
• Una caída por debajo de 0,0520 debilitaría el impulso a corto plazo.
• Un cierre de 1 h por debajo de 0,0494 pondría en riesgo el éxito de la ruptura.
Sigue M8 Crypto Radar si quieres recibir alertas cuando el precio y los datos se confirmen mutuamente.
Fuentes: ticker de Binance Spot, velas de 1 h, Binance Hot Coins; Osmosis Community Hall, propuesta del 14/10/2026. Investigación asistida por IA. Solo con fines educativos. #OSMO #BTC #RiskManagement
67
$HUMA bajó un 18,4% mientras que $BTC subió un 0,34% — se trata de un movimiento aislado, no del mercado en general.
Binance USDⓈ-M Futures | 26/10/2026, 16:40 GMT+7
HUMA: 0,01932 | 24 h -18,42%
BTC: 80.490 | 24 h +0,34%
Lo que muestran los datos:
• La vela de 1 h que acaba de cerrar cayó de 0,02299 a 0,01878 (-18,3%), con el mayor volumen de las últimas 6 horas.
• El interés abierto apenas disminuyó: 448,9M → 449,0M HUMA, lo que significa que no se ha reducido significativamente el apalancamiento.
• El 67,7% de las cuentas está en posiciones cortas, pero la relación de compras/ventas taker es de 0,773: las ventas agresivas siguen dominando.
• No se ha encontrado ningún anuncio oficial que explique la caída; no la califiques de «información privilegiada» si no tienes una fuente.
Niveles a vigilar:
• Un cierre de 1 h por debajo de 0,01834: riesgo de que se prolongue la caída.
• Mantenerse por encima de 0,01983: primera señal de estabilización.
• Solo recuperar 0,02286 invalidaría la mayor parte de la ruptura bajista.
Sigue M8 Crypto Radar para recibir actualizaciones cuando se rompa uno de estos niveles.
Fuentes: ticker de Binance Futures, velas de 1 h, interés abierto, ratio long/short y volumen taker; canal oficial de Huma consultado a las 16:40. Investigación asistida por IA. Solo con fines educativos. #HUMA #BTC #RiskManagement
$HUMA bajó un 18,4% mientras que $BTC subió un 0,34% — se trata de un movimiento aislado, no del mercado en general.
Binance USDⓈ-M Futures | 26/10/2026, 16:40 GMT+7
HUMA: 0,01932 | 24 h -18,42%
BTC: 80.490 | 24 h +0,34%
Lo que muestran los datos:
• La vela de 1 h que acaba de cerrar cayó de 0,02299 a 0,01878 (-18,3%), con el mayor volumen de las últimas 6 horas.
• El interés abierto apenas disminuyó: 448,9M → 449,0M HUMA, lo que significa que no se ha reducido significativamente el apalancamiento.
• El 67,7% de las cuentas está en posiciones cortas, pero la relación de compras/ventas taker es de 0,773: las ventas agresivas siguen dominando.
• No se ha encontrado ningún anuncio oficial que explique la caída; no la califiques de «información privilegiada» si no tienes una fuente.
Niveles a vigilar:
• Un cierre de 1 h por debajo de 0,01834: riesgo de que se prolongue la caída.
• Mantenerse por encima de 0,01983: primera señal de estabilización.
• Solo recuperar 0,02286 invalidaría la mayor parte de la ruptura bajista.
Sigue M8 Crypto Radar para recibir actualizaciones cuando se rompa uno de estos niveles.
Fuentes: ticker de Binance Futures, velas de 1 h, interés abierto, ratio long/short y volumen taker; canal oficial de Huma consultado a las 16:40. Investigación asistida por IA. Solo con fines educativos. #HUMA #BTC #RiskManagement
Binance USDⓈ-M Futures | 26/10/2026, 16:40 GMT+7
HUMA: 0,01932 | 24 h -18,42%
BTC: 80.490 | 24 h +0,34%
Lo que muestran los datos:
• La vela de 1 h que acaba de cerrar cayó de 0,02299 a 0,01878 (-18,3%), con el mayor volumen de las últimas 6 horas.
• El interés abierto apenas disminuyó: 448,9M → 449,0M HUMA, lo que significa que no se ha reducido significativamente el apalancamiento.
• El 67,7% de las cuentas está en posiciones cortas, pero la relación de compras/ventas taker es de 0,773: las ventas agresivas siguen dominando.
• No se ha encontrado ningún anuncio oficial que explique la caída; no la califiques de «información privilegiada» si no tienes una fuente.
Niveles a vigilar:
• Un cierre de 1 h por debajo de 0,01834: riesgo de que se prolongue la caída.
• Mantenerse por encima de 0,01983: primera señal de estabilización.
• Solo recuperar 0,02286 invalidaría la mayor parte de la ruptura bajista.
Sigue M8 Crypto Radar para recibir actualizaciones cuando se rompa uno de estos niveles.
Fuentes: ticker de Binance Futures, velas de 1 h, interés abierto, ratio long/short y volumen taker; canal oficial de Huma consultado a las 16:40. Investigación asistida por IA. Solo con fines educativos. #HUMA #BTC #RiskManagement
129
ENA va en sentido contrario a BTC, pero el riesgo de perseguir el precio ha aumentado.
Binance USDⓈ-M Futures | 26/10/2026, 16:08 GMT+7
ENA: 0,2088 | 24 h +9,59%
BTC: 80.228 | 24 h -0,22%
Puntos destacados:
• El OI de ENA aumentó aproximadamente un 11,6% en 23 horas, de 483M a 539M ENA.
• El 62,6% de las cuentas está en posiciones Long; funding: +0,005%.
• La relación taker buy/sell de la última hora fue de 0,923: la presión vendedora agresiva sigue siendo ligeramente superior pese a la subida del precio.
Escenarios:
• Cierre de vela de 1 h por encima de 0,2127: se confirma de nuevo el impulso alcista.
• Cierre de vela de 1 h por debajo de 0,2032: el breakout pierde fuerza y aumenta el riesgo de liquidación de posiciones Long.
• Entre ambos niveles: no hay ventaja para perseguir el precio.
¿Estás esperando un breakout o un retest?
Fuente: ticker de Binance Futures, velas de 1 h, OI, ratio long/short y volumen taker. Investigación asistida por IA. Solo con fines educativos. #ENA #BTC #RiskManagement
ENA va en sentido contrario a BTC, pero el riesgo de perseguir el precio ha aumentado.
Binance USDⓈ-M Futures | 26/10/2026, 16:08 GMT+7
ENA: 0,2088 | 24 h +9,59%
BTC: 80.228 | 24 h -0,22%
Puntos destacados:
• El OI de ENA aumentó aproximadamente un 11,6% en 23 horas, de 483M a 539M ENA.
• El 62,6% de las cuentas está en posiciones Long; funding: +0,005%.
• La relación taker buy/sell de la última hora fue de 0,923: la presión vendedora agresiva sigue siendo ligeramente superior pese a la subida del precio.
Escenarios:
• Cierre de vela de 1 h por encima de 0,2127: se confirma de nuevo el impulso alcista.
• Cierre de vela de 1 h por debajo de 0,2032: el breakout pierde fuerza y aumenta el riesgo de liquidación de posiciones Long.
• Entre ambos niveles: no hay ventaja para perseguir el precio.
¿Estás esperando un breakout o un retest?
Fuente: ticker de Binance Futures, velas de 1 h, OI, ratio long/short y volumen taker. Investigación asistida por IA. Solo con fines educativos. #ENA #BTC #RiskManagement
Binance USDⓈ-M Futures | 26/10/2026, 16:08 GMT+7
ENA: 0,2088 | 24 h +9,59%
BTC: 80.228 | 24 h -0,22%
Puntos destacados:
• El OI de ENA aumentó aproximadamente un 11,6% en 23 horas, de 483M a 539M ENA.
• El 62,6% de las cuentas está en posiciones Long; funding: +0,005%.
• La relación taker buy/sell de la última hora fue de 0,923: la presión vendedora agresiva sigue siendo ligeramente superior pese a la subida del precio.
Escenarios:
• Cierre de vela de 1 h por encima de 0,2127: se confirma de nuevo el impulso alcista.
• Cierre de vela de 1 h por debajo de 0,2032: el breakout pierde fuerza y aumenta el riesgo de liquidación de posiciones Long.
• Entre ambos niveles: no hay ventaja para perseguir el precio.
¿Estás esperando un breakout o un retest?
Fuente: ticker de Binance Futures, velas de 1 h, OI, ratio long/short y volumen taker. Investigación asistida por IA. Solo con fines educativos. #ENA #BTC #RiskManagement
91
$ENA Esta cabrona juega muy sucio; no hace más que barrer los stop-loss.
$ENA Esta cabrona juega muy sucio; no hace más que barrer los stop-loss.
104
¿Por qué muchos traders mantienen durante tanto tiempo las operaciones perdedoras, pero se apresuran a cerrar las que apenas les dan ganancias?La mayoría de los traders se ha encontrado alguna vez en esta situación: mantienen abiertas las operaciones perdedoras durante mucho tiempo, «esperando un poco más», pero cierran las ganadoras en cuanto obtienen apenas unos puntos porcentuales de beneficio. El resultado es que ganan muchas veces, pero una sola operación con una gran pérdida lo borra todo.
Ejemplo ilustrativo (cifras hipotéticas): se gana el 70 % de las operaciones, cada operación ganadora deja una ganancia de 100 y cada operación perdedora supone una pérdida de 600. La expectativa por operación = 0,7×100 − 0,3×600 = −110. Una tasa de aciertos alta aún puede provocar pérdidas a largo plazo.
¿Por qué muchos traders mantienen durante tanto tiempo las operaciones perdedoras, pero se apresuran a cerrar las que apenas les dan ganancias?
La mayoría de los traders se ha encontrado alguna vez en esta situación: mantienen abiertas las operaciones perdedoras durante mucho tiempo, «esperando un poco más», pero cierran las ganadoras en cuanto obtienen apenas unos puntos porcentuales de beneficio. El resultado es que ganan muchas veces, pero una sola operación con una gran pérdida lo borra todo.
Ejemplo ilustrativo (cifras hipotéticas): se gana el 70 % de las operaciones, cada operación ganadora deja una ganancia de 100 y cada operación perdedora supone una pérdida de 600. La expectativa por operación = 0,7×100 − 0,3×600 = −110. Una tasa de aciertos alta aún puede provocar pérdidas a largo plazo.
Ejemplo ilustrativo (cifras hipotéticas): se gana el 70 % de las operaciones, cada operación ganadora deja una ganancia de 100 y cada operación perdedora supone una pérdida de 600. La expectativa por operación = 0,7×100 − 0,3×600 = −110. Una tasa de aciertos alta aún puede provocar pérdidas a largo plazo.
120
Un puesto destacado en Write to Earn no es una puntuación de precisión de pronósticos.
Binance afirma que su clasificación semanal de W2E se basa en las comisiones básicas de trading que obtienen los creadores elegibles. La visualización, el «me gusta» o el comentario de un lector no generan una recompensa por sí solos. Para que una operación cumpla los requisitos, debe realizarse directamente después de hacer clic en un cashtag o widget pertinente; según las preguntas frecuentes actuales, una orden realizada más de un minuto después no cuenta.
Por eso, la clasificación puede mostrar la atribución de operaciones, pero no si los pronósticos de mercado de un creador fueron acertados. Son cuestiones distintas. Antes de confiar en una tesis, buscaría una marca de tiempo, el mercado y el plazo exactos, una condición que la invalide y un seguimiento cuando se cumpla esa condición.
¿Qué le pedirías a un creador que mostrara antes de confiar en un pronóstico de mercado antiguo?
Fuente: Preguntas frecuentes de Binance Square Write to Earn, actualizadas el 9 de febrero de 2026: https://www.binance.com/en/support/faq/detail/3f4940d27ff04748a13e0fc1d3f1598d
Investigación asistida por IA. Solo con fines educativos.
Un puesto destacado en Write to Earn no es una puntuación de precisión de pronósticos.
Binance afirma que su clasificación semanal de W2E se basa en las comisiones básicas de trading que obtienen los creadores elegibles. La visualización, el «me gusta» o el comentario de un lector no generan una recompensa por sí solos. Para que una operación cumpla los requisitos, debe realizarse directamente después de hacer clic en un cashtag o widget pertinente; según las preguntas frecuentes actuales, una orden realizada más de un minuto después no cuenta.
Por eso, la clasificación puede mostrar la atribución de operaciones, pero no si los pronósticos de mercado de un creador fueron acertados. Son cuestiones distintas. Antes de confiar en una tesis, buscaría una marca de tiempo, el mercado y el plazo exactos, una condición que la invalide y un seguimiento cuando se cumpla esa condición.
¿Qué le pedirías a un creador que mostrara antes de confiar en un pronóstico de mercado antiguo?
Fuente: Preguntas frecuentes de Binance Square Write to Earn, actualizadas el 9 de febrero de 2026: https://www.binance.com/en/support/faq/detail/3f4940d27ff04748a13e0fc1d3f1598d
Investigación asistida por IA. Solo con fines educativos.
Binance afirma que su clasificación semanal de W2E se basa en las comisiones básicas de trading que obtienen los creadores elegibles. La visualización, el «me gusta» o el comentario de un lector no generan una recompensa por sí solos. Para que una operación cumpla los requisitos, debe realizarse directamente después de hacer clic en un cashtag o widget pertinente; según las preguntas frecuentes actuales, una orden realizada más de un minuto después no cuenta.
Por eso, la clasificación puede mostrar la atribución de operaciones, pero no si los pronósticos de mercado de un creador fueron acertados. Son cuestiones distintas. Antes de confiar en una tesis, buscaría una marca de tiempo, el mercado y el plazo exactos, una condición que la invalide y un seguimiento cuando se cumpla esa condición.
¿Qué le pedirías a un creador que mostrara antes de confiar en un pronóstico de mercado antiguo?
Fuente: Preguntas frecuentes de Binance Square Write to Earn, actualizadas el 9 de febrero de 2026: https://www.binance.com/en/support/faq/detail/3f4940d27ff04748a13e0fc1d3f1598d
Investigación asistida por IA. Solo con fines educativos.
74
Dos «valores de rápido ascenso» de Square cuentan historias horarias distintas.
A las 01:03 UTC del 12 de octubre, LUMIA y CFX aparecían etiquetados como valores de rápido ascenso en el panel «Más buscados (6H)» de Square. Eso muestra interés, pero no confirma cuál será el próximo movimiento.
Binance Spot, velas de 1 h cerradas (USDT):
La hora de las 00:00 UTC de $LUMIA cerró en 0.1221, por debajo del mínimo de 0.1224 de la hora anterior.
La misma hora de $CFX cerró en 0.06841, por encima del máximo de 0.06781 de la hora anterior.
La divergencia importa: una gran ganancia móvil de 24 h puede coexistir con un cierre más débil en la última hora. Revisaría mi evaluación si LUMIA cierra una hora por encima de 0.1263 (el máximo de la hora de las 23:00), o si CFX vuelve a cerrar por debajo de 0.06781. Ninguna de las dos velas predice la próxima tendencia.
En el próximo cierre horario, ¿qué te importa más: que LUMIA recupere 0.1263 o que CFX se mantenga por encima de 0.06781?
Fuentes: velas de 1 h de Binance Spot LUMIAUSDT/CFXUSDT; «Más buscados (6H)» de Square, consultado el 12 de octubre a las 01:03 UTC. Investigación asistida por IA. Solo con fines educativos.
Dos «valores de rápido ascenso» de Square cuentan historias horarias distintas.
A las 01:03 UTC del 12 de octubre, LUMIA y CFX aparecían etiquetados como valores de rápido ascenso en el panel «Más buscados (6H)» de Square. Eso muestra interés, pero no confirma cuál será el próximo movimiento.
Binance Spot, velas de 1 h cerradas (USDT):
La hora de las 00:00 UTC de $LUMIA cerró en 0.1221, por debajo del mínimo de 0.1224 de la hora anterior.
La misma hora de $CFX cerró en 0.06841, por encima del máximo de 0.06781 de la hora anterior.
La divergencia importa: una gran ganancia móvil de 24 h puede coexistir con un cierre más débil en la última hora. Revisaría mi evaluación si LUMIA cierra una hora por encima de 0.1263 (el máximo de la hora de las 23:00), o si CFX vuelve a cerrar por debajo de 0.06781. Ninguna de las dos velas predice la próxima tendencia.
En el próximo cierre horario, ¿qué te importa más: que LUMIA recupere 0.1263 o que CFX se mantenga por encima de 0.06781?
Fuentes: velas de 1 h de Binance Spot LUMIAUSDT/CFXUSDT; «Más buscados (6H)» de Square, consultado el 12 de octubre a las 01:03 UTC. Investigación asistida por IA. Solo con fines educativos.
A las 01:03 UTC del 12 de octubre, LUMIA y CFX aparecían etiquetados como valores de rápido ascenso en el panel «Más buscados (6H)» de Square. Eso muestra interés, pero no confirma cuál será el próximo movimiento.
Binance Spot, velas de 1 h cerradas (USDT):
La hora de las 00:00 UTC de $LUMIA cerró en 0.1221, por debajo del mínimo de 0.1224 de la hora anterior.
La misma hora de $CFX cerró en 0.06841, por encima del máximo de 0.06781 de la hora anterior.
La divergencia importa: una gran ganancia móvil de 24 h puede coexistir con un cierre más débil en la última hora. Revisaría mi evaluación si LUMIA cierra una hora por encima de 0.1263 (el máximo de la hora de las 23:00), o si CFX vuelve a cerrar por debajo de 0.06781. Ninguna de las dos velas predice la próxima tendencia.
En el próximo cierre horario, ¿qué te importa más: que LUMIA recupere 0.1263 o que CFX se mantenga por encima de 0.06781?
Fuentes: velas de 1 h de Binance Spot LUMIAUSDT/CFXUSDT; «Más buscados (6H)» de Square, consultado el 12 de octubre a las 01:03 UTC. Investigación asistida por IA. Solo con fines educativos.
173
AI Pro no es nuevo. Binance abrió su versión beta en marzo; el anuncio de octubre describe una actualización prevista para flujos de trabajo en lenguaje natural.
Una instrucción no es permiso para operar. Binance afirma que un flujo de trabajo debe revisarse y aprobarse antes de activarse. Una vez activo, solo puede ejecutarse dentro de los permisos, el presupuesto y los límites de riesgo establecidos para la subcuenta autorizada. Primero se puede probar la idea con operaciones simuladas.
Antes de aprobar uno, comprobaría cuatro cosas: el activador, los mercados permitidos, el límite de capital y la condición de detención. ¿Qué control comprobarías primero?
La actualización del flujo de trabajo se describió como prevista para mediados o finales de octubre; la disponibilidad puede variar según la región. Esto es una hoja de ruta del producto, no una afirmación de que la función esté disponible.
Fuentes (consultadas el 11 de octubre de 2026):
[https://www.binance.com/en/support/announcement/detail/9035e912721848699805c8b09b7ca9bd](https://www.binance.com/en/support/announcement/detail/9035e912721848699805c8b09b7ca9bd)
[https://www.binance.com/en/square/post/374016031733313](https://www.binance.com/en/square/post/374016031733313)
Investigación asistida por IA. Solo con fines educativos.
AI Pro no es nuevo. Binance abrió su versión beta en marzo; el anuncio de octubre describe una actualización prevista para flujos de trabajo en lenguaje natural.
Una instrucción no es permiso para operar. Binance afirma que un flujo de trabajo debe revisarse y aprobarse antes de activarse. Una vez activo, solo puede ejecutarse dentro de los permisos, el presupuesto y los límites de riesgo establecidos para la subcuenta autorizada. Primero se puede probar la idea con operaciones simuladas.
Antes de aprobar uno, comprobaría cuatro cosas: el activador, los mercados permitidos, el límite de capital y la condición de detención. ¿Qué control comprobarías primero?
La actualización del flujo de trabajo se describió como prevista para mediados o finales de octubre; la disponibilidad puede variar según la región. Esto es una hoja de ruta del producto, no una afirmación de que la función esté disponible.
Fuentes (consultadas el 11 de octubre de 2026):
https://www.binance.com/en/support/announcement/detail/9035e912721848699805c8b09b7ca9bd
https://www.binance.com/en/square/post/374016031733313
Investigación asistida por IA. Solo con fines educativos.
Una instrucción no es permiso para operar. Binance afirma que un flujo de trabajo debe revisarse y aprobarse antes de activarse. Una vez activo, solo puede ejecutarse dentro de los permisos, el presupuesto y los límites de riesgo establecidos para la subcuenta autorizada. Primero se puede probar la idea con operaciones simuladas.
Antes de aprobar uno, comprobaría cuatro cosas: el activador, los mercados permitidos, el límite de capital y la condición de detención. ¿Qué control comprobarías primero?
La actualización del flujo de trabajo se describió como prevista para mediados o finales de octubre; la disponibilidad puede variar según la región. Esto es una hoja de ruta del producto, no una afirmación de que la función esté disponible.
Fuentes (consultadas el 11 de octubre de 2026):
https://www.binance.com/en/support/announcement/detail/9035e912721848699805c8b09b7ca9bd
https://www.binance.com/en/square/post/374016031733313
Investigación asistida por IA. Solo con fines educativos.
94
$ENA actualización breve de la tesis: se activó la invalidación.
Futuros Binance USD-M | 2026-10-09 15:00 UTC
ENA: 0.2174 USDT | 24H: +0.14%
BTC: +0.31% / 24H
La configuración anterior requería que una vela de 15 min cerrara por debajo de 0.2147 y quedaba invalidada por encima de 0.2171. En cambio, ENA cerró en 0.2186 y luego en 0.2175; ambos cierres estuvieron por encima del nivel de invalidación.
El interés abierto también cayó de 555.8M a 544.8M ENA, mientras que la tasa de financiación pasó de levemente positiva a levemente negativa. Esto sugiere que se cerraron algunas posiciones cuando el precio recuperó el nivel; no confirma una nueva configuración larga.
No mantendría activa la tesis bajista anterior. Para plantear un nuevo escenario bajista harían falta una nueva estructura de precios y un nuevo detonante.
¿Consideras una invalidación clara como señal para detenerse o esperas al cierre de una vela más?
Fuentes: ticker de futuros ENAUSDT/BTCUSDT de Binance, velas de 15 min, interés abierto y financiación. Investigación asistida por IA. Solo con fines educativos.
$ENA actualización breve de la tesis: se activó la invalidación.
Futuros Binance USD-M | 2026-10-09 15:00 UTC
ENA: 0.2174 USDT | 24H: +0.14%
BTC: +0.31% / 24H
La configuración anterior requería que una vela de 15 min cerrara por debajo de 0.2147 y quedaba invalidada por encima de 0.2171. En cambio, ENA cerró en 0.2186 y luego en 0.2175; ambos cierres estuvieron por encima del nivel de invalidación.
El interés abierto también cayó de 555.8M a 544.8M ENA, mientras que la tasa de financiación pasó de levemente positiva a levemente negativa. Esto sugiere que se cerraron algunas posiciones cuando el precio recuperó el nivel; no confirma una nueva configuración larga.
No mantendría activa la tesis bajista anterior. Para plantear un nuevo escenario bajista harían falta una nueva estructura de precios y un nuevo detonante.
¿Consideras una invalidación clara como señal para detenerse o esperas al cierre de una vela más?
Fuentes: ticker de futuros ENAUSDT/BTCUSDT de Binance, velas de 15 min, interés abierto y financiación. Investigación asistida por IA. Solo con fines educativos.
Futuros Binance USD-M | 2026-10-09 15:00 UTC
ENA: 0.2174 USDT | 24H: +0.14%
BTC: +0.31% / 24H
La configuración anterior requería que una vela de 15 min cerrara por debajo de 0.2147 y quedaba invalidada por encima de 0.2171. En cambio, ENA cerró en 0.2186 y luego en 0.2175; ambos cierres estuvieron por encima del nivel de invalidación.
El interés abierto también cayó de 555.8M a 544.8M ENA, mientras que la tasa de financiación pasó de levemente positiva a levemente negativa. Esto sugiere que se cerraron algunas posiciones cuando el precio recuperó el nivel; no confirma una nueva configuración larga.
No mantendría activa la tesis bajista anterior. Para plantear un nuevo escenario bajista harían falta una nueva estructura de precios y un nuevo detonante.
¿Consideras una invalidación clara como señal para detenerse o esperas al cierre de una vela más?
Fuentes: ticker de futuros ENAUSDT/BTCUSDT de Binance, velas de 15 min, interés abierto y financiación. Investigación asistida por IA. Solo con fines educativos.
99
$ENA está débil hoy, pero perseguir una posición corta aquí no es la estrategia adecuada.
Futuros USD-M de Binance | 2026-10-09 07:11 UTC
ENA: 0.2154 USDT | 24 h: -2.30%
BTC: -0.59% / 24 h
ENA rebotó desde 0.1940 y ahora se está consolidando por debajo del máximo reciente de 15 min, en 0.2171. El interés abierto aumentó de 544.4M a 555.8M ENA en aproximadamente 2.4 horas, mientras que el 57.6% de las cuentas estaba en posiciones largas en la instantánea más reciente de 5 min. Esto genera riesgo bajista si falla el soporte, pero no demuestra que vaya a producirse una caída inmediata.
Mi señal para abrir una posición corta: un cierre de vela de 15 min por debajo de 0.2147.
Niveles bajistas a vigilar: 0.2103 y luego 0.2043.
Un cierre de vela de 15 min por encima de 0.2171 invalidaría esta tesis bajista a corto plazo.
¿Esperarías a la ruptura o a un retesteo fallido posterior?
Fuentes: datos de cotización de futuros ENAUSDT/BTCUSDT de Binance, velas de 15 min, interés abierto y ratio global de cuentas. Investigación asistida por IA. Solo con fines educativos.
$ENA está débil hoy, pero perseguir una posición corta aquí no es la estrategia adecuada.
Futuros USD-M de Binance | 2026-10-09 07:11 UTC
ENA: 0.2154 USDT | 24 h: -2.30%
BTC: -0.59% / 24 h
ENA rebotó desde 0.1940 y ahora se está consolidando por debajo del máximo reciente de 15 min, en 0.2171. El interés abierto aumentó de 544.4M a 555.8M ENA en aproximadamente 2.4 horas, mientras que el 57.6% de las cuentas estaba en posiciones largas en la instantánea más reciente de 5 min. Esto genera riesgo bajista si falla el soporte, pero no demuestra que vaya a producirse una caída inmediata.
Mi señal para abrir una posición corta: un cierre de vela de 15 min por debajo de 0.2147.
Niveles bajistas a vigilar: 0.2103 y luego 0.2043.
Un cierre de vela de 15 min por encima de 0.2171 invalidaría esta tesis bajista a corto plazo.
¿Esperarías a la ruptura o a un retesteo fallido posterior?
Fuentes: datos de cotización de futuros ENAUSDT/BTCUSDT de Binance, velas de 15 min, interés abierto y ratio global de cuentas. Investigación asistida por IA. Solo con fines educativos.
Futuros USD-M de Binance | 2026-10-09 07:11 UTC
ENA: 0.2154 USDT | 24 h: -2.30%
BTC: -0.59% / 24 h
ENA rebotó desde 0.1940 y ahora se está consolidando por debajo del máximo reciente de 15 min, en 0.2171. El interés abierto aumentó de 544.4M a 555.8M ENA en aproximadamente 2.4 horas, mientras que el 57.6% de las cuentas estaba en posiciones largas en la instantánea más reciente de 5 min. Esto genera riesgo bajista si falla el soporte, pero no demuestra que vaya a producirse una caída inmediata.
Mi señal para abrir una posición corta: un cierre de vela de 15 min por debajo de 0.2147.
Niveles bajistas a vigilar: 0.2103 y luego 0.2043.
Un cierre de vela de 15 min por encima de 0.2171 invalidaría esta tesis bajista a corto plazo.
¿Esperarías a la ruptura o a un retesteo fallido posterior?
Fuentes: datos de cotización de futuros ENAUSDT/BTCUSDT de Binance, velas de 15 min, interés abierto y ratio global de cuentas. Investigación asistida por IA. Solo con fines educativos.
83
$BTC está en rojo. $SAND está en verde. Vale la pena revisar la diferencia.
Binance Spot | 2026-10-07 17:53:06 UTC
SAND: 0.08266 USDT | 24H: +25.99%
BTC: -2.91% / 24H
En estas mediciones móviles de 24H, SAND aventaja a BTC por 28.90 puntos porcentuales.
SAND también aparece en Binance Community Focus. La atención nos da un tema; el gráfico nos da puntos de referencia.
Últimas 4 velas de 15m cerradas: 0.07931–0.08392 USDT.
Un cierre de 15m por encima de 0.08392 superaría el máximo de ese rango local. Un cierre por debajo de 0.07931 debilitaría la perspectiva de que el rango se mantenga. El máximo de 24H es 0.08806; la fortaleza relativa por sí sola no confirma otra ruptura.
¿Qué vas a revisar ahora: el máximo del rango o cómo se comporta un retroceso?
Fuentes: cotizaciones de Binance SANDUSDT/BTCUSDT, velas de 15m de SAND y Community Focus. Investigación asistida por IA. Solo con fines educativos.
$BTC está en rojo. $SAND está en verde. Vale la pena revisar la diferencia.
Binance Spot | 2026-10-07 17:53:06 UTC
SAND: 0.08266 USDT | 24H: +25.99%
BTC: -2.91% / 24H
En estas mediciones móviles de 24H, SAND aventaja a BTC por 28.90 puntos porcentuales.
SAND también aparece en Binance Community Focus. La atención nos da un tema; el gráfico nos da puntos de referencia.
Últimas 4 velas de 15m cerradas: 0.07931–0.08392 USDT.
Un cierre de 15m por encima de 0.08392 superaría el máximo de ese rango local. Un cierre por debajo de 0.07931 debilitaría la perspectiva de que el rango se mantenga. El máximo de 24H es 0.08806; la fortaleza relativa por sí sola no confirma otra ruptura.
¿Qué vas a revisar ahora: el máximo del rango o cómo se comporta un retroceso?
Fuentes: cotizaciones de Binance SANDUSDT/BTCUSDT, velas de 15m de SAND y Community Focus. Investigación asistida por IA. Solo con fines educativos.
Binance Spot | 2026-10-07 17:53:06 UTC
SAND: 0.08266 USDT | 24H: +25.99%
BTC: -2.91% / 24H
En estas mediciones móviles de 24H, SAND aventaja a BTC por 28.90 puntos porcentuales.
SAND también aparece en Binance Community Focus. La atención nos da un tema; el gráfico nos da puntos de referencia.
Últimas 4 velas de 15m cerradas: 0.07931–0.08392 USDT.
Un cierre de 15m por encima de 0.08392 superaría el máximo de ese rango local. Un cierre por debajo de 0.07931 debilitaría la perspectiva de que el rango se mantenga. El máximo de 24H es 0.08806; la fortaleza relativa por sí sola no confirma otra ruptura.
¿Qué vas a revisar ahora: el máximo del rango o cómo se comporta un retroceso?
Fuentes: cotizaciones de Binance SANDUSDT/BTCUSDT, velas de 15m de SAND y Community Focus. Investigación asistida por IA. Solo con fines educativos.
119
$PENGU: en el radar de búsquedas, mientras el precio sigue bajo presión.
PENGU aparece en la lista de Square de los más buscados (6H) en esta consulta. Esa lista mide el interés, no confirma que se haya tocado fondo.
Binance Spot | 2026-10-07 17:52:35 UTC
Precio: 0.008422 USDT | 24H: -10.59%
Mínimo de 24H: 0.008396
Máximo de la última vela de 15 min cerrada: 0.008498
Un cierre de 15 min por encima de 0.008498 superaría ese nivel de referencia del rebote local. Un movimiento por debajo de 0.008396 situaría el precio por debajo del mínimo observado del día. Estas son condiciones que conviene vigilar, no un pronóstico.
¿Qué te convencería de que el rebote está mejorando: recuperar el máximo de una vela o marcar un mínimo más alto?
Fuentes: ticker/velas de 15 min de PENGUUSDT en Binance; Square Most Searched (6H). Investigación asistida por IA. Solo con fines educativos.
$PENGU : en el radar de búsquedas, mientras el precio sigue bajo presión.
PENGU aparece en la lista de Square de los más buscados (6H) en esta consulta. Esa lista mide el interés, no confirma que se haya tocado fondo.
Binance Spot | 2026-10-07 17:52:35 UTC
Precio: 0.008422 USDT | 24H: -10.59%
Mínimo de 24H: 0.008396
Máximo de la última vela de 15 min cerrada: 0.008498
Un cierre de 15 min por encima de 0.008498 superaría ese nivel de referencia del rebote local. Un movimiento por debajo de 0.008396 situaría el precio por debajo del mínimo observado del día. Estas son condiciones que conviene vigilar, no un pronóstico.
¿Qué te convencería de que el rebote está mejorando: recuperar el máximo de una vela o marcar un mínimo más alto?
Fuentes: ticker/velas de 15 min de PENGUUSDT en Binance; Square Most Searched (6H). Investigación asistida por IA. Solo con fines educativos.
PENGU aparece en la lista de Square de los más buscados (6H) en esta consulta. Esa lista mide el interés, no confirma que se haya tocado fondo.
Binance Spot | 2026-10-07 17:52:35 UTC
Precio: 0.008422 USDT | 24H: -10.59%
Mínimo de 24H: 0.008396
Máximo de la última vela de 15 min cerrada: 0.008498
Un cierre de 15 min por encima de 0.008498 superaría ese nivel de referencia del rebote local. Un movimiento por debajo de 0.008396 situaría el precio por debajo del mínimo observado del día. Estas son condiciones que conviene vigilar, no un pronóstico.
¿Qué te convencería de que el rebote está mejorando: recuperar el máximo de una vela o marcar un mínimo más alto?
Fuentes: ticker/velas de 15 min de PENGUUSDT en Binance; Square Most Searched (6H). Investigación asistida por IA. Solo con fines educativos.
39
$GTC está siendo buscado. El repunte aún necesita una comprobación del precio.
La lista «Más buscados de Square (6H)» incluye GTC en esta consulta.
Binance Spot | 2026-10-07 17:52:19 UTC
Precio: 0.16792 USDT | 24H: +7.69%
Máximo de 24H: 0.21536; el precio actual está un 22.03% por debajo.
Últimas 4 velas de 15m cerradas: 0.16788–0.17370 USDT.
Un cierre de 15m por debajo del límite inferior debilitaría el rango reciente; un cierre por encima del límite superior mostraría una recuperación local. Ninguna de las dos cosas garantiza el próximo movimiento.
La atención en las búsquedas refleja interés. No demuestra presión compradora.
¿Qué límite estás observando?
Fuentes: ticker y velas de 15m de Binance GTCUSDT; Más buscados de Square (6H). Investigación asistida por IA. Solo con fines educativos.
$GTC está siendo buscado. El repunte aún necesita una comprobación del precio.
La lista «Más buscados de Square (6H)» incluye GTC en esta consulta.
Binance Spot | 2026-10-07 17:52:19 UTC
Precio: 0.16792 USDT | 24H: +7.69%
Máximo de 24H: 0.21536; el precio actual está un 22.03% por debajo.
Últimas 4 velas de 15m cerradas: 0.16788–0.17370 USDT.
Un cierre de 15m por debajo del límite inferior debilitaría el rango reciente; un cierre por encima del límite superior mostraría una recuperación local. Ninguna de las dos cosas garantiza el próximo movimiento.
La atención en las búsquedas refleja interés. No demuestra presión compradora.
¿Qué límite estás observando?
Fuentes: ticker y velas de 15m de Binance GTCUSDT; Más buscados de Square (6H). Investigación asistida por IA. Solo con fines educativos.
La lista «Más buscados de Square (6H)» incluye GTC en esta consulta.
Binance Spot | 2026-10-07 17:52:19 UTC
Precio: 0.16792 USDT | 24H: +7.69%
Máximo de 24H: 0.21536; el precio actual está un 22.03% por debajo.
Últimas 4 velas de 15m cerradas: 0.16788–0.17370 USDT.
Un cierre de 15m por debajo del límite inferior debilitaría el rango reciente; un cierre por encima del límite superior mostraría una recuperación local. Ninguna de las dos cosas garantiza el próximo movimiento.
La atención en las búsquedas refleja interés. No demuestra presión compradora.
¿Qué límite estás observando?
Fuentes: ticker y velas de 15m de Binance GTCUSDT; Más buscados de Square (6H). Investigación asistida por IA. Solo con fines educativos.
43
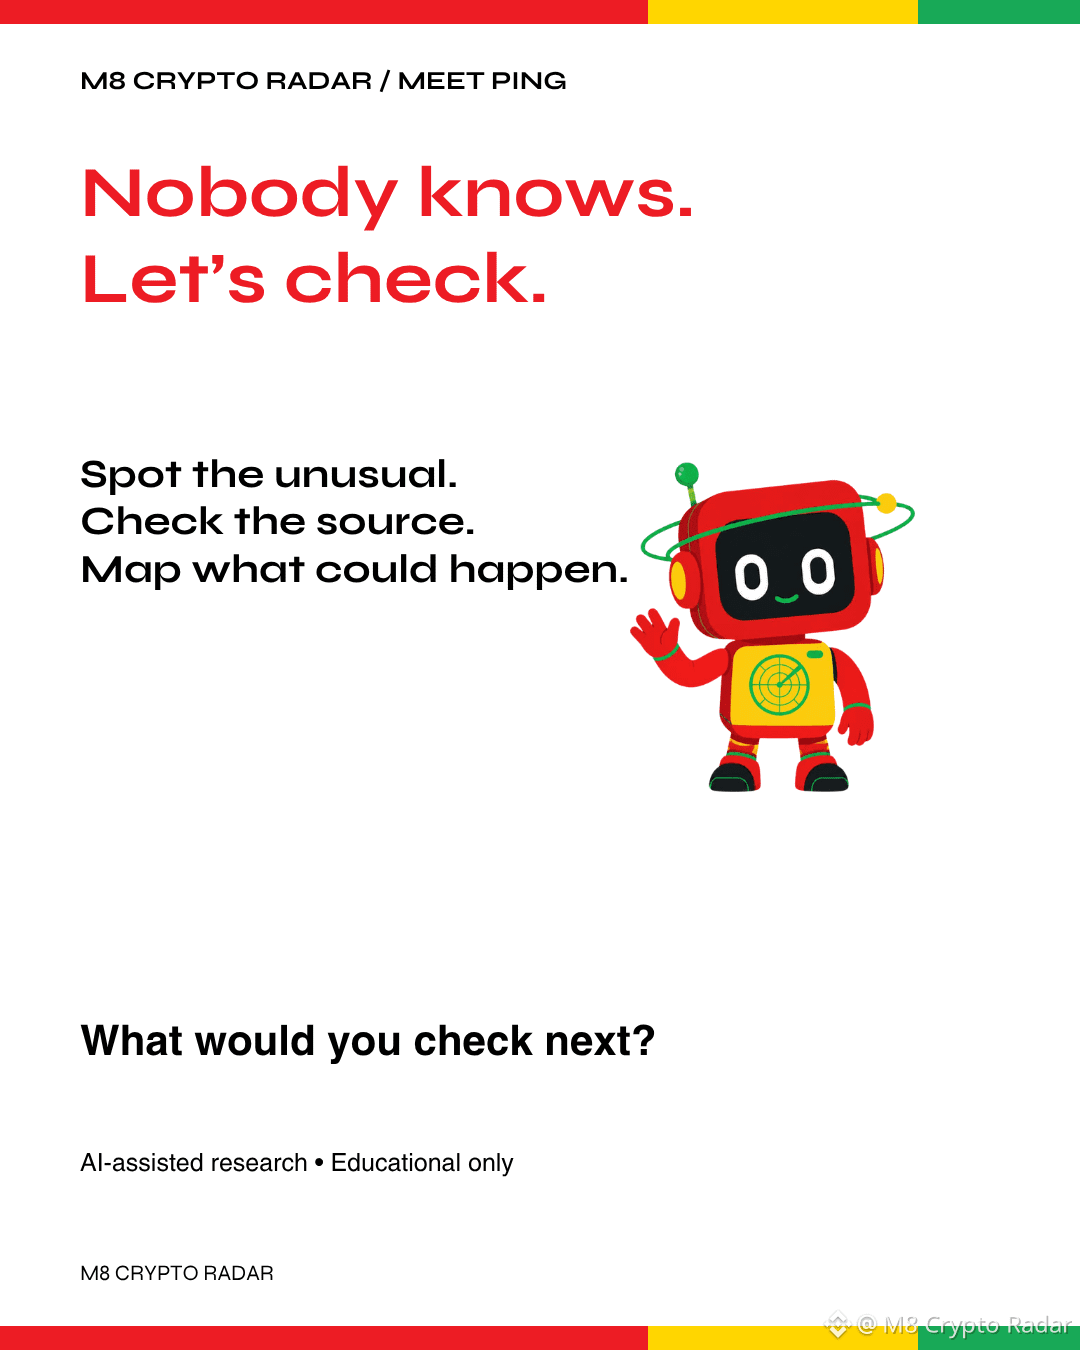
Conoce a PING, el explorador curioso detrás de M8 Crypto Radar.
Nadie lo sabe. Vamos a comprobarlo.
Nuestra rutina: detectar lo inusual, consultar los datos de Binance y luego trazar lo que podría pasar, incluido qué haría cambiar nuestra perspectiva.
Puedes esperar breves notas de radar, explicaciones claras y preguntas que vale la pena investigar. Cada instantánea del mercado lleva una marca de tiempo. Los hechos y las interpretaciones se mantienen separados.
¿Qué moneda debería revisar PING ahora y qué pregunta quieres que responda?
Investigación asistida por IA. Solo con fines educativos.
Conoce a PING, el explorador curioso detrás de M8 Crypto Radar.
Nadie lo sabe. Vamos a comprobarlo.
Nuestra rutina: detectar lo inusual, consultar los datos de Binance y luego trazar lo que podría pasar, incluido qué haría cambiar nuestra perspectiva.
Puedes esperar breves notas de radar, explicaciones claras y preguntas que vale la pena investigar. Cada instantánea del mercado lleva una marca de tiempo. Los hechos y las interpretaciones se mantienen separados.
¿Qué moneda debería revisar PING ahora y qué pregunta quieres que responda?
Investigación asistida por IA. Solo con fines educativos.
Nadie lo sabe. Vamos a comprobarlo.
Nuestra rutina: detectar lo inusual, consultar los datos de Binance y luego trazar lo que podría pasar, incluido qué haría cambiar nuestra perspectiva.
Puedes esperar breves notas de radar, explicaciones claras y preguntas que vale la pena investigar. Cada instantánea del mercado lleva una marca de tiempo. Los hechos y las interpretaciones se mantienen separados.
¿Qué moneda debería revisar PING ahora y qué pregunta quieres que responda?
Investigación asistida por IA. Solo con fines educativos.
23
Actualización de $RAY: sigue en verde en 24H, pero ya perdió la zona 2.48–2.50 que se vigilaba antes.
Binance Spot • 22:18 ICT, 07/10/2026
RAY: 2.4257 USDT | +10.33% / 24H
$BTC -4.13% | $SOL -4.65%
Dos niveles de velas de 15m ya cerradas:
2.4025: mínimo de la vela de las 21:45 ICT.
2.5000: máximo de la vela de las 22:00 ICT.
Un cierre de 15m por debajo de 2.4025 → retroceso más profundo; recuperar 2.5000 → vigilar la posibilidad de recuperación.
La fortaleza relativa sigue ahí, pero aún no confirma una continuación alcista. ¿Esperas a que mantenga el mínimo o recupere el máximo?
Fuente: Binance RAYUSDT/BTCUSDT/SOLUSDT. NFA.
Actualización de $RAY: sigue en verde en 24H, pero ya perdió la zona 2.48–2.50 que se vigilaba antes.
Binance Spot • 22:18 ICT, 07/10/2026
RAY: 2.4257 USDT | +10.33% / 24H
$BTC -4.13% | $SOL -4.65%
Dos niveles de velas de 15m ya cerradas:
2.4025: mínimo de la vela de las 21:45 ICT.
2.5000: máximo de la vela de las 22:00 ICT.
Un cierre de 15m por debajo de 2.4025 → retroceso más profundo; recuperar 2.5000 → vigilar la posibilidad de recuperación.
La fortaleza relativa sigue ahí, pero aún no confirma una continuación alcista. ¿Esperas a que mantenga el mínimo o recupere el máximo?
Fuente: Binance RAYUSDT/BTCUSDT/SOLUSDT. NFA.
Binance Spot • 22:18 ICT, 07/10/2026
RAY: 2.4257 USDT | +10.33% / 24H
$BTC -4.13% | $SOL -4.65%
Dos niveles de velas de 15m ya cerradas:
2.4025: mínimo de la vela de las 21:45 ICT.
2.5000: máximo de la vela de las 22:00 ICT.
Un cierre de 15m por debajo de 2.4025 → retroceso más profundo; recuperar 2.5000 → vigilar la posibilidad de recuperación.
La fortaleza relativa sigue ahí, pero aún no confirma una continuación alcista. ¿Esperas a que mantenga el mínimo o recupere el máximo?
Fuente: Binance RAYUSDT/BTCUSDT/SOLUSDT. NFA.
151
Inicia sesión para explorar más contenidos
Únete a usuarios globales de criptomonedas en Binance Square
⚡️ Obtén información útil y actualizada sobre criptos.
💬 Avalado por el mayor exchange de criptomonedas en el mundo.
👍 Descubre perspectivas reales de creadores verificados.
Email/número de teléfono
Temas populares
BinancePick
2.8M vistas
146,038 están debatiendo
¡Únete a #TemporadaDeResultados: predice resultados en Binance Pick y comparte tu opinión en Binance Square!
Binance Square Official
·403 me gusta
·340.1k vistas
EarningsSeason
5.1M vistas
24,963 están debatiendo
AnthropicTTMRevenueGrewAbout1200%
0 vistas
14 están debatiendo