

أميرة سيد
2.6k Publicaciones

أميرة سيد
Denunciar
Bloquear usuario
Professional Trader | Free Chart Analysis | Signal & Update about Crypto |
Abrir trade
Trader ocasional
1.3 año(s)
29 Siguiendo
1.0K+ Seguidores
499 Me gusta
Publicaciones
Cartera
Todo
Citas
·
--
Ver traducción
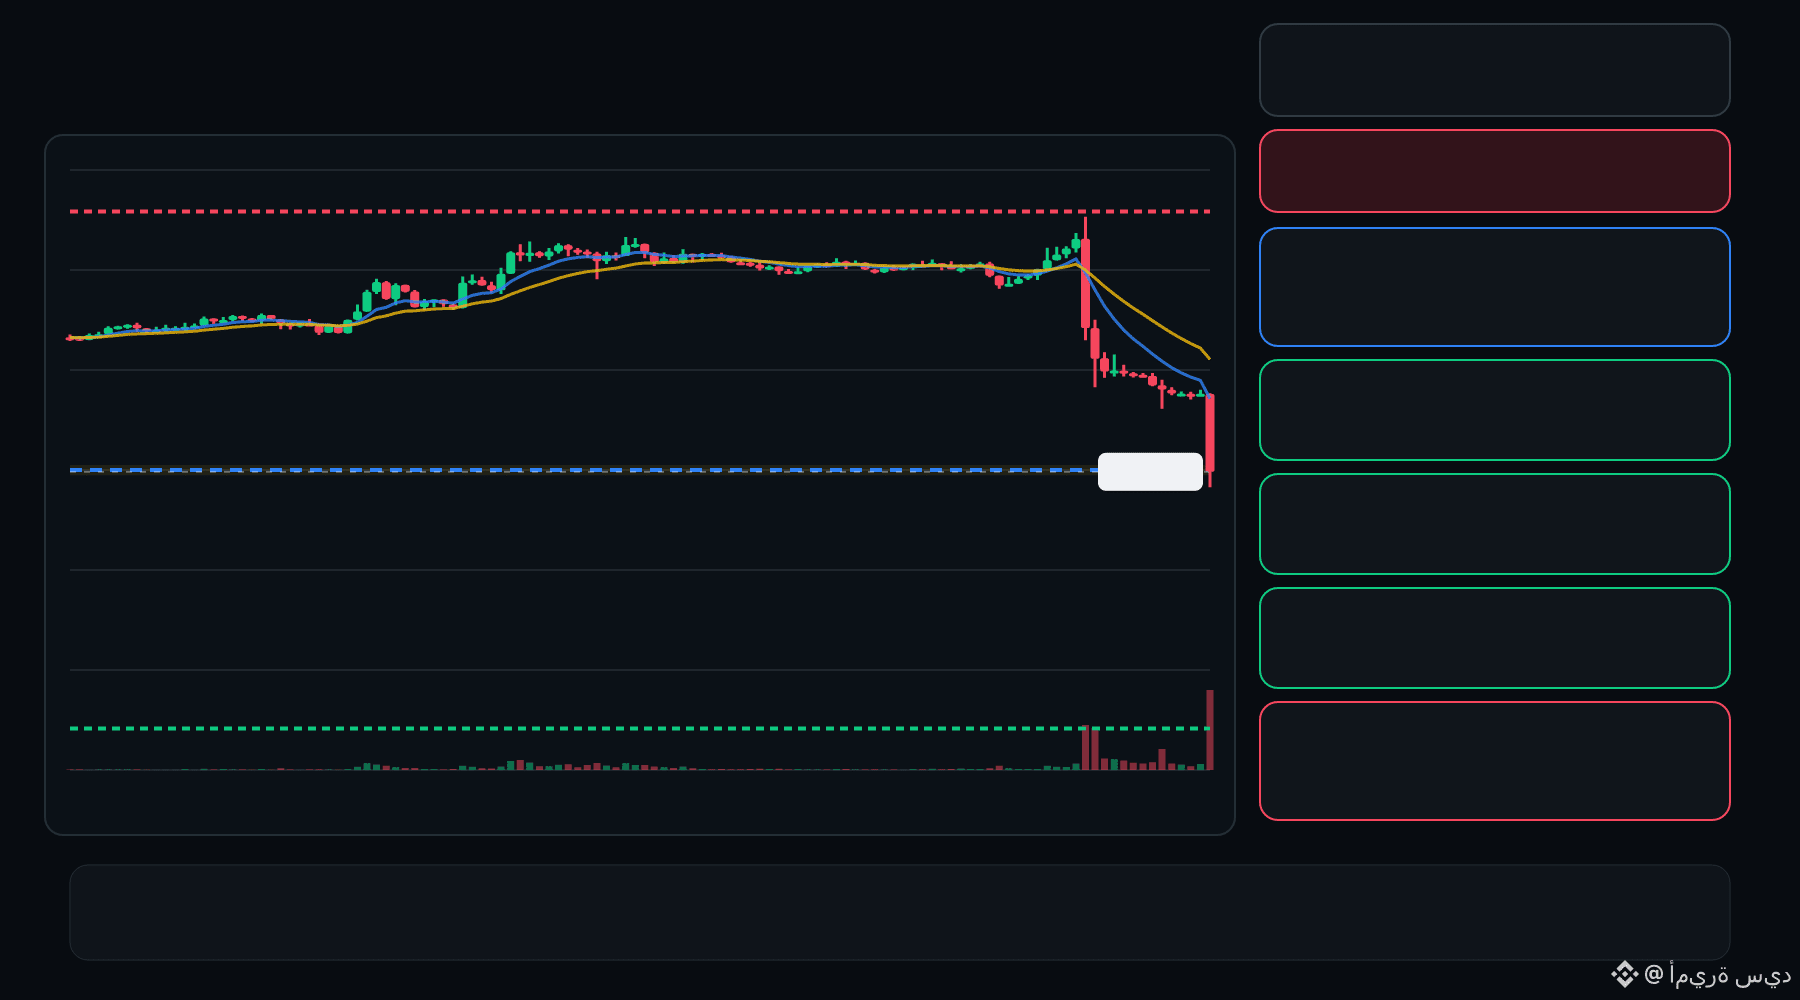
🔴 UAI bears are pressing the pullback… is the rejection getting deeper ⁉️
🔴 UAI SHORT
Entry: 0.1969 – 0.2020
TP1: 0.06194
TP2: -0.04807
TP3: -0.1581
Stop Loss: 0.3370
The 15M chart shows a bearish structure with momentum and volume confirmation. A controlled retest of the entry zone may give the setup a cleaner trigger.
Plan: Wait for confirmation/rejection inside the entry zone; don’t chase the move.
DYOR | Manage Risk | Avoid Over-Leverage
4
·
--
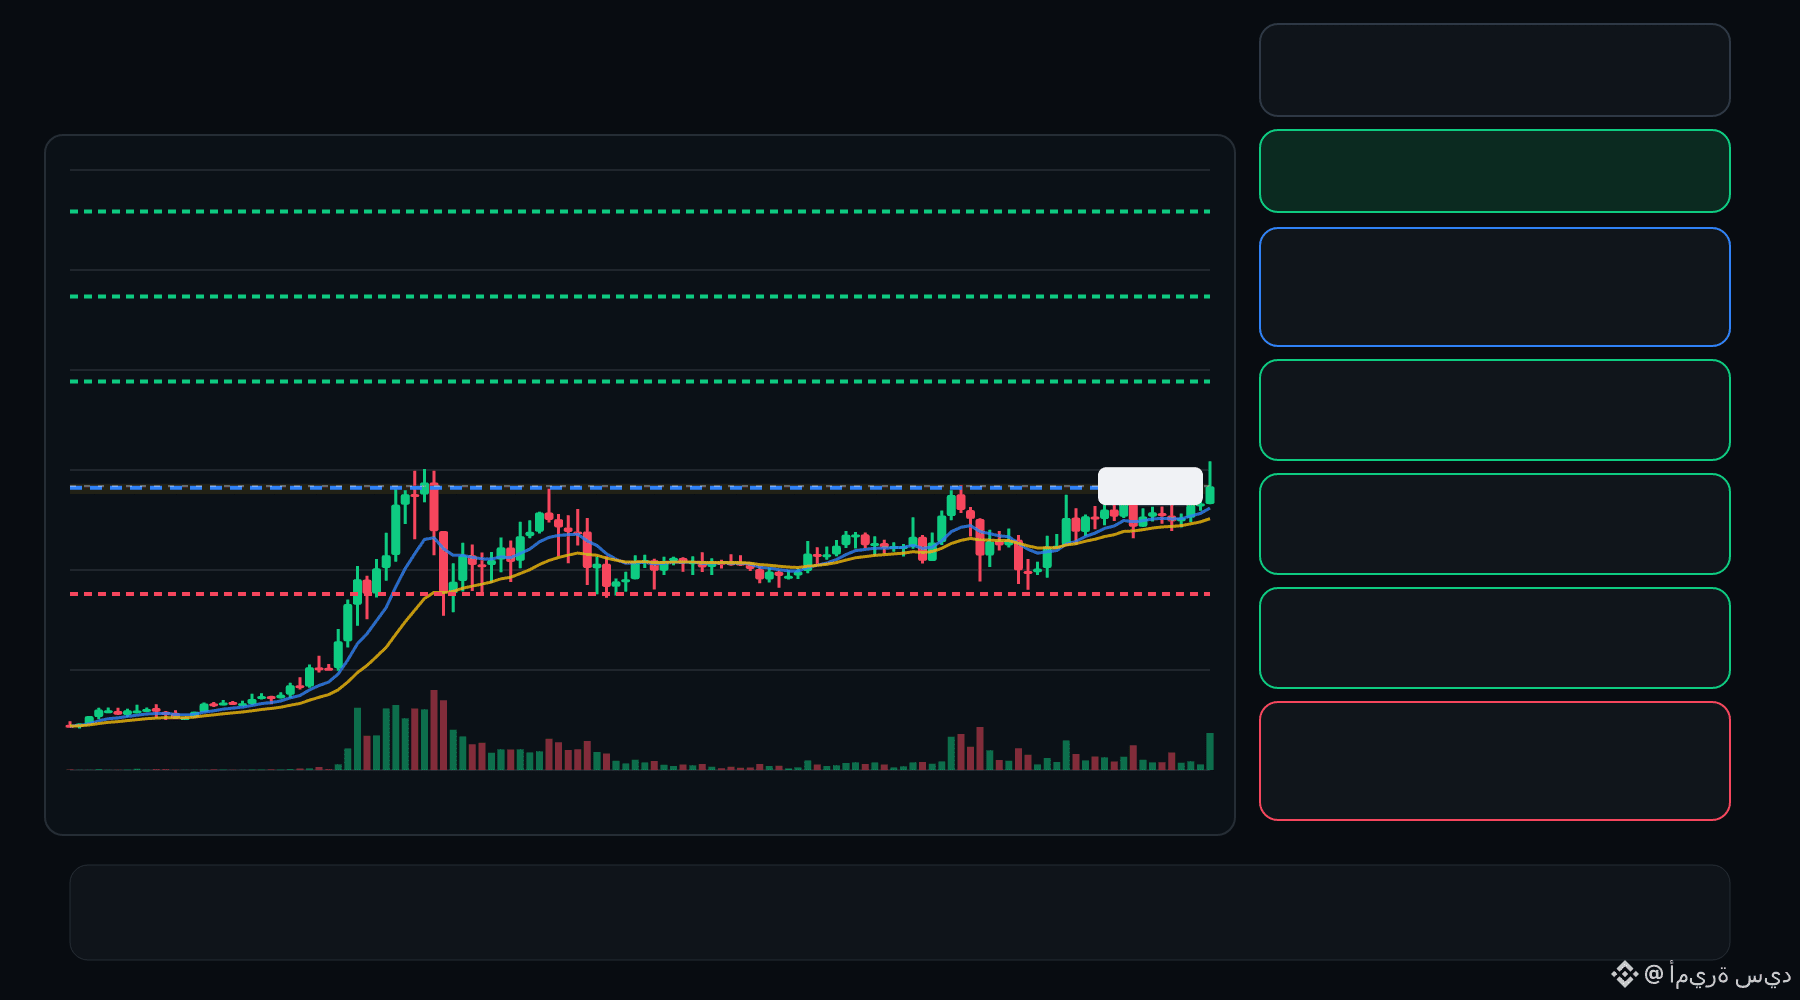
🟢 Los alcistas de AIOT están defendiendo el retroceso… ¿se está preparando la continuación? ⁉️
🟩 AIOT EN LARGO
Entrada: 0.09229 – 0.09298
TP1: 0.1021
TP2: 0.1097
TP3: 0.1174
Stop de pérdidas: 0.08312
El gráfico de 15 min muestra una estructura alcista, con confirmación del impulso y del volumen. Una nueva prueba controlada de la zona de entrada podría ofrecer una señal más clara para activar la operación.
Plan: Espera una confirmación o rechazo dentro de la zona de entrada; no persigas el movimiento.
Haz tu propia investigación | Gestiona el riesgo | Evita el apalancamiento excesivo
7
·
--
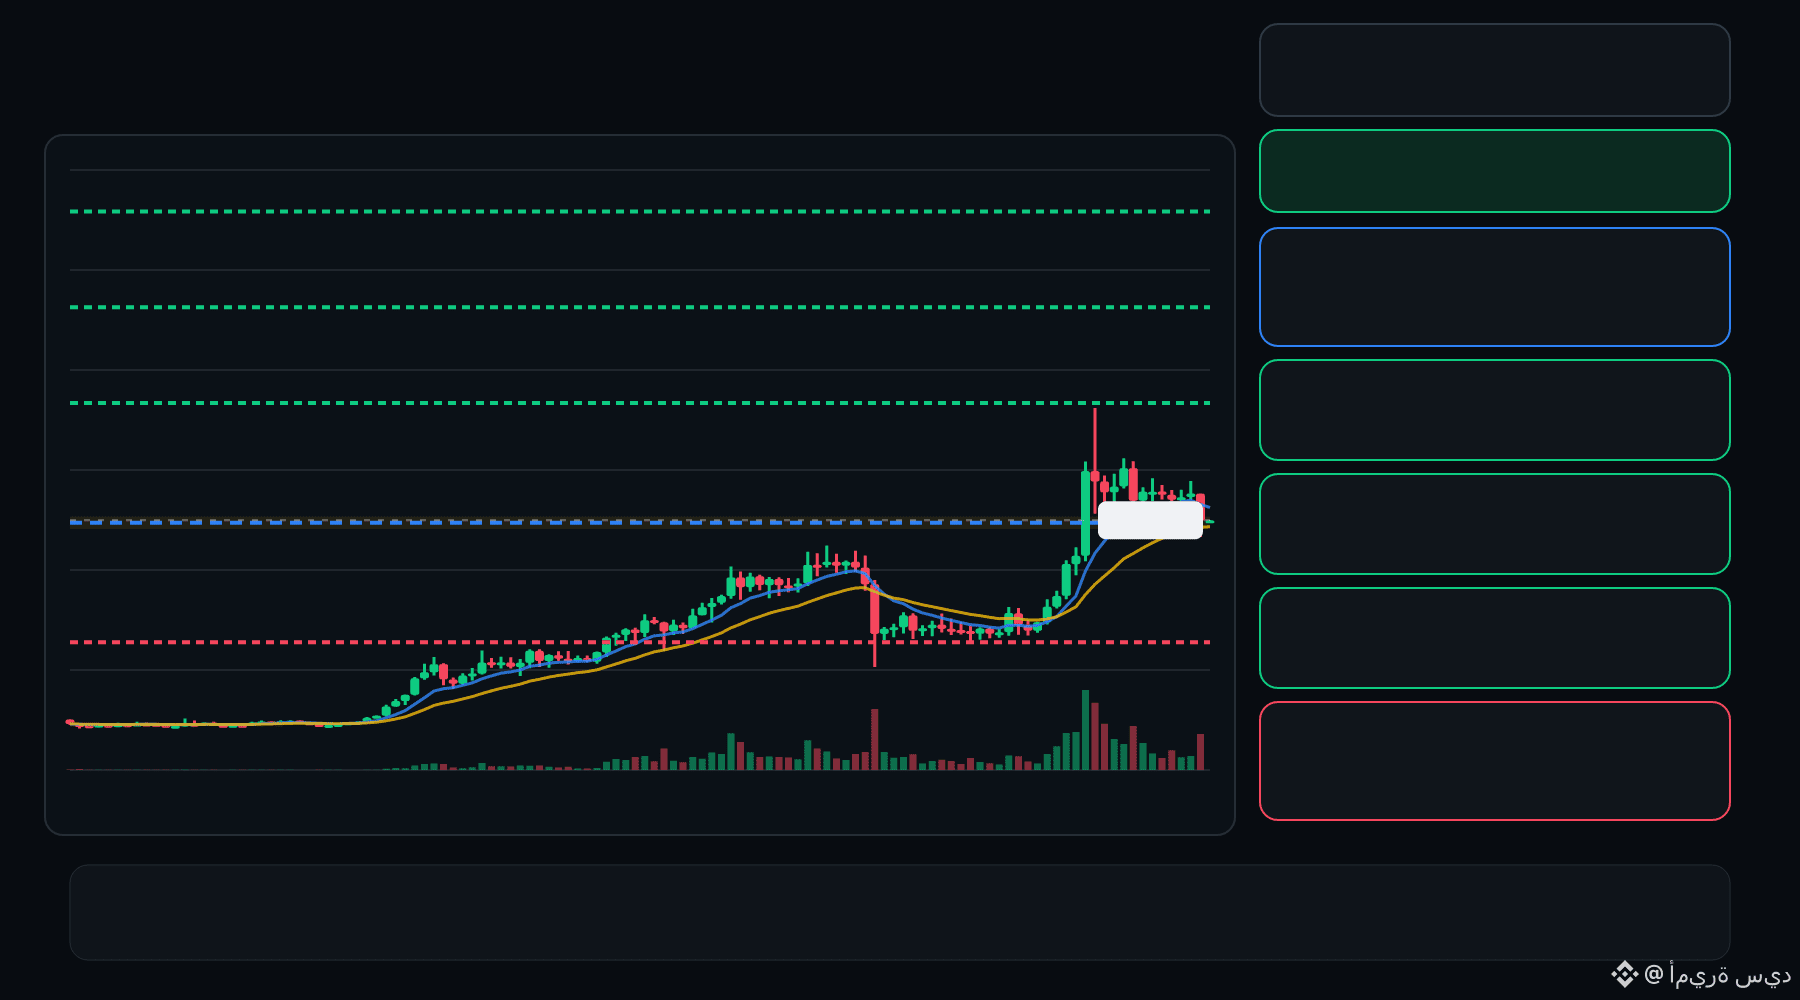
🟢 Los alcistas de ESPORTS están defendiendo el retroceso… ¿se está preparando una continuación? ⁉️
🟩 POSICIÓN LARGA EN ESPORTS
Entrada: 0.01056 – 0.01077
TP1: 0.01278
TP2: 0.01447
TP3: 0.01616
Stop Loss: 0.008551
El gráfico de 15M muestra una estructura alcista, confirmada por el impulso y el volumen. Una nueva prueba controlada de la zona de entrada podría ofrecer una señal de entrada más clara.
Plan: Espera una confirmación o rechazo dentro de la zona de entrada; no persigas el movimiento.
Investiga por tu cuenta | Gestiona el riesgo | Evita el apalancamiento excesivo
2
·
--
Ver traducción
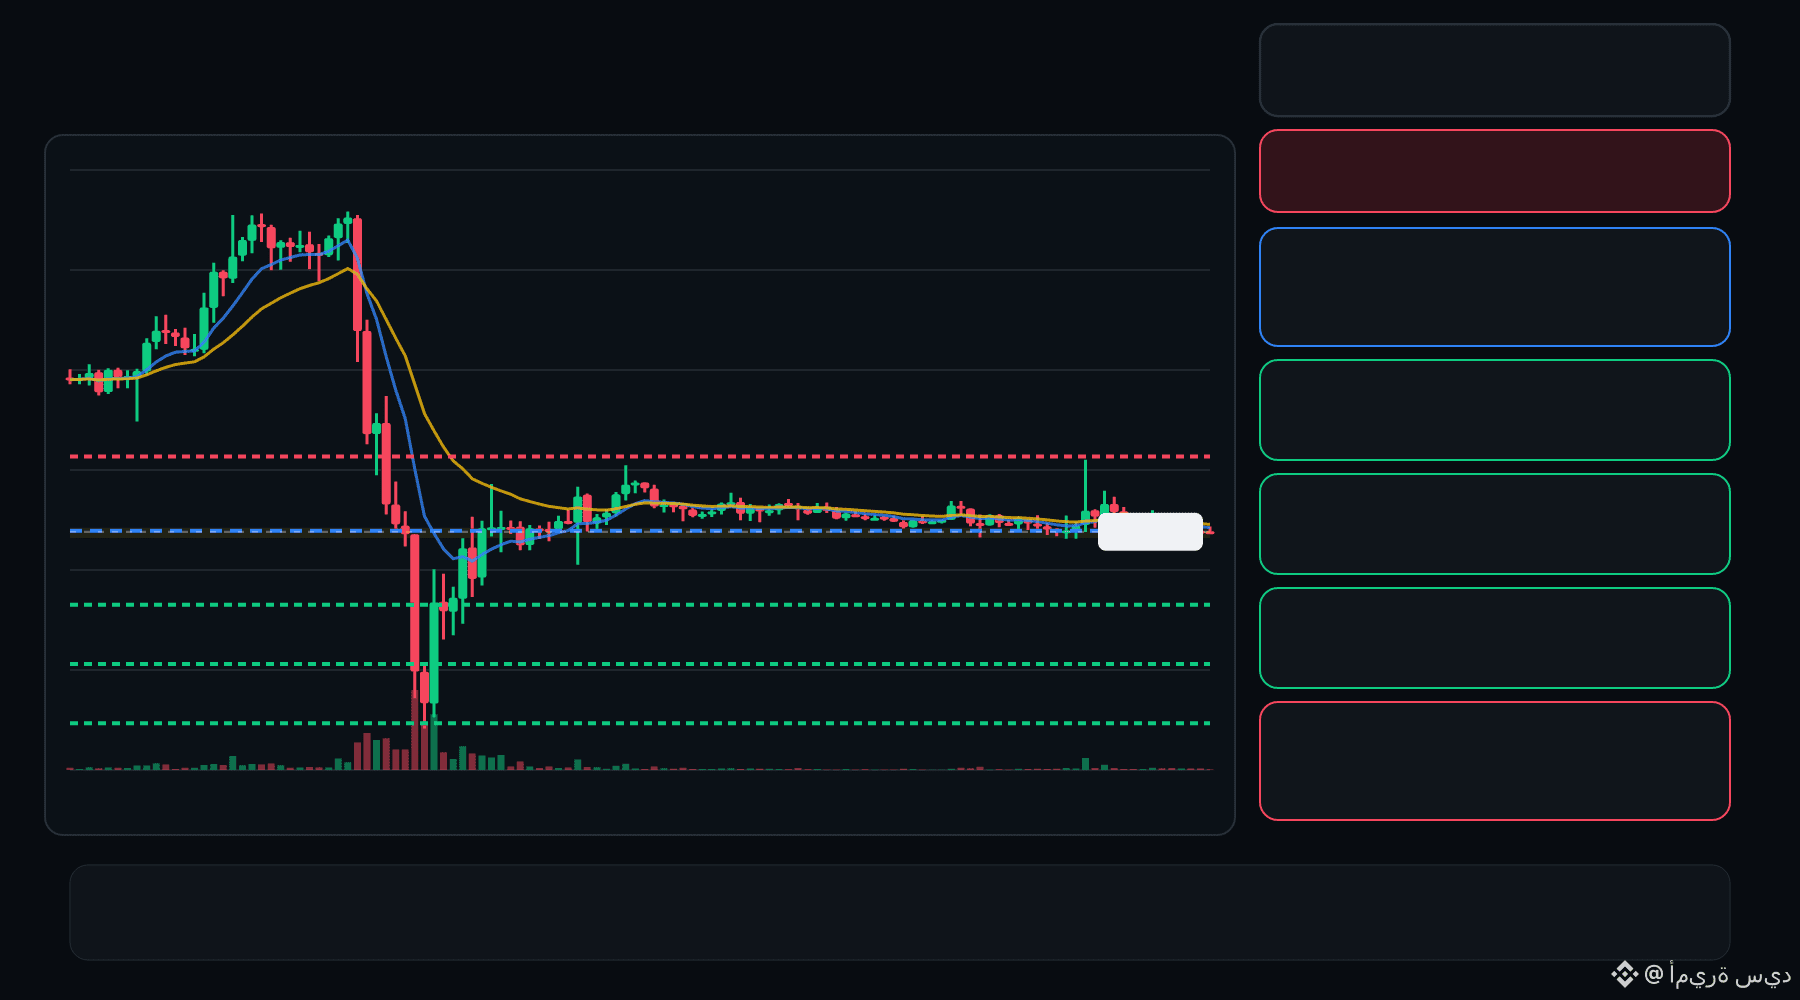
🔴 BULLA bears are pressing the pullback… is the rejection getting deeper ⁉️
🔴 BULLA SHORT
Entry: 0.06787 – 0.06821
TP1: 0.06367
TP2: 0.06016
TP3: 0.05666
Stop Loss: 0.07242
The 15M chart shows a bearish structure with momentum and volume confirmation. A controlled retest of the entry zone may give the setup a cleaner trigger.
Plan: Wait for confirmation/rejection inside the entry zone; don’t chase the move.
DYOR | Manage Risk | Avoid Over-Leverage
3
·
--
Ver traducción
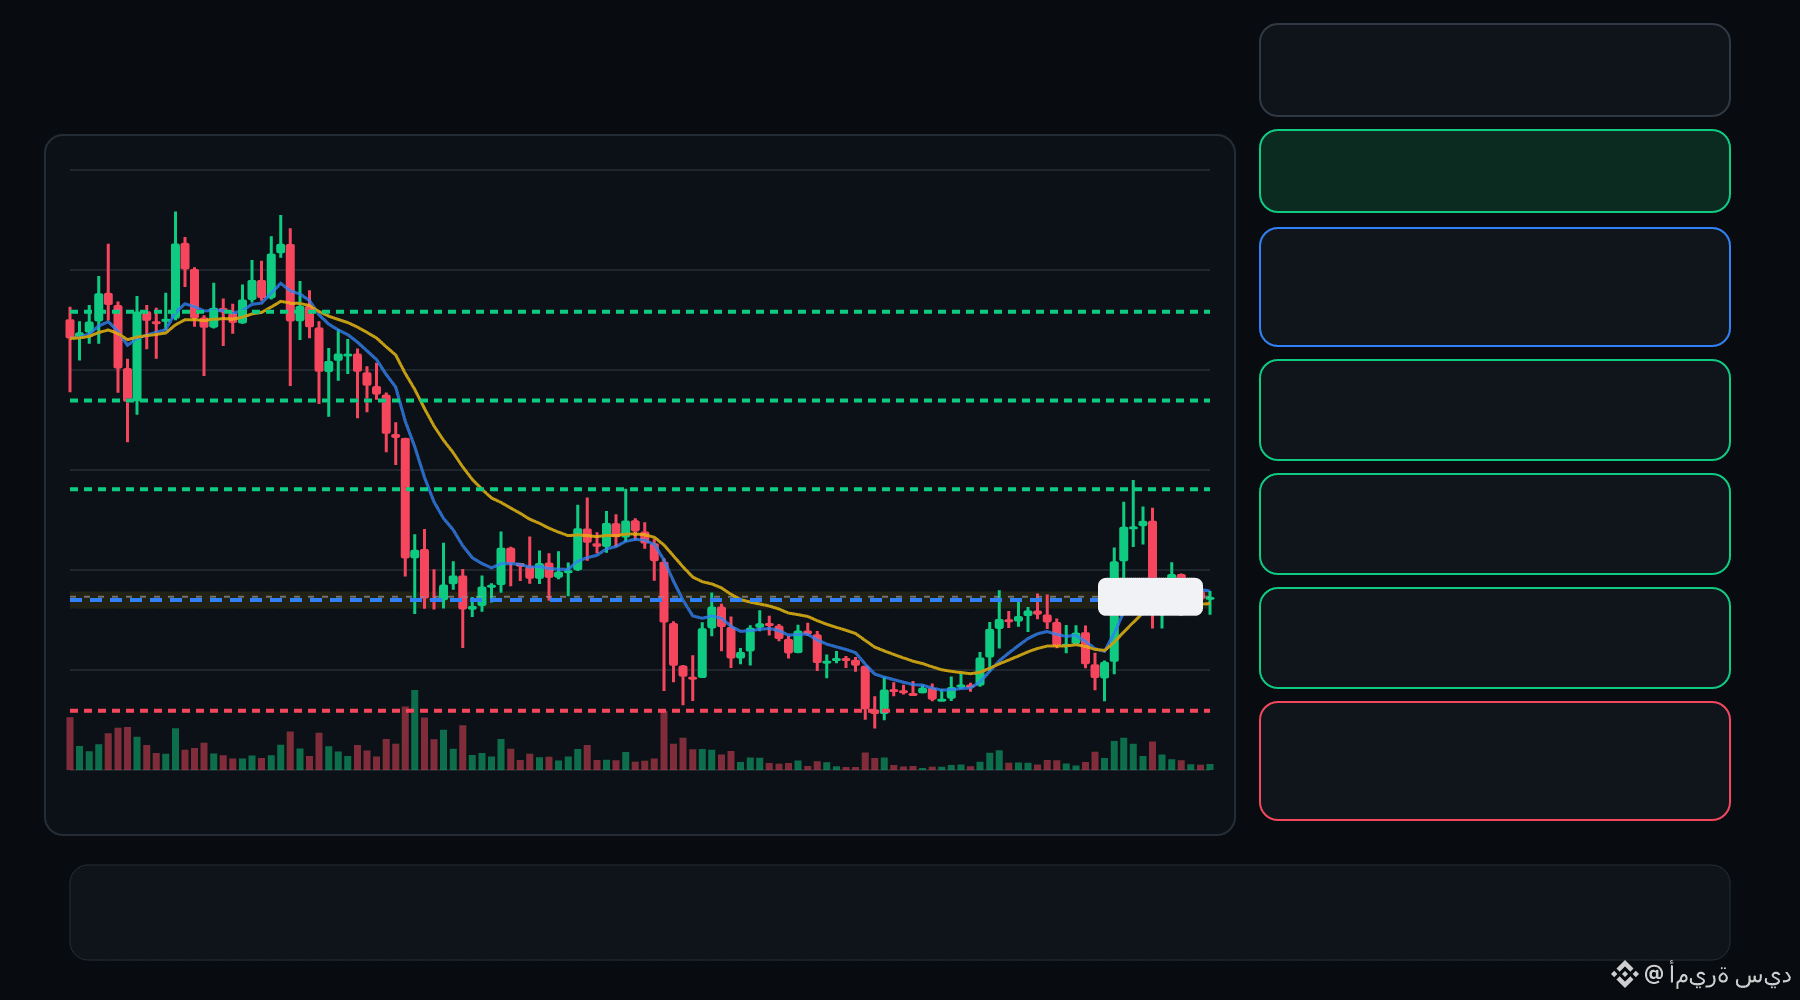
🟢 IDOL bulls are defending the pullback… is continuation setting up ⁉️
🟩 IDOL LONG
Entry: 0.01853 – 0.01884
TP1: 0.02073
TP2: 0.02237
TP3: 0.02401
Stop Loss: 0.01664
The 15M chart shows a bullish structure with momentum and volume confirmation. A controlled retest of the entry zone may give the setup a cleaner trigger.
Plan: Wait for confirmation/rejection inside the entry zone; don’t chase the move.
DYOR | Manage Risk | Avoid Over-Leverage
5
·
--
Ver traducción
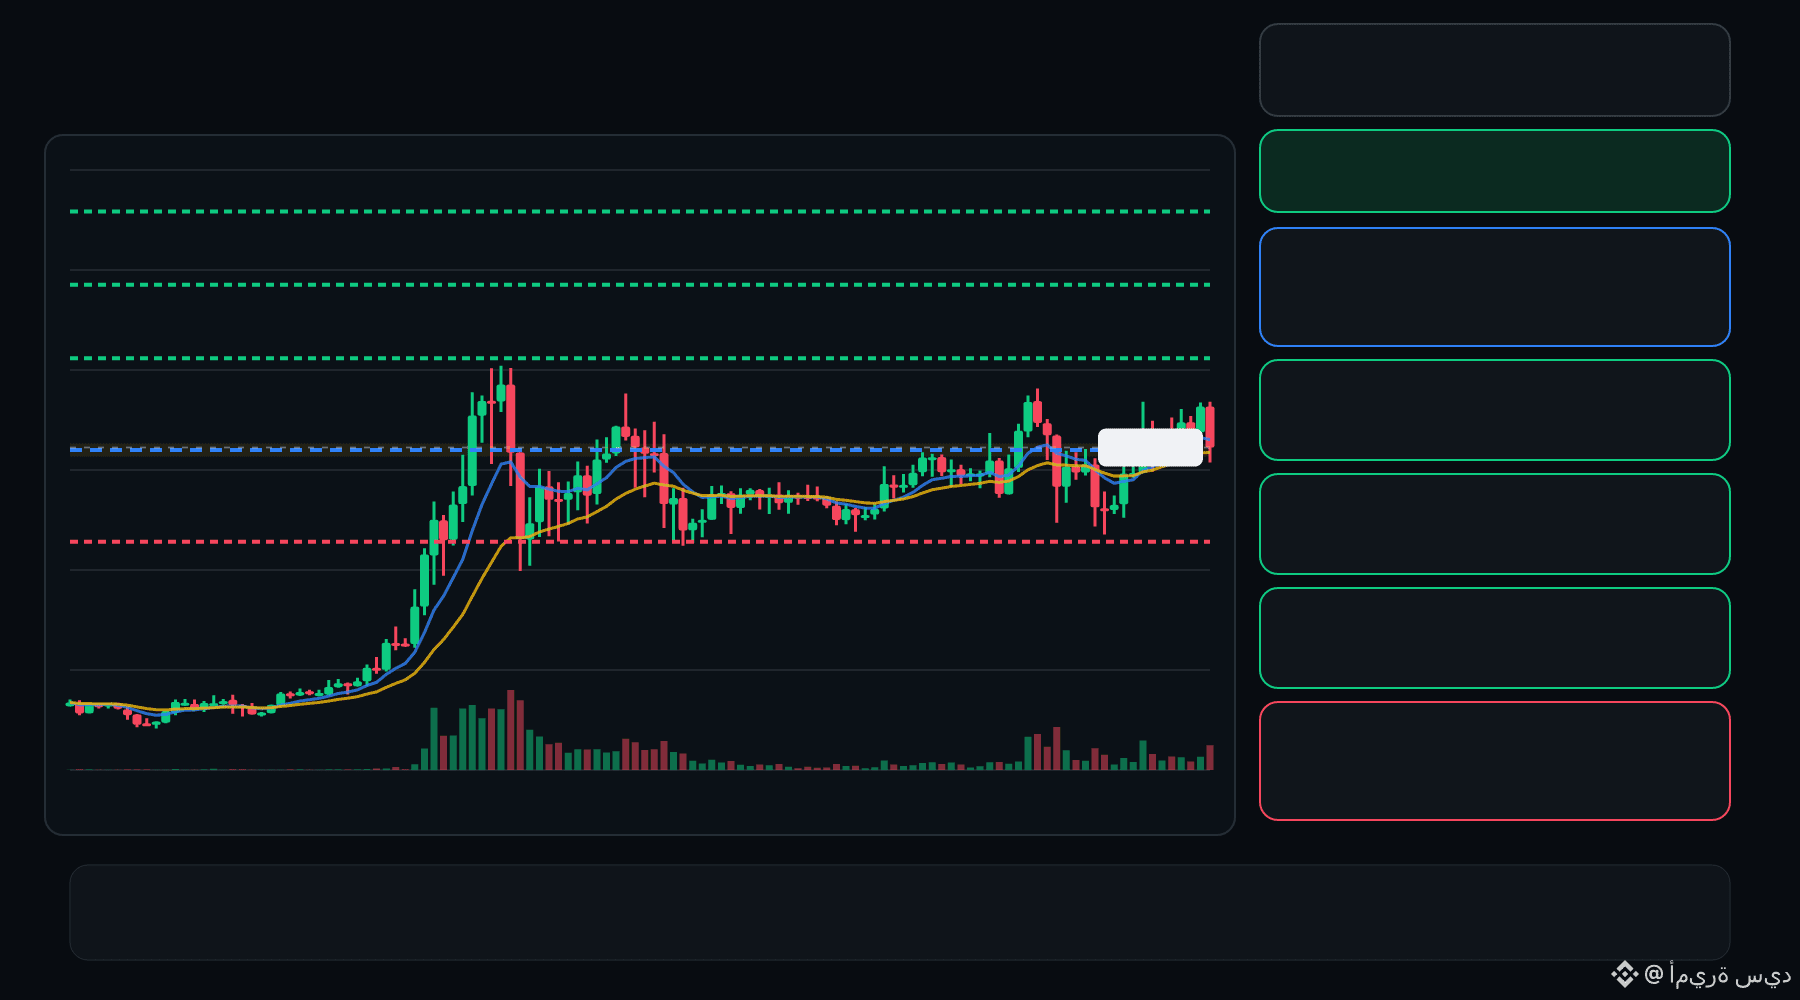
🟢 AIOT bulls are defending the pullback… is continuation setting up ⁉️
🟩 AIOT LONG
Entry: 0.08850 – 0.08933
TP1: 0.09479
TP2: 0.09948
TP3: 0.1042
Stop Loss: 0.08304
The 15M chart shows a bullish structure with momentum and volume confirmation. A controlled retest of the entry zone may give the setup a cleaner trigger.
Plan: Wait for confirmation/rejection inside the entry zone; don’t chase the move.
DYOR | Manage Risk | Avoid Over-Leverage
5
·
--
Ver traducción
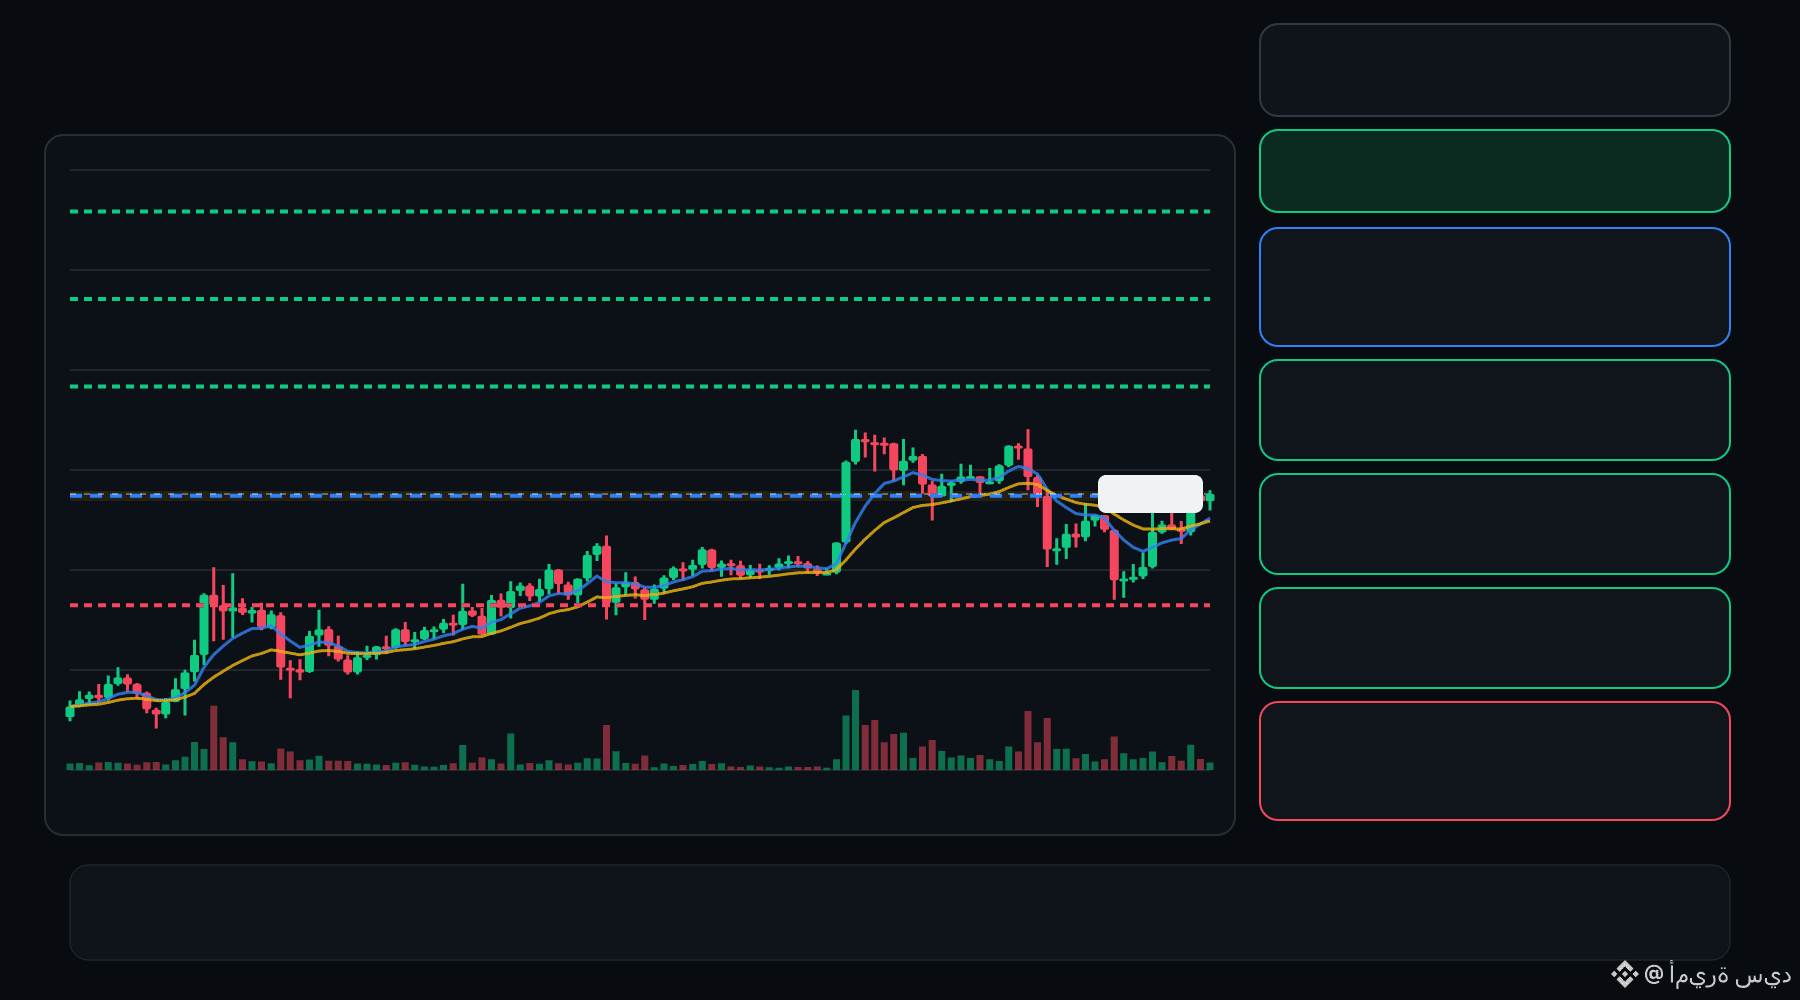
🟢 EVAA bulls are defending the pullback… is continuation setting up ⁉️
🟩 EVAA LONG
Entry: 1.368 – 1.379
TP1: 1.499
TP2: 1.600
TP3: 1.701
Stop Loss: 1.248
The 15M chart shows a bullish structure with momentum and volume confirmation. A controlled retest of the entry zone may give the setup a cleaner trigger.
Plan: Wait for confirmation/rejection inside the entry zone; don’t chase the move.
DYOR | Manage Risk | Avoid Over-Leverage
3
·
--
Ver traducción
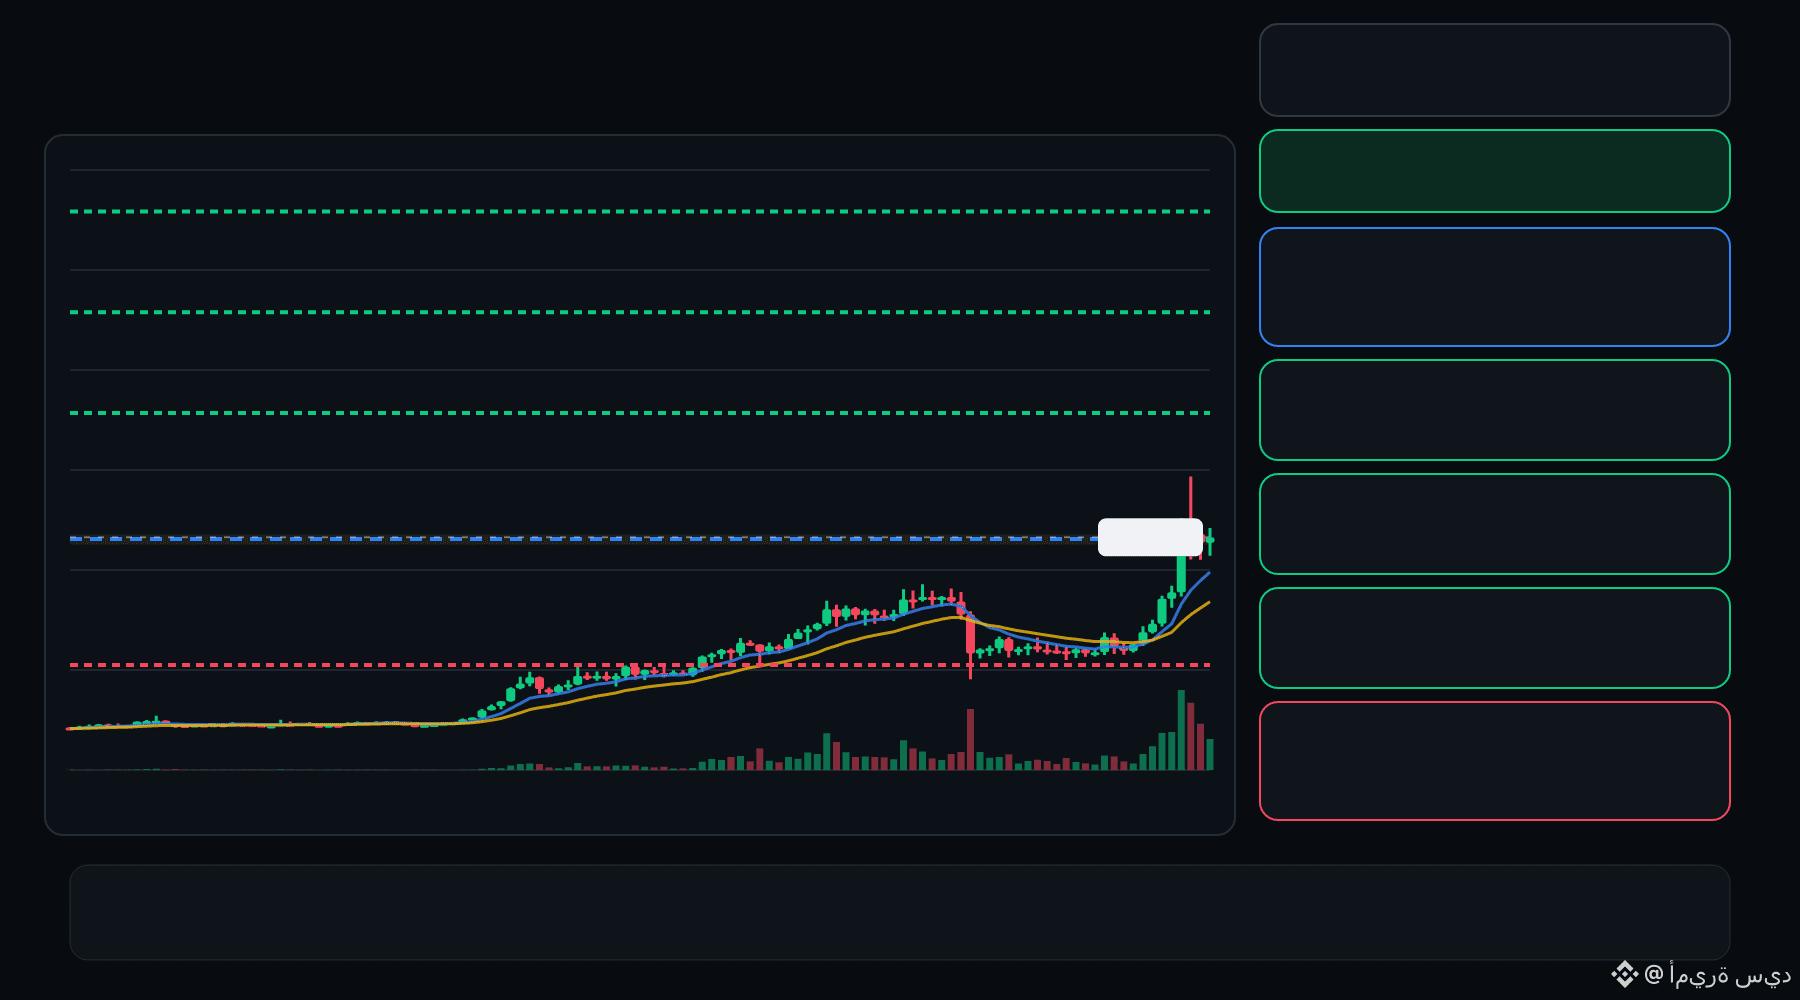
🟢 ESPORTS bulls are defending the pullback… is continuation setting up ⁉️
🟩 ESPORTS LONG
Entry: 0.01118 – 0.01138
TP1: 0.01412
TP2: 0.01639
TP3: 0.01866
Stop Loss: 0.008440
The 15M chart shows a bullish structure with momentum and volume confirmation. A controlled retest of the entry zone may give the setup a cleaner trigger.
Plan: Wait for confirmation/rejection inside the entry zone; don’t chase the move.
DYOR | Manage Risk | Avoid Over-Leverage
·
--
Ver traducción
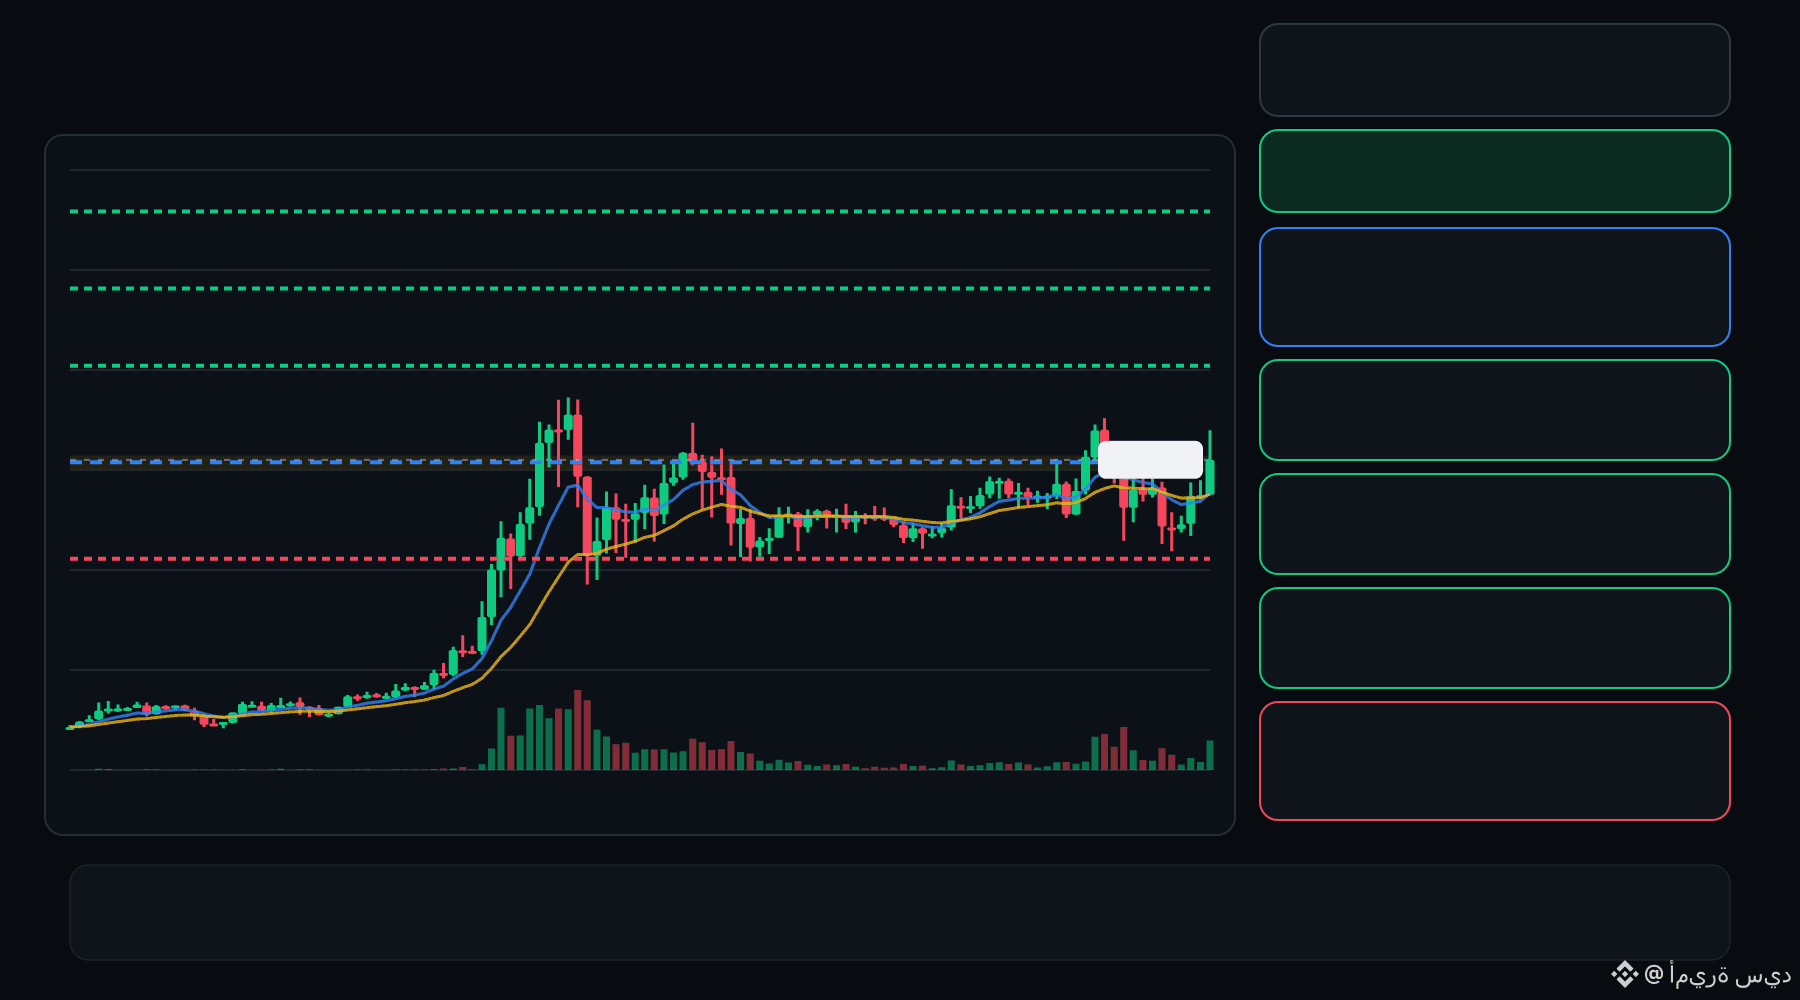
🟢 AIOT bulls are defending the pullback… is continuation setting up ⁉️
🟩 AIOT LONG
Entry: 0.08928 – 0.09022
TP1: 0.09653
TP2: 0.1019
TP3: 0.1074
Stop Loss: 0.08298
The 15M chart shows a bullish structure with momentum and volume confirmation. A controlled retest of the entry zone may give the setup a cleaner trigger.
Plan: Wait for confirmation/rejection inside the entry zone; don’t chase the move.
DYOR | Manage Risk | Avoid Over-Leverage
3
·
--
Ver traducción
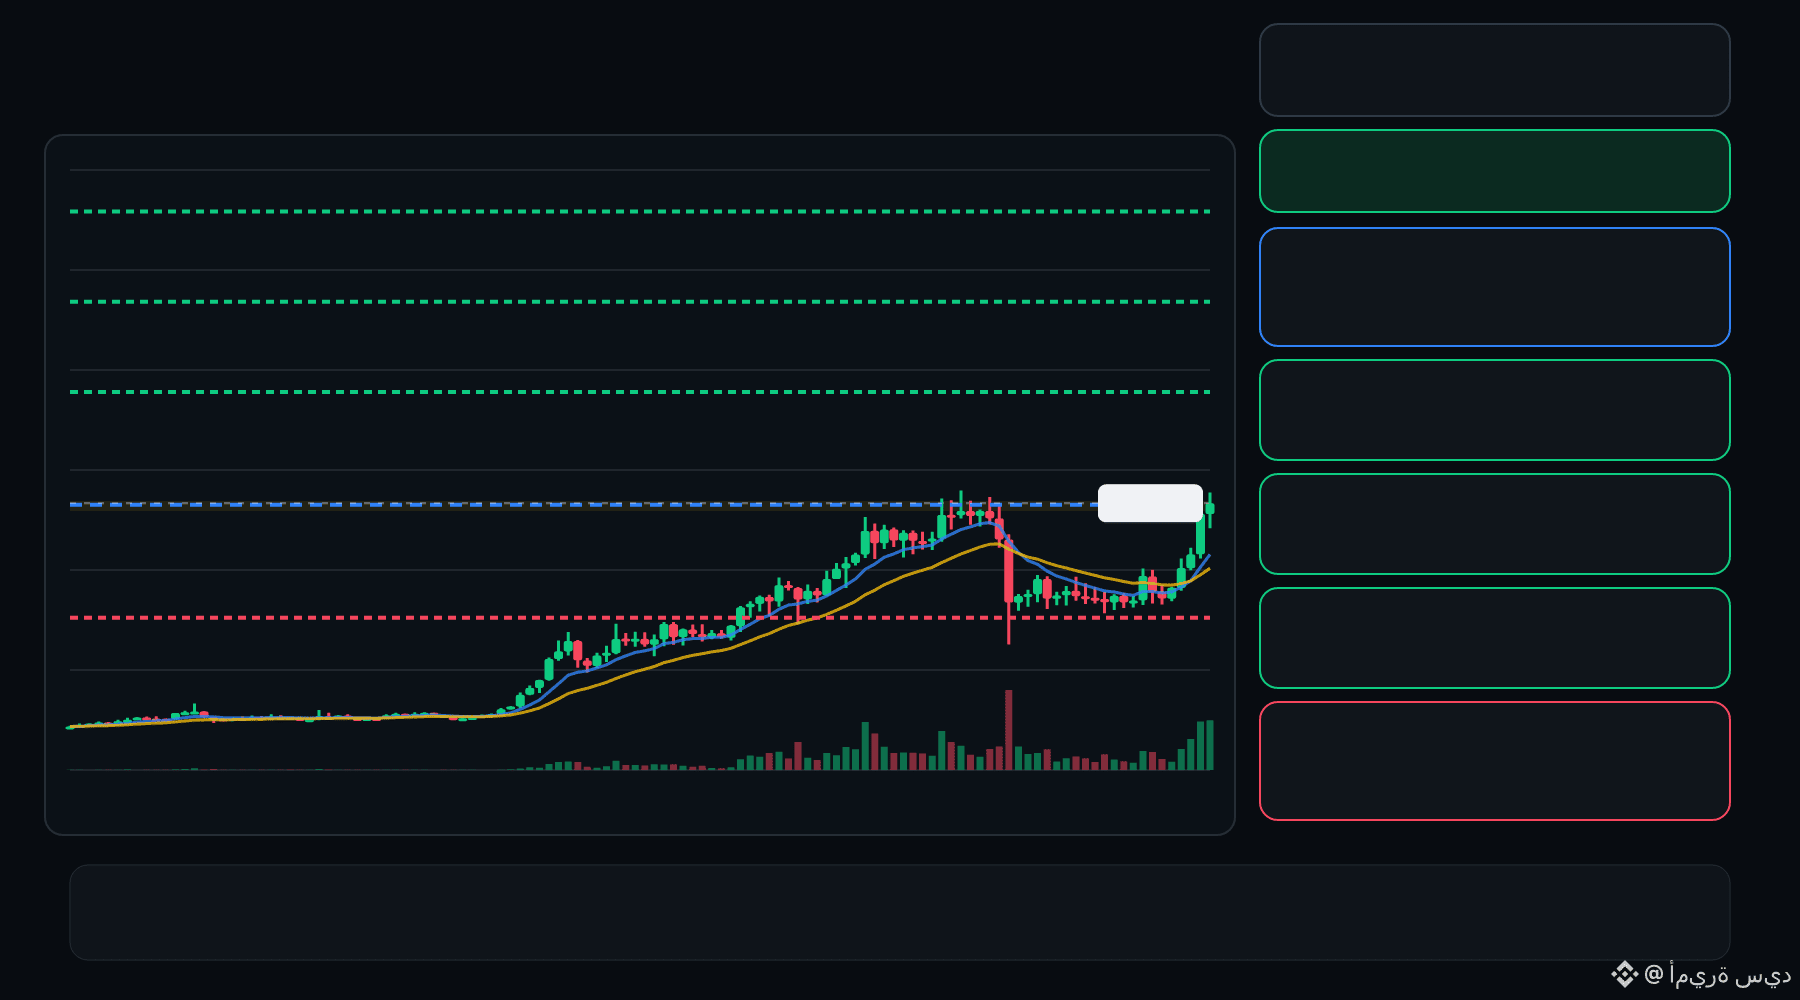
🟢 ESPORTS bulls are defending the pullback… is continuation setting up ⁉️
🟩 ESPORTS LONG
Entry: 0.01000 – 0.01011
TP1: 0.01163
TP2: 0.01288
TP3: 0.01414
Stop Loss: 0.008490
The 15M chart shows a bullish structure with momentum and volume confirmation. A controlled retest of the entry zone may give the setup a cleaner trigger.
Plan: Wait for confirmation/rejection inside the entry zone; don’t chase the move.
DYOR | Manage Risk | Avoid Over-Leverage
1
·
--
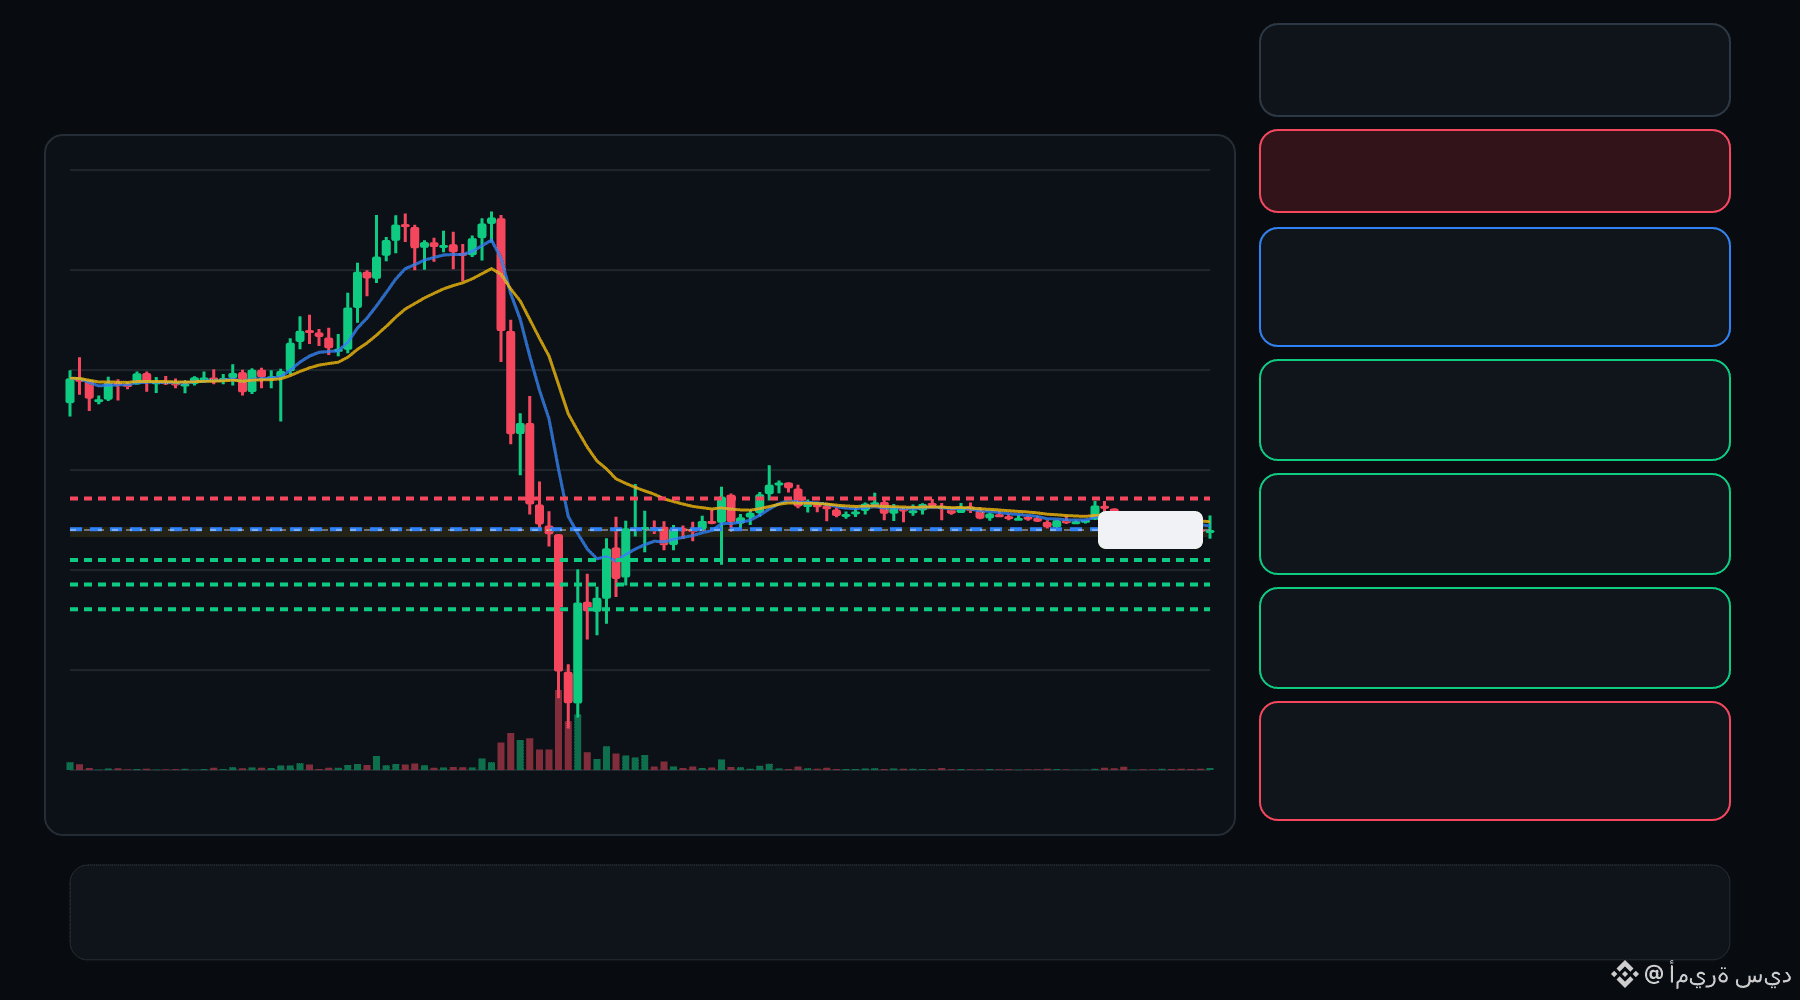
🔴 Los bajistas de BULLA están presionando el retroceso… ¿el rechazo se está intensificando? ⁉️
🔴 VENTA EN CORTO DE BULLA
Entrada: 0.06800 – 0.06826
TP1: 0.06631
TP2: 0.06486
TP3: 0.06340
Stop loss: 0.06995
El gráfico de 15 min muestra una estructura bajista, confirmada por el impulso y el volumen. Un retesteo controlado de la zona de entrada podría ofrecer una señal más clara para activar la operación.
Plan: Espera una confirmación o un rechazo dentro de la zona de entrada; no persigas el movimiento.
Investiga por tu cuenta | Gestiona el riesgo | Evita un apalancamiento excesivo
8
·
--
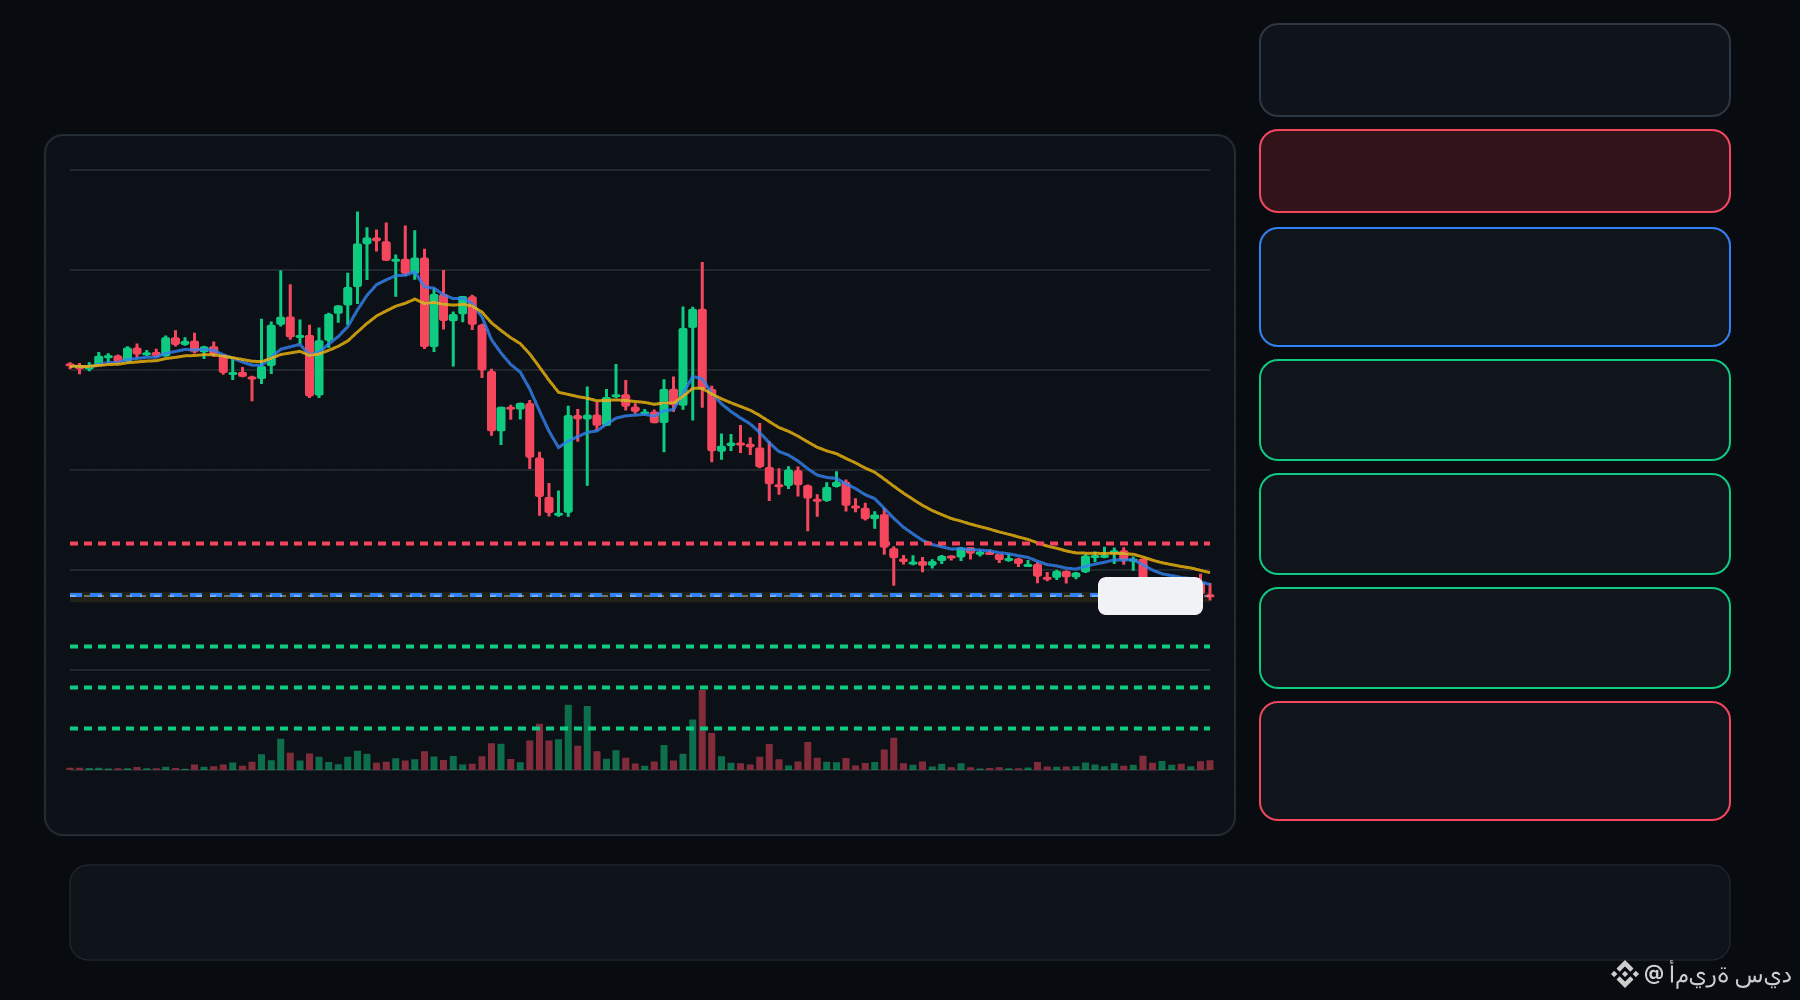
🔴 Los bajistas de JCT están presionando el retroceso… ¿se está profundizando el rechazo? ⁉️
🔴 VENTA EN CORTO DE JCT
Entrada: 0.004662 – 0.004685
TP1: 0.004459
TP2: 0.004287
TP3: 0.004115
Stop loss: 0.004888
El gráfico de 15M muestra una estructura bajista, confirmada por el impulso y el volumen. Un retesteo controlado de la zona de entrada podría ofrecer una señal de entrada más clara.
Plan: Espera la confirmación/el rechazo dentro de la zona de entrada; no persigas el movimiento.
Investiga por tu cuenta | Gestiona el riesgo | Evita un apalancamiento excesivo
5
·
--
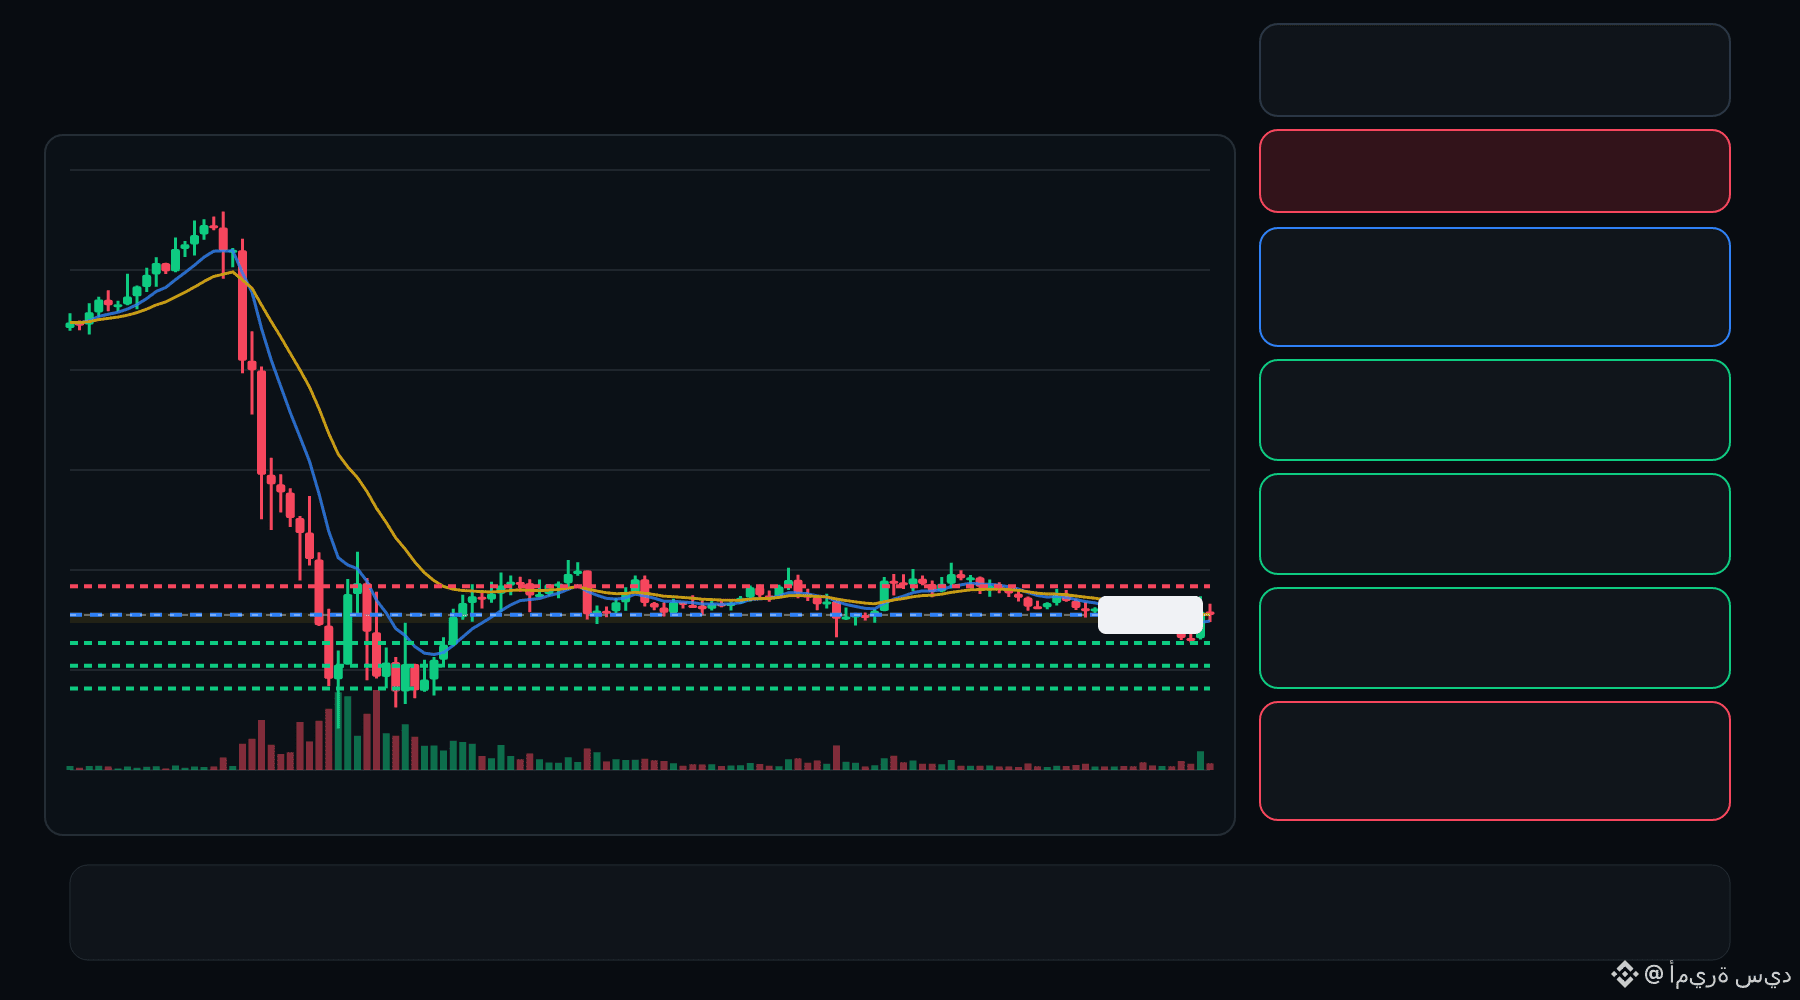
🔴 Los bajistas de Q están presionando el retroceso… ¿se está profundizando el rechazo? ⁉️
🔴 Q EN CORTO
Entrada: 0.03137 – 0.03152
TP1: 0.03014
TP2: 0.02909
TP3: 0.02804
Stop Loss: 0.03275
El gráfico de 15M muestra una estructura bajista, confirmada por el impulso y el volumen. Una nueva prueba controlada de la zona de entrada podría ofrecer una señal de activación más clara.
Plan: Espera una confirmación/rechazo dentro de la zona de entrada; no persigas el movimiento.
Investiga por tu cuenta | Gestiona el riesgo | Evita el apalancamiento excesivo
35
·
--
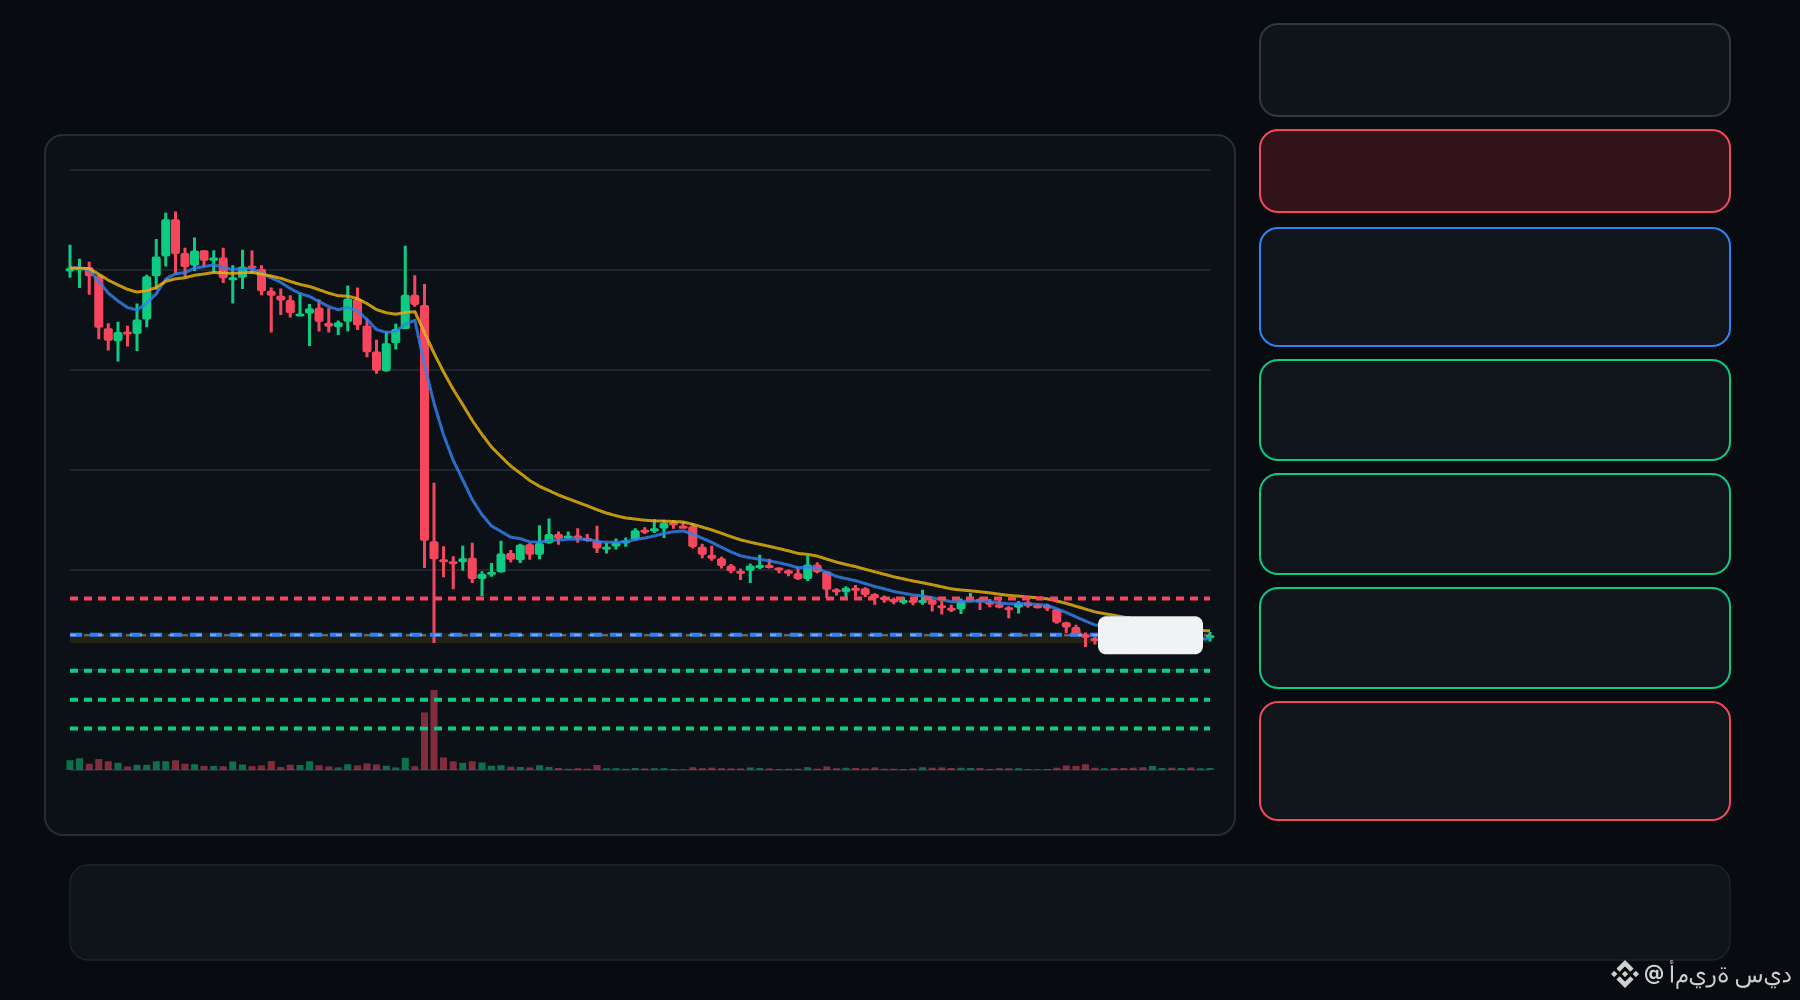
🔴 Los bajistas de SOPH están presionando el retroceso… ¿se está intensificando el rechazo? ⁉️
🔴 VENTA EN CORTO DE SOPH
Entrada: 0.001437 – 0.001444
TP1: 0.001366
TP2: 0.001306
TP3: 0.001246
Stop Loss: 0.001515
El gráfico de 15M muestra una estructura bajista, confirmada por el impulso y el volumen. Una nueva prueba controlada de la zona de entrada podría ofrecer una señal de entrada más clara.
Plan: Espera confirmación/rechazo dentro de la zona de entrada; no persigas el movimiento.
Investiga por tu cuenta | Gestiona el riesgo | Evita un apalancamiento excesivo
27
·
--
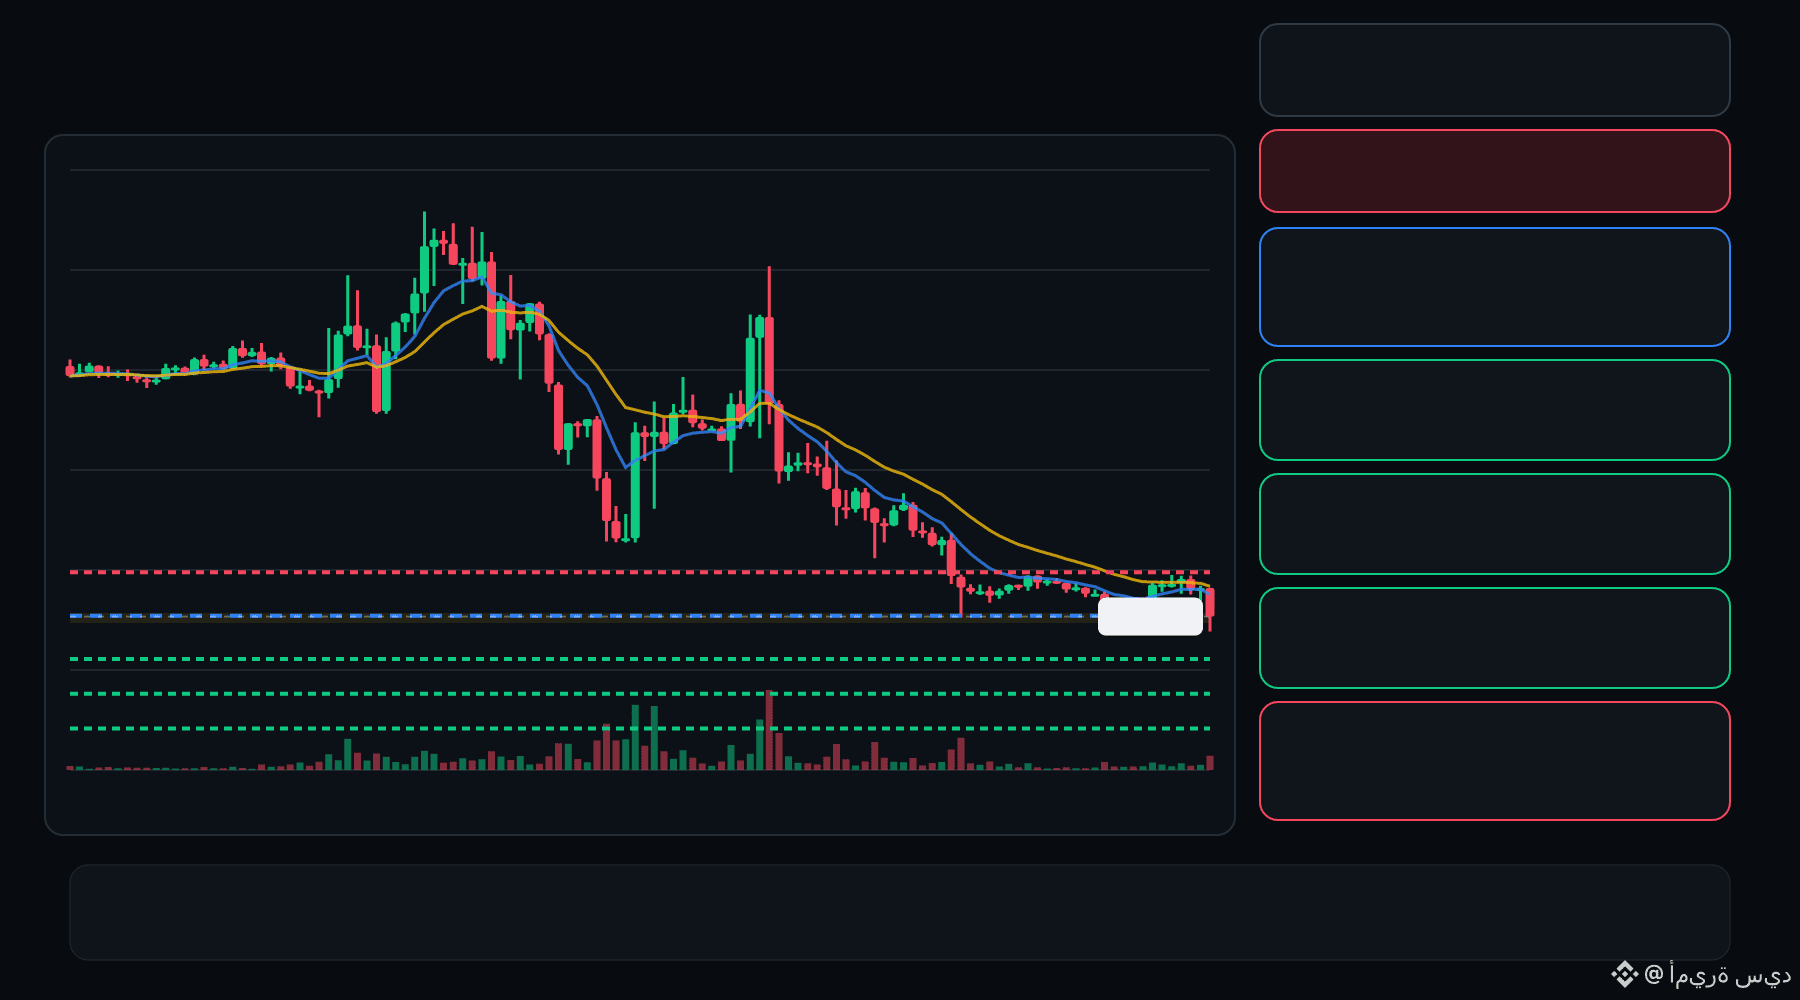
🔴 Los bajistas de JCT están presionando el retroceso… ¿se está intensificando el rechazo? ⁉️
🔴 JCT EN CORTO
Entrada: 0.004709 – 0.004729
Objetivo 1: 0.004551
Objetivo 2: 0.004417
Objetivo 3: 0.004283
Stop loss: 0.004886
El gráfico de 15M muestra una estructura bajista, confirmada por el impulso y el volumen. Un nuevo test controlado de la zona de entrada podría ofrecer una señal más clara para operar.
Plan: Espera una confirmación/rechazo dentro de la zona de entrada; no persigas el movimiento.
Haz tu propia investigación | Gestiona el riesgo | Evita un apalancamiento excesivo
39
·
--
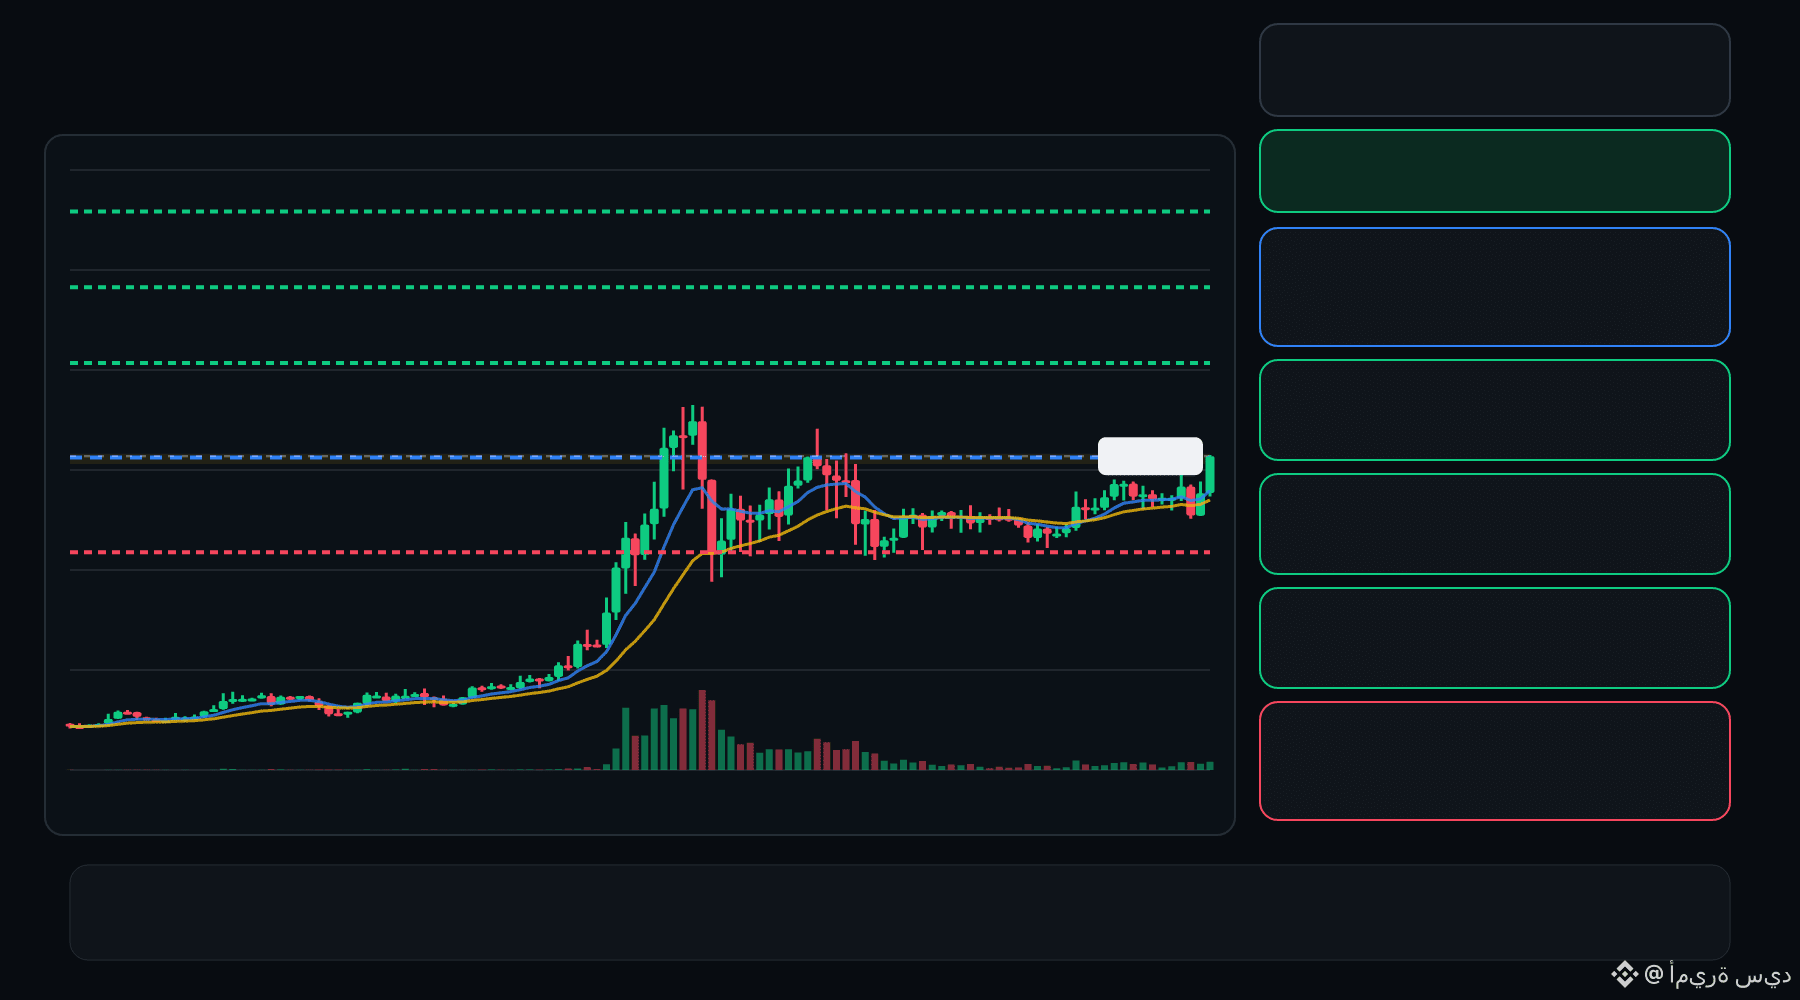
🟢 Los alcistas de AIOT están defendiendo el retroceso… ¿se está preparando una continuación? ⁉️
🟩 AIOT EN LARGO
Entrada: 0.09011 – 0.09068
TP1: 0.09743
TP2: 0.1030
TP3: 0.1087
Stop Loss: 0.08336
El gráfico de 15M muestra una estructura alcista con confirmación del impulso y del volumen. Una nueva prueba controlada de la zona de entrada podría ofrecer una señal más clara para activar la operación.
Plan: Espera una confirmación o un rechazo dentro de la zona de entrada; no persigas el movimiento.
Investiga por tu cuenta | Gestiona el riesgo | Evita el apalancamiento excesivo
65
·
--
Ver traducción
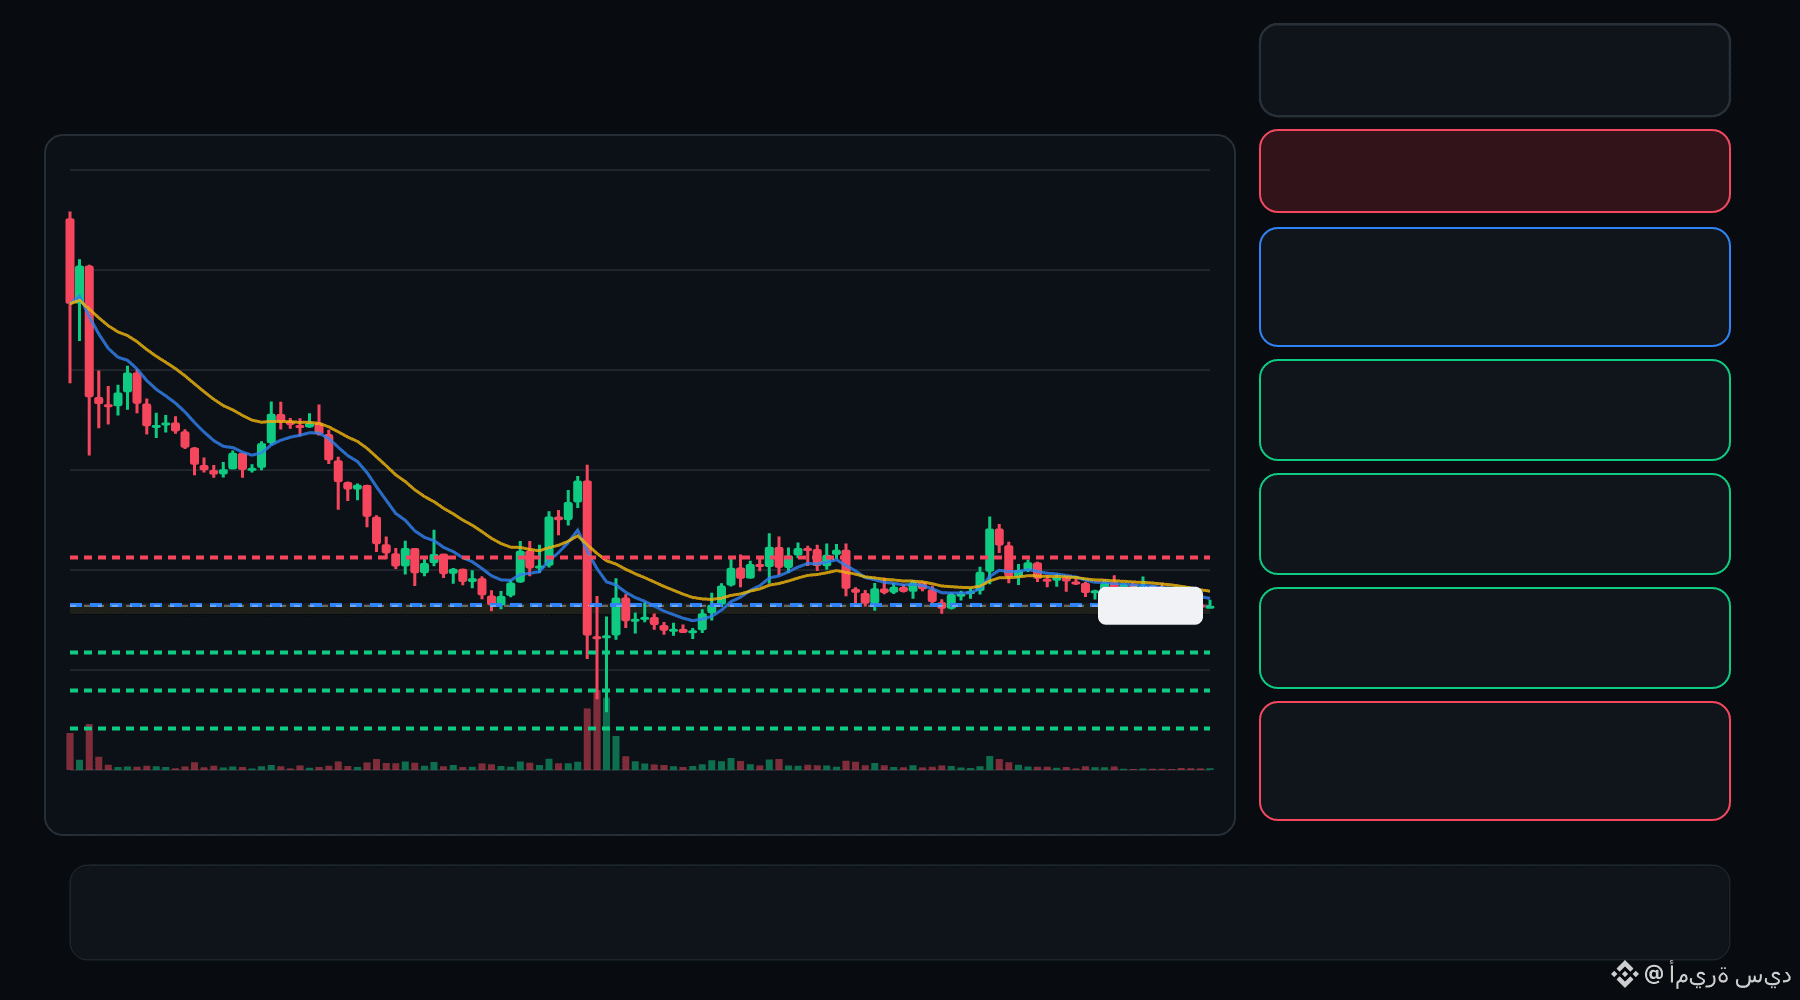
🔴 AKE bears are pressing the pullback… is the rejection getting deeper ⁉️
🔴 AKE SHORT
Entry: 0.01089 – 0.01095
TP1: 0.01013
TP2: 0.009502
TP3: 0.008872
Stop Loss: 0.01171
The 15M chart shows a bearish structure with momentum and volume confirmation. A controlled retest of the entry zone may give the setup a cleaner trigger.
Plan: Wait for confirmation/rejection inside the entry zone; don’t chase the move.
DYOR | Manage Risk | Avoid Over-Leverage
77
·
--
Ver traducción
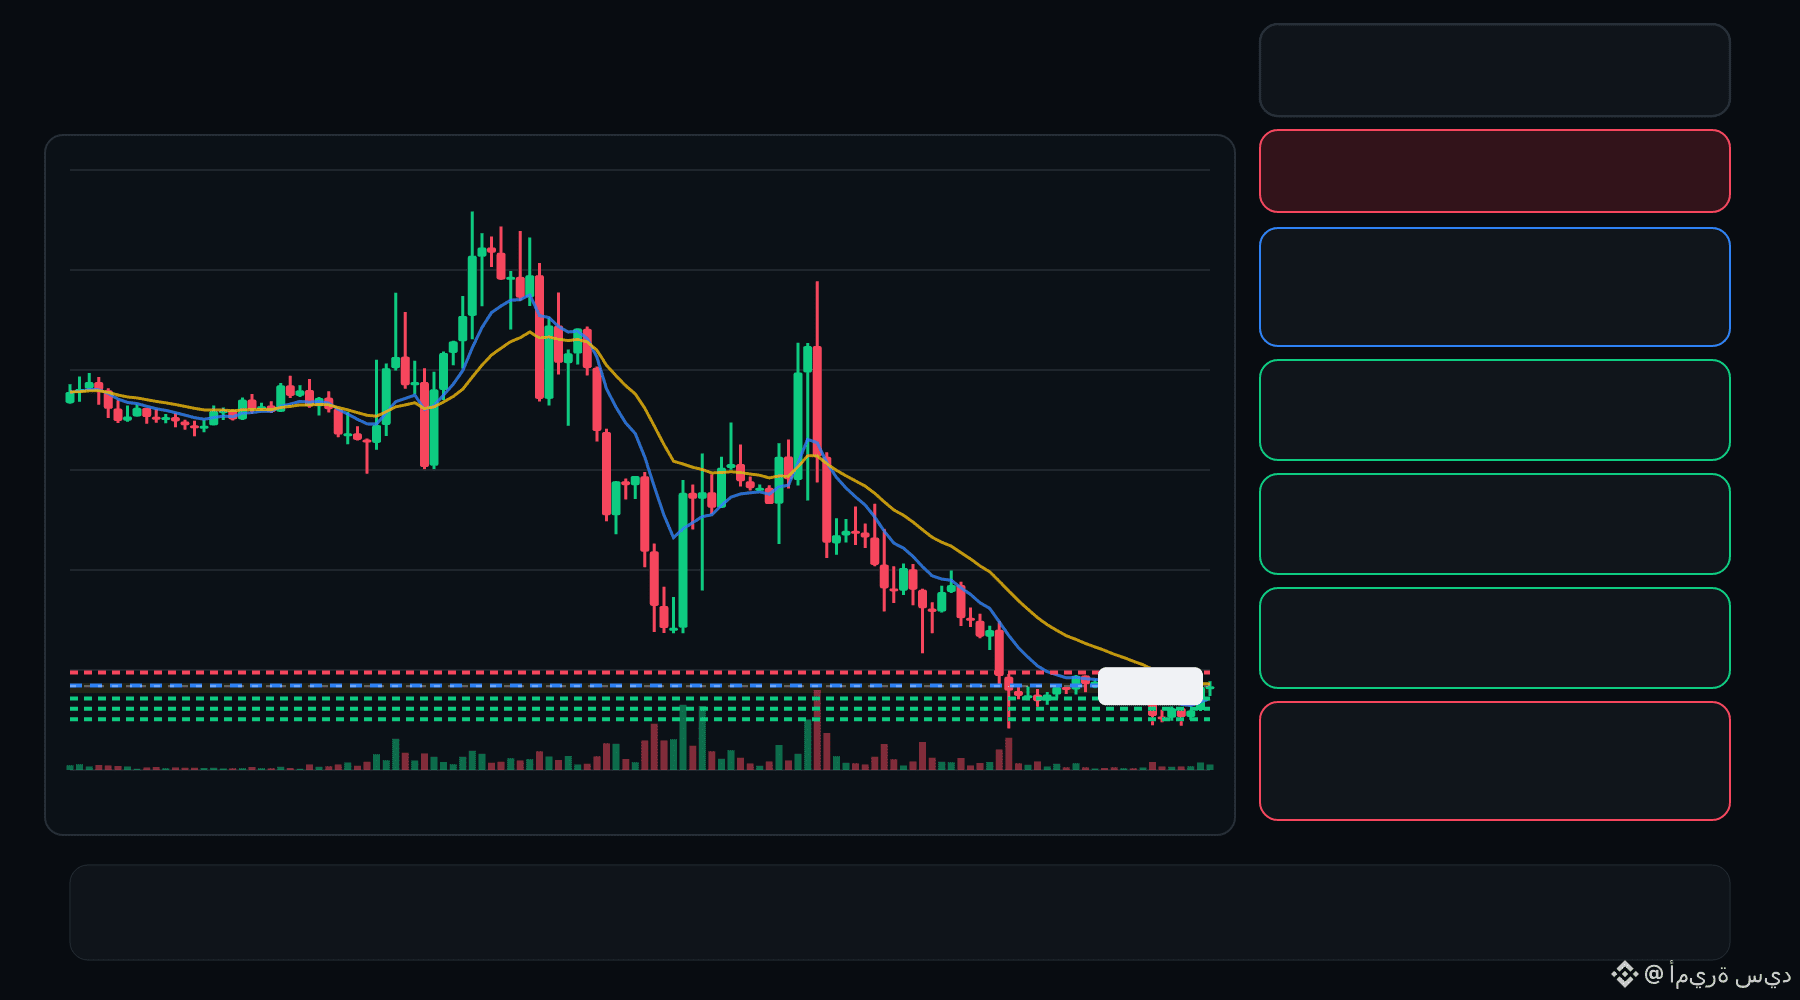
🔴 JCT bears are pressing the pullback… is the rejection getting deeper ⁉️
🔴 JCT SHORT
Entry: 0.004836 – 0.004850
TP1: 0.004803
TP2: 0.004772
TP3: 0.004741
Stop Loss: 0.004882
The 15M chart shows a bearish structure with momentum and volume confirmation. A controlled retest of the entry zone may give the setup a cleaner trigger.
Plan: Wait for confirmation/rejection inside the entry zone; don’t chase the move.
DYOR | Manage Risk | Avoid Over-Leverage
7
·
--
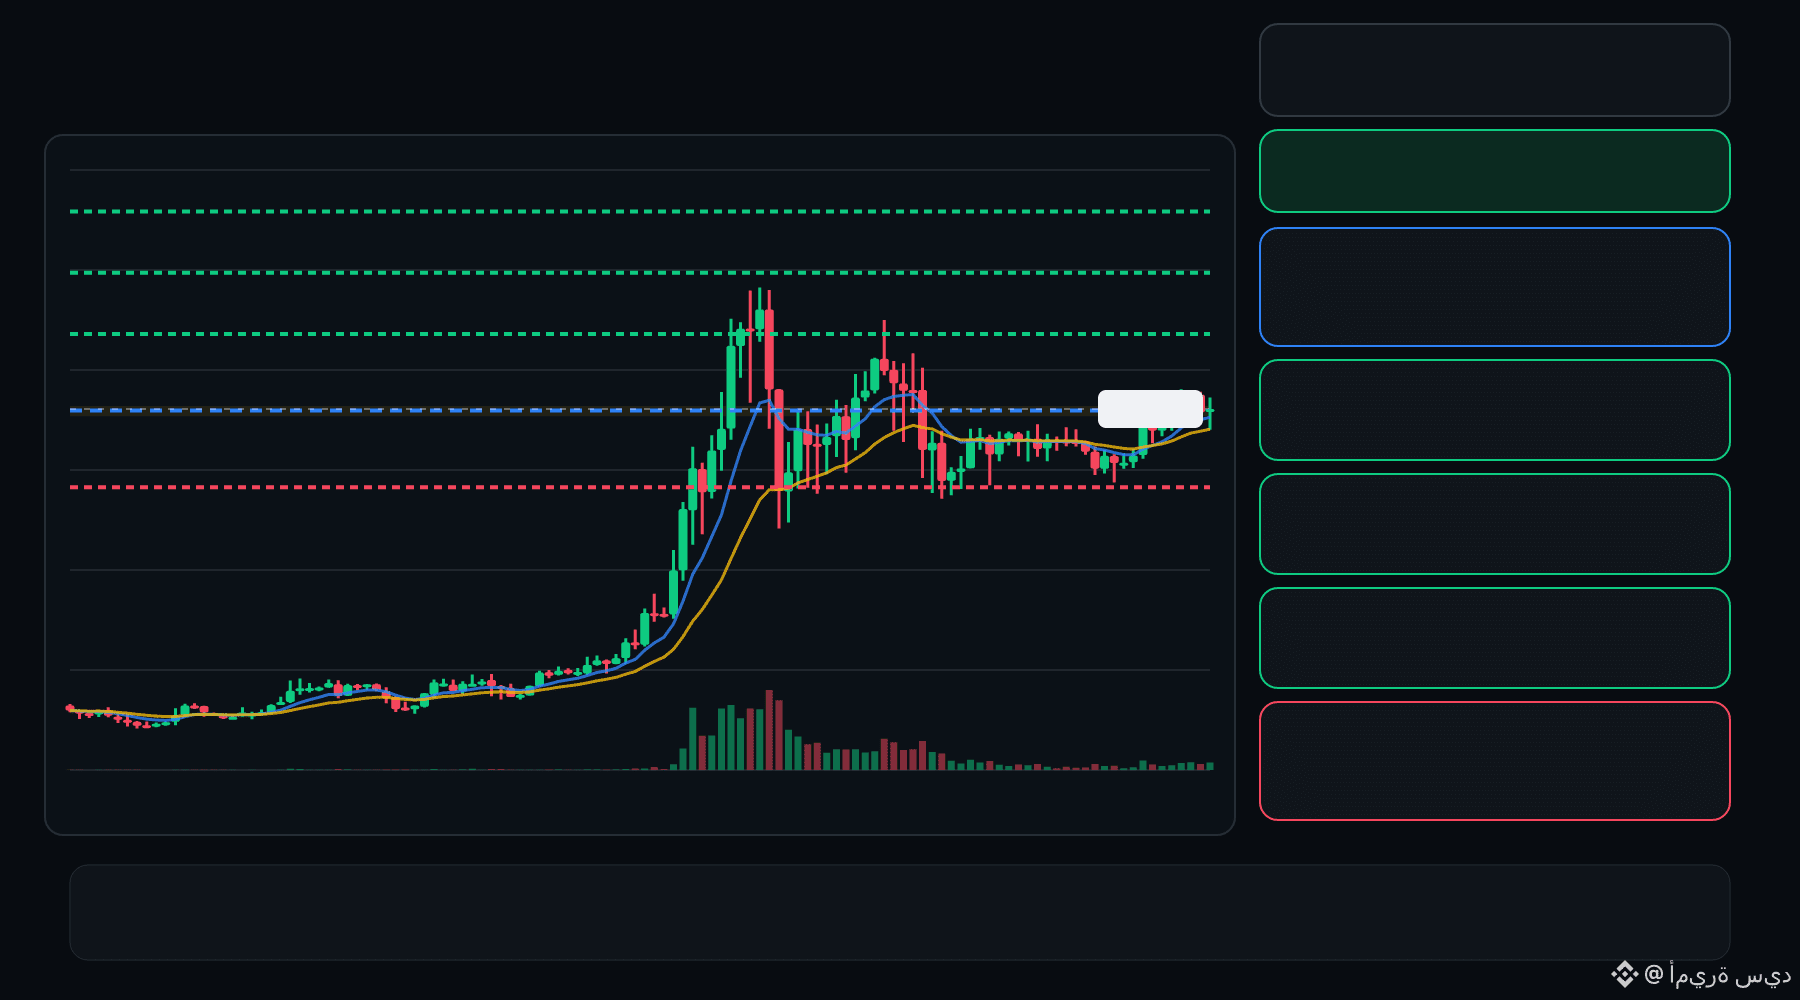
🟢 Los alcistas de AIOT están defendiendo el retroceso… ¿se está preparando una continuación? ⁉️
🟩 AIOT LARGO
Entrada: 0.08736 – 0.08782
TP1: 0.09177
TP2: 0.09510
TP3: 0.09844
Stop loss: 0.08342
El gráfico de 15 min muestra una estructura alcista con confirmación del impulso y el volumen. Un retesteo controlado de la zona de entrada podría ofrecer una señal de entrada más clara.
Plan: Espera confirmación/rechazo dentro de la zona de entrada; no persigas el movimiento.
Investiga por tu cuenta | Gestiona el riesgo | Evita el apalancamiento excesivo
1
·
--
Ver traducción
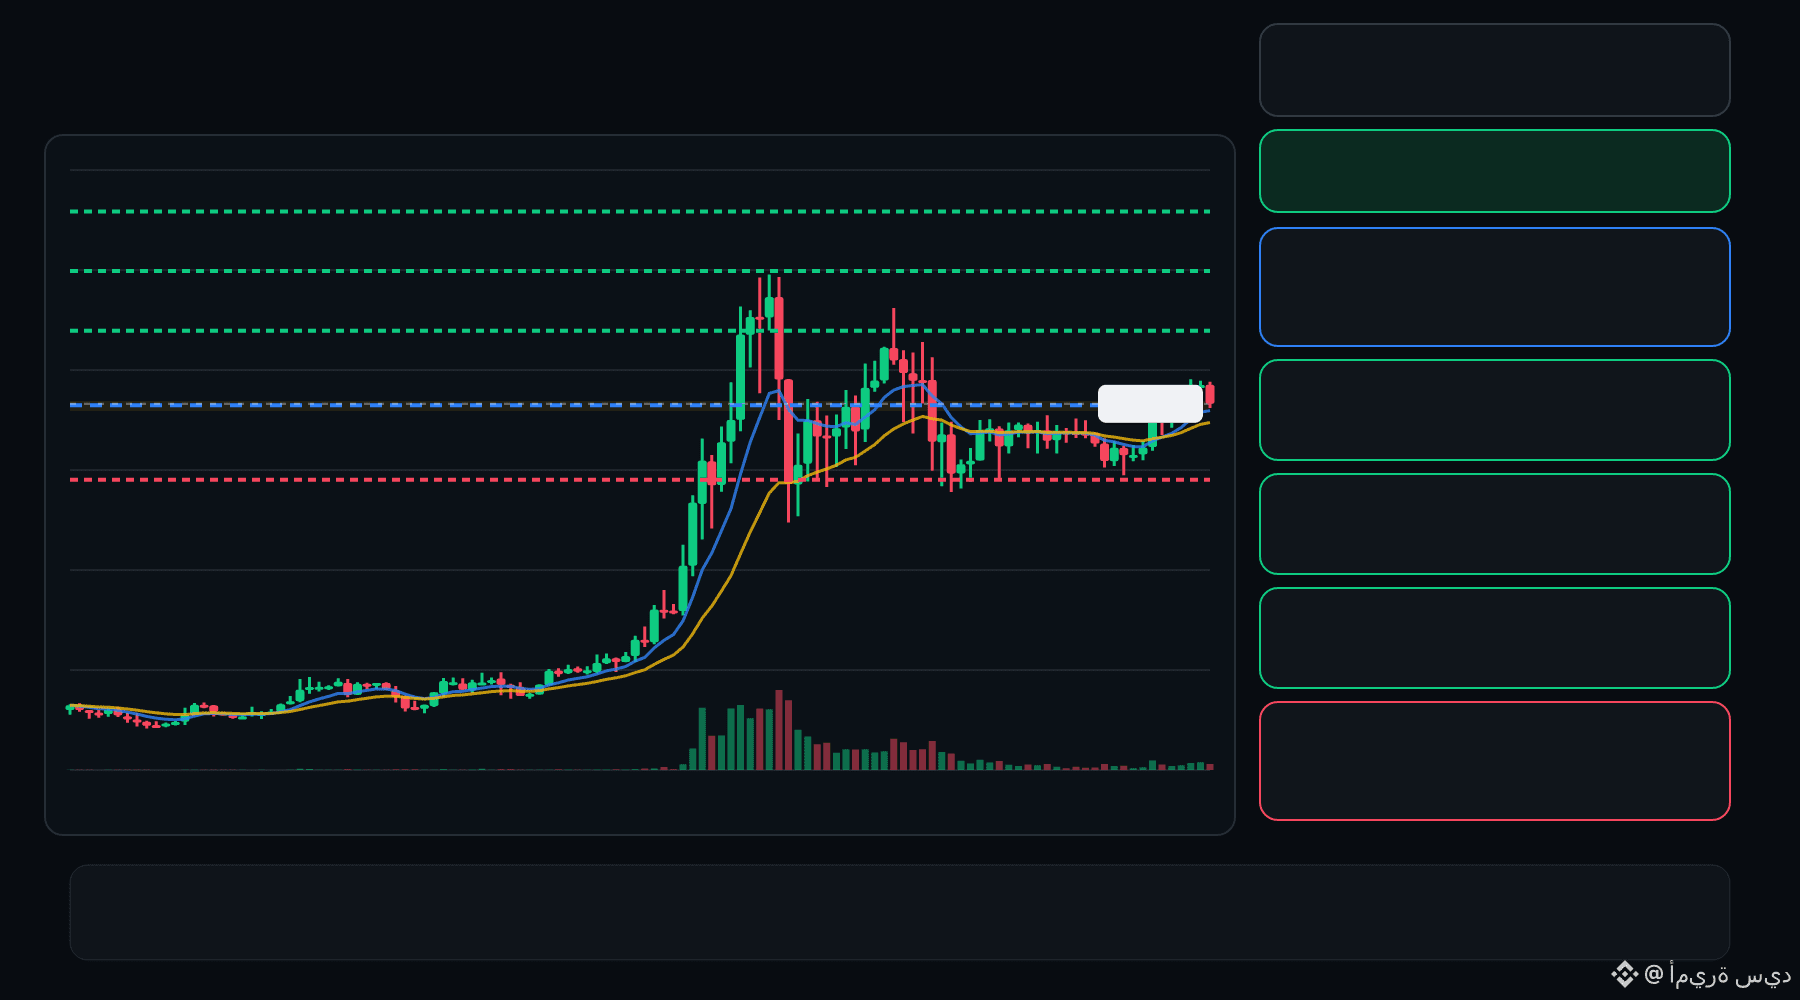
🟢 AIOT bulls are defending the pullback… is continuation setting up ⁉️
🟩 AIOT LONG
Entry: 0.08716 – 0.08760
TP1: 0.09132
TP2: 0.09448
TP3: 0.09764
Stop Loss: 0.08343
The 15M chart shows a bullish structure with momentum and volume confirmation. A controlled retest of the entry zone may give the setup a cleaner trigger.
Plan: Wait for confirmation/rejection inside the entry zone; don’t chase the move.
DYOR | Manage Risk | Avoid Over-Leverage
1
Inicia sesión para explorar más contenidos
Únete a usuarios globales de criptomonedas en Binance Square
⚡️ Obtén información útil y actualizada sobre criptos.
💬 Avalado por el mayor exchange de criptomonedas en el mundo.
👍 Descubre perspectivas reales de creadores verificados.
Email/número de teléfono
Temas populares
BinanceRestoresWithdrawalsForEthereumNetwork&BNBSmartChain
72 vistas
23 están debatiendo
Binance restablece los retiros en las redes ETH y BSC de forma gradual
Binance News
·14 me gusta
·4.4k vistas
BinanceUpdatesProofofReservesAddresses
2,514 vistas
127 están debatiendo
BinanceToResumePhaseOneOfWithdrawals
17,187 vistas
473 están debatiendo