

CryptoTradeMask
10k Publicaciones

CryptoTradeMask
Denunciar
Bloquear usuario
Cryptocurrency market news, financial reviews, courses and training, all about cryptocurrencies and blockchain | 📊Technical analyses, Trading Strategy | 🦈
Abrir trade
Traders de alta frecuencia
8.4 año(s)
234 Siguiendo
1.8K+ Seguidores
12.3K+ Me gusta
Publicaciones
Cartera
Todo
Citas
Videos
PINNED
Artículo
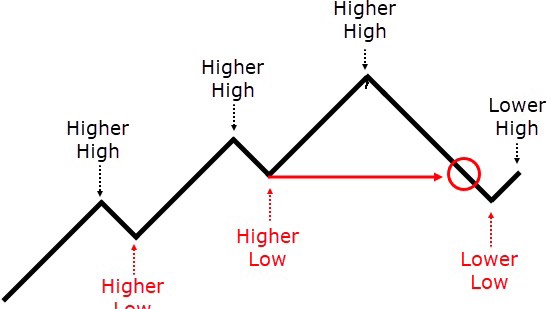
📊MSB: Punto de no retorno o cómo reconocer un giro de tendencia📉La ruptura de la estructura del mercado (MSB — Market Structure Break) es una de las señales más importantes en los Conceptos de Dinero Inteligente (SMC). Indica que la fuerza dominante en el mercado (compradores o vendedores) ha perdido el control, y el precio se está preparando para un giro.
Aquí hay un desglose detallado de cómo funciona el MSB, cómo identificarlo y cómo configurar la lógica para el indicador.
📊MSB: Punto de no retorno o cómo reconocer un giro de tendencia📉
La ruptura de la estructura del mercado (MSB — Market Structure Break) es una de las señales más importantes en los Conceptos de Dinero Inteligente (SMC). Indica que la fuerza dominante en el mercado (compradores o vendedores) ha perdido el control, y el precio se está preparando para un giro.
Aquí hay un desglose detallado de cómo funciona el MSB, cómo identificarlo y cómo configurar la lógica para el indicador.
Aquí hay un desglose detallado de cómo funciona el MSB, cómo identificarlo y cómo configurar la lógica para el indicador.
2
7
178
PINNED

Artículo
📖Enciclopedia del trading moderno: Desde conceptos de Smart Money hasta algoritmos cuánticos📊El trading no es solo comprar y vender. Es una guerra intelectual, donde cada participante utiliza su arma: desde la geometría clásica hasta la inteligencia artificial. En este artículo desglosaremos el mapa completo de métodos que forman los mercados financieros.
🧠 I. MÉTODOS CONCEPTUALES: Cómo piensan los profesionales
📖Enciclopedia del trading moderno: Desde conceptos de Smart Money hasta algoritmos cuánticos📊
El trading no es solo comprar y vender. Es una guerra intelectual, donde cada participante utiliza su arma: desde la geometría clásica hasta la inteligencia artificial. En este artículo desglosaremos el mapa completo de métodos que forman los mercados financieros.
🧠 I. MÉTODOS CONCEPTUALES: Cómo piensan los profesionales
🧠 I. MÉTODOS CONCEPTUALES: Cómo piensan los profesionales
10
3
42
420
#OSMOSIS
🚀 Panorama del mercado: ¿Qué está pasando con Osmosis ($OSMO )?
En las últimas 24 horas, Osmosis ($OSMO) ha subido un 23.42%, alcanzando un precio de $0.0541. ¡Analicemos los factores clave y el panorama técnico detrás de este movimiento!
1️⃣ Factores fundamentales: aumento de la actividad
Volumen de operaciones: Se ha registrado un fuerte aumento del volumen de transacciones en los exchanges descentralizados (DEX): un impresionante incremento del 195%.
Liquidez y ecosistema: El creciente interés de los usuarios en el protocolo, junto con una entrada de capital, está impulsando una demanda adicional del token.
Sentimiento de los inversores: El mercado muestra optimismo, aunque conviene tener presente la posible volatilidad en los máximos locales.
2️⃣ Contexto macroeconómico
Impacto del mercado en general: El rendimiento de OSMO está estrechamente vinculado a la tendencia general del mercado de las criptomonedas, en particular a los movimientos de Bitcoin.
Correlación: Un entorno favorable en el mercado general beneficia a las altcoins; sin embargo, es importante seguir de cerca los cambios en el sentimiento hacia la principal criptomoneda, ya que podrían afectar rápidamente la posición de OSMO.
3️⃣ Análisis técnico y niveles
Situación actual: OSMO cotiza cerca de la marca de $0.05213 y está poniendo a prueba zonas clave de resistencia y soporte (con un rango que llega hasta $0.05678). Indicadores: El MACD sugiere que el impulso se mantiene; sin embargo, los indicadores técnicos apuntan a posibles condiciones de sobrecompra a corto plazo.
📊 Niveles clave:
Nivel de soporte: $0.05213 (una ruptura podría provocar un retroceso hacia $0.04838).
Nivel de resistencia: $0.05678.
⚠️ Conclusiones y riesgos
A pesar del fuerte crecimiento y la intensa actividad compradora, el mercado sigue siendo cíclico. ¡Recuerda aplicar una gestión de riesgos y realizar tu propio análisis antes de tomar cualquier decisión de inversión!
{spot}(OSMOUSDT)
#OSMOSIS
🚀 Panorama del mercado: ¿Qué está pasando con Osmosis ($OSMO )?
En las últimas 24 horas, Osmosis ($OSMO ) ha subido un 23.42%, alcanzando un precio de $0.0541. ¡Analicemos los factores clave y el panorama técnico detrás de este movimiento!
1️⃣ Factores fundamentales: aumento de la actividad
Volumen de operaciones: Se ha registrado un fuerte aumento del volumen de transacciones en los exchanges descentralizados (DEX): un impresionante incremento del 195%.
Liquidez y ecosistema: El creciente interés de los usuarios en el protocolo, junto con una entrada de capital, está impulsando una demanda adicional del token.
Sentimiento de los inversores: El mercado muestra optimismo, aunque conviene tener presente la posible volatilidad en los máximos locales.
2️⃣ Contexto macroeconómico
Impacto del mercado en general: El rendimiento de OSMO está estrechamente vinculado a la tendencia general del mercado de las criptomonedas, en particular a los movimientos de Bitcoin.
Correlación: Un entorno favorable en el mercado general beneficia a las altcoins; sin embargo, es importante seguir de cerca los cambios en el sentimiento hacia la principal criptomoneda, ya que podrían afectar rápidamente la posición de OSMO.
3️⃣ Análisis técnico y niveles
Situación actual: OSMO cotiza cerca de la marca de $0.05213 y está poniendo a prueba zonas clave de resistencia y soporte (con un rango que llega hasta $0.05678). Indicadores: El MACD sugiere que el impulso se mantiene; sin embargo, los indicadores técnicos apuntan a posibles condiciones de sobrecompra a corto plazo.
📊 Niveles clave:
Nivel de soporte: $0.05213 (una ruptura podría provocar un retroceso hacia $0.04838).
Nivel de resistencia: $0.05678.
⚠️ Conclusiones y riesgos
A pesar del fuerte crecimiento y la intensa actividad compradora, el mercado sigue siendo cíclico. ¡Recuerda aplicar una gestión de riesgos y realizar tu propio análisis antes de tomar cualquier decisión de inversión!
🚀 Panorama del mercado: ¿Qué está pasando con Osmosis ($OSMO )?
En las últimas 24 horas, Osmosis ($OSMO ) ha subido un 23.42%, alcanzando un precio de $0.0541. ¡Analicemos los factores clave y el panorama técnico detrás de este movimiento!
1️⃣ Factores fundamentales: aumento de la actividad
Volumen de operaciones: Se ha registrado un fuerte aumento del volumen de transacciones en los exchanges descentralizados (DEX): un impresionante incremento del 195%.
Liquidez y ecosistema: El creciente interés de los usuarios en el protocolo, junto con una entrada de capital, está impulsando una demanda adicional del token.
Sentimiento de los inversores: El mercado muestra optimismo, aunque conviene tener presente la posible volatilidad en los máximos locales.
2️⃣ Contexto macroeconómico
Impacto del mercado en general: El rendimiento de OSMO está estrechamente vinculado a la tendencia general del mercado de las criptomonedas, en particular a los movimientos de Bitcoin.
Correlación: Un entorno favorable en el mercado general beneficia a las altcoins; sin embargo, es importante seguir de cerca los cambios en el sentimiento hacia la principal criptomoneda, ya que podrían afectar rápidamente la posición de OSMO.
3️⃣ Análisis técnico y niveles
Situación actual: OSMO cotiza cerca de la marca de $0.05213 y está poniendo a prueba zonas clave de resistencia y soporte (con un rango que llega hasta $0.05678). Indicadores: El MACD sugiere que el impulso se mantiene; sin embargo, los indicadores técnicos apuntan a posibles condiciones de sobrecompra a corto plazo.
📊 Niveles clave:
Nivel de soporte: $0.05213 (una ruptura podría provocar un retroceso hacia $0.04838).
Nivel de resistencia: $0.05678.
⚠️ Conclusiones y riesgos
A pesar del fuerte crecimiento y la intensa actividad compradora, el mercado sigue siendo cíclico. ¡Recuerda aplicar una gestión de riesgos y realizar tu propio análisis antes de tomar cualquier decisión de inversión!

1
103
#fomc
📉 La semana comienza con un importante evento macroeconómico: la reunión del FOMC (27–28 de octubre).
Para los activos de riesgo y las criptomonedas, el principal foco ahora no es tanto la decisión sobre los tipos de interés —se espera una pausa o mucha cautela—, sino más bien el tono de las declaraciones y las perspectivas de liquidez.
🎯 Puntos clave a tener en cuenta:
➡️ El tono del regulador: ¿Habrá indicios de una mayor flexibilización o las condiciones seguirán siendo más restrictivas durante más tiempo debido a los riesgos inflacionarios?
➡️ La volatilidad del mercado: Durante estas reuniones, los libros de órdenes suelen volverse turbulentos. Los algoritmos y los grandes capitales suelen activar órdenes de stop-loss en ambas direcciones antes de que se defina la tendencia real; por eso, asumir riesgos innecesarios con un apalancamiento elevado es buscarse un dolor de cabeza.
➡️ La reacción del mercado: La verdadera respuesta del mercado se hará evidente durante la rueda de prensa e inmediatamente después.
⚠️ Presta atención a los niveles clave, mantén la calma y gestiona los riesgos. 📊⚡️
{future}(BTCUSDT)
{future}(ETHUSDT)
{future}(ENAUSDT)
#fomc
📉 La semana comienza con un importante evento macroeconómico: la reunión del FOMC (27–28 de octubre).
Para los activos de riesgo y las criptomonedas, el principal foco ahora no es tanto la decisión sobre los tipos de interés —se espera una pausa o mucha cautela—, sino más bien el tono de las declaraciones y las perspectivas de liquidez.
🎯 Puntos clave a tener en cuenta:
➡️ El tono del regulador: ¿Habrá indicios de una mayor flexibilización o las condiciones seguirán siendo más restrictivas durante más tiempo debido a los riesgos inflacionarios?
➡️ La volatilidad del mercado: Durante estas reuniones, los libros de órdenes suelen volverse turbulentos. Los algoritmos y los grandes capitales suelen activar órdenes de stop-loss en ambas direcciones antes de que se defina la tendencia real; por eso, asumir riesgos innecesarios con un apalancamiento elevado es buscarse un dolor de cabeza.
➡️ La reacción del mercado: La verdadera respuesta del mercado se hará evidente durante la rueda de prensa e inmediatamente después.
⚠️ Presta atención a los niveles clave, mantén la calma y gestiona los riesgos. 📊⚡️
📉 La semana comienza con un importante evento macroeconómico: la reunión del FOMC (27–28 de octubre).
Para los activos de riesgo y las criptomonedas, el principal foco ahora no es tanto la decisión sobre los tipos de interés —se espera una pausa o mucha cautela—, sino más bien el tono de las declaraciones y las perspectivas de liquidez.
🎯 Puntos clave a tener en cuenta:
➡️ El tono del regulador: ¿Habrá indicios de una mayor flexibilización o las condiciones seguirán siendo más restrictivas durante más tiempo debido a los riesgos inflacionarios?
➡️ La volatilidad del mercado: Durante estas reuniones, los libros de órdenes suelen volverse turbulentos. Los algoritmos y los grandes capitales suelen activar órdenes de stop-loss en ambas direcciones antes de que se defina la tendencia real; por eso, asumir riesgos innecesarios con un apalancamiento elevado es buscarse un dolor de cabeza.
➡️ La reacción del mercado: La verdadera respuesta del mercado se hará evidente durante la rueda de prensa e inmediatamente después.
⚠️ Presta atención a los niveles clave, mantén la calma y gestiona los riesgos. 📊⚡️

1
1
154
#win
🔥 Panorama y dinámica del mercado de WINkLink ($WIN ): ¿Qué está pasando con el token?
En las últimas 24 horas, el token WIN ha subido un 9,97%, hasta alcanzar los 0,0000668 $. Analizamos los principales factores, riesgos y pronósticos para los próximos días.
📊 Noticias y contexto clave
1️⃣ Actividad de la red y TRON:
A pesar del repunte del precio, el volumen de transacciones en la red ha disminuido ligeramente. Mientras tanto, la actividad en la blockchain de TRON sigue siendo alta, lo que mantiene indirectamente el interés en el proyecto.
2️⃣ Sentimiento de los inversores:
El optimismo en el mercado global es moderado. La correlación de WIN con Bitcoin es del 1,02% y con Ethereum, del 0,91%. El Índice de Miedo y Codicia ronda el 3,85%, lo que indica que los operadores siguen siendo cautelosos.
3️⃣ Análisis técnico y niveles:
Precio actual: ~0,000066 $.
Resistencia inmediata: 0,000075 $ (poner a prueba este nivel podría abrir el camino hacia objetivos más altos).
Soporte clave: 0,000062 $ (si no se mantiene este nivel, es posible que el precio baje hasta 0,000055 $).
Factores clave de la semana: Las próximas reuniones del FOMC y los datos macroeconómicos siguen siendo el principal foco de atención de los operadores.
⚠️ Resumen breve:
WIN muestra una recuperación local en medio de las fluctuaciones generales del mercado cripto; sin embargo, su evolución futura dependerá de los factores macroeconómicos y del comportamiento de Bitcoin.
{spot}(WINUSDT)
#win
🔥 Panorama y dinámica del mercado de WINkLink ($WIN ): ¿Qué está pasando con el token?
En las últimas 24 horas, el token WIN ha subido un 9,97%, hasta alcanzar los 0,0000668 $. Analizamos los principales factores, riesgos y pronósticos para los próximos días.
📊 Noticias y contexto clave
1️⃣ Actividad de la red y TRON:
A pesar del repunte del precio, el volumen de transacciones en la red ha disminuido ligeramente. Mientras tanto, la actividad en la blockchain de TRON sigue siendo alta, lo que mantiene indirectamente el interés en el proyecto.
2️⃣ Sentimiento de los inversores:
El optimismo en el mercado global es moderado. La correlación de WIN con Bitcoin es del 1,02% y con Ethereum, del 0,91%. El Índice de Miedo y Codicia ronda el 3,85%, lo que indica que los operadores siguen siendo cautelosos.
3️⃣ Análisis técnico y niveles:
Precio actual: ~0,000066 $.
Resistencia inmediata: 0,000075 $ (poner a prueba este nivel podría abrir el camino hacia objetivos más altos).
Soporte clave: 0,000062 $ (si no se mantiene este nivel, es posible que el precio baje hasta 0,000055 $).
Factores clave de la semana: Las próximas reuniones del FOMC y los datos macroeconómicos siguen siendo el principal foco de atención de los operadores.
⚠️ Resumen breve:
WIN muestra una recuperación local en medio de las fluctuaciones generales del mercado cripto; sin embargo, su evolución futura dependerá de los factores macroeconómicos y del comportamiento de Bitcoin.
🔥 Panorama y dinámica del mercado de WINkLink ($WIN ): ¿Qué está pasando con el token?
En las últimas 24 horas, el token WIN ha subido un 9,97%, hasta alcanzar los 0,0000668 $. Analizamos los principales factores, riesgos y pronósticos para los próximos días.
📊 Noticias y contexto clave
1️⃣ Actividad de la red y TRON:
A pesar del repunte del precio, el volumen de transacciones en la red ha disminuido ligeramente. Mientras tanto, la actividad en la blockchain de TRON sigue siendo alta, lo que mantiene indirectamente el interés en el proyecto.
2️⃣ Sentimiento de los inversores:
El optimismo en el mercado global es moderado. La correlación de WIN con Bitcoin es del 1,02% y con Ethereum, del 0,91%. El Índice de Miedo y Codicia ronda el 3,85%, lo que indica que los operadores siguen siendo cautelosos.
3️⃣ Análisis técnico y niveles:
Precio actual: ~0,000066 $.
Resistencia inmediata: 0,000075 $ (poner a prueba este nivel podría abrir el camino hacia objetivos más altos).
Soporte clave: 0,000062 $ (si no se mantiene este nivel, es posible que el precio baje hasta 0,000055 $).
Factores clave de la semana: Las próximas reuniones del FOMC y los datos macroeconómicos siguen siendo el principal foco de atención de los operadores.
⚠️ Resumen breve:
WIN muestra una recuperación local en medio de las fluctuaciones generales del mercado cripto; sin embargo, su evolución futura dependerá de los factores macroeconómicos y del comportamiento de Bitcoin.

213
#bitcoin
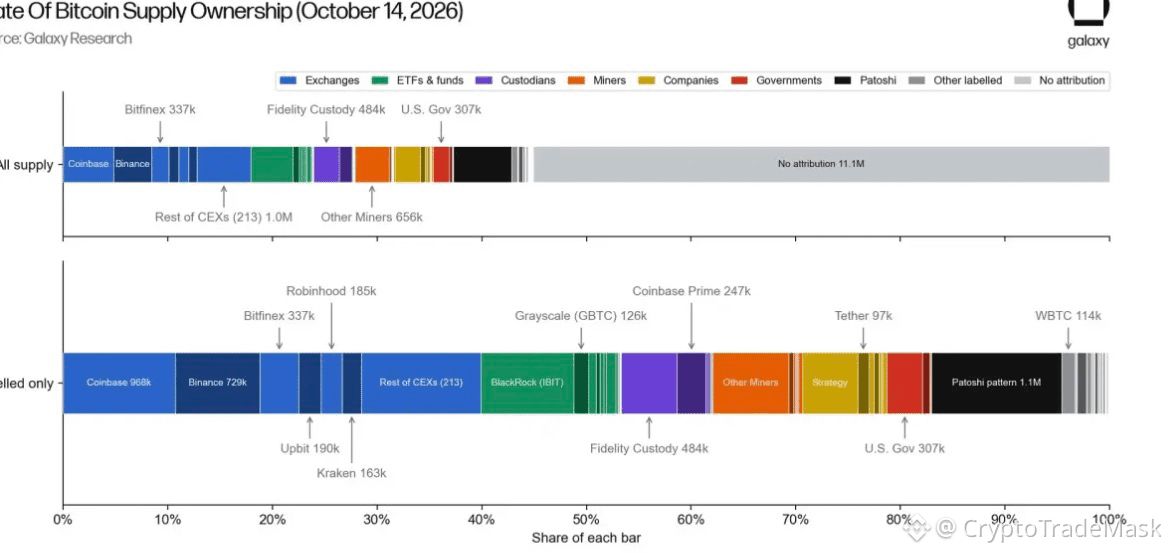
¿Sabías que más de 11 millones de $BTC —aproximadamente el 55 % de todas las monedas minadas— no tienen un propietario conocido? 🪙
A pesar de la enorme ola de adopción de Wall Street, los ETF y los exchanges centralizados que acaparan titulares, nuevos datos de Galaxy Research revelan que la mayoría de los bitcoins siguen almacenados en monederos sin propietario identificado.
Aunque esta cifra incluye sin duda monedas perdidas y fondos institucionales no identificados, expertos como Alex Thorn, de Galaxy, destacan una conclusión importante: la autocustodia sigue viva y vigente. Los inversores minoristas y particulares todavía optan por custodiar sus propias claves y, de verdad, «ser su propio banco».
{future}(BTCUSDT)
#bitcoin
¿Sabías que más de 11 millones de $BTC —aproximadamente el 55 % de todas las monedas minadas— no tienen un propietario conocido? 🪙
A pesar de la enorme ola de adopción de Wall Street, los ETF y los exchanges centralizados que acaparan titulares, nuevos datos de Galaxy Research revelan que la mayoría de los bitcoins siguen almacenados en monederos sin propietario identificado.
Aunque esta cifra incluye sin duda monedas perdidas y fondos institucionales no identificados, expertos como Alex Thorn, de Galaxy, destacan una conclusión importante: la autocustodia sigue viva y vigente. Los inversores minoristas y particulares todavía optan por custodiar sus propias claves y, de verdad, «ser su propio banco».
¿Sabías que más de 11 millones de $BTC —aproximadamente el 55 % de todas las monedas minadas— no tienen un propietario conocido? 🪙
A pesar de la enorme ola de adopción de Wall Street, los ETF y los exchanges centralizados que acaparan titulares, nuevos datos de Galaxy Research revelan que la mayoría de los bitcoins siguen almacenados en monederos sin propietario identificado.
Aunque esta cifra incluye sin duda monedas perdidas y fondos institucionales no identificados, expertos como Alex Thorn, de Galaxy, destacan una conclusión importante: la autocustodia sigue viva y vigente. Los inversores minoristas y particulares todavía optan por custodiar sus propias claves y, de verdad, «ser su propio banco».
71
#bitcoin
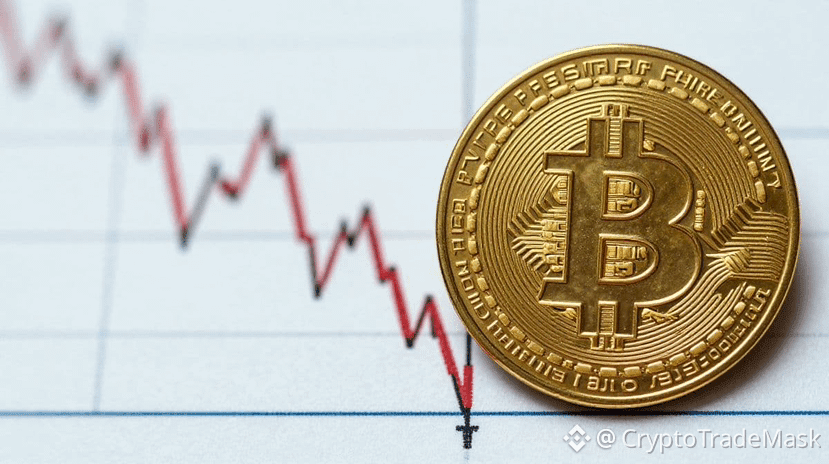
📉 Bitcoin cae por debajo de los 80.000 $ en medio de una venta masiva generalizada del mercado y preocupaciones relacionadas con la IA
La principal criptomoneda cayó brevemente por debajo de los 79.300 $ debido a la presión general sobre los activos de riesgo.
🔍 Motivos clave de la caída:
➡️ Expectativas antes de la reunión de la Fed: Los inversores están adoptando una postura de «esperar y ver» antes de la próxima decisión de la Reserva Federal de EE. UU.
➡️ Salidas de fondos de los ETF: El jueves y el viernes, los ETF de Bitcoin al contado de EE. UU. registraron salidas de capital por un total de 772,4 millones de dólares, tras una entrada previa de más de 1.000 millones.
➡️ La sombra del mercado de la IA: La preocupación por el elevado gasto en inteligencia artificial y la importante consolidación del sector tecnológico —agravada por los comentarios de Elon Musk— está pesando sobre el mercado de las criptomonedas, considerado parte de la «cesta de riesgo».
➡️ Corrección de las altcoins: Junto con Bitcoin, otras monedas importantes —Ether ($ETH ), XRP ($XRP ) y Solana ($SOL )— también registraron caídas.
{future}(SOLUSDT)
{future}(ETHUSDT)
{future}(XRPUSDT)
#bitcoin
📉 Bitcoin cae por debajo de los 80.000 $ en medio de una venta masiva generalizada del mercado y preocupaciones relacionadas con la IA
La principal criptomoneda cayó brevemente por debajo de los 79.300 $ debido a la presión general sobre los activos de riesgo.
🔍 Motivos clave de la caída:
➡️ Expectativas antes de la reunión de la Fed: Los inversores están adoptando una postura de «esperar y ver» antes de la próxima decisión de la Reserva Federal de EE. UU.
➡️ Salidas de fondos de los ETF: El jueves y el viernes, los ETF de Bitcoin al contado de EE. UU. registraron salidas de capital por un total de 772,4 millones de dólares, tras una entrada previa de más de 1.000 millones.
➡️ La sombra del mercado de la IA: La preocupación por el elevado gasto en inteligencia artificial y la importante consolidación del sector tecnológico —agravada por los comentarios de Elon Musk— está pesando sobre el mercado de las criptomonedas, considerado parte de la «cesta de riesgo».
➡️ Corrección de las altcoins: Junto con Bitcoin, otras monedas importantes —Ether ($ETH ), XRP ($XRP ) y Solana ($SOL )— también registraron caídas.
📉 Bitcoin cae por debajo de los 80.000 $ en medio de una venta masiva generalizada del mercado y preocupaciones relacionadas con la IA
La principal criptomoneda cayó brevemente por debajo de los 79.300 $ debido a la presión general sobre los activos de riesgo.
🔍 Motivos clave de la caída:
➡️ Expectativas antes de la reunión de la Fed: Los inversores están adoptando una postura de «esperar y ver» antes de la próxima decisión de la Reserva Federal de EE. UU.
➡️ Salidas de fondos de los ETF: El jueves y el viernes, los ETF de Bitcoin al contado de EE. UU. registraron salidas de capital por un total de 772,4 millones de dólares, tras una entrada previa de más de 1.000 millones.
➡️ La sombra del mercado de la IA: La preocupación por el elevado gasto en inteligencia artificial y la importante consolidación del sector tecnológico —agravada por los comentarios de Elon Musk— está pesando sobre el mercado de las criptomonedas, considerado parte de la «cesta de riesgo».
➡️ Corrección de las altcoins: Junto con Bitcoin, otras monedas importantes —Ether ($ETH ), XRP ($XRP ) y Solana ($SOL )— también registraron caídas.
130
#FOMC #FederalReserve
Con la reunión del FOMC a la vuelta de la esquina, todas las miradas están puestas en la Reserva Federal. 🦅📊
La inflación persistente, el alza vertiginosa de los precios del petróleo y la deuda nacional récord están arrinconando fiscalmente a Estados Unidos. ¿Puede la economía soportar tasas de interés altas o la carga de la deuda obligará a dar un giro?
Qué significa esto para Bitcoin ($BTC ):
📉 Corto plazo: Una sorpresa de línea dura o la persistencia de una liquidez restringida podrían mantener la presión sobre los activos de riesgo, como las criptomonedas.
📈 Largo plazo: La trayectoria insostenible de la deuda pública de Estados Unidos sugiere claramente que la política monetaria restrictiva no puede durar para siempre, un contexto macroeconómico que, según sostienen muchos alcistas, favorece en última instancia a los activos descentralizados.
{future}(BTCUSDT)
#FOMC #FederalReserve
Con la reunión del FOMC a la vuelta de la esquina, todas las miradas están puestas en la Reserva Federal. 🦅📊
La inflación persistente, el alza vertiginosa de los precios del petróleo y la deuda nacional récord están arrinconando fiscalmente a Estados Unidos. ¿Puede la economía soportar tasas de interés altas o la carga de la deuda obligará a dar un giro?
Qué significa esto para Bitcoin ($BTC ):
📉 Corto plazo: Una sorpresa de línea dura o la persistencia de una liquidez restringida podrían mantener la presión sobre los activos de riesgo, como las criptomonedas.
📈 Largo plazo: La trayectoria insostenible de la deuda pública de Estados Unidos sugiere claramente que la política monetaria restrictiva no puede durar para siempre, un contexto macroeconómico que, según sostienen muchos alcistas, favorece en última instancia a los activos descentralizados.
Con la reunión del FOMC a la vuelta de la esquina, todas las miradas están puestas en la Reserva Federal. 🦅📊
La inflación persistente, el alza vertiginosa de los precios del petróleo y la deuda nacional récord están arrinconando fiscalmente a Estados Unidos. ¿Puede la economía soportar tasas de interés altas o la carga de la deuda obligará a dar un giro?
Qué significa esto para Bitcoin ($BTC ):
📉 Corto plazo: Una sorpresa de línea dura o la persistencia de una liquidez restringida podrían mantener la presión sobre los activos de riesgo, como las criptomonedas.
📈 Largo plazo: La trayectoria insostenible de la deuda pública de Estados Unidos sugiere claramente que la política monetaria restrictiva no puede durar para siempre, un contexto macroeconómico que, según sostienen muchos alcistas, favorece en última instancia a los activos descentralizados.

474
#etf
Los ETF de Bitcoin ponen fin a una racha de dos semanas de pérdidas: ¿qué está pasando en el mercado?
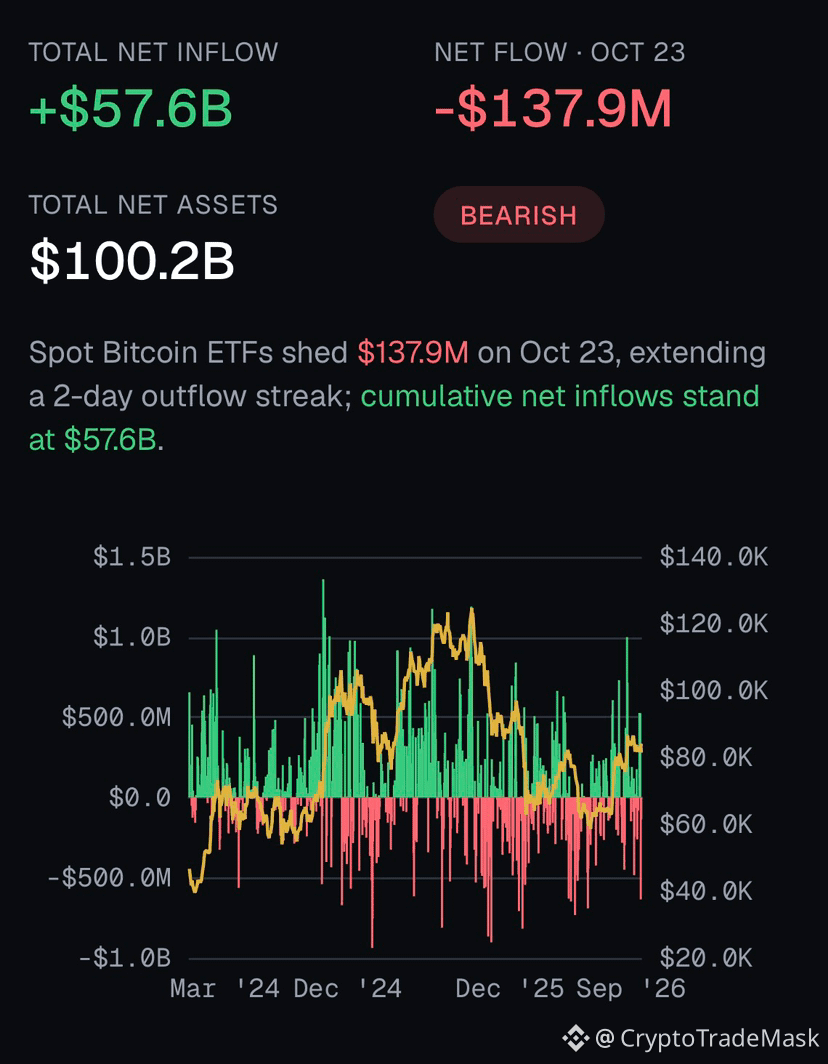
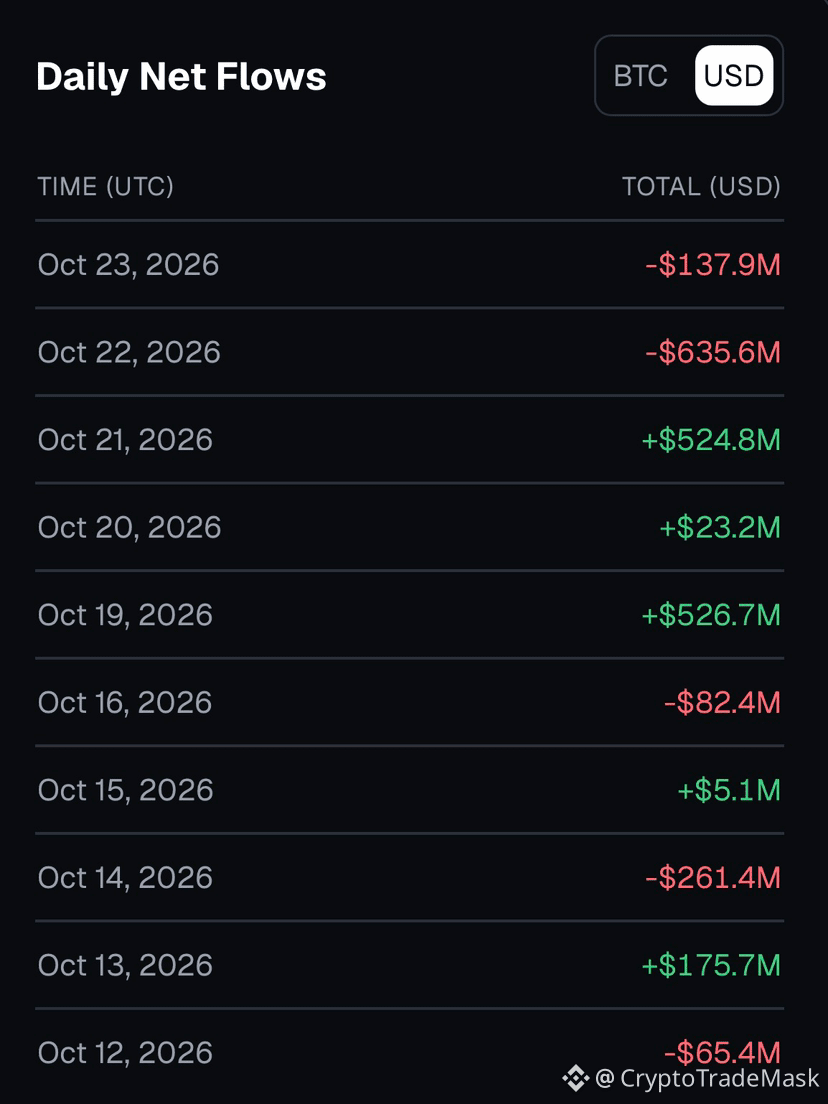
$BTC Los ETF lograron poner fin esta semana a su racha de dos semanas de pérdidas y cerraron en positivo, con entradas netas de aproximadamente 301 millones de dólares, pese a la caída de finales de semana, que registró salidas de 137,9 millones de dólares solo el viernes.
📊 Estos son los aspectos más destacados:
➡️ Balance mensual: Octubre sigue siendo complicado. Los fondos de Bitcoin acumulan una caída de unos 314 millones de dólares en el mes, mientras que los ETF de Ethereum afrontan un déficit mensual más pronunciado, de 1.180 millones de dólares.
➡️ Evolución de los precios: Bitcoin cayó un 1,1 %, hasta situarse en torno a los 80.490 dólares; $ETH bajó a 2.344 dólares, y $SOL cayó a 101 dólares, en medio de un retroceso macroeconómico general vinculado al alza de los precios del petróleo y a la caída de las acciones tecnológicas y de IA.
➡️ Sentimiento del mercado: Los mercados de predicción de Myriad se muestran algo más cautelosos: los operadores calculan en un 43 % la probabilidad de que Bitcoin ponga a prueba los 77.500 dólares antes de que termine octubre.
{future}(SOLUSDT)
{future}(ETHUSDT)
{future}(BTCUSDT)
#etf
Los ETF de Bitcoin ponen fin a una racha de dos semanas de pérdidas: ¿qué está pasando en el mercado?
$BTC Los ETF lograron poner fin esta semana a su racha de dos semanas de pérdidas y cerraron en positivo, con entradas netas de aproximadamente 301 millones de dólares, pese a la caída de finales de semana, que registró salidas de 137,9 millones de dólares solo el viernes.
📊 Estos son los aspectos más destacados:
➡️ Balance mensual: Octubre sigue siendo complicado. Los fondos de Bitcoin acumulan una caída de unos 314 millones de dólares en el mes, mientras que los ETF de Ethereum afrontan un déficit mensual más pronunciado, de 1.180 millones de dólares.
➡️ Evolución de los precios: Bitcoin cayó un 1,1 %, hasta situarse en torno a los 80.490 dólares; $ETH bajó a 2.344 dólares, y $SOL cayó a 101 dólares, en medio de un retroceso macroeconómico general vinculado al alza de los precios del petróleo y a la caída de las acciones tecnológicas y de IA.
➡️ Sentimiento del mercado: Los mercados de predicción de Myriad se muestran algo más cautelosos: los operadores calculan en un 43 % la probabilidad de que Bitcoin ponga a prueba los 77.500 dólares antes de que termine octubre.
Los ETF de Bitcoin ponen fin a una racha de dos semanas de pérdidas: ¿qué está pasando en el mercado?
$BTC Los ETF lograron poner fin esta semana a su racha de dos semanas de pérdidas y cerraron en positivo, con entradas netas de aproximadamente 301 millones de dólares, pese a la caída de finales de semana, que registró salidas de 137,9 millones de dólares solo el viernes.
📊 Estos son los aspectos más destacados:
➡️ Balance mensual: Octubre sigue siendo complicado. Los fondos de Bitcoin acumulan una caída de unos 314 millones de dólares en el mes, mientras que los ETF de Ethereum afrontan un déficit mensual más pronunciado, de 1.180 millones de dólares.
➡️ Evolución de los precios: Bitcoin cayó un 1,1 %, hasta situarse en torno a los 80.490 dólares; $ETH bajó a 2.344 dólares, y $SOL cayó a 101 dólares, en medio de un retroceso macroeconómico general vinculado al alza de los precios del petróleo y a la caída de las acciones tecnológicas y de IA.
➡️ Sentimiento del mercado: Los mercados de predicción de Myriad se muestran algo más cautelosos: los operadores calculan en un 43 % la probabilidad de que Bitcoin ponga a prueba los 77.500 dólares antes de que termine octubre.
51
#Siacoin
📊 Siacoin ($SC ) Panorama del mercado: ¿Es hora de nuevos movimientos?
La moneda muestra un crecimiento moderado del 11.01%, alcanzando los $0.000859. ¿Qué está pasando en los gráficos y qué nos depara el futuro? Estos son los puntos clave:
➡️ Tendencias e indicadores: Durante la última semana y el último mes, el activo ha mostrado una dinámica mixta. El índice de fuerza relativa (RSI) de 7 días se sitúa en 56.7, lo que indica un sentimiento neutral del mercado. El volumen de operaciones ha aumentado un 58.86% (hasta los $6.4 millones), lo que señala una mayor actividad de los operadores.
➡️ Posición en el mercado: La correlación de Siacoin con Bitcoin es actualmente baja (0.49), lo que sugiere cierto grado de autonomía del activo. Según los datos de CMC, la moneda ocupa el puesto 49 por volumen, mientras que el dominio de Bitcoin en el mercado se mantiene elevado, en el 60.13%.
➡️ Niveles clave: El precio se ha consolidado por encima del nivel de retroceso del 38.2% ($0.000829). La resistencia inmediata se sitúa en $0.000872, mientras que el soporte se mantiene en los mínimos semanales de $0.000812.
{spot}(SCUSDT)
#Siacoin
📊 Siacoin ($SC ) Panorama del mercado: ¿Es hora de nuevos movimientos?
La moneda muestra un crecimiento moderado del 11.01%, alcanzando los $0.000859. ¿Qué está pasando en los gráficos y qué nos depara el futuro? Estos son los puntos clave:
➡️ Tendencias e indicadores: Durante la última semana y el último mes, el activo ha mostrado una dinámica mixta. El índice de fuerza relativa (RSI) de 7 días se sitúa en 56.7, lo que indica un sentimiento neutral del mercado. El volumen de operaciones ha aumentado un 58.86% (hasta los $6.4 millones), lo que señala una mayor actividad de los operadores.
➡️ Posición en el mercado: La correlación de Siacoin con Bitcoin es actualmente baja (0.49), lo que sugiere cierto grado de autonomía del activo. Según los datos de CMC, la moneda ocupa el puesto 49 por volumen, mientras que el dominio de Bitcoin en el mercado se mantiene elevado, en el 60.13%.
➡️ Niveles clave: El precio se ha consolidado por encima del nivel de retroceso del 38.2% ($0.000829). La resistencia inmediata se sitúa en $0.000872, mientras que el soporte se mantiene en los mínimos semanales de $0.000812.
📊 Siacoin ($SC ) Panorama del mercado: ¿Es hora de nuevos movimientos?
La moneda muestra un crecimiento moderado del 11.01%, alcanzando los $0.000859. ¿Qué está pasando en los gráficos y qué nos depara el futuro? Estos son los puntos clave:
➡️ Tendencias e indicadores: Durante la última semana y el último mes, el activo ha mostrado una dinámica mixta. El índice de fuerza relativa (RSI) de 7 días se sitúa en 56.7, lo que indica un sentimiento neutral del mercado. El volumen de operaciones ha aumentado un 58.86% (hasta los $6.4 millones), lo que señala una mayor actividad de los operadores.
➡️ Posición en el mercado: La correlación de Siacoin con Bitcoin es actualmente baja (0.49), lo que sugiere cierto grado de autonomía del activo. Según los datos de CMC, la moneda ocupa el puesto 49 por volumen, mientras que el dominio de Bitcoin en el mercado se mantiene elevado, en el 60.13%.
➡️ Niveles clave: El precio se ha consolidado por encima del nivel de retroceso del 38.2% ($0.000829). La resistencia inmediata se sitúa en $0.000872, mientras que el soporte se mantiene en los mínimos semanales de $0.000812.
85
#Overbought & #oversold
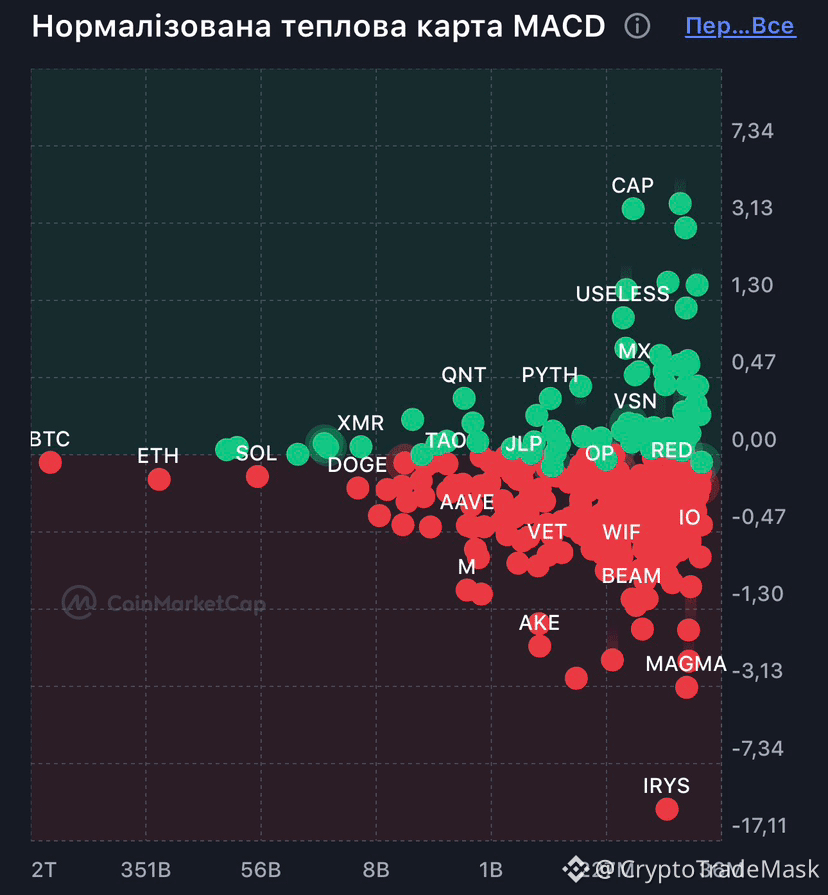
📊 MACD: ¿Cómo funciona y cómo detectar un cambio de tendencia? 📈📉
El principal indicador de tendencia y momentum que ayuda a entender quién lleva las riendas del mercado en este momento: los compradores o los vendedores.
🟢 Cruce ascendente (señal alcista)
• La línea de señal cruza la línea principal de abajo hacia arriba.
• El histograma pasa de la zona roja a la verde (de negativo a positivo).
• El impulso bajista se debilita: existe la posibilidad de que comience una nueva tendencia alcista o se produzca un fuerte rebote.
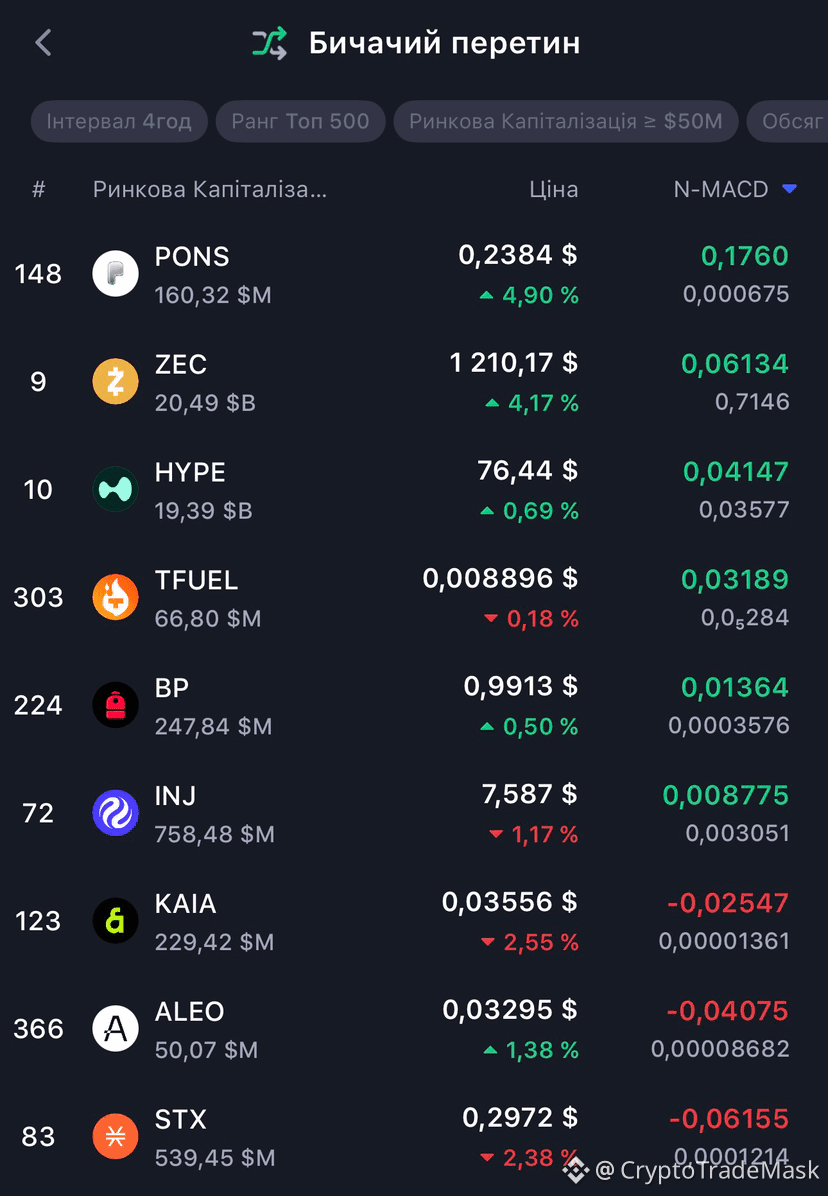
• Muchas monedas están ahora en esta zona: $ZEC , $HYPE : podría estar formándose un suelo.
🔴 Cruce descendente (señal bajista)
• La línea de señal cruza la línea principal de arriba hacia abajo.
• El histograma cambia de verde a rojo (cae por debajo de cero).
• Los compradores pierden fuerza: aumenta la probabilidad de una corrección o de un cambio a una tendencia bajista.
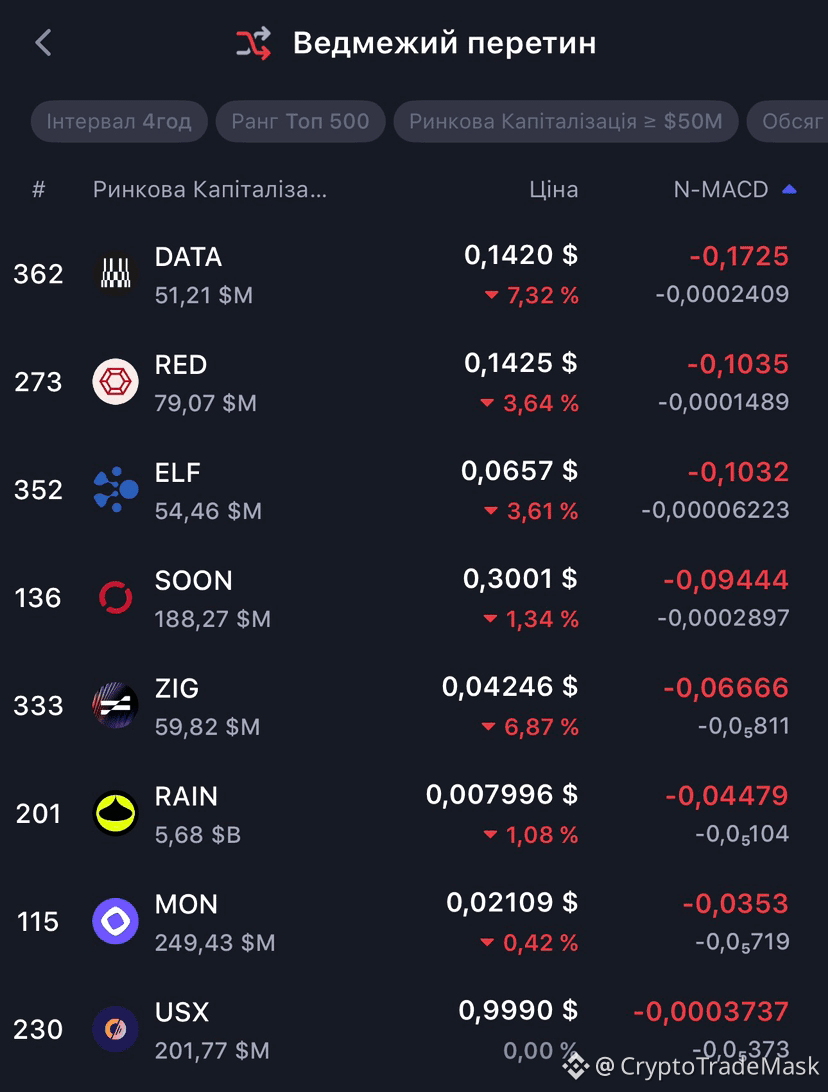
• Ahora mismo, en esta zona: $RED : es posible que se produzca una pausa tras el repunte.
⚡ Divergencia (la señal más potente)
• El precio marca un nuevo mínimo, mientras que el MACD marca un mínimo más alto: el mercado se prepara para un repunte.
• El precio marca un nuevo máximo y el MACD un máximo más bajo: prepárate para una pausa o una caída.
⚠️ Regla de oro: el MACD funciona muy bien en un mercado con tendencia, pero puede dar señales falsas en un mercado lateral. Combínalo siempre con niveles de soporte y resistencia y con el volumen.
{future}(REDUSDT)
{future}(HYPEUSDT)
{future}(ZECUSDT)
#Overbought & #oversold
📊 MACD: ¿Cómo funciona y cómo detectar un cambio de tendencia? 📈📉
El principal indicador de tendencia y momentum que ayuda a entender quién lleva las riendas del mercado en este momento: los compradores o los vendedores.
🟢 Cruce ascendente (señal alcista)
• La línea de señal cruza la línea principal de abajo hacia arriba.
• El histograma pasa de la zona roja a la verde (de negativo a positivo).
• El impulso bajista se debilita: existe la posibilidad de que comience una nueva tendencia alcista o se produzca un fuerte rebote.
• Muchas monedas están ahora en esta zona: $ZEC , $HYPE : podría estar formándose un suelo.
🔴 Cruce descendente (señal bajista)
• La línea de señal cruza la línea principal de arriba hacia abajo.
• El histograma cambia de verde a rojo (cae por debajo de cero).
• Los compradores pierden fuerza: aumenta la probabilidad de una corrección o de un cambio a una tendencia bajista.
• Ahora mismo, en esta zona: $RED : es posible que se produzca una pausa tras el repunte.
⚡ Divergencia (la señal más potente)
• El precio marca un nuevo mínimo, mientras que el MACD marca un mínimo más alto: el mercado se prepara para un repunte.
• El precio marca un nuevo máximo y el MACD un máximo más bajo: prepárate para una pausa o una caída.
⚠️ Regla de oro: el MACD funciona muy bien en un mercado con tendencia, pero puede dar señales falsas en un mercado lateral. Combínalo siempre con niveles de soporte y resistencia y con el volumen.
📊 MACD: ¿Cómo funciona y cómo detectar un cambio de tendencia? 📈📉
El principal indicador de tendencia y momentum que ayuda a entender quién lleva las riendas del mercado en este momento: los compradores o los vendedores.
🟢 Cruce ascendente (señal alcista)
• La línea de señal cruza la línea principal de abajo hacia arriba.
• El histograma pasa de la zona roja a la verde (de negativo a positivo).
• El impulso bajista se debilita: existe la posibilidad de que comience una nueva tendencia alcista o se produzca un fuerte rebote.
• Muchas monedas están ahora en esta zona: $ZEC , $HYPE : podría estar formándose un suelo.
🔴 Cruce descendente (señal bajista)
• La línea de señal cruza la línea principal de arriba hacia abajo.
• El histograma cambia de verde a rojo (cae por debajo de cero).
• Los compradores pierden fuerza: aumenta la probabilidad de una corrección o de un cambio a una tendencia bajista.
• Ahora mismo, en esta zona: $RED : es posible que se produzca una pausa tras el repunte.
⚡ Divergencia (la señal más potente)
• El precio marca un nuevo mínimo, mientras que el MACD marca un mínimo más alto: el mercado se prepara para un repunte.
• El precio marca un nuevo máximo y el MACD un máximo más bajo: prepárate para una pausa o una caída.
⚠️ Regla de oro: el MACD funciona muy bien en un mercado con tendencia, pero puede dar señales falsas en un mercado lateral. Combínalo siempre con niveles de soporte y resistencia y con el volumen.
214
#travala
📉 Resumen cripto: ¿Qué está pasando con $AVA (Travala)?
El token $AVA (Travala) ha variado un 10.64% en las últimas 24 horas y se ha situado en $0.412. Dada la mayor volatilidad del mercado, conviene analizar los factores clave, los riesgos y los niveles de precio que debes vigilar en tu posición.
📊 3 factores clave que influyen:
1️⃣ Noticias sobre la fundación y las recompras
El día 22, Travala y la Fundación AVA anunciaron cambios estratégicos. Se ha puesto en marcha un mecanismo de «Multiplicador de recompra de AVA» que vincula las recompras de tokens con las métricas de rendimiento de la plataforma. Aunque esto genera presión deflacionaria a largo plazo, la reacción inmediata del mercado ha sido moderada debido al escepticismo general.
Ventajas: Posible reducción de la oferta circulante con el tiempo.
Desventajas: El impacto de este tipo de noticias suele materializarse a más largo plazo y no provoca una subida inmediata del precio.
2️⃣ Liquidez y correlación del mercado
La actividad compradora evitó una caída más pronunciada, aunque los volúmenes de negociación siguen siendo moderados. La correlación con Bitcoin es del 0.24% y con Ethereum, del 0.33%. Esto indica que AVA depende principalmente de su propio ciclo de noticias, en lugar de seguir las tendencias generales del mercado.
Ventajas: Menor dependencia de las fuertes fluctuaciones de los principales activos.
Desventajas: Apoyo limitado del mercado general durante los movimientos alcistas.
3️⃣ Objetivos y niveles técnicos
Los compradores intentan defender la zona de soporte cercana a $0.40. La resistencia clave en el camino hacia una recuperación está cerca de $0.45, mientras que la zona de soporte crítica —si se intensifica la presión vendedora— se encuentra en $0.38.
📈 Escenario alcista: Una ruptura y consolidación por encima de $0.43 abrirían el camino hacia $0.45.
📉 Escenario bajista: Perder el nivel de $0.38 conlleva el riesgo de una rápida caída hacia rangos locales inferiores.
⚠️ Conclusión y estrategia:
La situación de AVA requiere mucha atención: aunque la evolución de los fundamentales es positiva, la tendencia técnica a corto plazo sigue bajo presión vendedora. Asegúrate de aplicar una gestión estricta del riesgo, recoger beneficios parciales y no olvides utilizar órdenes de stop-loss.
{future}(AVAUSDT)
#travala
📉 Resumen cripto: ¿Qué está pasando con $AVA (Travala)?
El token $AVA (Travala) ha variado un 10.64% en las últimas 24 horas y se ha situado en $0.412. Dada la mayor volatilidad del mercado, conviene analizar los factores clave, los riesgos y los niveles de precio que debes vigilar en tu posición.
📊 3 factores clave que influyen:
1️⃣ Noticias sobre la fundación y las recompras
El día 22, Travala y la Fundación AVA anunciaron cambios estratégicos. Se ha puesto en marcha un mecanismo de «Multiplicador de recompra de AVA» que vincula las recompras de tokens con las métricas de rendimiento de la plataforma. Aunque esto genera presión deflacionaria a largo plazo, la reacción inmediata del mercado ha sido moderada debido al escepticismo general.
Ventajas: Posible reducción de la oferta circulante con el tiempo.
Desventajas: El impacto de este tipo de noticias suele materializarse a más largo plazo y no provoca una subida inmediata del precio.
2️⃣ Liquidez y correlación del mercado
La actividad compradora evitó una caída más pronunciada, aunque los volúmenes de negociación siguen siendo moderados. La correlación con Bitcoin es del 0.24% y con Ethereum, del 0.33%. Esto indica que AVA depende principalmente de su propio ciclo de noticias, en lugar de seguir las tendencias generales del mercado.
Ventajas: Menor dependencia de las fuertes fluctuaciones de los principales activos.
Desventajas: Apoyo limitado del mercado general durante los movimientos alcistas.
3️⃣ Objetivos y niveles técnicos
Los compradores intentan defender la zona de soporte cercana a $0.40. La resistencia clave en el camino hacia una recuperación está cerca de $0.45, mientras que la zona de soporte crítica —si se intensifica la presión vendedora— se encuentra en $0.38.
📈 Escenario alcista: Una ruptura y consolidación por encima de $0.43 abrirían el camino hacia $0.45.
📉 Escenario bajista: Perder el nivel de $0.38 conlleva el riesgo de una rápida caída hacia rangos locales inferiores.
⚠️ Conclusión y estrategia:
La situación de AVA requiere mucha atención: aunque la evolución de los fundamentales es positiva, la tendencia técnica a corto plazo sigue bajo presión vendedora. Asegúrate de aplicar una gestión estricta del riesgo, recoger beneficios parciales y no olvides utilizar órdenes de stop-loss.
📉 Resumen cripto: ¿Qué está pasando con $AVA (Travala)?
El token $AVA (Travala) ha variado un 10.64% en las últimas 24 horas y se ha situado en $0.412. Dada la mayor volatilidad del mercado, conviene analizar los factores clave, los riesgos y los niveles de precio que debes vigilar en tu posición.
📊 3 factores clave que influyen:
1️⃣ Noticias sobre la fundación y las recompras
El día 22, Travala y la Fundación AVA anunciaron cambios estratégicos. Se ha puesto en marcha un mecanismo de «Multiplicador de recompra de AVA» que vincula las recompras de tokens con las métricas de rendimiento de la plataforma. Aunque esto genera presión deflacionaria a largo plazo, la reacción inmediata del mercado ha sido moderada debido al escepticismo general.
Ventajas: Posible reducción de la oferta circulante con el tiempo.
Desventajas: El impacto de este tipo de noticias suele materializarse a más largo plazo y no provoca una subida inmediata del precio.
2️⃣ Liquidez y correlación del mercado
La actividad compradora evitó una caída más pronunciada, aunque los volúmenes de negociación siguen siendo moderados. La correlación con Bitcoin es del 0.24% y con Ethereum, del 0.33%. Esto indica que AVA depende principalmente de su propio ciclo de noticias, en lugar de seguir las tendencias generales del mercado.
Ventajas: Menor dependencia de las fuertes fluctuaciones de los principales activos.
Desventajas: Apoyo limitado del mercado general durante los movimientos alcistas.
3️⃣ Objetivos y niveles técnicos
Los compradores intentan defender la zona de soporte cercana a $0.40. La resistencia clave en el camino hacia una recuperación está cerca de $0.45, mientras que la zona de soporte crítica —si se intensifica la presión vendedora— se encuentra en $0.38.
📈 Escenario alcista: Una ruptura y consolidación por encima de $0.43 abrirían el camino hacia $0.45.
📉 Escenario bajista: Perder el nivel de $0.38 conlleva el riesgo de una rápida caída hacia rangos locales inferiores.
⚠️ Conclusión y estrategia:
La situación de AVA requiere mucha atención: aunque la evolución de los fundamentales es positiva, la tendencia técnica a corto plazo sigue bajo presión vendedora. Asegúrate de aplicar una gestión estricta del riesgo, recoger beneficios parciales y no olvides utilizar órdenes de stop-loss.

100
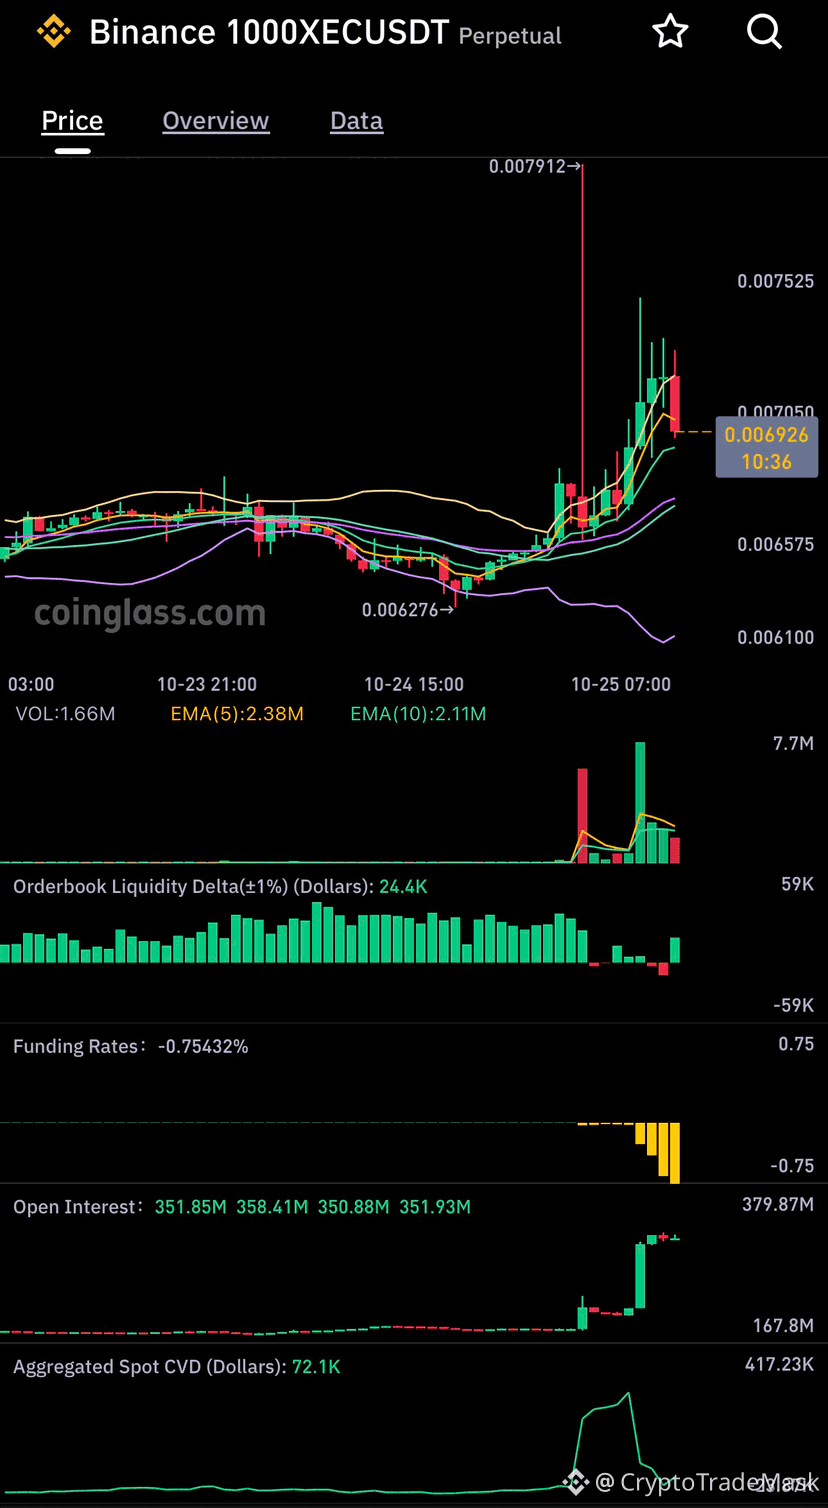
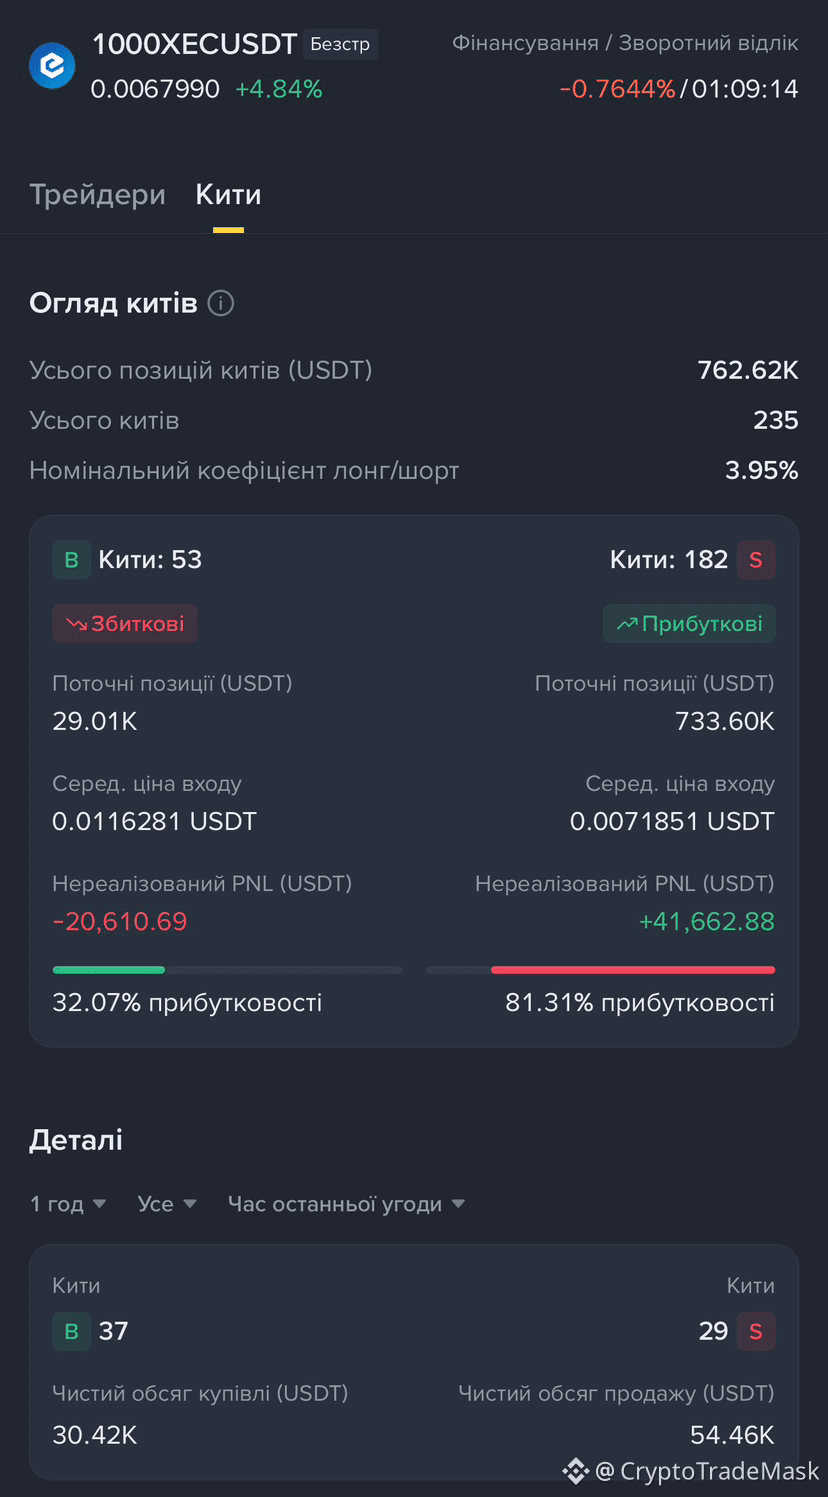
🔥 $1000XEC /USDT: ¿Apretón de cortos o continuación de la venta masiva?
Interés abierto (OI): Aumenta con fuerza (~379.8M), lo que indica una entrada agresiva de capital.
Tasas de financiación: Extremadamente negativas (-0.75%): los vendedores en corto están pagando comisiones considerables a las posiciones largas, lo que crea las condiciones perfectas para un apretón de cortos explosivo.
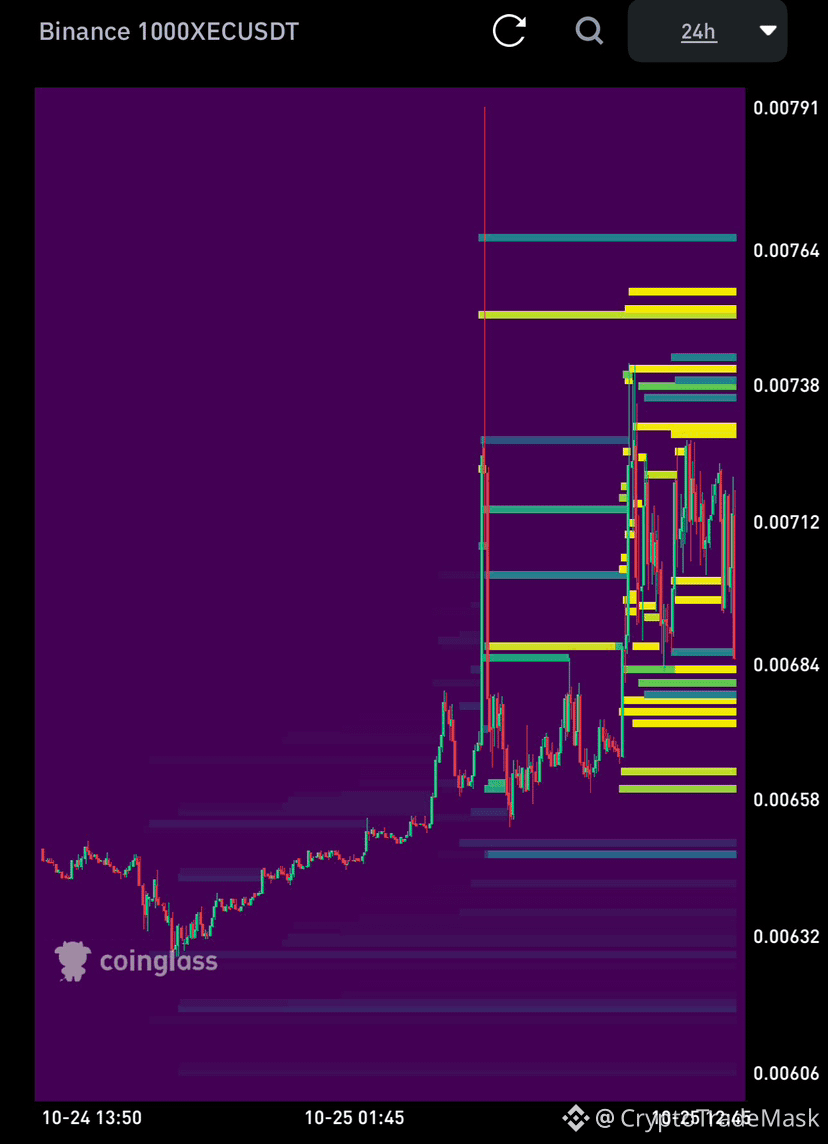
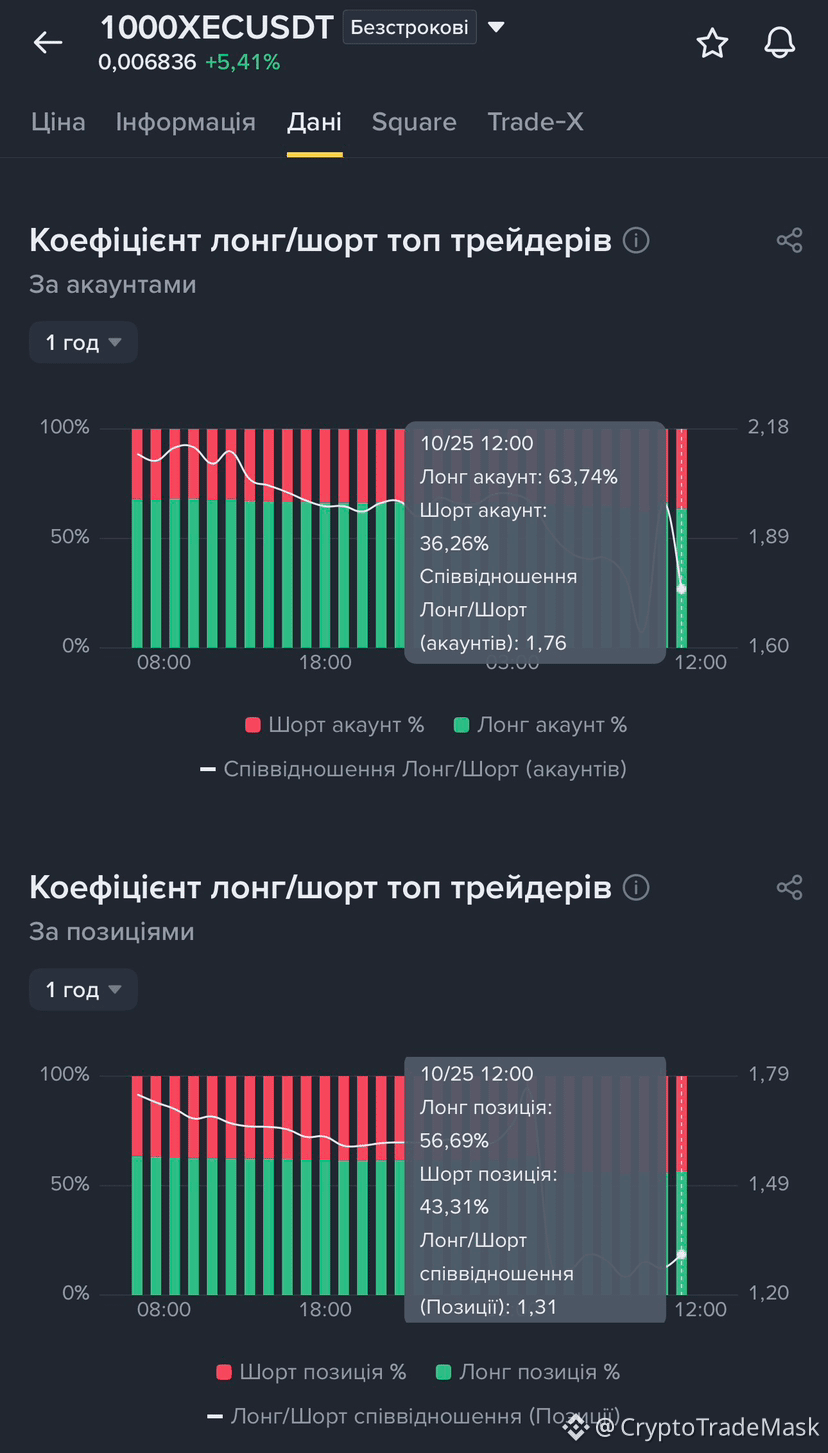
Dinámica del mercado: Las ballenas mantienen en gran medida posiciones cortas rentables, pero la presión vendedora empieza a encontrar resistencia.
🚦 Ideas de trading:
🟢 Largo (alto riesgo): Entrar cerca del nivel de soporte de 0.00670 – 0.00680 USDT, anticipando un rebote y una «sacudida» de los vendedores en corto. Objetivo: 0.00735 – 0.00764 USDT. Stop-loss: 0.00655 USDT.
🔴 Corto (siguiendo a las ballenas): Entrar tras un rechazo en el nivel de resistencia de 0.00715 – 0.00730 USDT. Objetivo: 0.00655 – 0.00625 USDT. Stop-loss: 0.00750 USDT.
⚠️ Precaución: Debido a las tasas de financiación extremas, mantener posiciones durante mucho tiempo resulta costoso; ¡reduce el apalancamiento y gestiona los riesgos!
{future}(1000XECUSDT)
🔥 $1000XEC /USDT: ¿Apretón de cortos o continuación de la venta masiva?
Interés abierto (OI): Aumenta con fuerza (~379.8M), lo que indica una entrada agresiva de capital.
Tasas de financiación: Extremadamente negativas (-0.75%): los vendedores en corto están pagando comisiones considerables a las posiciones largas, lo que crea las condiciones perfectas para un apretón de cortos explosivo.
Dinámica del mercado: Las ballenas mantienen en gran medida posiciones cortas rentables, pero la presión vendedora empieza a encontrar resistencia.
🚦 Ideas de trading:
🟢 Largo (alto riesgo): Entrar cerca del nivel de soporte de 0.00670 – 0.00680 USDT, anticipando un rebote y una «sacudida» de los vendedores en corto. Objetivo: 0.00735 – 0.00764 USDT. Stop-loss: 0.00655 USDT.
🔴 Corto (siguiendo a las ballenas): Entrar tras un rechazo en el nivel de resistencia de 0.00715 – 0.00730 USDT. Objetivo: 0.00655 – 0.00625 USDT. Stop-loss: 0.00750 USDT.
⚠️ Precaución: Debido a las tasas de financiación extremas, mantener posiciones durante mucho tiempo resulta costoso; ¡reduce el apalancamiento y gestiona los riesgos!
Interés abierto (OI): Aumenta con fuerza (~379.8M), lo que indica una entrada agresiva de capital.
Tasas de financiación: Extremadamente negativas (-0.75%): los vendedores en corto están pagando comisiones considerables a las posiciones largas, lo que crea las condiciones perfectas para un apretón de cortos explosivo.
Dinámica del mercado: Las ballenas mantienen en gran medida posiciones cortas rentables, pero la presión vendedora empieza a encontrar resistencia.
🚦 Ideas de trading:
🟢 Largo (alto riesgo): Entrar cerca del nivel de soporte de 0.00670 – 0.00680 USDT, anticipando un rebote y una «sacudida» de los vendedores en corto. Objetivo: 0.00735 – 0.00764 USDT. Stop-loss: 0.00655 USDT.
🔴 Corto (siguiendo a las ballenas): Entrar tras un rechazo en el nivel de resistencia de 0.00715 – 0.00730 USDT. Objetivo: 0.00655 – 0.00625 USDT. Stop-loss: 0.00750 USDT.
⚠️ Precaución: Debido a las tasas de financiación extremas, mantener posiciones durante mucho tiempo resulta costoso; ¡reduce el apalancamiento y gestiona los riesgos!
451
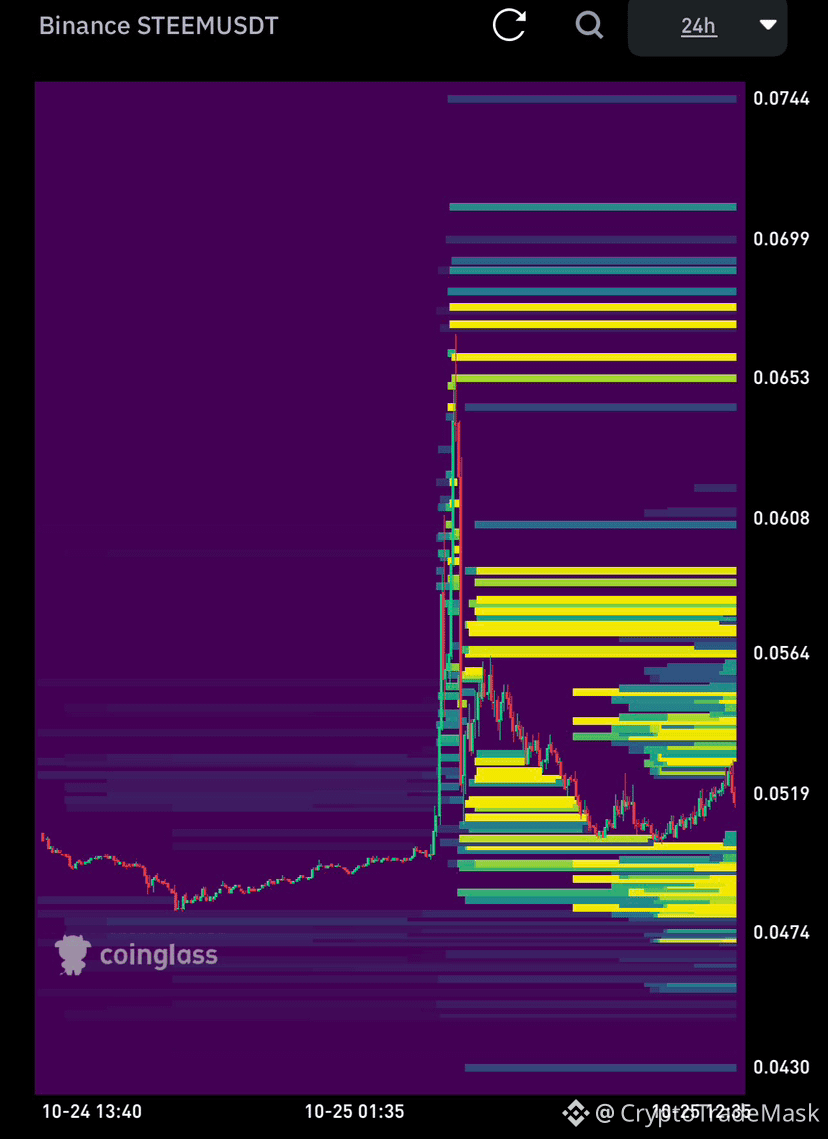
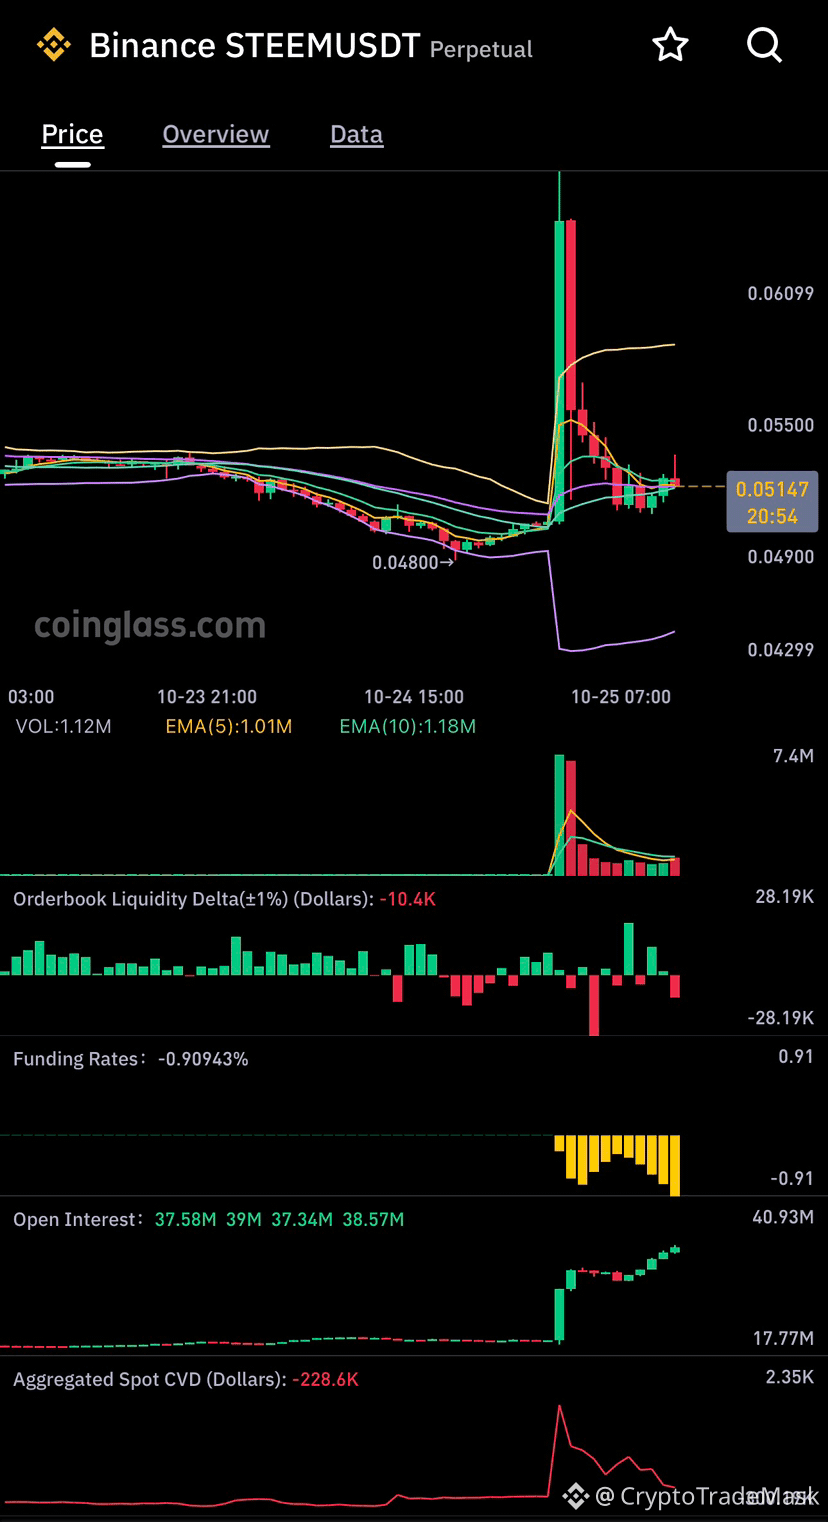
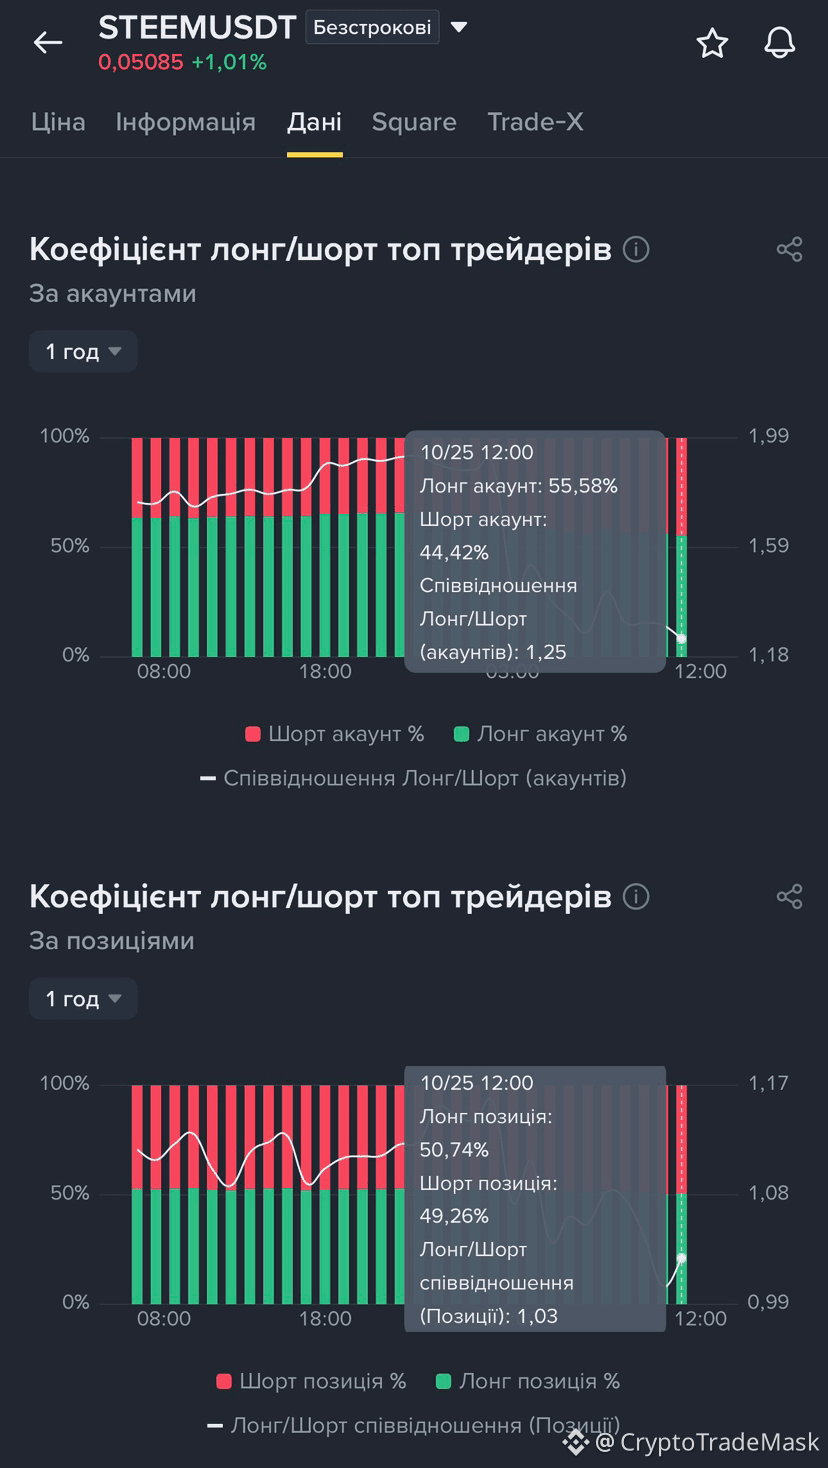
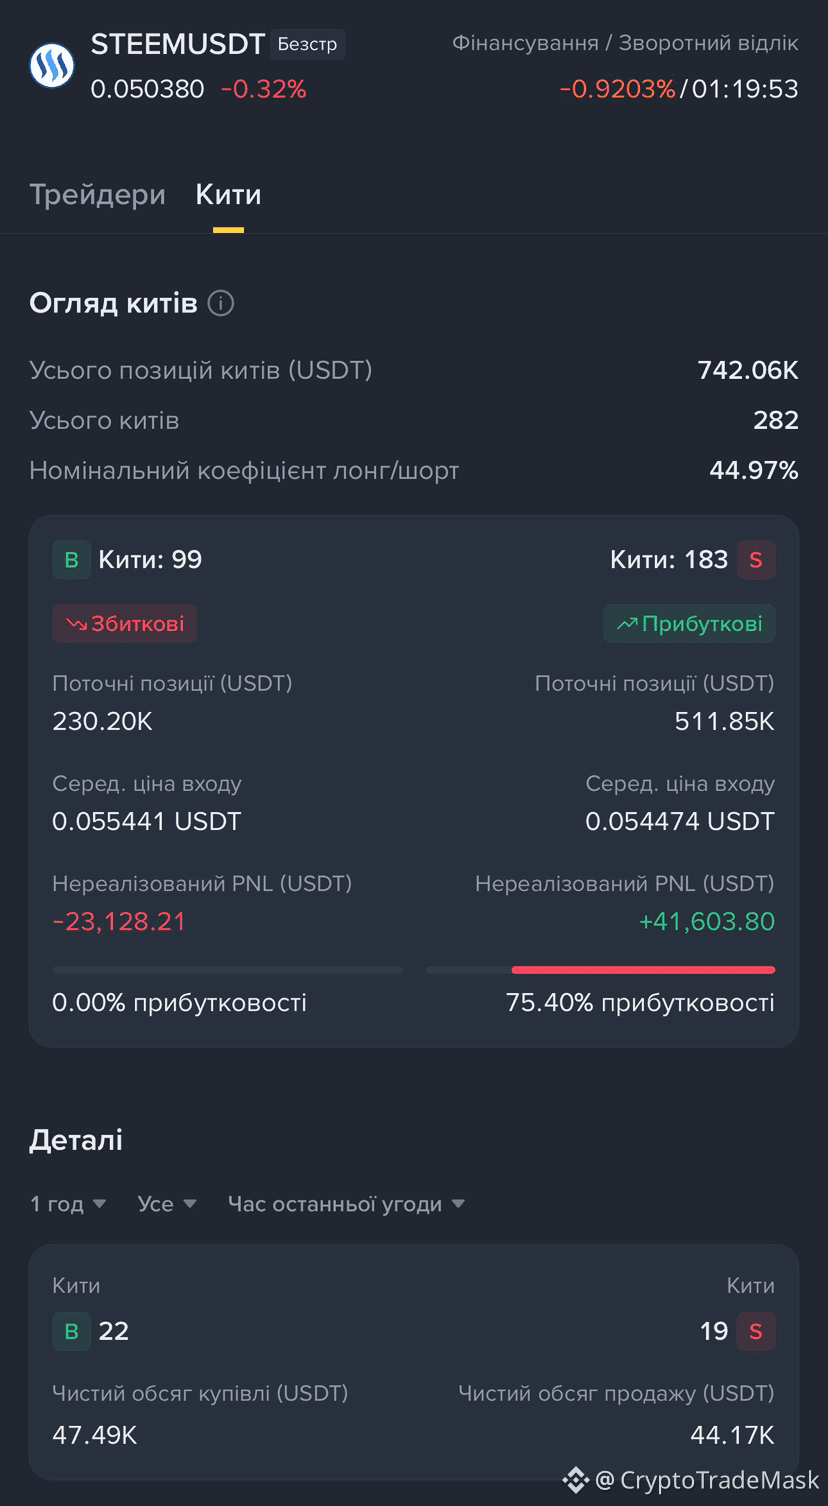
📊 Análisis de mercado de $STEEM /USDT
Situación actual: Tras un repunte impulsivo, el activo ha corregido hasta el nivel de 0.0508 USD.
🔑 Métricas clave:
La tasa de financiación es extremadamente negativa (-0.92%), lo que genera un alto riesgo de una liquidación en cascada de posiciones cortas.
El interés abierto sigue siendo elevado (~38–40 millones).
Las posiciones de las ballenas muestran un predominio de posiciones cortas.
🚦 Escenarios de trading:
🟢 Largo (en un rebote): Entrar desde la zona de soporte de 0.0485 – 0.0500 USD. Objetivo: 0.0545 – 0.0600 USD. Stop-loss: por debajo de 0.0465 USD.
🔴 Corto (a favor de la tendencia): Entrar en un rebote hasta 0.0540 – 0.0555 USD o tras una ruptura por debajo de 0.0500 USD. Objetivo: 0.0480 – 0.0440 USD. Stop-loss: por encima de 0.0585 USD.
⚠️ Ten en cuenta la alta volatilidad y aplica prácticas de gestión del riesgo.
{future}(STEEMUSDT)
📊 Análisis de mercado de $STEEM /USDT
Situación actual: Tras un repunte impulsivo, el activo ha corregido hasta el nivel de 0.0508 USD.
🔑 Métricas clave:
La tasa de financiación es extremadamente negativa (-0.92%), lo que genera un alto riesgo de una liquidación en cascada de posiciones cortas.
El interés abierto sigue siendo elevado (~38–40 millones).
Las posiciones de las ballenas muestran un predominio de posiciones cortas.
🚦 Escenarios de trading:
🟢 Largo (en un rebote): Entrar desde la zona de soporte de 0.0485 – 0.0500 USD. Objetivo: 0.0545 – 0.0600 USD. Stop-loss: por debajo de 0.0465 USD.
🔴 Corto (a favor de la tendencia): Entrar en un rebote hasta 0.0540 – 0.0555 USD o tras una ruptura por debajo de 0.0500 USD. Objetivo: 0.0480 – 0.0440 USD. Stop-loss: por encima de 0.0585 USD.
⚠️ Ten en cuenta la alta volatilidad y aplica prácticas de gestión del riesgo.
Situación actual: Tras un repunte impulsivo, el activo ha corregido hasta el nivel de 0.0508 USD.
🔑 Métricas clave:
La tasa de financiación es extremadamente negativa (-0.92%), lo que genera un alto riesgo de una liquidación en cascada de posiciones cortas.
El interés abierto sigue siendo elevado (~38–40 millones).
Las posiciones de las ballenas muestran un predominio de posiciones cortas.
🚦 Escenarios de trading:
🟢 Largo (en un rebote): Entrar desde la zona de soporte de 0.0485 – 0.0500 USD. Objetivo: 0.0545 – 0.0600 USD. Stop-loss: por debajo de 0.0465 USD.
🔴 Corto (a favor de la tendencia): Entrar en un rebote hasta 0.0540 – 0.0555 USD o tras una ruptura por debajo de 0.0500 USD. Objetivo: 0.0480 – 0.0440 USD. Stop-loss: por encima de 0.0585 USD.
⚠️ Ten en cuenta la alta volatilidad y aplica prácticas de gestión del riesgo.
195
#polymesh
🚀 Polymesh ($POLYX ): Resumen semanal y noticias clave
En las últimas 24 horas, Polymesh ha registrado un crecimiento significativo y cotiza a $0.0386 (un aumento del 12.60%). Los principales impulsores fueron las noticias de los mercados financieros tradicionales y un repunte de la actividad de la red.
🎯 Eventos clave de la semana:
➡️ Asociación con TruGolf: TruGolf (NASDAQ: TRUG) anunció la integración de sus acciones en la blockchain de Polymesh a través de Polymath. Se espera que las acciones tokenizadas lleguen al mercado en 2027, lo que subraya la confianza en Polymesh como plataforma para activos del mundo real (RWA).
➡️ Crecimiento explosivo de la actividad: El volumen de transacciones de 24 horas se disparó un 760.41%, hasta alcanzar los $12.9 millones. Mientras Bitcoin se mantiene estancado (con una subida de apenas el 0.49%), POLYX está mostrando un sólido impulso propio.
➡️ Situación del mercado: El token cotiza actualmente dentro de un rango delimitado por un soporte en $0.036 y una resistencia en $0.04. Una ruptura por encima del límite superior dependerá en gran medida del éxito continuo de la integración de TruGolf.
📊 Niveles técnicos:
Resistencia: $0.04
Soporte: $0.036 (con soporte adicional en $0.032)
{future}(POLYXUSDT)
#polymesh
🚀 Polymesh ($POLYX ): Resumen semanal y noticias clave
En las últimas 24 horas, Polymesh ha registrado un crecimiento significativo y cotiza a $0.0386 (un aumento del 12.60%). Los principales impulsores fueron las noticias de los mercados financieros tradicionales y un repunte de la actividad de la red.
🎯 Eventos clave de la semana:
➡️ Asociación con TruGolf: TruGolf (NASDAQ: TRUG) anunció la integración de sus acciones en la blockchain de Polymesh a través de Polymath. Se espera que las acciones tokenizadas lleguen al mercado en 2027, lo que subraya la confianza en Polymesh como plataforma para activos del mundo real (RWA).
➡️ Crecimiento explosivo de la actividad: El volumen de transacciones de 24 horas se disparó un 760.41%, hasta alcanzar los $12.9 millones. Mientras Bitcoin se mantiene estancado (con una subida de apenas el 0.49%), POLYX está mostrando un sólido impulso propio.
➡️ Situación del mercado: El token cotiza actualmente dentro de un rango delimitado por un soporte en $0.036 y una resistencia en $0.04. Una ruptura por encima del límite superior dependerá en gran medida del éxito continuo de la integración de TruGolf.
📊 Niveles técnicos:
Resistencia: $0.04
Soporte: $0.036 (con soporte adicional en $0.032)
🚀 Polymesh ($POLYX ): Resumen semanal y noticias clave
En las últimas 24 horas, Polymesh ha registrado un crecimiento significativo y cotiza a $0.0386 (un aumento del 12.60%). Los principales impulsores fueron las noticias de los mercados financieros tradicionales y un repunte de la actividad de la red.
🎯 Eventos clave de la semana:
➡️ Asociación con TruGolf: TruGolf (NASDAQ: TRUG) anunció la integración de sus acciones en la blockchain de Polymesh a través de Polymath. Se espera que las acciones tokenizadas lleguen al mercado en 2027, lo que subraya la confianza en Polymesh como plataforma para activos del mundo real (RWA).
➡️ Crecimiento explosivo de la actividad: El volumen de transacciones de 24 horas se disparó un 760.41%, hasta alcanzar los $12.9 millones. Mientras Bitcoin se mantiene estancado (con una subida de apenas el 0.49%), POLYX está mostrando un sólido impulso propio.
➡️ Situación del mercado: El token cotiza actualmente dentro de un rango delimitado por un soporte en $0.036 y una resistencia en $0.04. Una ruptura por encima del límite superior dependerá en gran medida del éxito continuo de la integración de TruGolf.
📊 Niveles técnicos:
Resistencia: $0.04
Soporte: $0.036 (con soporte adicional en $0.032)

1
165
#threshold
🚀 Resumen del mercado cripto: ¿Qué está pasando con Threshold ($T )?
El token Threshold ($T T) muestra un impulso notable: su precio ha variado un 38,37 % en las últimas 24 horas y actualmente se sitúa en 0,00639 $. Analicemos los puntos clave y los posibles escenarios de trading.
📊 Indicadores clave:
Volumen de trading: En las últimas 24 horas, el volumen se disparó un 10.640 % y alcanzó los 172,07 millones de dólares, lo que indica una gran actividad en el mercado.
Situación técnica: El precio está poniendo a prueba un nivel de soporte significativo en 0,00663 $ (38,2 %), mientras que el máximo diario alcanzó los 0,00794 $.
RSI: Actualmente se encuentra en 59,82, lo que indica un sentimiento moderadamente alcista, sin llegar a niveles de sobrecompra.
🚦 Escenarios de trading:
📈 Al alza: Una ruptura por encima de la resistencia de 0,00794 $ podría abrir paso a un mayor movimiento alcista.
📉 Corrección: Mantener el soporte en 0,00663 $ es crucial para sostener la tendencia positiva, mientras que el nivel de 0,00622 $ (50 %) actúa como umbral crítico: caer por debajo invalidaría el escenario alcista.
{spot}(TUSDT)
#threshold
🚀 Resumen del mercado cripto: ¿Qué está pasando con Threshold ($T )?
El token Threshold ($T T) muestra un impulso notable: su precio ha variado un 38,37 % en las últimas 24 horas y actualmente se sitúa en 0,00639 $. Analicemos los puntos clave y los posibles escenarios de trading.
📊 Indicadores clave:
Volumen de trading: En las últimas 24 horas, el volumen se disparó un 10.640 % y alcanzó los 172,07 millones de dólares, lo que indica una gran actividad en el mercado.
Situación técnica: El precio está poniendo a prueba un nivel de soporte significativo en 0,00663 $ (38,2 %), mientras que el máximo diario alcanzó los 0,00794 $.
RSI: Actualmente se encuentra en 59,82, lo que indica un sentimiento moderadamente alcista, sin llegar a niveles de sobrecompra.
🚦 Escenarios de trading:
📈 Al alza: Una ruptura por encima de la resistencia de 0,00794 $ podría abrir paso a un mayor movimiento alcista.
📉 Corrección: Mantener el soporte en 0,00663 $ es crucial para sostener la tendencia positiva, mientras que el nivel de 0,00622 $ (50 %) actúa como umbral crítico: caer por debajo invalidaría el escenario alcista.
🚀 Resumen del mercado cripto: ¿Qué está pasando con Threshold ($T )?
El token Threshold ($T T) muestra un impulso notable: su precio ha variado un 38,37 % en las últimas 24 horas y actualmente se sitúa en 0,00639 $. Analicemos los puntos clave y los posibles escenarios de trading.
📊 Indicadores clave:
Volumen de trading: En las últimas 24 horas, el volumen se disparó un 10.640 % y alcanzó los 172,07 millones de dólares, lo que indica una gran actividad en el mercado.
Situación técnica: El precio está poniendo a prueba un nivel de soporte significativo en 0,00663 $ (38,2 %), mientras que el máximo diario alcanzó los 0,00794 $.
RSI: Actualmente se encuentra en 59,82, lo que indica un sentimiento moderadamente alcista, sin llegar a niveles de sobrecompra.
🚦 Escenarios de trading:
📈 Al alza: Una ruptura por encima de la resistencia de 0,00794 $ podría abrir paso a un mayor movimiento alcista.
📉 Corrección: Mantener el soporte en 0,00663 $ es crucial para sostener la tendencia positiva, mientras que el nivel de 0,00622 $ (50 %) actúa como umbral crítico: caer por debajo invalidaría el escenario alcista.
1
1
377
#cryptotradingpro #bitcoin
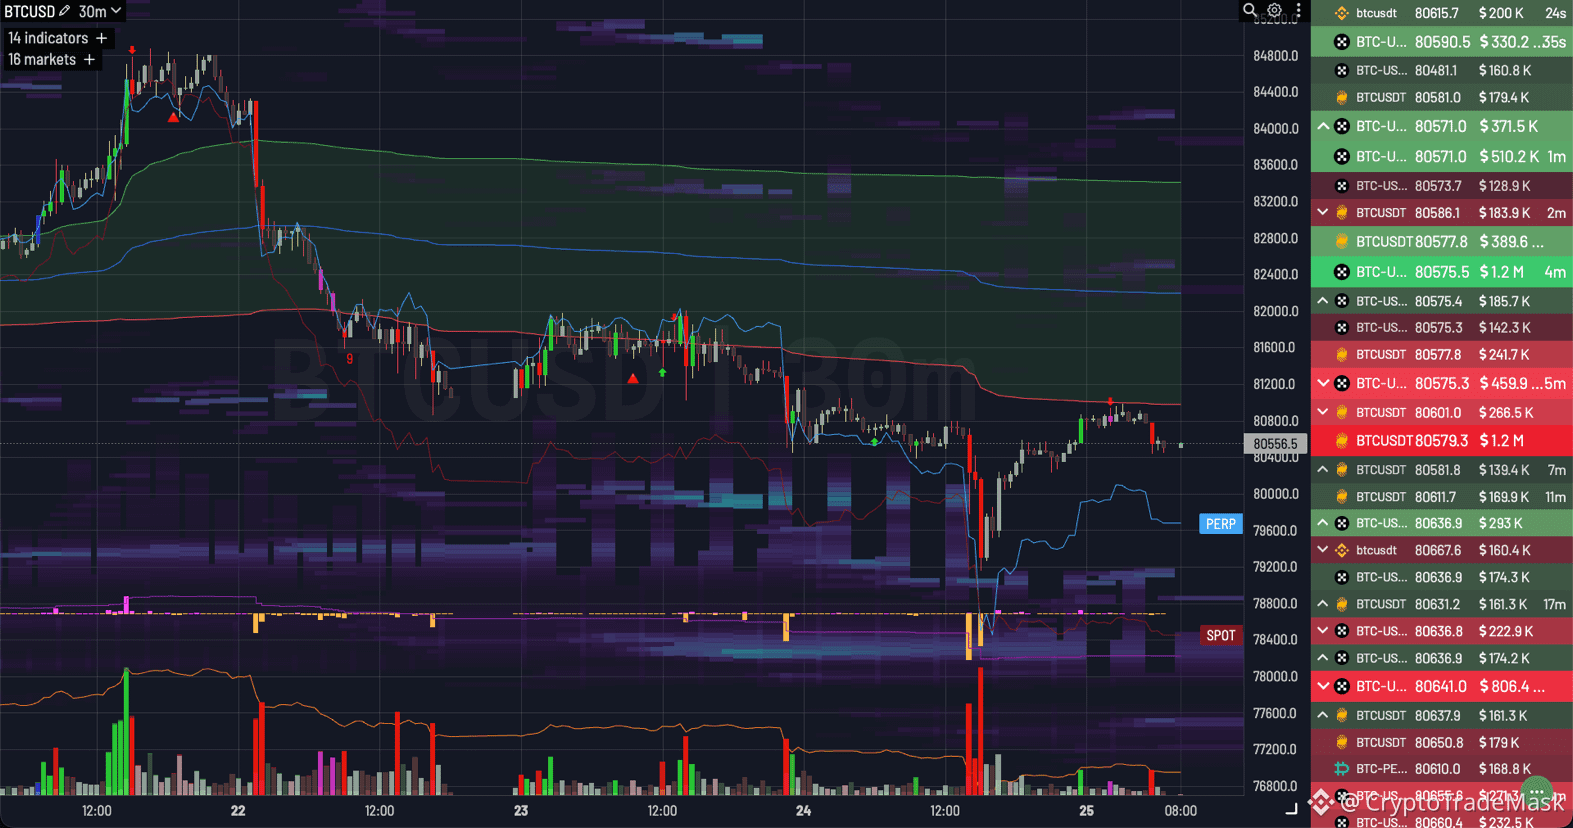
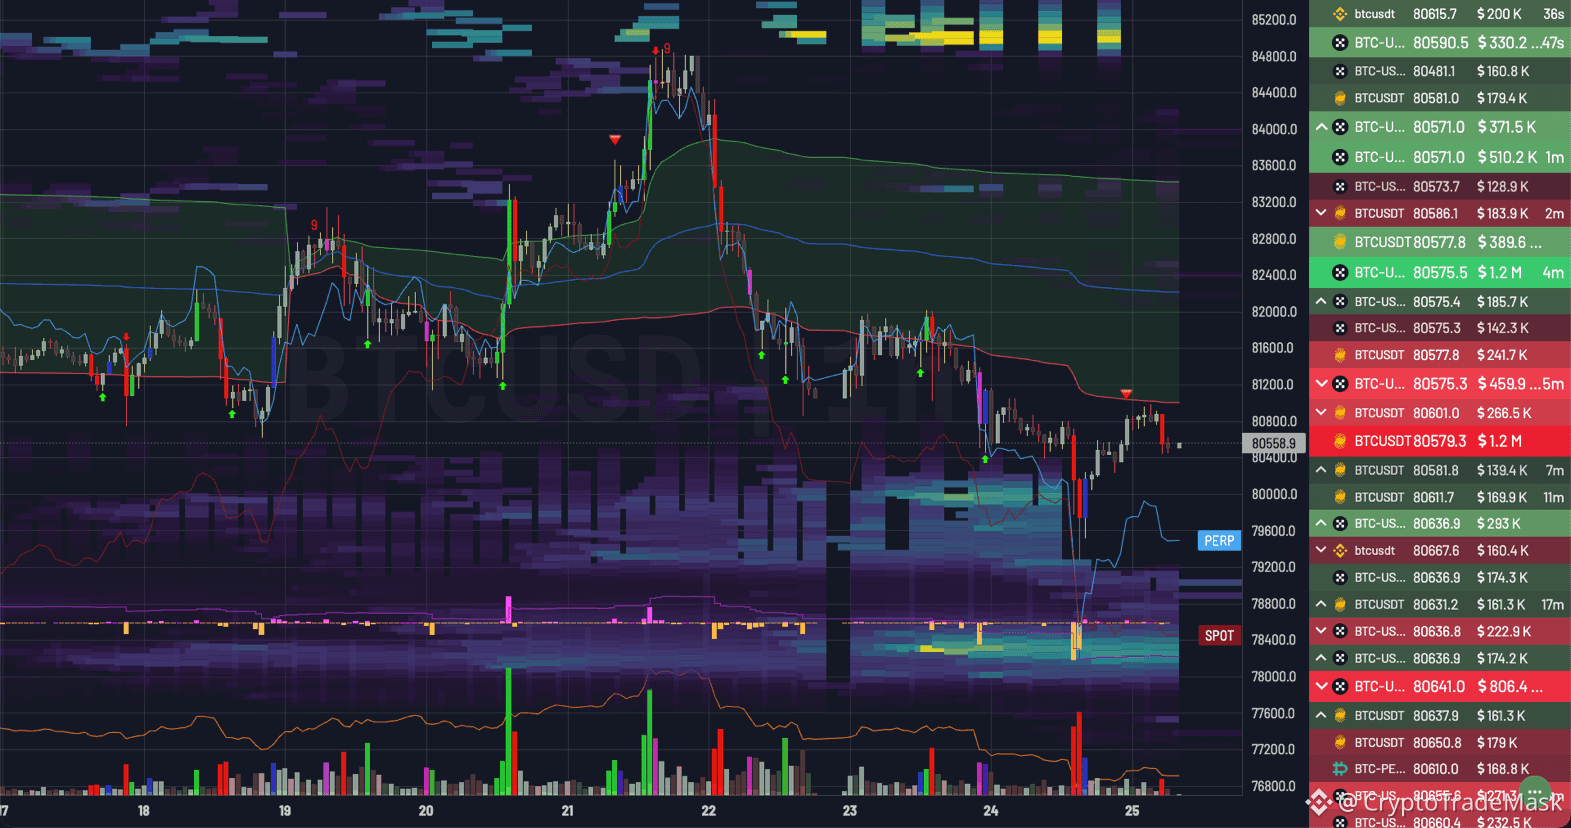
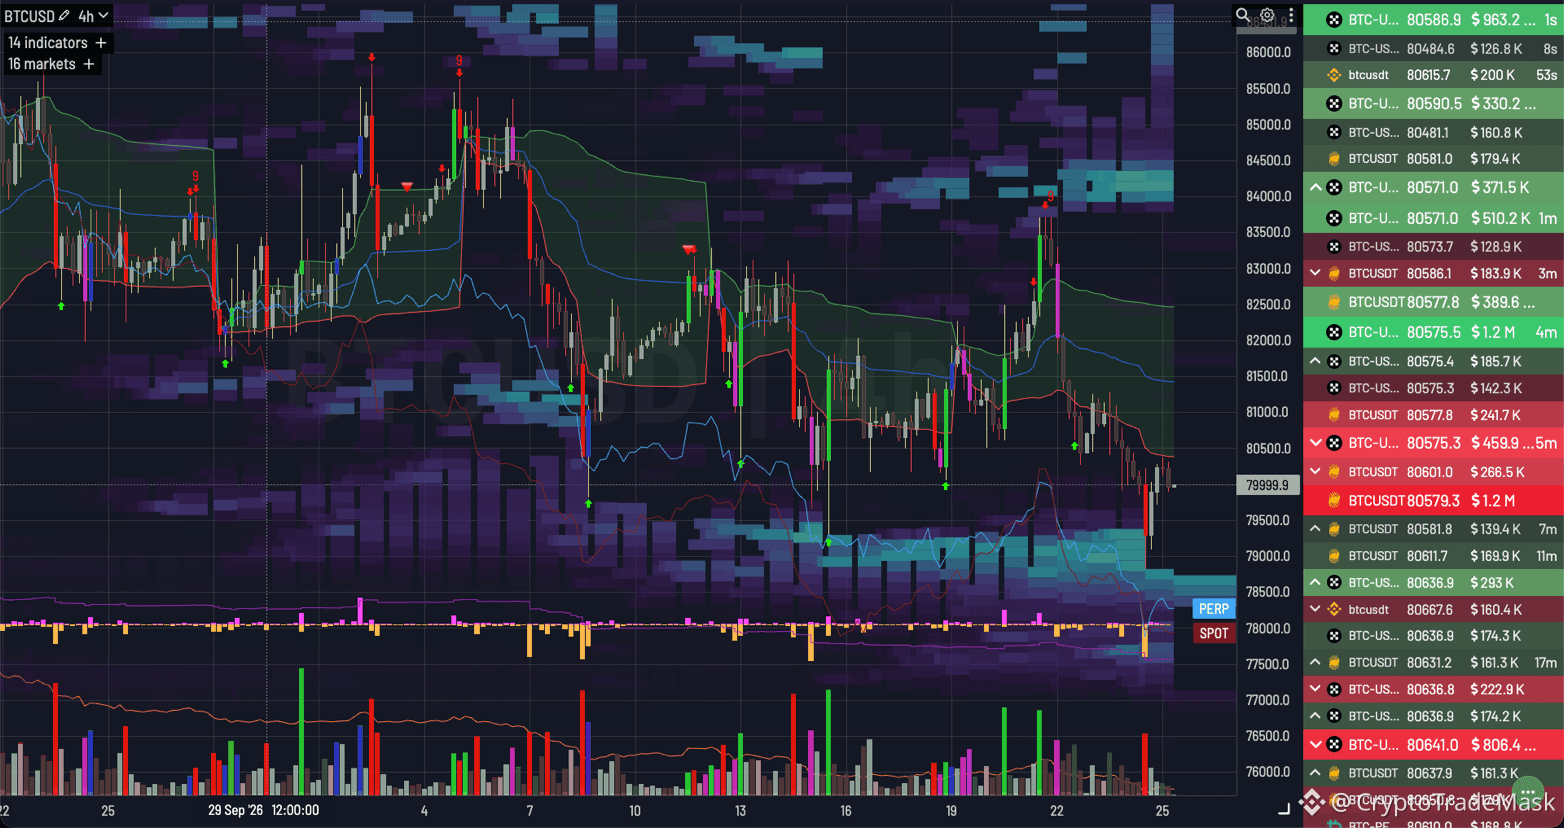
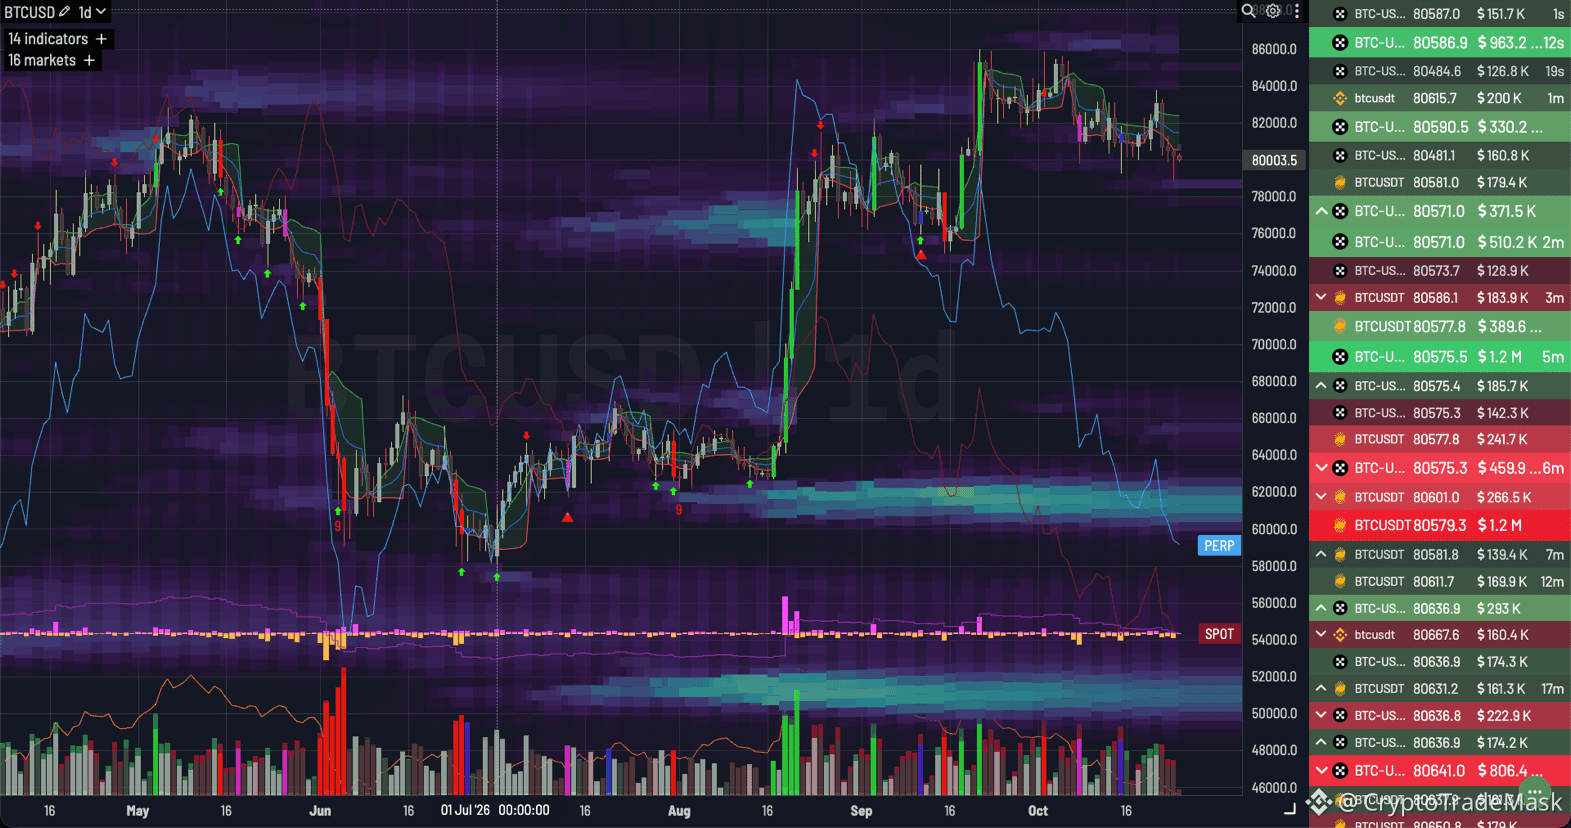
📉 $BTC /USD: Análisis técnico y situación actual del mercado
La principal criptomoneda sigue en una fase de corrección activa después de que su reciente impulso encontrara una fuerte resistencia en la zona por encima de los $85,000 – $86,000. Examinemos los niveles clave y los posibles escenarios a corto plazo:
➡️ Marcos temporales más amplios (1D / 4H): Tras una serie de máximos locales más bajos, la tendencia ha entrado en una fase correctiva. El precio ha caído por debajo de las medias móviles de corto plazo, lo que confirma la presión vendedora.
➡️ Dinámica local (30m): Una reciente caída brusca hasta el nivel de ~$79,000 estuvo acompañada de un aumento del volumen (liquidaciones de posiciones largas), seguida de una rápida recuperación que llevó el precio de nuevo al rango de $80,500.
📊 Niveles clave de soporte:
Soporte local: $79,500 – $80,000.
Zona principal de defensa de los compradores: $78,000.
Zonas de resistencia:
Barrera inmediata: $81,200 – $82,000.
Resistencia principal: $84,000 – $85,500.
⚠️ Conclusión: Mientras el precio se mantenga por debajo del nivel de $82,000, las perspectivas favorecen un movimiento lateral o una presión bajista local, con un posible nuevo test del soporte de $79,500. Una ruptura y consolidación por encima de $82,000 allanaría el camino para reanudar la tendencia alcista; sin embargo, dada la alta volatilidad, es fundamental respetar estrictamente la gestión del riesgo.
{future}(BTCUSDT)
#cryptotradingpro #bitcoin
📉 $BTC /USD: Análisis técnico y situación actual del mercado
La principal criptomoneda sigue en una fase de corrección activa después de que su reciente impulso encontrara una fuerte resistencia en la zona por encima de los $85,000 – $86,000. Examinemos los niveles clave y los posibles escenarios a corto plazo:
➡️ Marcos temporales más amplios (1D / 4H): Tras una serie de máximos locales más bajos, la tendencia ha entrado en una fase correctiva. El precio ha caído por debajo de las medias móviles de corto plazo, lo que confirma la presión vendedora.
➡️ Dinámica local (30m): Una reciente caída brusca hasta el nivel de ~$79,000 estuvo acompañada de un aumento del volumen (liquidaciones de posiciones largas), seguida de una rápida recuperación que llevó el precio de nuevo al rango de $80,500.
📊 Niveles clave de soporte:
Soporte local: $79,500 – $80,000.
Zona principal de defensa de los compradores: $78,000.
Zonas de resistencia:
Barrera inmediata: $81,200 – $82,000.
Resistencia principal: $84,000 – $85,500.
⚠️ Conclusión: Mientras el precio se mantenga por debajo del nivel de $82,000, las perspectivas favorecen un movimiento lateral o una presión bajista local, con un posible nuevo test del soporte de $79,500. Una ruptura y consolidación por encima de $82,000 allanaría el camino para reanudar la tendencia alcista; sin embargo, dada la alta volatilidad, es fundamental respetar estrictamente la gestión del riesgo.
📉 $BTC /USD: Análisis técnico y situación actual del mercado
La principal criptomoneda sigue en una fase de corrección activa después de que su reciente impulso encontrara una fuerte resistencia en la zona por encima de los $85,000 – $86,000. Examinemos los niveles clave y los posibles escenarios a corto plazo:
➡️ Marcos temporales más amplios (1D / 4H): Tras una serie de máximos locales más bajos, la tendencia ha entrado en una fase correctiva. El precio ha caído por debajo de las medias móviles de corto plazo, lo que confirma la presión vendedora.
➡️ Dinámica local (30m): Una reciente caída brusca hasta el nivel de ~$79,000 estuvo acompañada de un aumento del volumen (liquidaciones de posiciones largas), seguida de una rápida recuperación que llevó el precio de nuevo al rango de $80,500.
📊 Niveles clave de soporte:
Soporte local: $79,500 – $80,000.
Zona principal de defensa de los compradores: $78,000.
Zonas de resistencia:
Barrera inmediata: $81,200 – $82,000.
Resistencia principal: $84,000 – $85,500.
⚠️ Conclusión: Mientras el precio se mantenga por debajo del nivel de $82,000, las perspectivas favorecen un movimiento lateral o una presión bajista local, con un posible nuevo test del soporte de $79,500. Una ruptura y consolidación por encima de $82,000 allanaría el camino para reanudar la tendencia alcista; sin embargo, dada la alta volatilidad, es fundamental respetar estrictamente la gestión del riesgo.
92
#sui
🚀 $SUI Resumen del ecosistema: noticias destacadas de la semana
La red $SUI sigue captando la atención de la comunidad cripto y demostrando un fuerte impulso. Estos son tres acontecimientos clave de los últimos días:
1️⃣ Correlación con Bitcoin y resiliencia de SUI
En medio de una caída más amplia del mercado (el 23 de octubre, aproximadamente el 80 % de los activos registró pérdidas), SUI mostró una estabilidad relativa, con una caída de apenas un 5 %. Mientras tanto, una correlación de 0.71 con Bitcoin indica que, si bien el activo reacciona estrechamente a los movimientos generales del mercado, demuestra una mayor capacidad para mantenerse firme durante las correcciones.
2️⃣ Grayscale incorpora DATA Network a su fondo
Grayscale ha incluido el token DATA Network (DATA) en su fondo. Aunque el protocolo está vinculado a la transmisión de datos y a la inteligencia artificial, la integración de este tipo de activos en vehículos de inversión de nivel institucional amplía la base total de capital y mejora la liquidez de todo el ecosistema, incluidos los proyectos desarrollados sobre Sui.
3️⃣ Nuevas capacidades de Mysten Labs
El equipo de Mysten Labs —los desarrolladores de Sui— ha anunciado importantes mejoras técnicas y nuevas soluciones para el almacenamiento y procesamiento de datos (en particular, el desarrollo de un ecosistema en torno al protocolo Walrus). Esto fortalece los cimientos de la cadena de bloques y crea un entorno aún más favorable para los desarrolladores.
⚠️ Conclusión: A pesar de la volatilidad del mercado, $SUI mantiene una posición sólida, respaldada por las mejoras tecnológicas y el interés institucional.
{future}(SUIUSDT)
#sui
🚀 $SUI Resumen del ecosistema: noticias destacadas de la semana
La red $SUI sigue captando la atención de la comunidad cripto y demostrando un fuerte impulso. Estos son tres acontecimientos clave de los últimos días:
1️⃣ Correlación con Bitcoin y resiliencia de SUI
En medio de una caída más amplia del mercado (el 23 de octubre, aproximadamente el 80 % de los activos registró pérdidas), SUI mostró una estabilidad relativa, con una caída de apenas un 5 %. Mientras tanto, una correlación de 0.71 con Bitcoin indica que, si bien el activo reacciona estrechamente a los movimientos generales del mercado, demuestra una mayor capacidad para mantenerse firme durante las correcciones.
2️⃣ Grayscale incorpora DATA Network a su fondo
Grayscale ha incluido el token DATA Network (DATA) en su fondo. Aunque el protocolo está vinculado a la transmisión de datos y a la inteligencia artificial, la integración de este tipo de activos en vehículos de inversión de nivel institucional amplía la base total de capital y mejora la liquidez de todo el ecosistema, incluidos los proyectos desarrollados sobre Sui.
3️⃣ Nuevas capacidades de Mysten Labs
El equipo de Mysten Labs —los desarrolladores de Sui— ha anunciado importantes mejoras técnicas y nuevas soluciones para el almacenamiento y procesamiento de datos (en particular, el desarrollo de un ecosistema en torno al protocolo Walrus). Esto fortalece los cimientos de la cadena de bloques y crea un entorno aún más favorable para los desarrolladores.
⚠️ Conclusión: A pesar de la volatilidad del mercado, $SUI mantiene una posición sólida, respaldada por las mejoras tecnológicas y el interés institucional.
🚀 $SUI Resumen del ecosistema: noticias destacadas de la semana
La red $SUI sigue captando la atención de la comunidad cripto y demostrando un fuerte impulso. Estos son tres acontecimientos clave de los últimos días:
1️⃣ Correlación con Bitcoin y resiliencia de SUI
En medio de una caída más amplia del mercado (el 23 de octubre, aproximadamente el 80 % de los activos registró pérdidas), SUI mostró una estabilidad relativa, con una caída de apenas un 5 %. Mientras tanto, una correlación de 0.71 con Bitcoin indica que, si bien el activo reacciona estrechamente a los movimientos generales del mercado, demuestra una mayor capacidad para mantenerse firme durante las correcciones.
2️⃣ Grayscale incorpora DATA Network a su fondo
Grayscale ha incluido el token DATA Network (DATA) en su fondo. Aunque el protocolo está vinculado a la transmisión de datos y a la inteligencia artificial, la integración de este tipo de activos en vehículos de inversión de nivel institucional amplía la base total de capital y mejora la liquidez de todo el ecosistema, incluidos los proyectos desarrollados sobre Sui.
3️⃣ Nuevas capacidades de Mysten Labs
El equipo de Mysten Labs —los desarrolladores de Sui— ha anunciado importantes mejoras técnicas y nuevas soluciones para el almacenamiento y procesamiento de datos (en particular, el desarrollo de un ecosistema en torno al protocolo Walrus). Esto fortalece los cimientos de la cadena de bloques y crea un entorno aún más favorable para los desarrolladores.
⚠️ Conclusión: A pesar de la volatilidad del mercado, $SUI mantiene una posición sólida, respaldada por las mejoras tecnológicas y el interés institucional.

2
95
#Liquidations
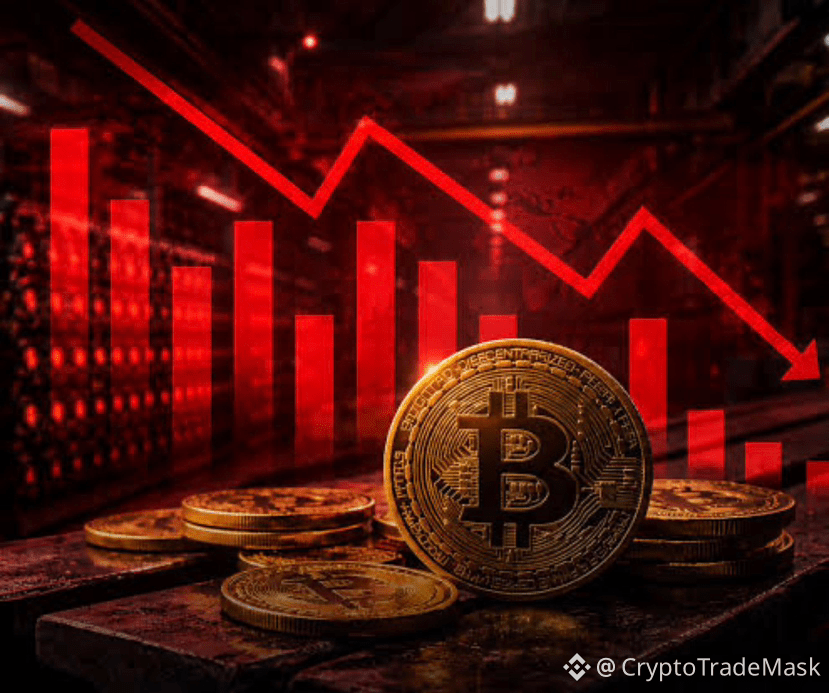
🔴 Más de 400 millones de dólares en liquidaciones en 4 horas: Bitcoin cayó brevemente por debajo de los 80.000 dólares
📉 Fue una mañana de sábado intensa en el mercado cripto: una fuerte caída de BTC desencadenó una ola de liquidaciones masivas de posiciones alcistas. Estas son las cifras y los acontecimientos clave de la última actualización:
➡️ Magnitud de las pérdidas: En un período de 4 horas (hasta la 1:00 p. m., hora del Este), se liquidaron 436,44 millones de dólares en los exchanges, de los cuales 404,15 millones correspondieron a posiciones largas. A lo largo del día, más de 201.000 traders se vieron afectados y las liquidaciones totales superaron los 815 millones de dólares.
➡️ Fuertes golpes: Dos poderosas olas sacudieron el mercado: a las 10:15 a. m. (208 millones de dólares en liquidaciones en 15 minutos, cuando BTC cayó a 80.100 dólares) y a las 11:15 a. m. (131 millones de dólares). En su punto más bajo, Bitcoin cayó hasta aproximadamente 79.280 dólares antes de recuperarse por encima de los 80.000.
➡️ Ether también sufre un golpe: Aunque la capitalización de mercado de ETH representa apenas alrededor del 18 % de la de Bitcoin, Ether registró 136,72 millones de dólares en liquidaciones, casi tanto como BTC (158,45 millones). Las posiciones largas representaron el 94,2 % de las liquidaciones de Bitcoin y el 92,7 % de las de Ether.
➡️ Salidas de ETF: Los ETF de Bitcoin al contado de EE. UU. cerraron el viernes con una salida neta de 137,94 millones de dólares (a la que contribuyó notablemente el fondo IBIT de BlackRock). Este es el segundo día consecutivo de salidas, tras una salida de 635 millones de dólares el jueves.
➡️ Arthur Hayes lo vende todo: El cofundador de BitMEX anunció en las redes sociales que cerró todas las posiciones direccionales de su fondo («Lo vendí todo»), asegurando ganancias en $ETH , $ENA , $UNI y otras altcoins. La razón citada son noticias macroeconómicas y geopolíticas preocupantes; en concreto, la reducción del personal de las embajadas estadounidenses en Oriente Medio debido a las amenazas de Irán.
{future}(UNIUSDT)
{future}(ENAUSDT)
{future}(ETHUSDT)
#Liquidations
🔴 Más de 400 millones de dólares en liquidaciones en 4 horas: Bitcoin cayó brevemente por debajo de los 80.000 dólares
📉 Fue una mañana de sábado intensa en el mercado cripto: una fuerte caída de BTC desencadenó una ola de liquidaciones masivas de posiciones alcistas. Estas son las cifras y los acontecimientos clave de la última actualización:
➡️ Magnitud de las pérdidas: En un período de 4 horas (hasta la 1:00 p. m., hora del Este), se liquidaron 436,44 millones de dólares en los exchanges, de los cuales 404,15 millones correspondieron a posiciones largas. A lo largo del día, más de 201.000 traders se vieron afectados y las liquidaciones totales superaron los 815 millones de dólares.
➡️ Fuertes golpes: Dos poderosas olas sacudieron el mercado: a las 10:15 a. m. (208 millones de dólares en liquidaciones en 15 minutos, cuando BTC cayó a 80.100 dólares) y a las 11:15 a. m. (131 millones de dólares). En su punto más bajo, Bitcoin cayó hasta aproximadamente 79.280 dólares antes de recuperarse por encima de los 80.000.
➡️ Ether también sufre un golpe: Aunque la capitalización de mercado de ETH representa apenas alrededor del 18 % de la de Bitcoin, Ether registró 136,72 millones de dólares en liquidaciones, casi tanto como BTC (158,45 millones). Las posiciones largas representaron el 94,2 % de las liquidaciones de Bitcoin y el 92,7 % de las de Ether.
➡️ Salidas de ETF: Los ETF de Bitcoin al contado de EE. UU. cerraron el viernes con una salida neta de 137,94 millones de dólares (a la que contribuyó notablemente el fondo IBIT de BlackRock). Este es el segundo día consecutivo de salidas, tras una salida de 635 millones de dólares el jueves.
➡️ Arthur Hayes lo vende todo: El cofundador de BitMEX anunció en las redes sociales que cerró todas las posiciones direccionales de su fondo («Lo vendí todo»), asegurando ganancias en $ETH , $ENA , $UNI y otras altcoins. La razón citada son noticias macroeconómicas y geopolíticas preocupantes; en concreto, la reducción del personal de las embajadas estadounidenses en Oriente Medio debido a las amenazas de Irán.
🔴 Más de 400 millones de dólares en liquidaciones en 4 horas: Bitcoin cayó brevemente por debajo de los 80.000 dólares
📉 Fue una mañana de sábado intensa en el mercado cripto: una fuerte caída de BTC desencadenó una ola de liquidaciones masivas de posiciones alcistas. Estas son las cifras y los acontecimientos clave de la última actualización:
➡️ Magnitud de las pérdidas: En un período de 4 horas (hasta la 1:00 p. m., hora del Este), se liquidaron 436,44 millones de dólares en los exchanges, de los cuales 404,15 millones correspondieron a posiciones largas. A lo largo del día, más de 201.000 traders se vieron afectados y las liquidaciones totales superaron los 815 millones de dólares.
➡️ Fuertes golpes: Dos poderosas olas sacudieron el mercado: a las 10:15 a. m. (208 millones de dólares en liquidaciones en 15 minutos, cuando BTC cayó a 80.100 dólares) y a las 11:15 a. m. (131 millones de dólares). En su punto más bajo, Bitcoin cayó hasta aproximadamente 79.280 dólares antes de recuperarse por encima de los 80.000.
➡️ Ether también sufre un golpe: Aunque la capitalización de mercado de ETH representa apenas alrededor del 18 % de la de Bitcoin, Ether registró 136,72 millones de dólares en liquidaciones, casi tanto como BTC (158,45 millones). Las posiciones largas representaron el 94,2 % de las liquidaciones de Bitcoin y el 92,7 % de las de Ether.
➡️ Salidas de ETF: Los ETF de Bitcoin al contado de EE. UU. cerraron el viernes con una salida neta de 137,94 millones de dólares (a la que contribuyó notablemente el fondo IBIT de BlackRock). Este es el segundo día consecutivo de salidas, tras una salida de 635 millones de dólares el jueves.
➡️ Arthur Hayes lo vende todo: El cofundador de BitMEX anunció en las redes sociales que cerró todas las posiciones direccionales de su fondo («Lo vendí todo»), asegurando ganancias en $ETH , $ENA , $UNI y otras altcoins. La razón citada son noticias macroeconómicas y geopolíticas preocupantes; en concreto, la reducción del personal de las embajadas estadounidenses en Oriente Medio debido a las amenazas de Irán.
1
48
#dodo
📈 ¿Qué está ocurriendo en el mercado de las criptomonedas? Noticias y novedades clave sobre $DODO
En las últimas 24 horas, el mercado ha mostrado un movimiento moderado: Bitcoin ha subido un 1,56 %, mientras que el token $DODO ha aumentado un 3,47 % y cotiza actualmente a 0,0221 $. Estos son algunos de los acontecimientos más destacados:
➡️ Mayor actividad: Se ha observado un aumento significativo del volumen de operaciones y del interés de los inversores en determinados activos.
➡️ Actualizaciones técnicas: El equipo del proyecto sigue implementando mejoras para optimizar la plataforma y aumentar su eficiencia.
➡️ Perspectivas del mercado: La resistencia actual de DODO se sitúa en 0,0235 $, mientras que el soporte clave se mantiene cerca de 0,0215 $ (o 0,020 $). Además, el día 28 es una fecha importante para el mercado.
{spot}(DODOUSDT)
#dodo
📈 ¿Qué está ocurriendo en el mercado de las criptomonedas? Noticias y novedades clave sobre $DODO
En las últimas 24 horas, el mercado ha mostrado un movimiento moderado: Bitcoin ha subido un 1,56 %, mientras que el token $DODO ha aumentado un 3,47 % y cotiza actualmente a 0,0221 $. Estos son algunos de los acontecimientos más destacados:
➡️ Mayor actividad: Se ha observado un aumento significativo del volumen de operaciones y del interés de los inversores en determinados activos.
➡️ Actualizaciones técnicas: El equipo del proyecto sigue implementando mejoras para optimizar la plataforma y aumentar su eficiencia.
➡️ Perspectivas del mercado: La resistencia actual de DODO se sitúa en 0,0235 $, mientras que el soporte clave se mantiene cerca de 0,0215 $ (o 0,020 $). Además, el día 28 es una fecha importante para el mercado.
📈 ¿Qué está ocurriendo en el mercado de las criptomonedas? Noticias y novedades clave sobre $DODO
En las últimas 24 horas, el mercado ha mostrado un movimiento moderado: Bitcoin ha subido un 1,56 %, mientras que el token $DODO ha aumentado un 3,47 % y cotiza actualmente a 0,0221 $. Estos son algunos de los acontecimientos más destacados:
➡️ Mayor actividad: Se ha observado un aumento significativo del volumen de operaciones y del interés de los inversores en determinados activos.
➡️ Actualizaciones técnicas: El equipo del proyecto sigue implementando mejoras para optimizar la plataforma y aumentar su eficiencia.
➡️ Perspectivas del mercado: La resistencia actual de DODO se sitúa en 0,0235 $, mientras que el soporte clave se mantiene cerca de 0,0215 $ (o 0,020 $). Además, el día 28 es una fecha importante para el mercado.
2
224
Inicia sesión para explorar más contenidos
Únete a usuarios globales de criptomonedas en Binance Square
⚡️ Obtén información útil y actualizada sobre criptos.
💬 Avalado por el mayor exchange de criptomonedas en el mundo.
👍 Descubre perspectivas reales de creadores verificados.
Email/número de teléfono
Temas populares
BinancePick
2.7M vistas
143,238 están debatiendo
¡Únete a #TemporadaDeResultados: predice resultados en Binance Pick y comparte tu opinión en Binance Square!
Binance Square Official
·402 me gusta
·338.9k vistas
EarningsSeason
5M vistas
24,569 están debatiendo
SouthKoreaReportedlyWeighsFourthCryptoTaxDelay
689 vistas
64 están debatiendo