

Huutruong
10.4k Publicaciones

Huutruong
Denunciar
Bloquear usuario
💰 Theo dõi Crypto | Tìm kiếm cơ hội mỗi ngày ( KITE-277880 )
Abrir trade
Traders de alta frecuencia
5.5 año(s)
3.6K+ Siguiendo
2.4K+ Seguidores
846 Me gusta
Publicaciones
Cartera
Todo
Citas
Videos
Live
·
--
Bajista
Ver traducción
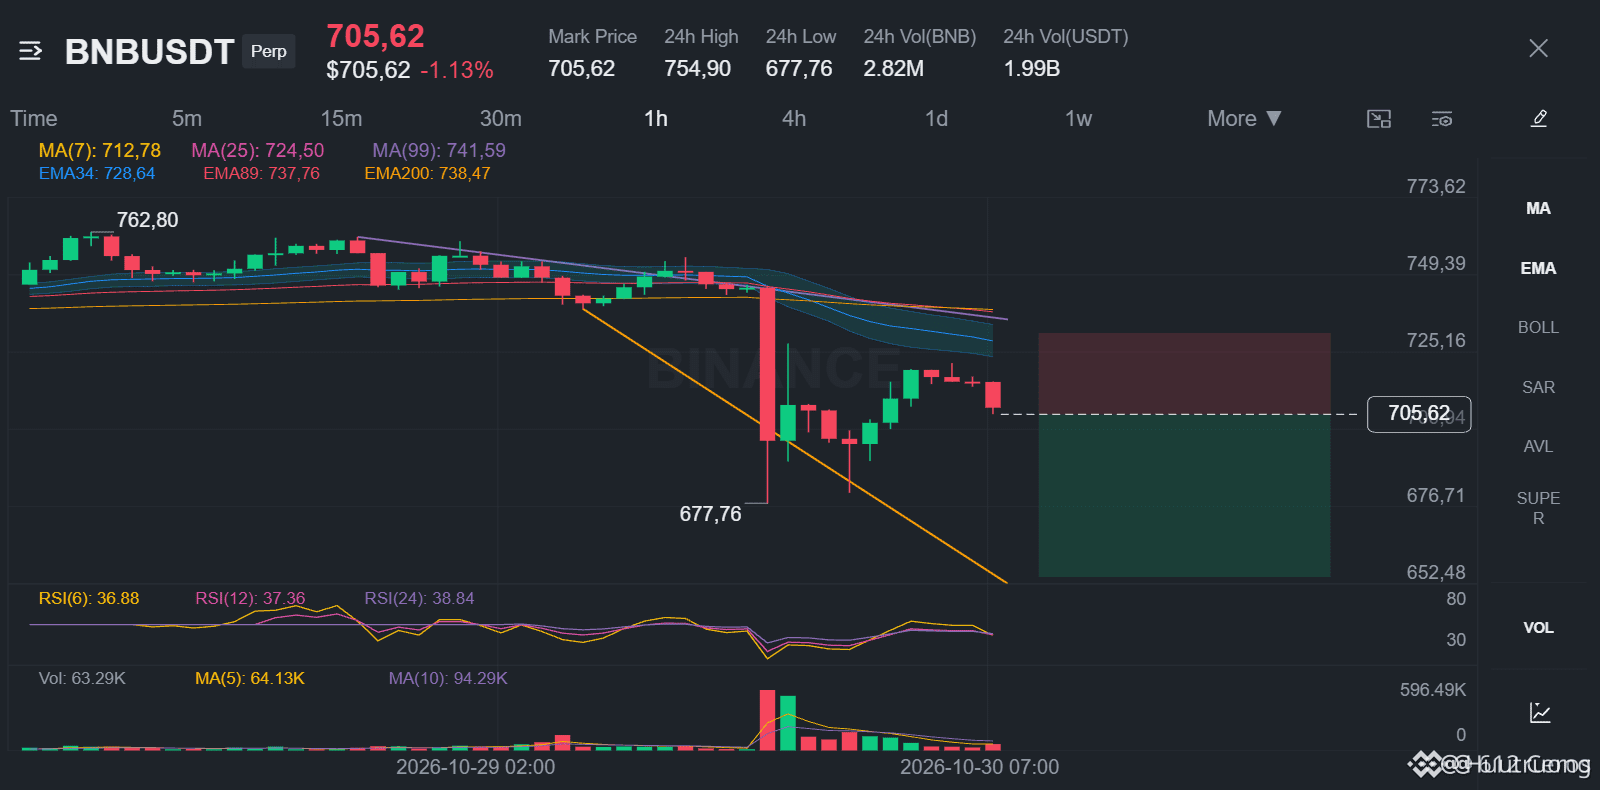
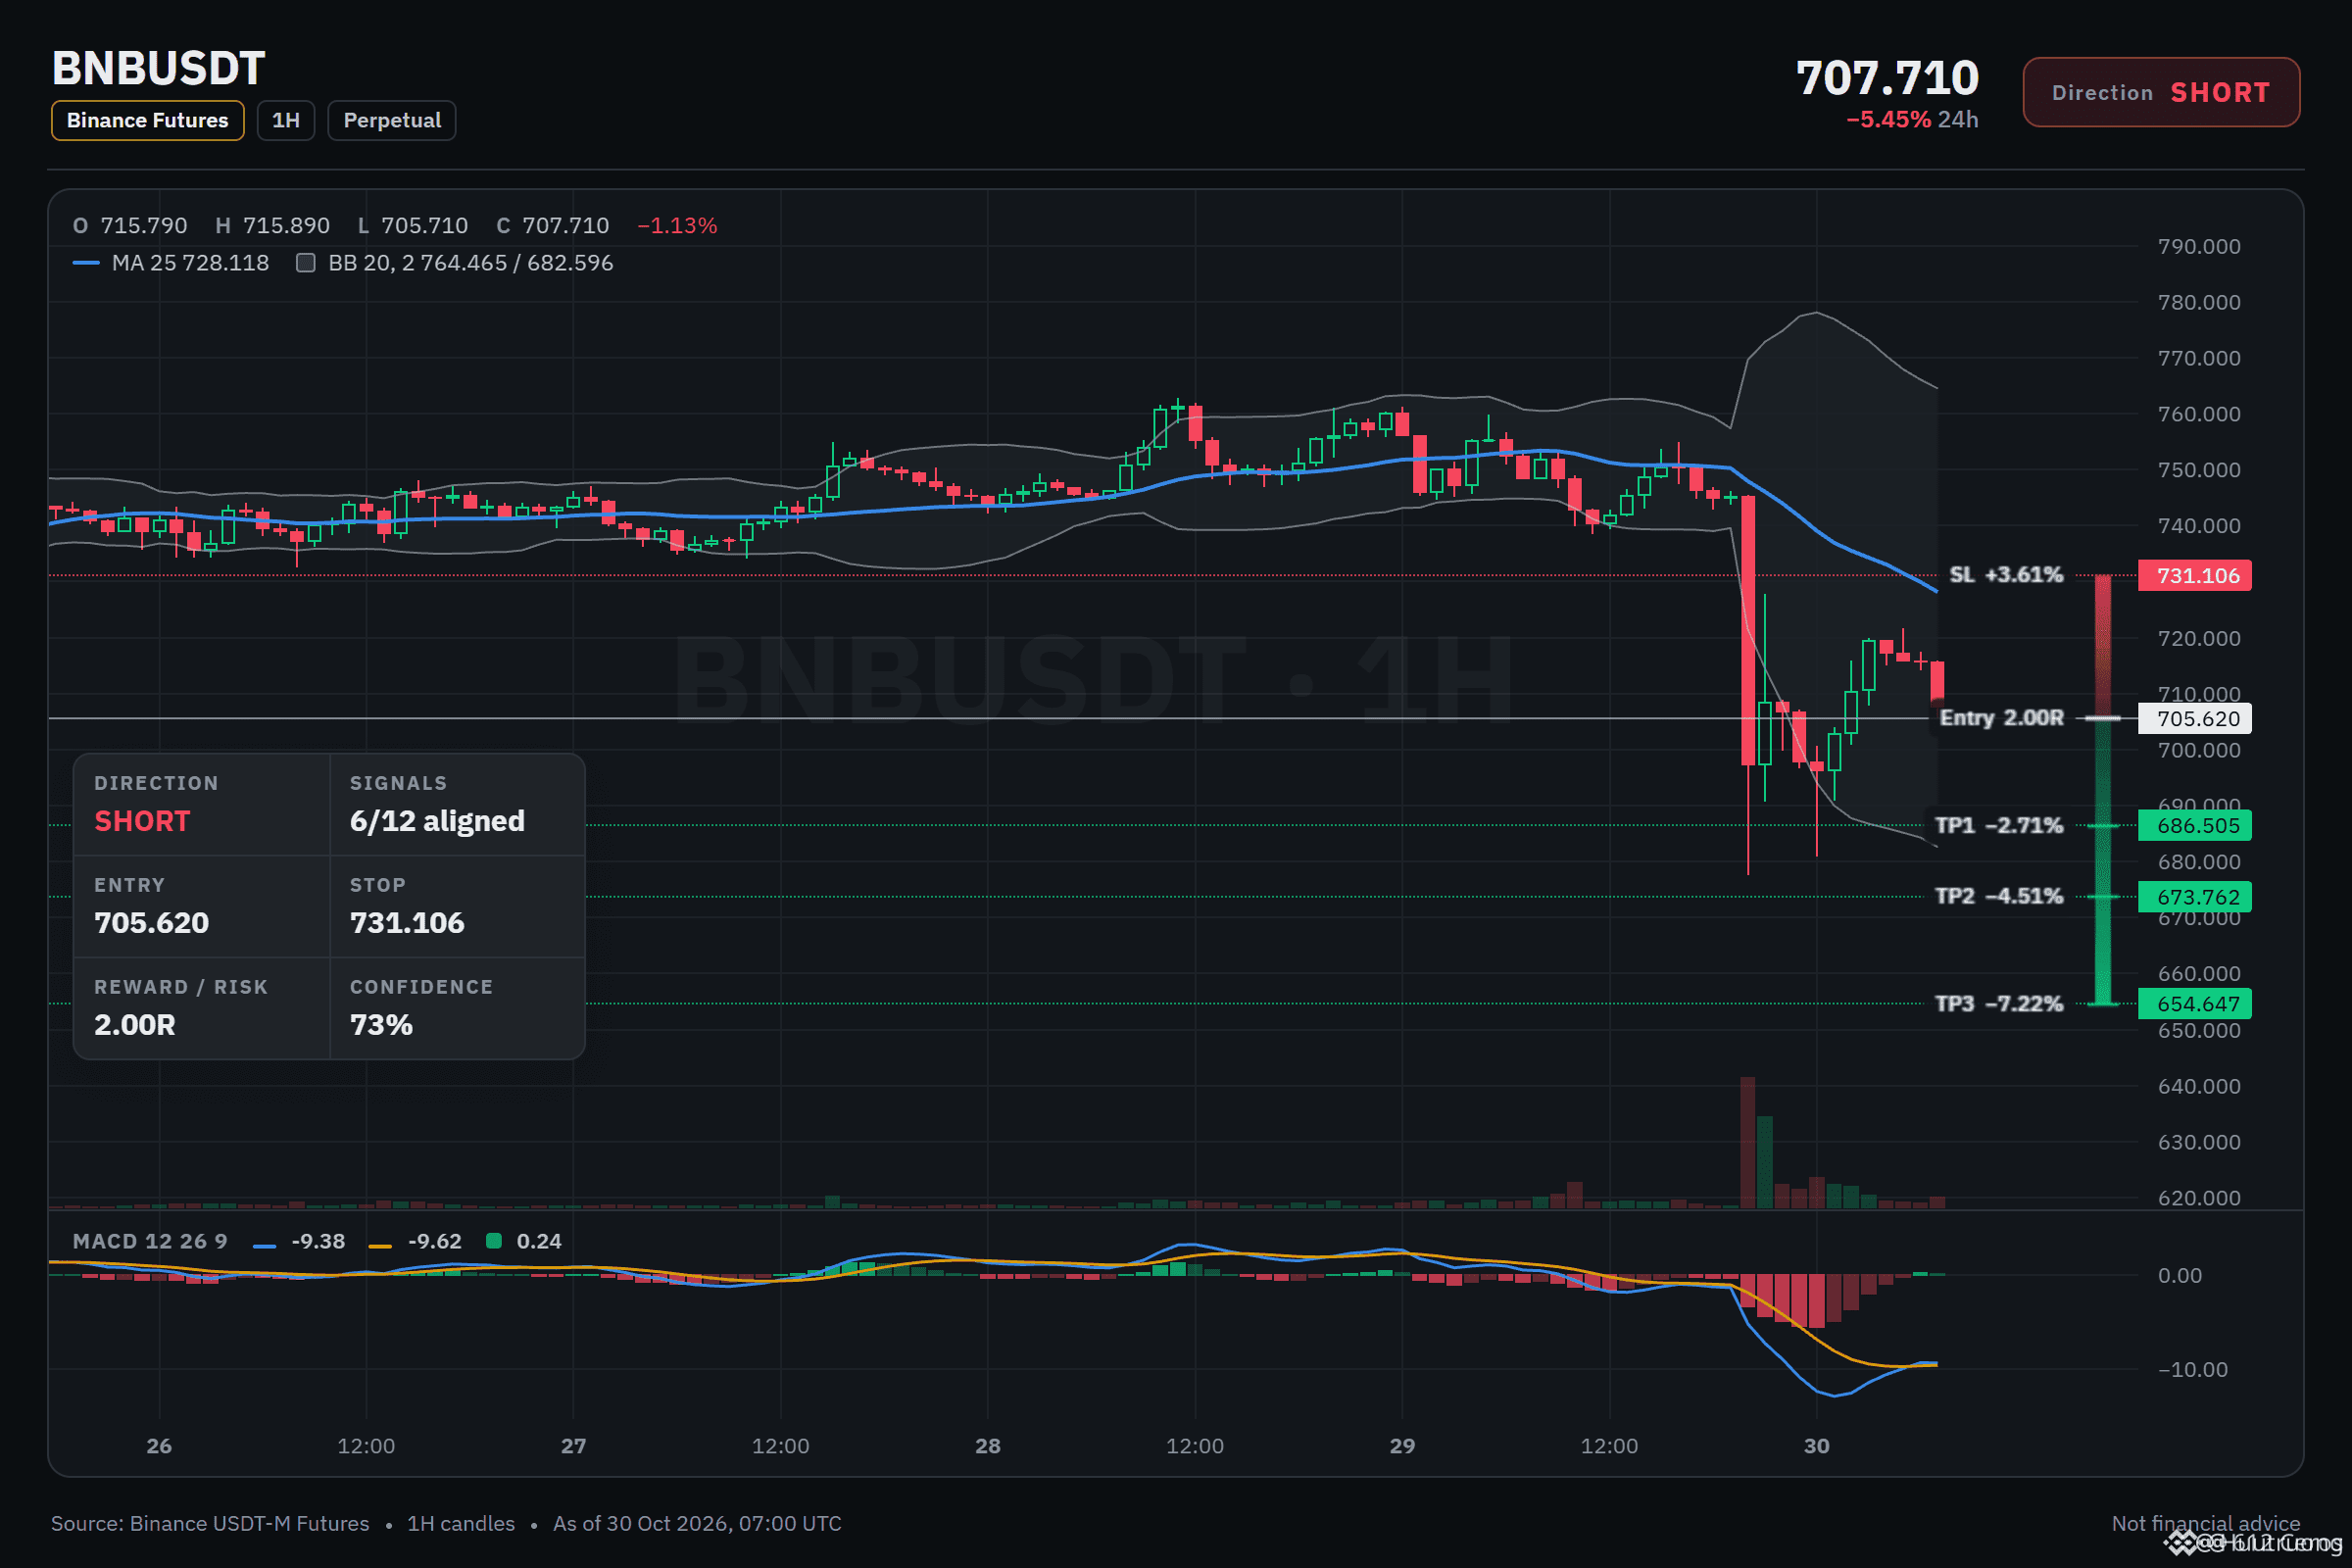
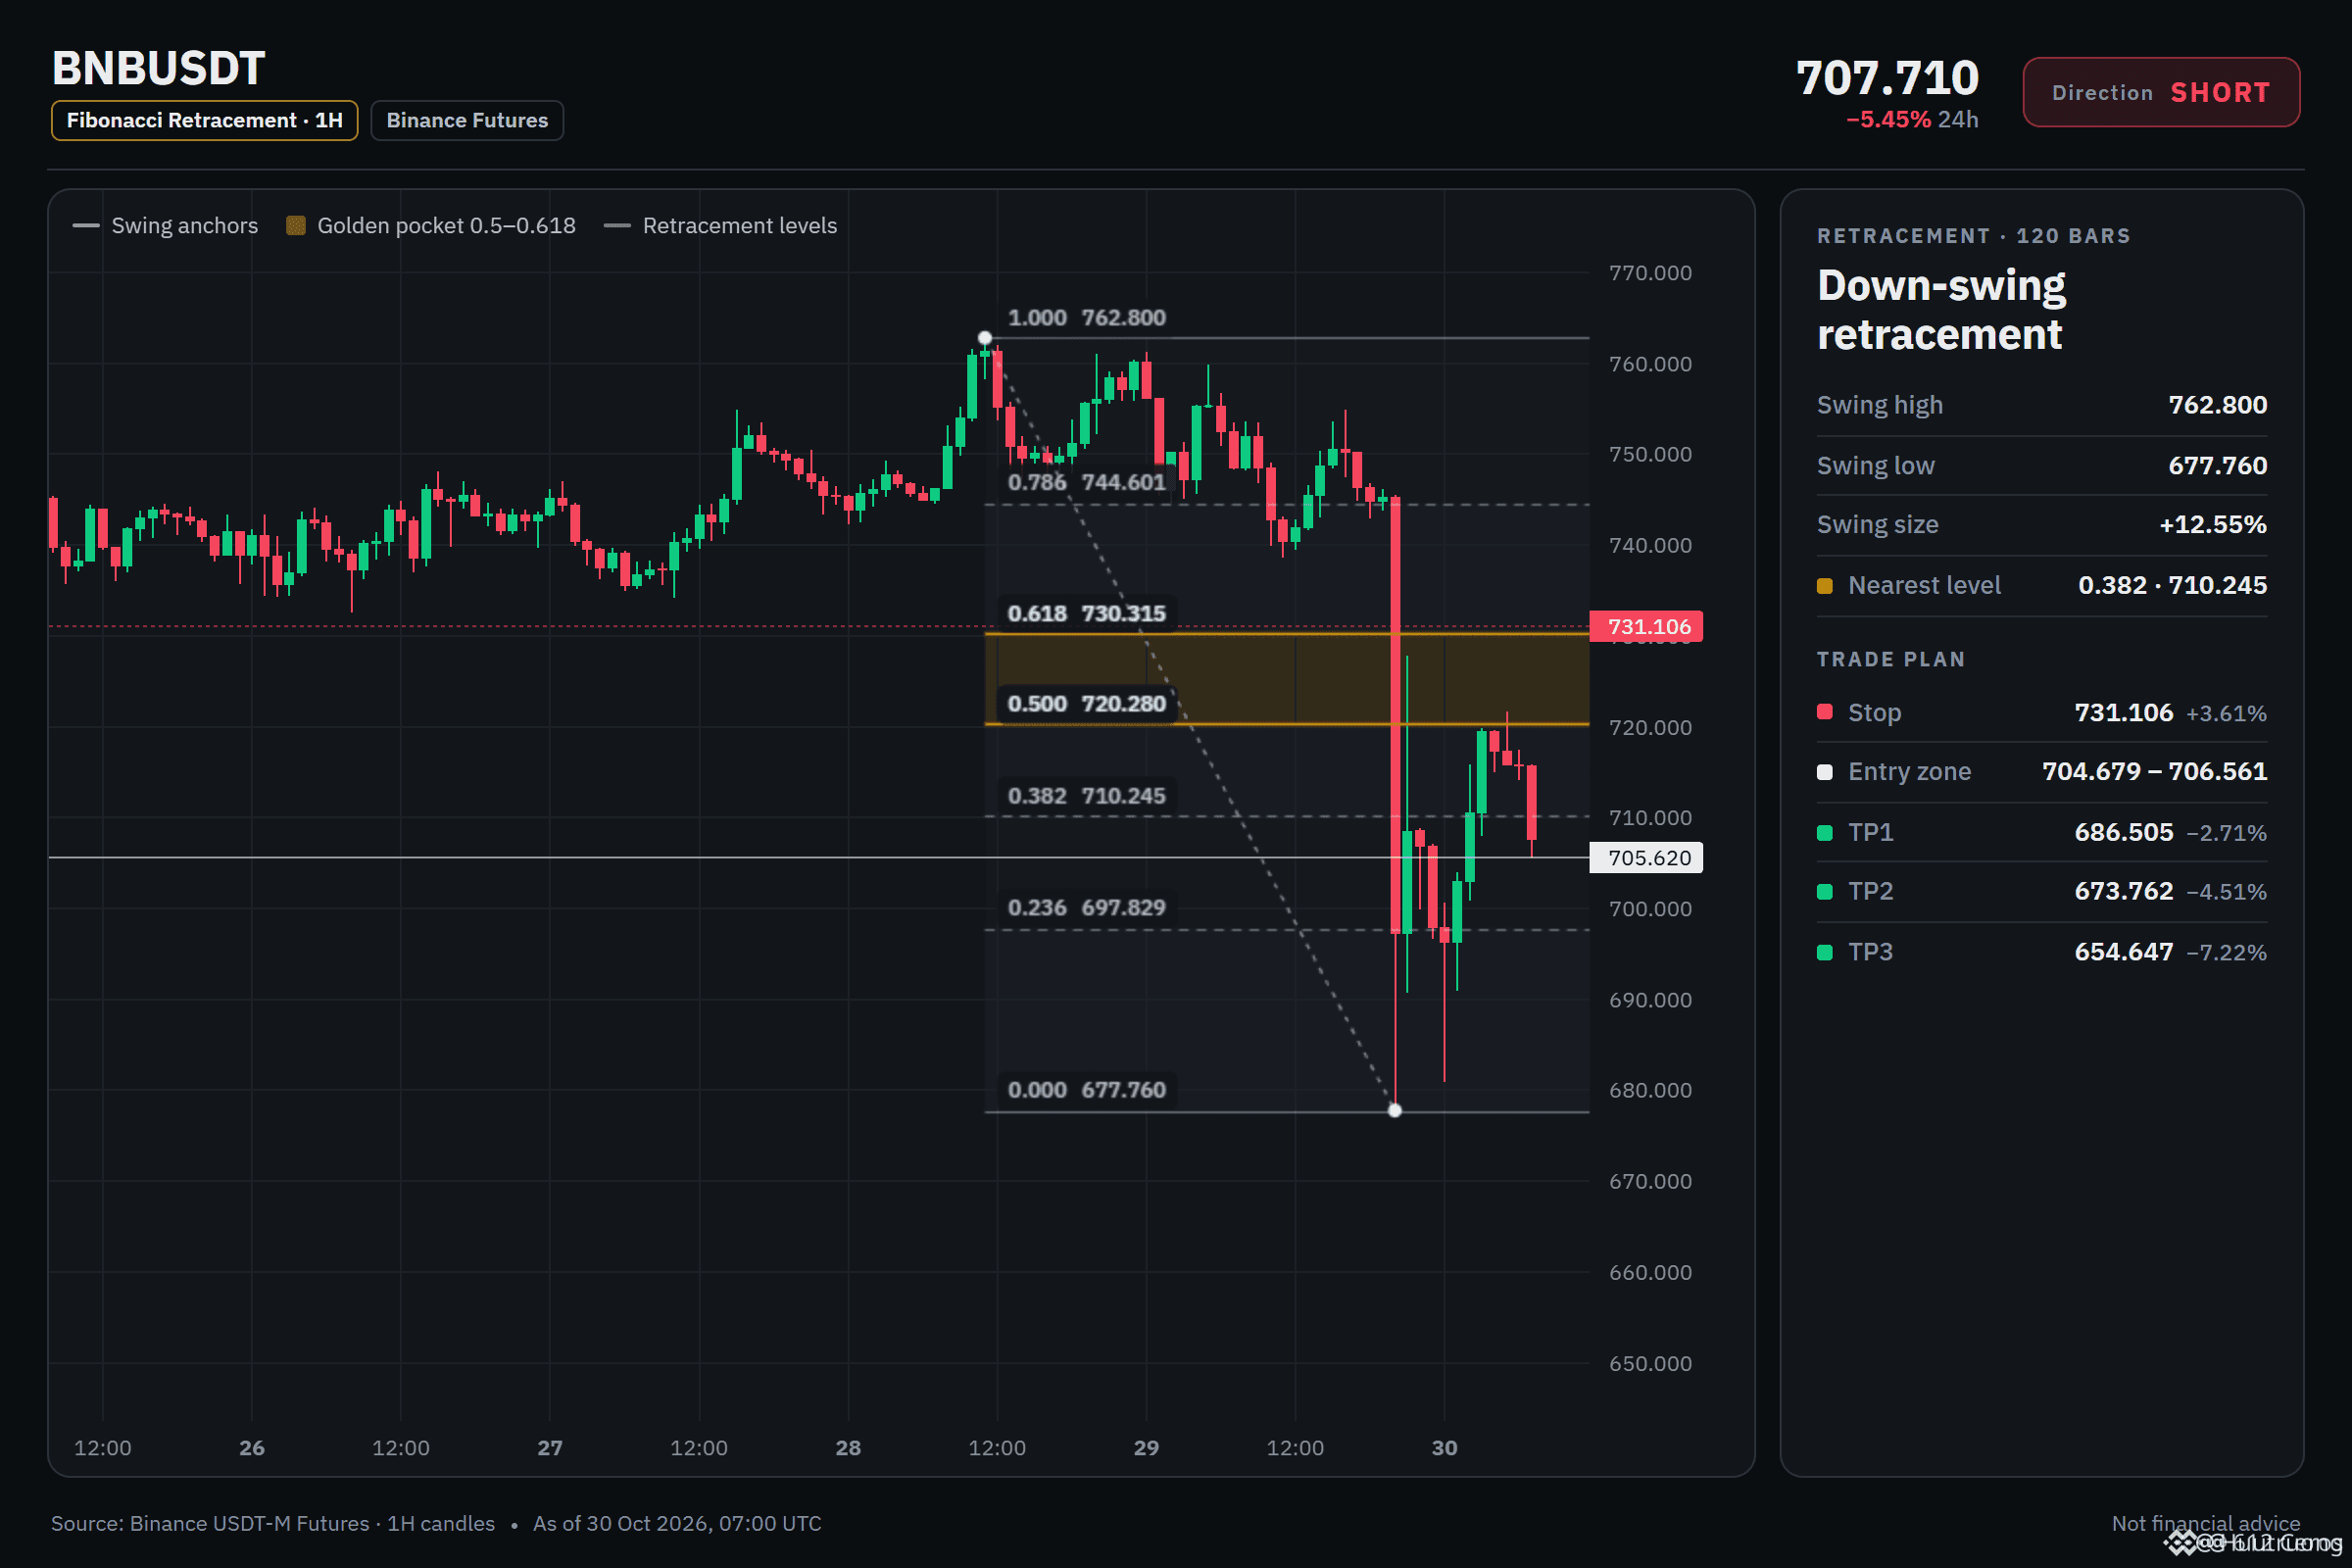
BNB keeps stacking bearish candles below both EMAs.
🔴 SHORT $BNB /USDT: expecting price to go DOWN
Bias: SHORT · Strong
Entry: 704.679 – 706.561
TP1: 686.505 (-2.7%)
TP2: 673.762 (-4.5%)
TP3: 654.647 (-7.2%)
SL: 731.106 (+3.6%)
Plan: enter only inside the zone, close 50% at TP1, 25% at TP2, 25% at TP3, and move the stop to entry after TP1.
Why SHORT? What I checked: 6/12 agree, 0 against.
• 4h trend down (below EMA50 & EMA200)
• 1h trend down (below EMA50 & EMA200)
• BTC is falling, this coin follows (corr 0.85)
Watch: The idea is wrong if price reaches the stop at 731.106
Bottom line: The 4h bearish stack shows the swing trend is down, but the daily trend is a range so the big picture is unclear.
Where would you place your stop on this setup?
BNB keeps stacking bearish candles below both EMAs.
🔴 SHORT $BNB /USDT: expecting price to go DOWN
Bias: SHORT · Strong
Entry: 704.679 – 706.561
TP1: 686.505 (-2.7%)
TP2: 673.762 (-4.5%)
TP3: 654.647 (-7.2%)
SL: 731.106 (+3.6%)
Plan: enter only inside the zone, close 50% at TP1, 25% at TP2, 25% at TP3, and move the stop to entry after TP1.
Why SHORT? What I checked: 6/12 agree, 0 against.
• 4h trend down (below EMA50 & EMA200)
• 1h trend down (below EMA50 & EMA200)
• BTC is falling, this coin follows (corr 0.85)
Watch: The idea is wrong if price reaches the stop at 731.106
Bottom line: The 4h bearish stack shows the swing trend is down, but the daily trend is a range so the big picture is unclear.
Where would you place your stop on this setup?
🔴 SHORT $BNB /USDT: expecting price to go DOWN
Bias: SHORT · Strong
Entry: 704.679 – 706.561
TP1: 686.505 (-2.7%)
TP2: 673.762 (-4.5%)
TP3: 654.647 (-7.2%)
SL: 731.106 (+3.6%)
Plan: enter only inside the zone, close 50% at TP1, 25% at TP2, 25% at TP3, and move the stop to entry after TP1.
Why SHORT? What I checked: 6/12 agree, 0 against.
• 4h trend down (below EMA50 & EMA200)
• 1h trend down (below EMA50 & EMA200)
• BTC is falling, this coin follows (corr 0.85)
Watch: The idea is wrong if price reaches the stop at 731.106
Bottom line: The 4h bearish stack shows the swing trend is down, but the daily trend is a range so the big picture is unclear.
Where would you place your stop on this setup?
7
·
--
Bajista
Ver traducción
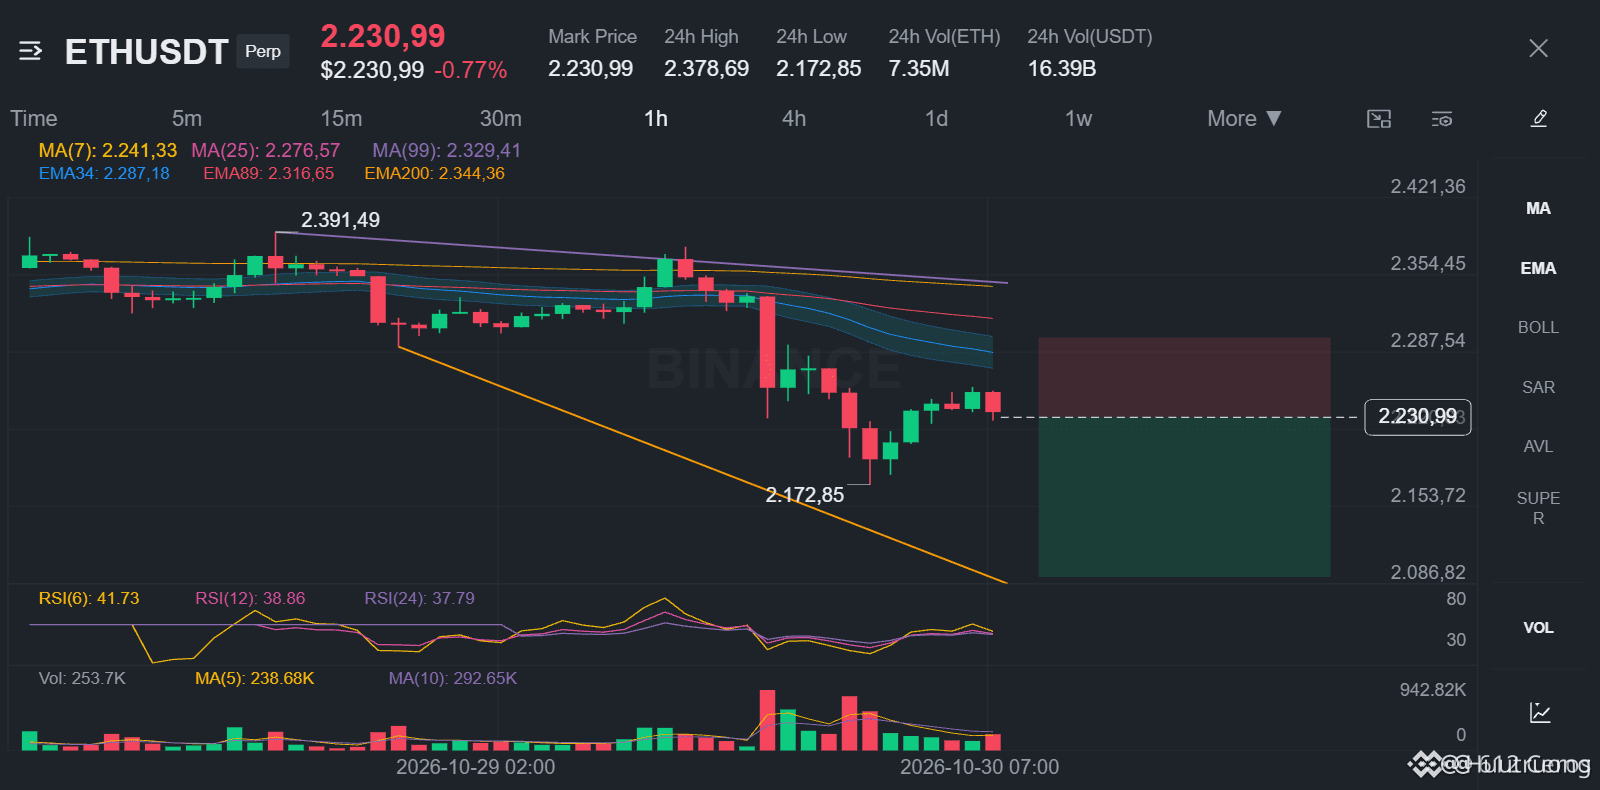
Range holding while sellers quietly stack below.
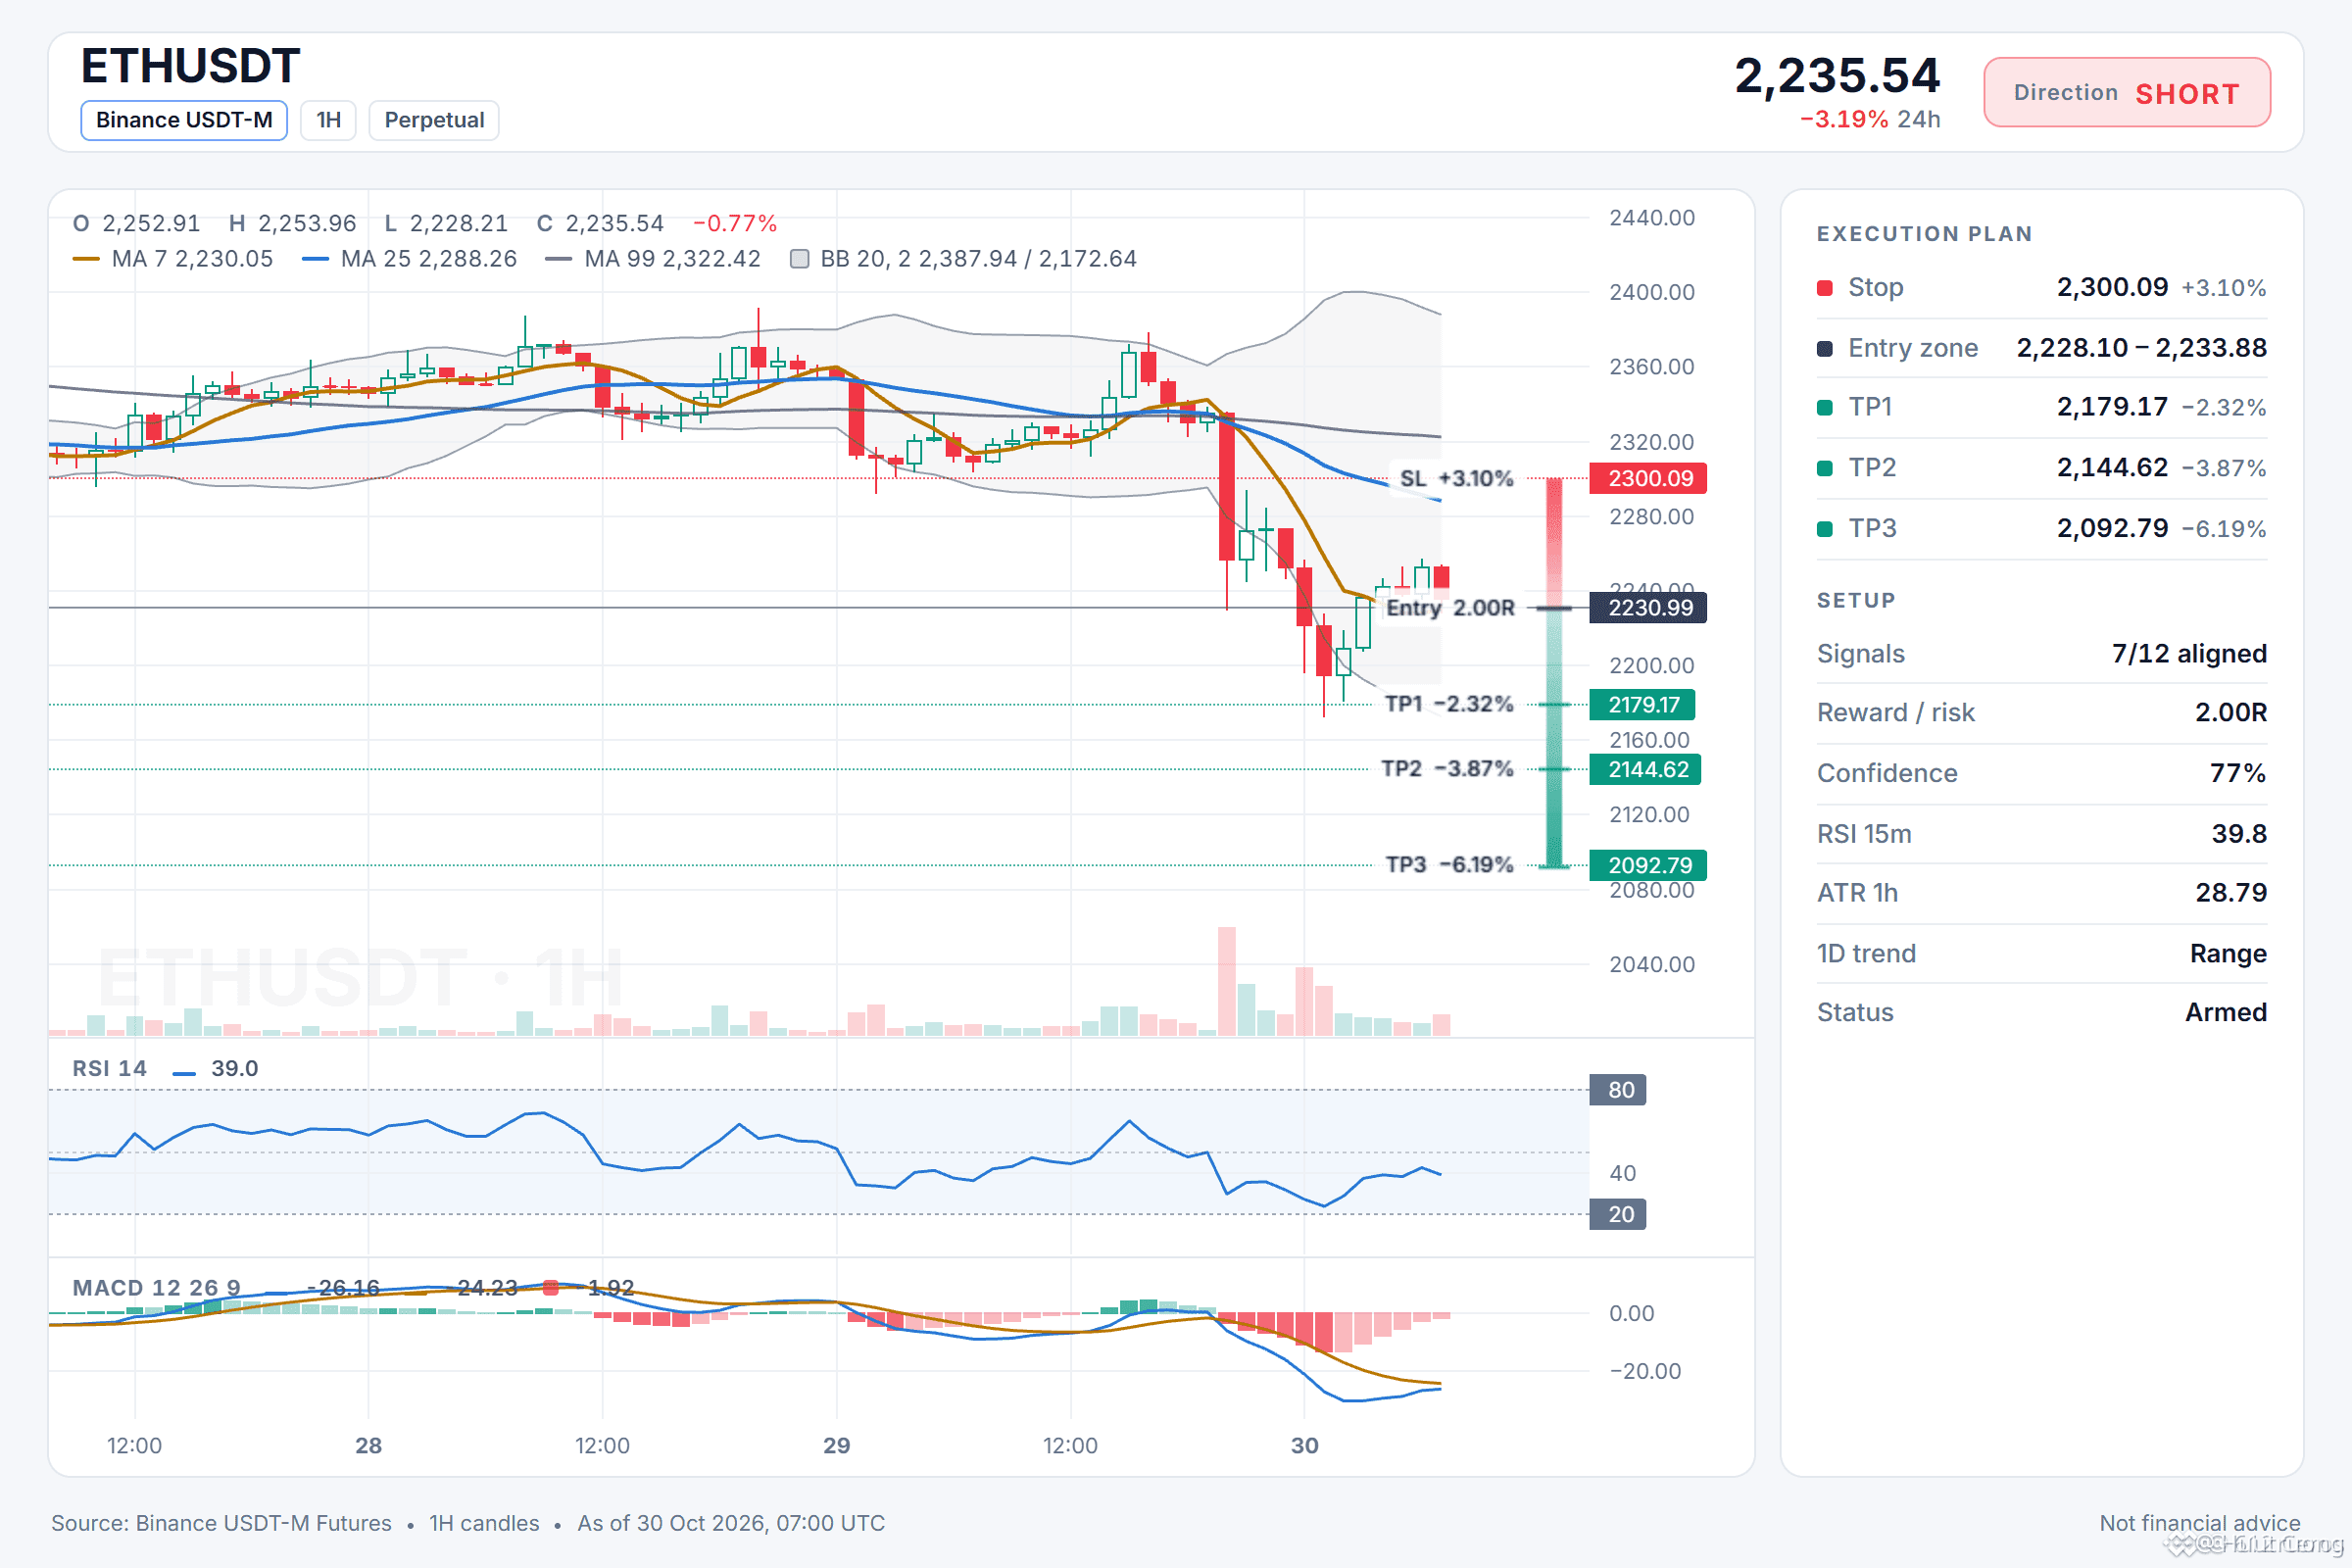
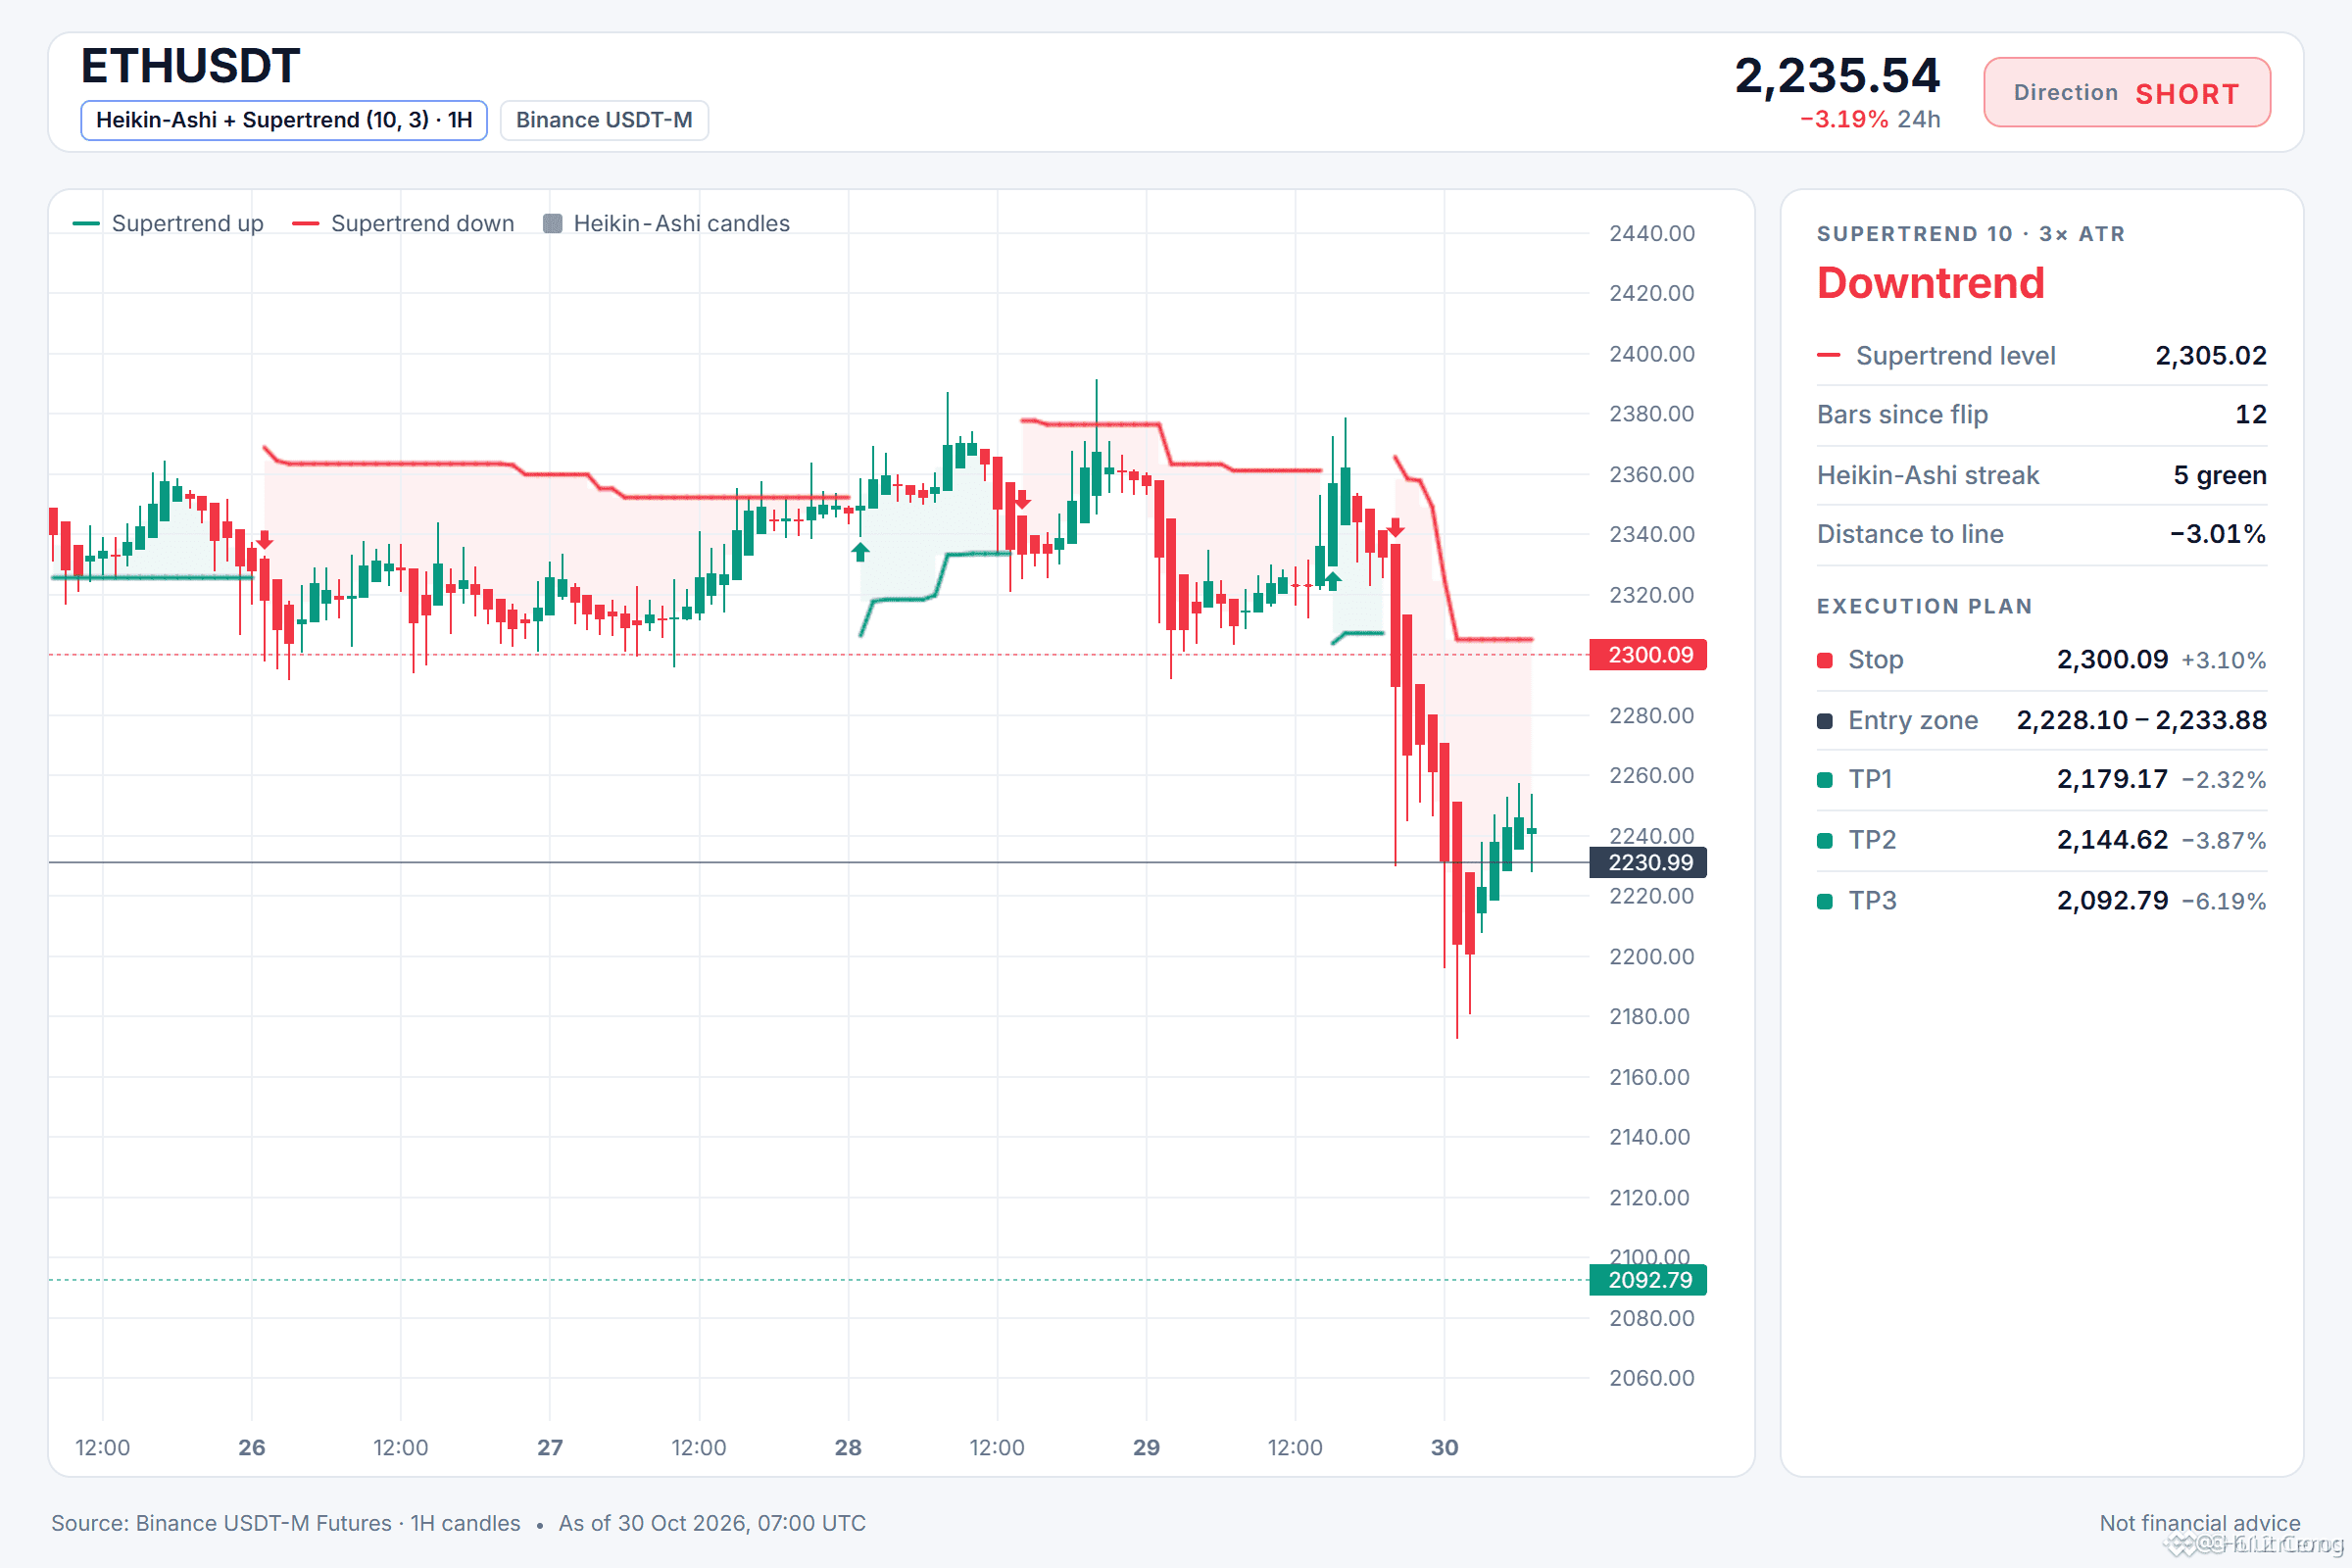
🔴 SHORT $ETH /USDT: expecting price to go DOWN
Bias: SHORT · Strong
Entry: 2228.10 – 2233.88
TP1: 2179.17 (-2.3%)
TP2: 2144.62 (-3.9%)
TP3: 2092.79 (-6.2%)
SL: 2300.09 (+3.1%)
Plan: enter only inside the zone, close 50% at TP1, 25% at TP2, 25% at TP3, and move the stop to entry after TP1.
Why SHORT? 7/12 signals agree, 0 against.
• 4h trend down (below EMA50 & EMA200)
• 1h trend down (below EMA50 & EMA200)
• Sellers are driving the move (15m ADX 27.5)
My read on ETH today
I'm watching ETH and I want to see price reject the entry zone at 2228.10 to 2233.88. The 1h price is 2230.99, and the 4h trend shows price below the EMA50 and EMA200 with a bearish stack. The strongest supporting factor is the 4h trend showing a bearish stack, meaning the swing trend is down. The main risk is the daily trend is range, meaning the big-picture trend is undecided.
Where do you take profit on this short?
Range holding while sellers quietly stack below.
🔴 SHORT $ETH /USDT: expecting price to go DOWN
Bias: SHORT · Strong
Entry: 2228.10 – 2233.88
TP1: 2179.17 (-2.3%)
TP2: 2144.62 (-3.9%)
TP3: 2092.79 (-6.2%)
SL: 2300.09 (+3.1%)
Plan: enter only inside the zone, close 50% at TP1, 25% at TP2, 25% at TP3, and move the stop to entry after TP1.
Why SHORT? 7/12 signals agree, 0 against.
• 4h trend down (below EMA50 & EMA200)
• 1h trend down (below EMA50 & EMA200)
• Sellers are driving the move (15m ADX 27.5)
My read on ETH today
I'm watching ETH and I want to see price reject the entry zone at 2228.10 to 2233.88. The 1h price is 2230.99, and the 4h trend shows price below the EMA50 and EMA200 with a bearish stack. The strongest supporting factor is the 4h trend showing a bearish stack, meaning the swing trend is down. The main risk is the daily trend is range, meaning the big-picture trend is undecided.
Where do you take profit on this short?
🔴 SHORT $ETH /USDT: expecting price to go DOWN
Bias: SHORT · Strong
Entry: 2228.10 – 2233.88
TP1: 2179.17 (-2.3%)
TP2: 2144.62 (-3.9%)
TP3: 2092.79 (-6.2%)
SL: 2300.09 (+3.1%)
Plan: enter only inside the zone, close 50% at TP1, 25% at TP2, 25% at TP3, and move the stop to entry after TP1.
Why SHORT? 7/12 signals agree, 0 against.
• 4h trend down (below EMA50 & EMA200)
• 1h trend down (below EMA50 & EMA200)
• Sellers are driving the move (15m ADX 27.5)
My read on ETH today
I'm watching ETH and I want to see price reject the entry zone at 2228.10 to 2233.88. The 1h price is 2230.99, and the 4h trend shows price below the EMA50 and EMA200 with a bearish stack. The strongest supporting factor is the 4h trend showing a bearish stack, meaning the swing trend is down. The main risk is the daily trend is range, meaning the big-picture trend is undecided.
Where do you take profit on this short?
14
·
--
Bajista
Ver traducción
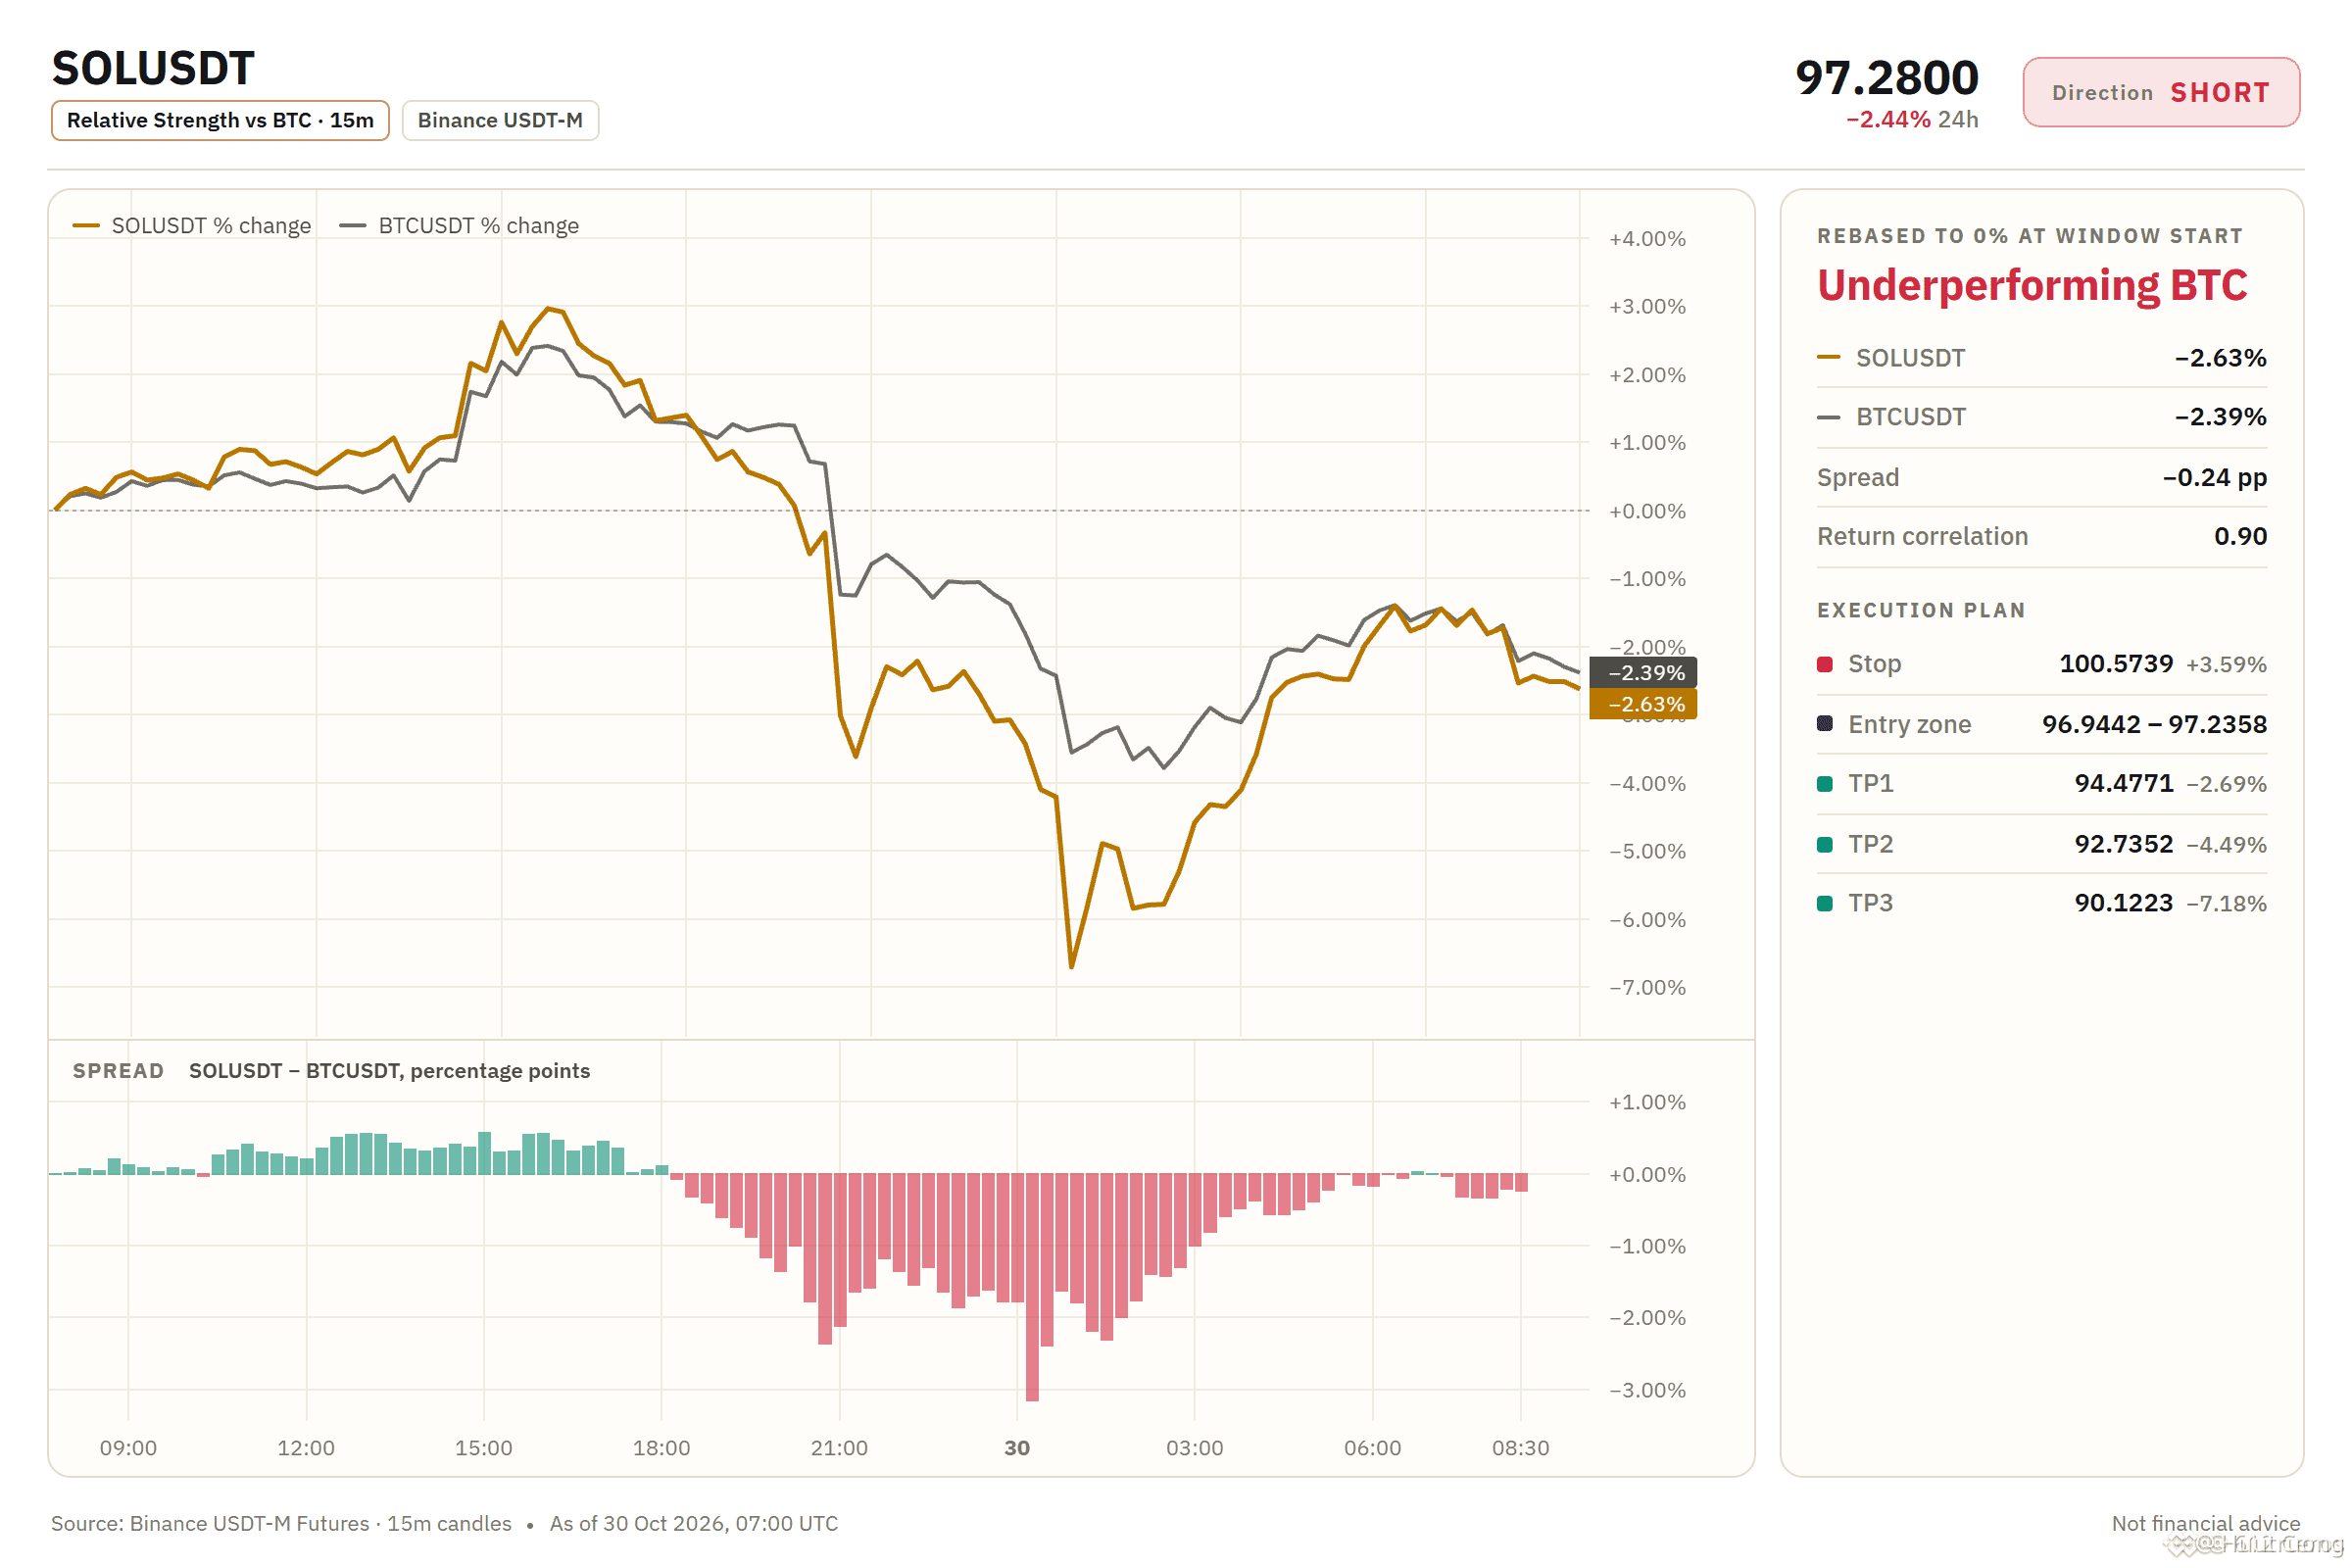
SOL looks weak in this trend setup.
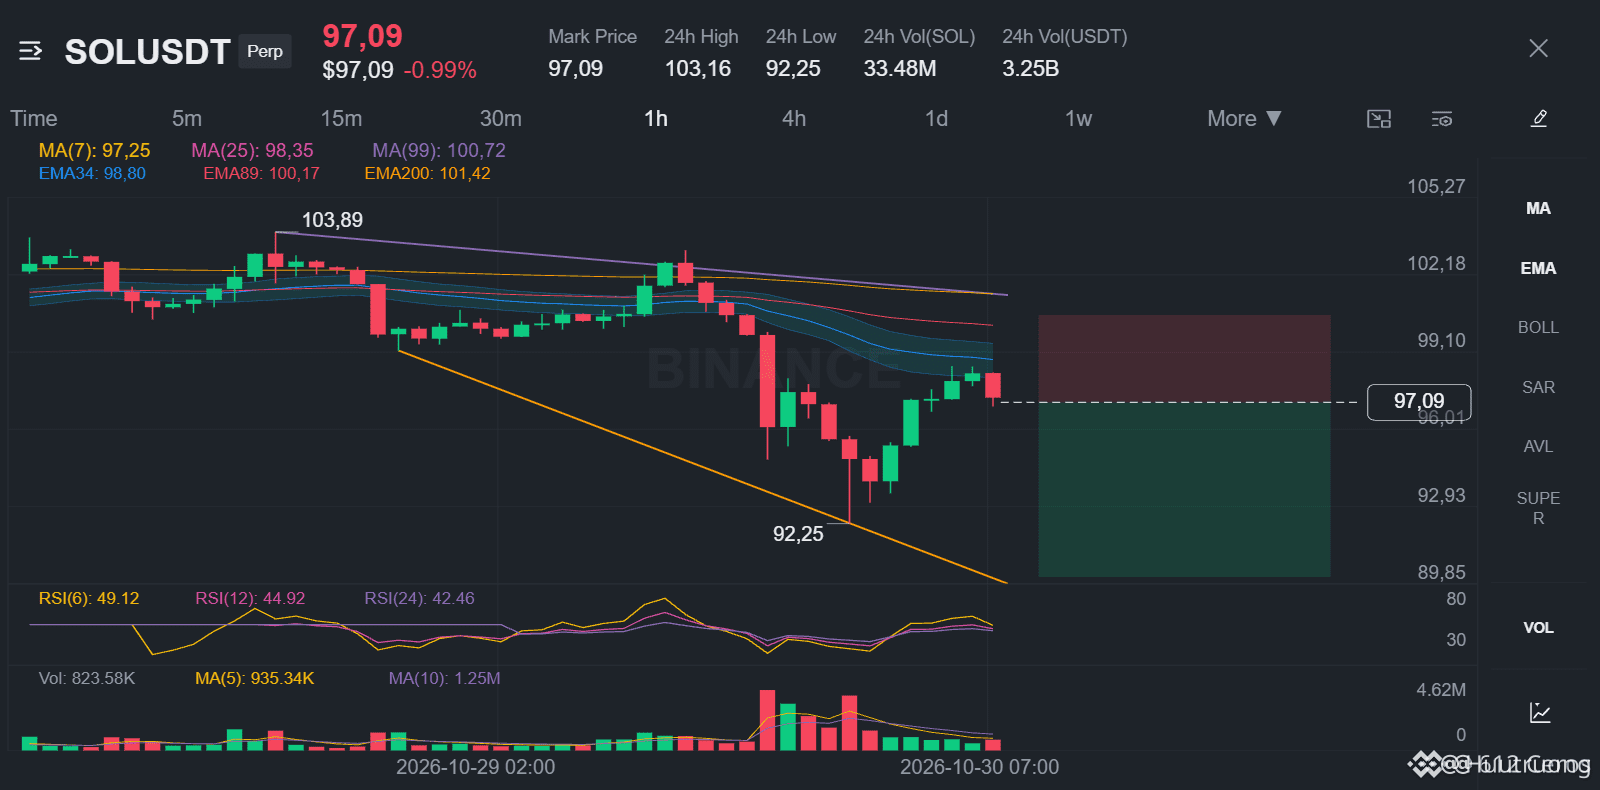
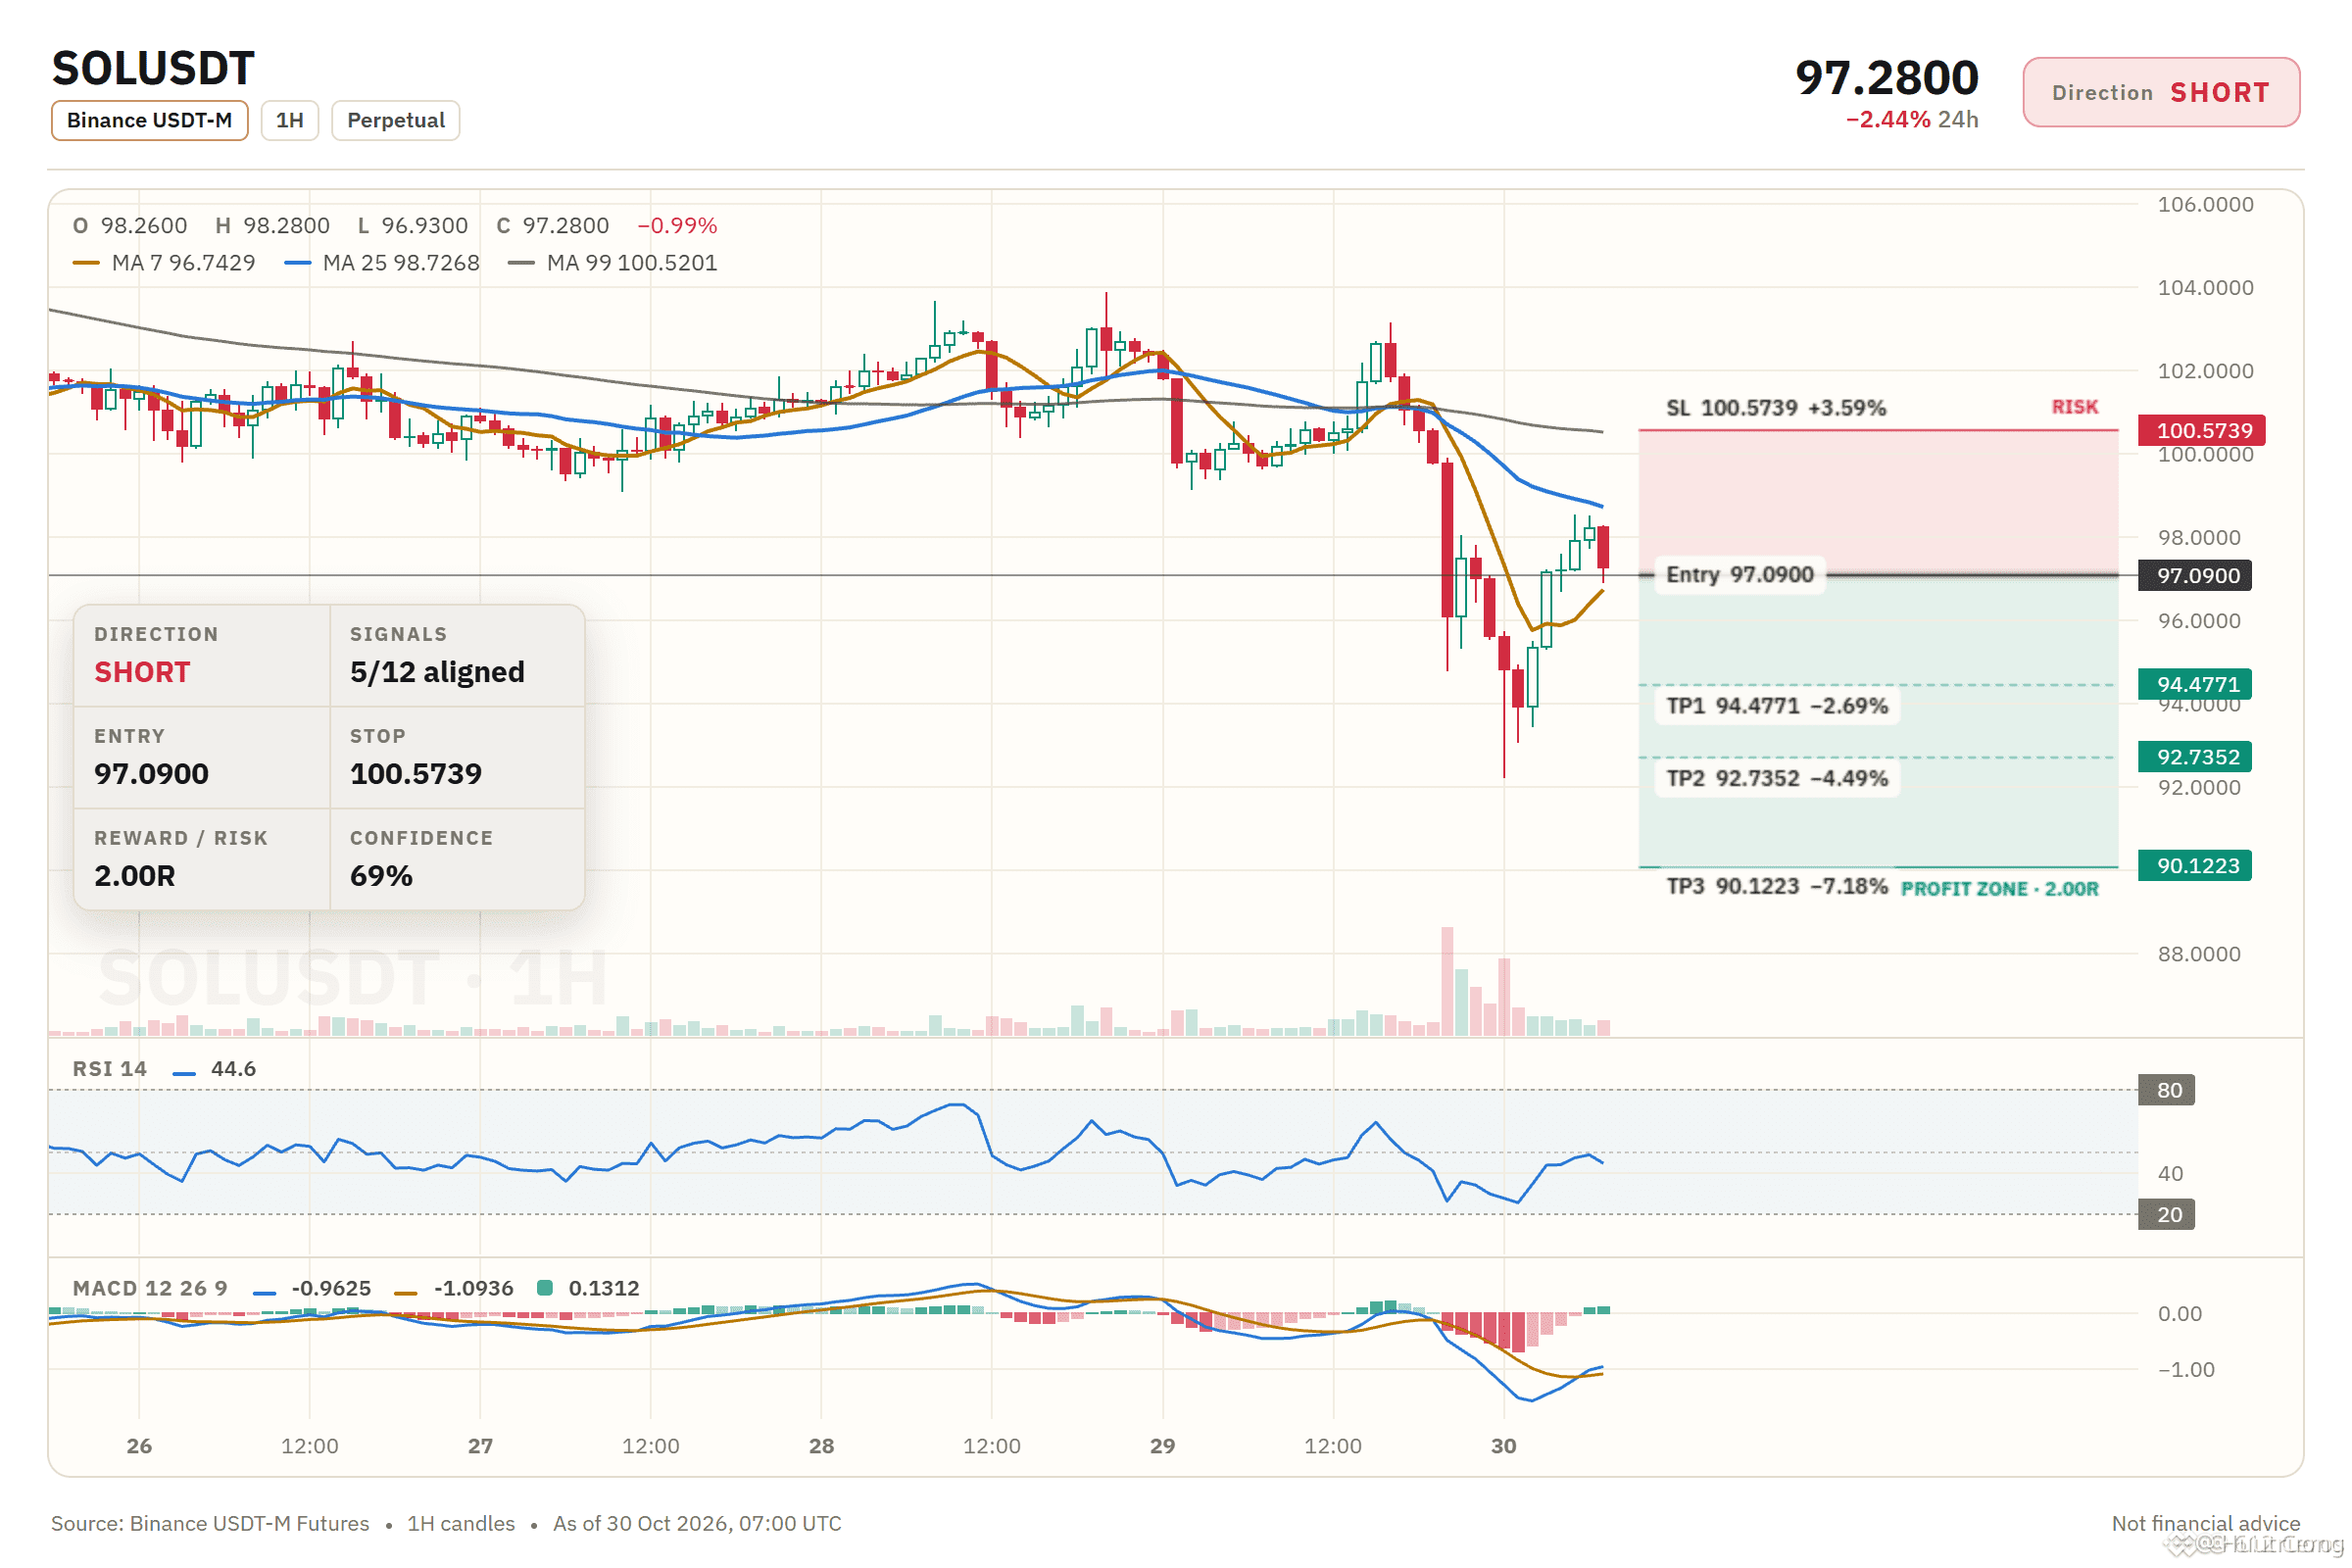
🔴 SHORT $SOL /USDT: expecting price to go DOWN
Bias: SHORT · Leaning
Entry: 96.9442 – 97.2358
TP1: 94.4771 (-2.7%)
TP2: 92.7352 (-4.5%)
TP3: 90.1223 (-7.2%)
SL: 100.5739 (+3.6%)
Plan: enter only inside the zone, close 50% at TP1, 25% at TP2, 25% at TP3, and move the stop to entry after TP1.
Note: moderate conviction only, keep size light.
Why SHORT? 5/12 signals agree, 0 against.
• 4h trend down (below EMA50 & EMA200)
• 1h trend down (below EMA50 & EMA200)
• btc is falling, this coin follows (corr 0.90)
Q: Why short when the daily trend is range?
A: The 4h trend shows price below EMA50 and EMA200, a bearish stack.
Q: When is this trade wrong?
A: If price pushes above 97.2358, the invalidation level invalidates the short.
What is your sol level if the daily trend breaks up?
SOL looks weak in this trend setup.
🔴 SHORT $SOL /USDT: expecting price to go DOWN
Bias: SHORT · Leaning
Entry: 96.9442 – 97.2358
TP1: 94.4771 (-2.7%)
TP2: 92.7352 (-4.5%)
TP3: 90.1223 (-7.2%)
SL: 100.5739 (+3.6%)
Plan: enter only inside the zone, close 50% at TP1, 25% at TP2, 25% at TP3, and move the stop to entry after TP1.
Note: moderate conviction only, keep size light.
Why SHORT? 5/12 signals agree, 0 against.
• 4h trend down (below EMA50 & EMA200)
• 1h trend down (below EMA50 & EMA200)
• btc is falling, this coin follows (corr 0.90)
Q: Why short when the daily trend is range?
A: The 4h trend shows price below EMA50 and EMA200, a bearish stack.
Q: When is this trade wrong?
A: If price pushes above 97.2358, the invalidation level invalidates the short.
What is your sol level if the daily trend breaks up?
🔴 SHORT $SOL /USDT: expecting price to go DOWN
Bias: SHORT · Leaning
Entry: 96.9442 – 97.2358
TP1: 94.4771 (-2.7%)
TP2: 92.7352 (-4.5%)
TP3: 90.1223 (-7.2%)
SL: 100.5739 (+3.6%)
Plan: enter only inside the zone, close 50% at TP1, 25% at TP2, 25% at TP3, and move the stop to entry after TP1.
Note: moderate conviction only, keep size light.
Why SHORT? 5/12 signals agree, 0 against.
• 4h trend down (below EMA50 & EMA200)
• 1h trend down (below EMA50 & EMA200)
• btc is falling, this coin follows (corr 0.90)
Q: Why short when the daily trend is range?
A: The 4h trend shows price below EMA50 and EMA200, a bearish stack.
Q: When is this trade wrong?
A: If price pushes above 97.2358, the invalidation level invalidates the short.
What is your sol level if the daily trend breaks up?
10
·
--
Bajista
Ver traducción
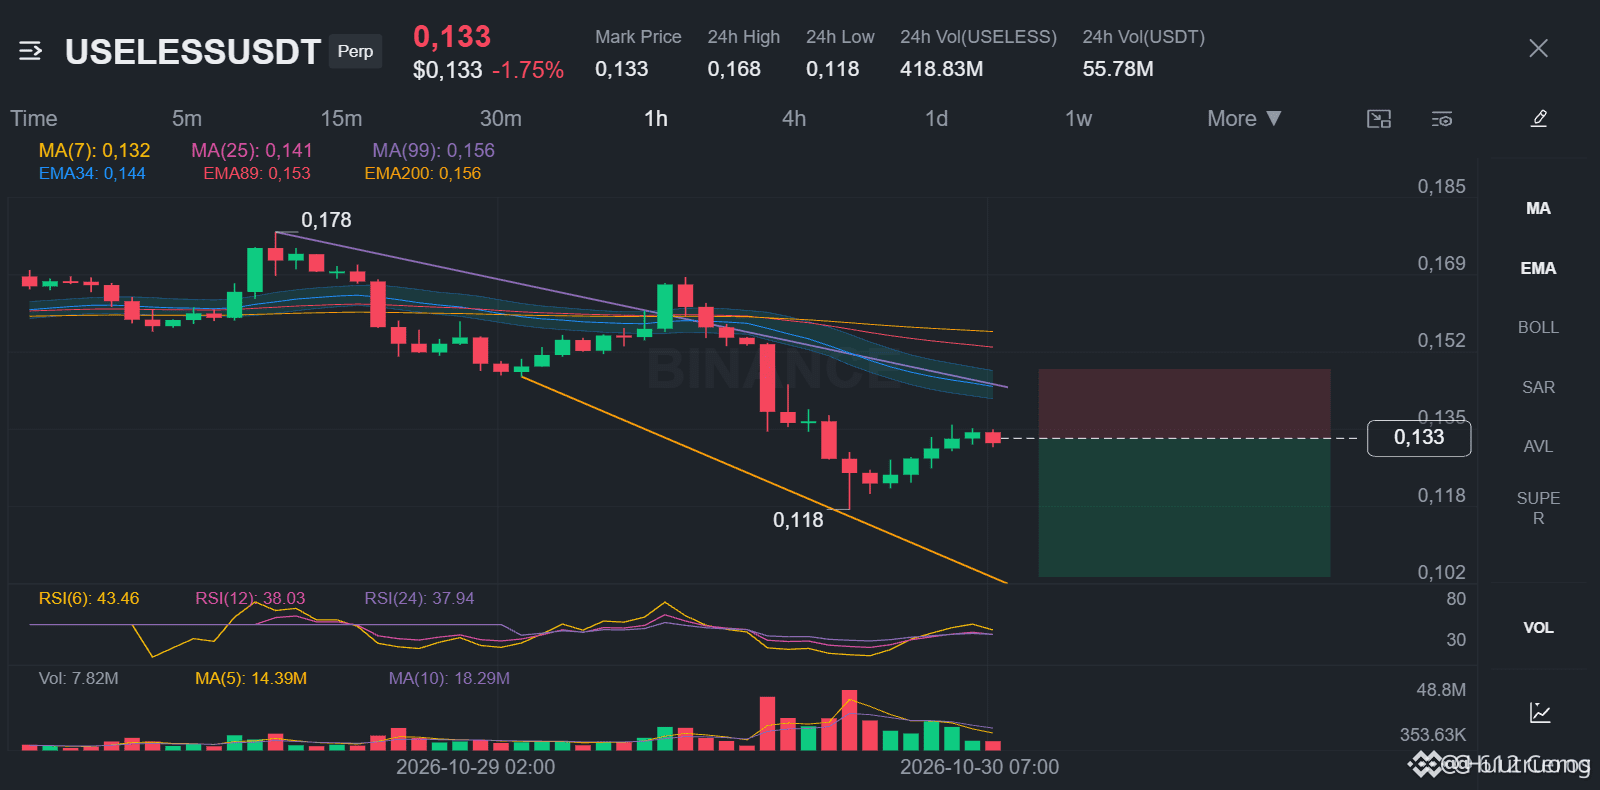
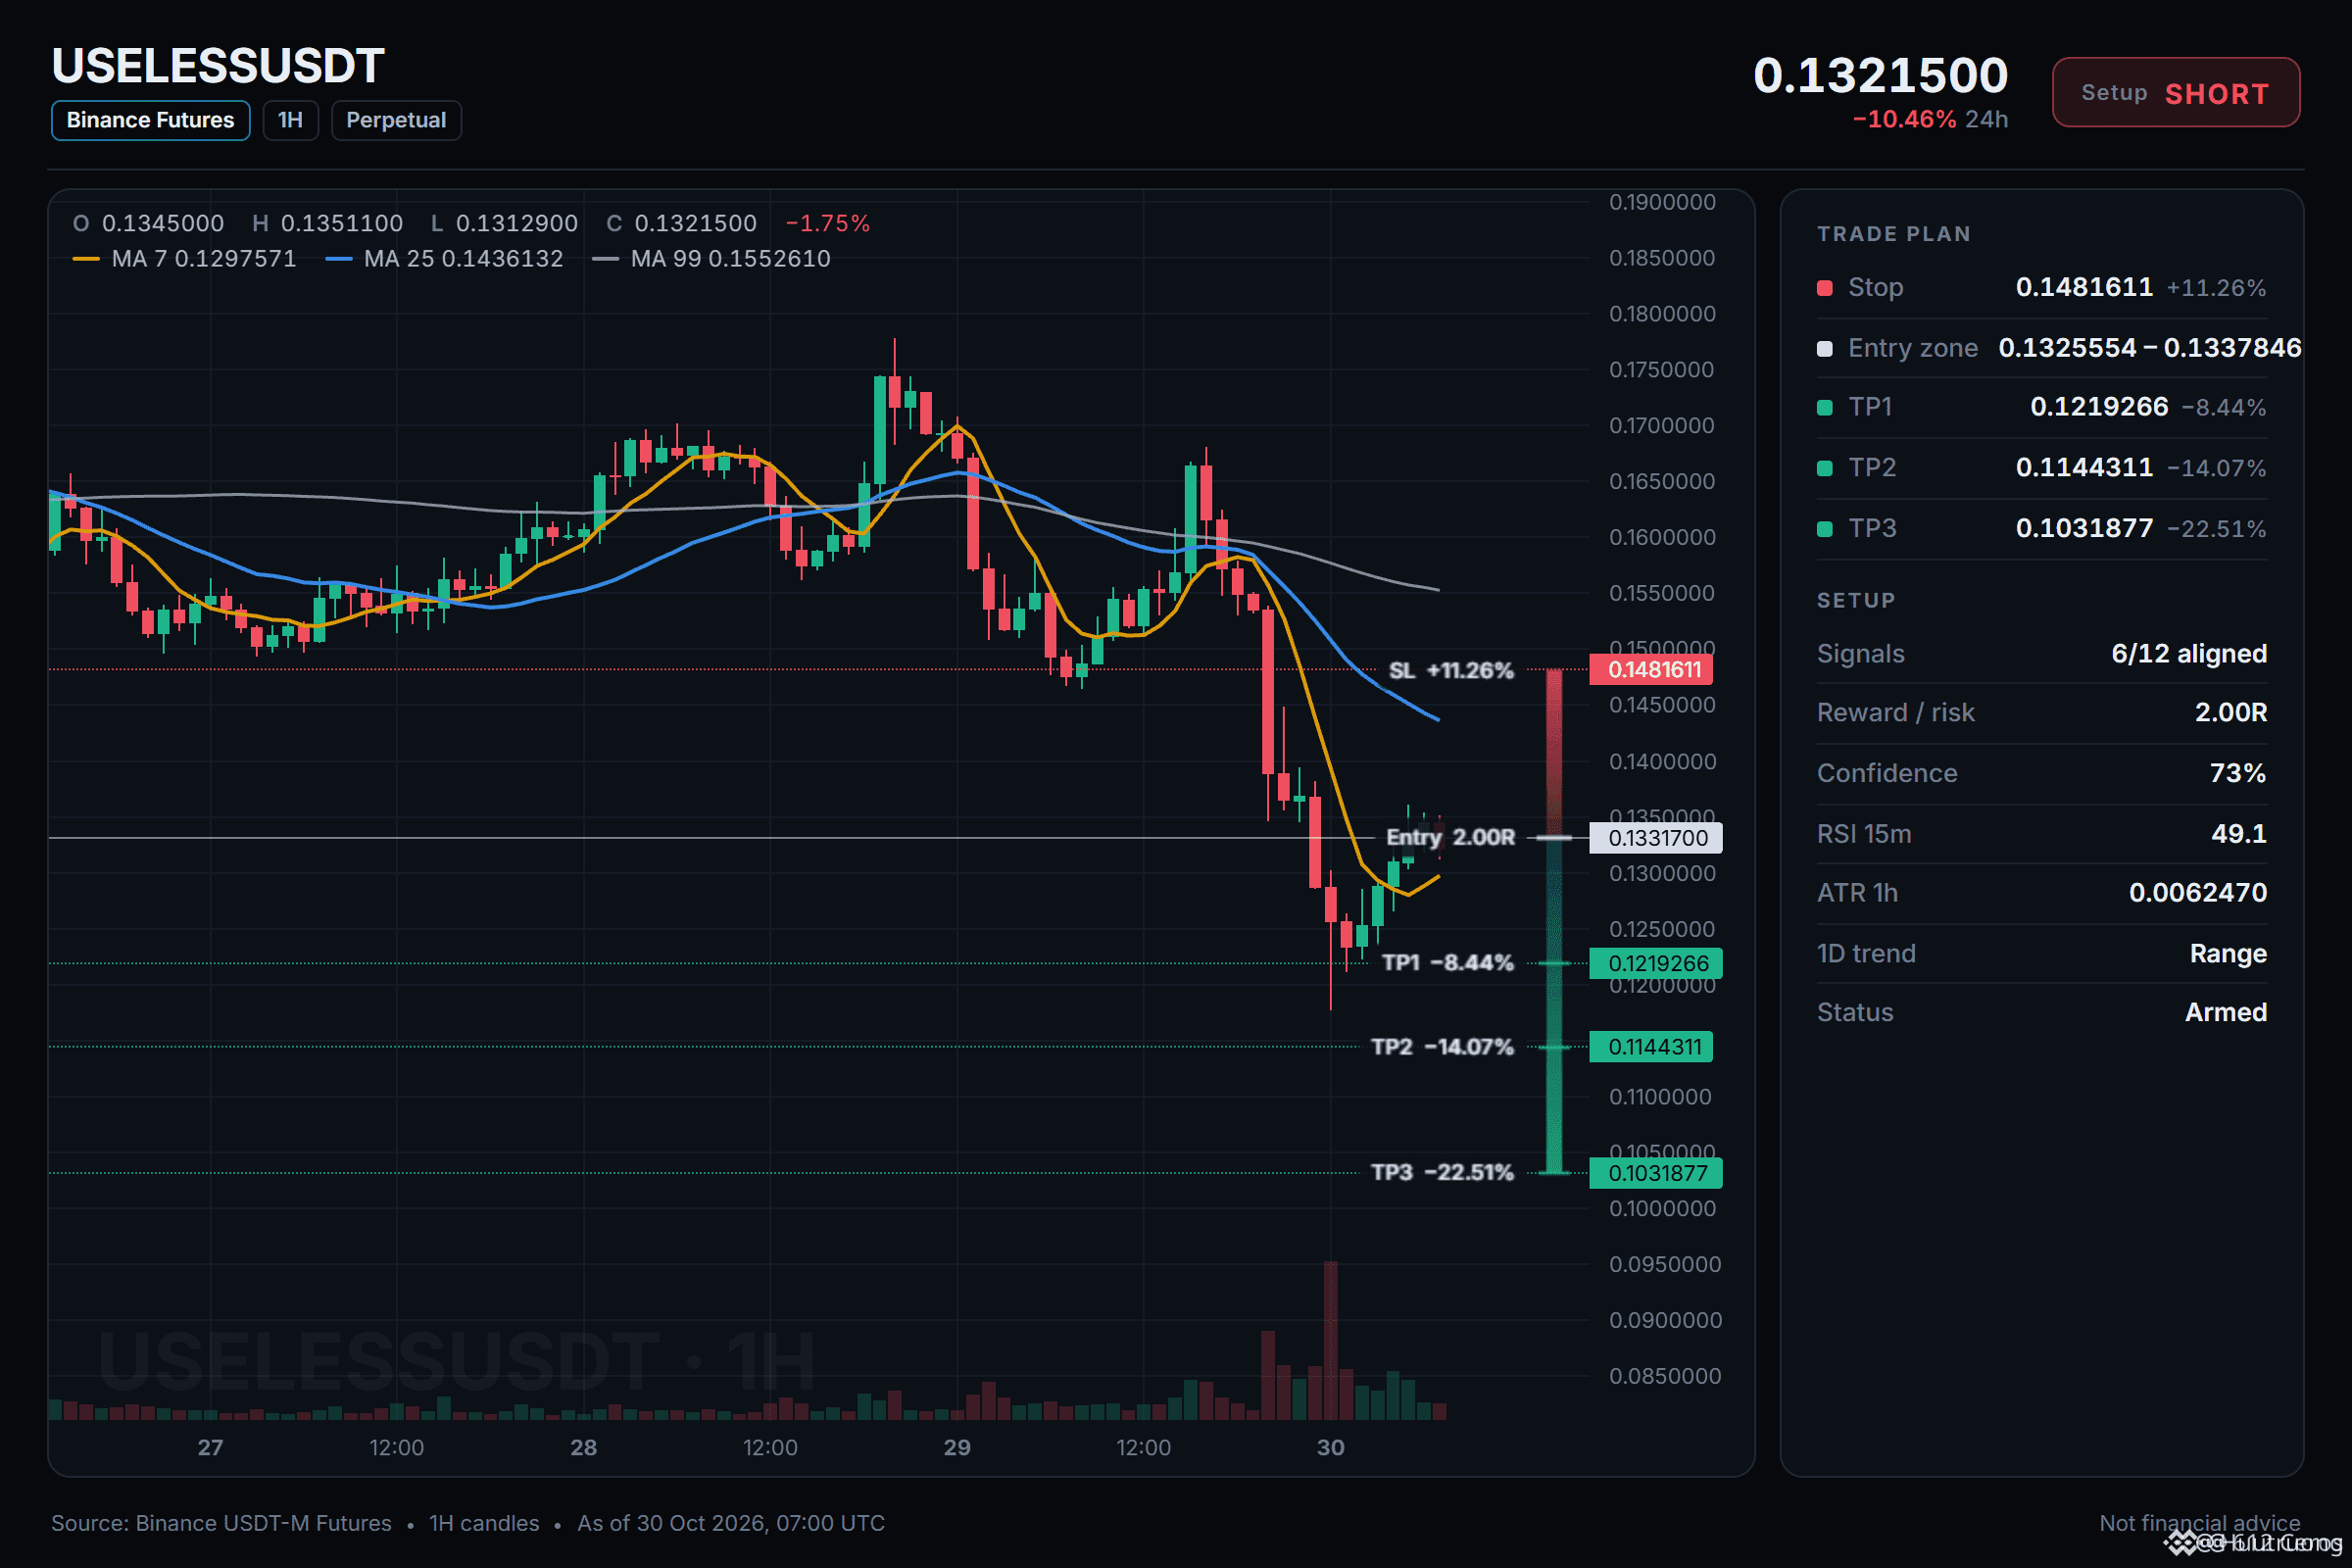
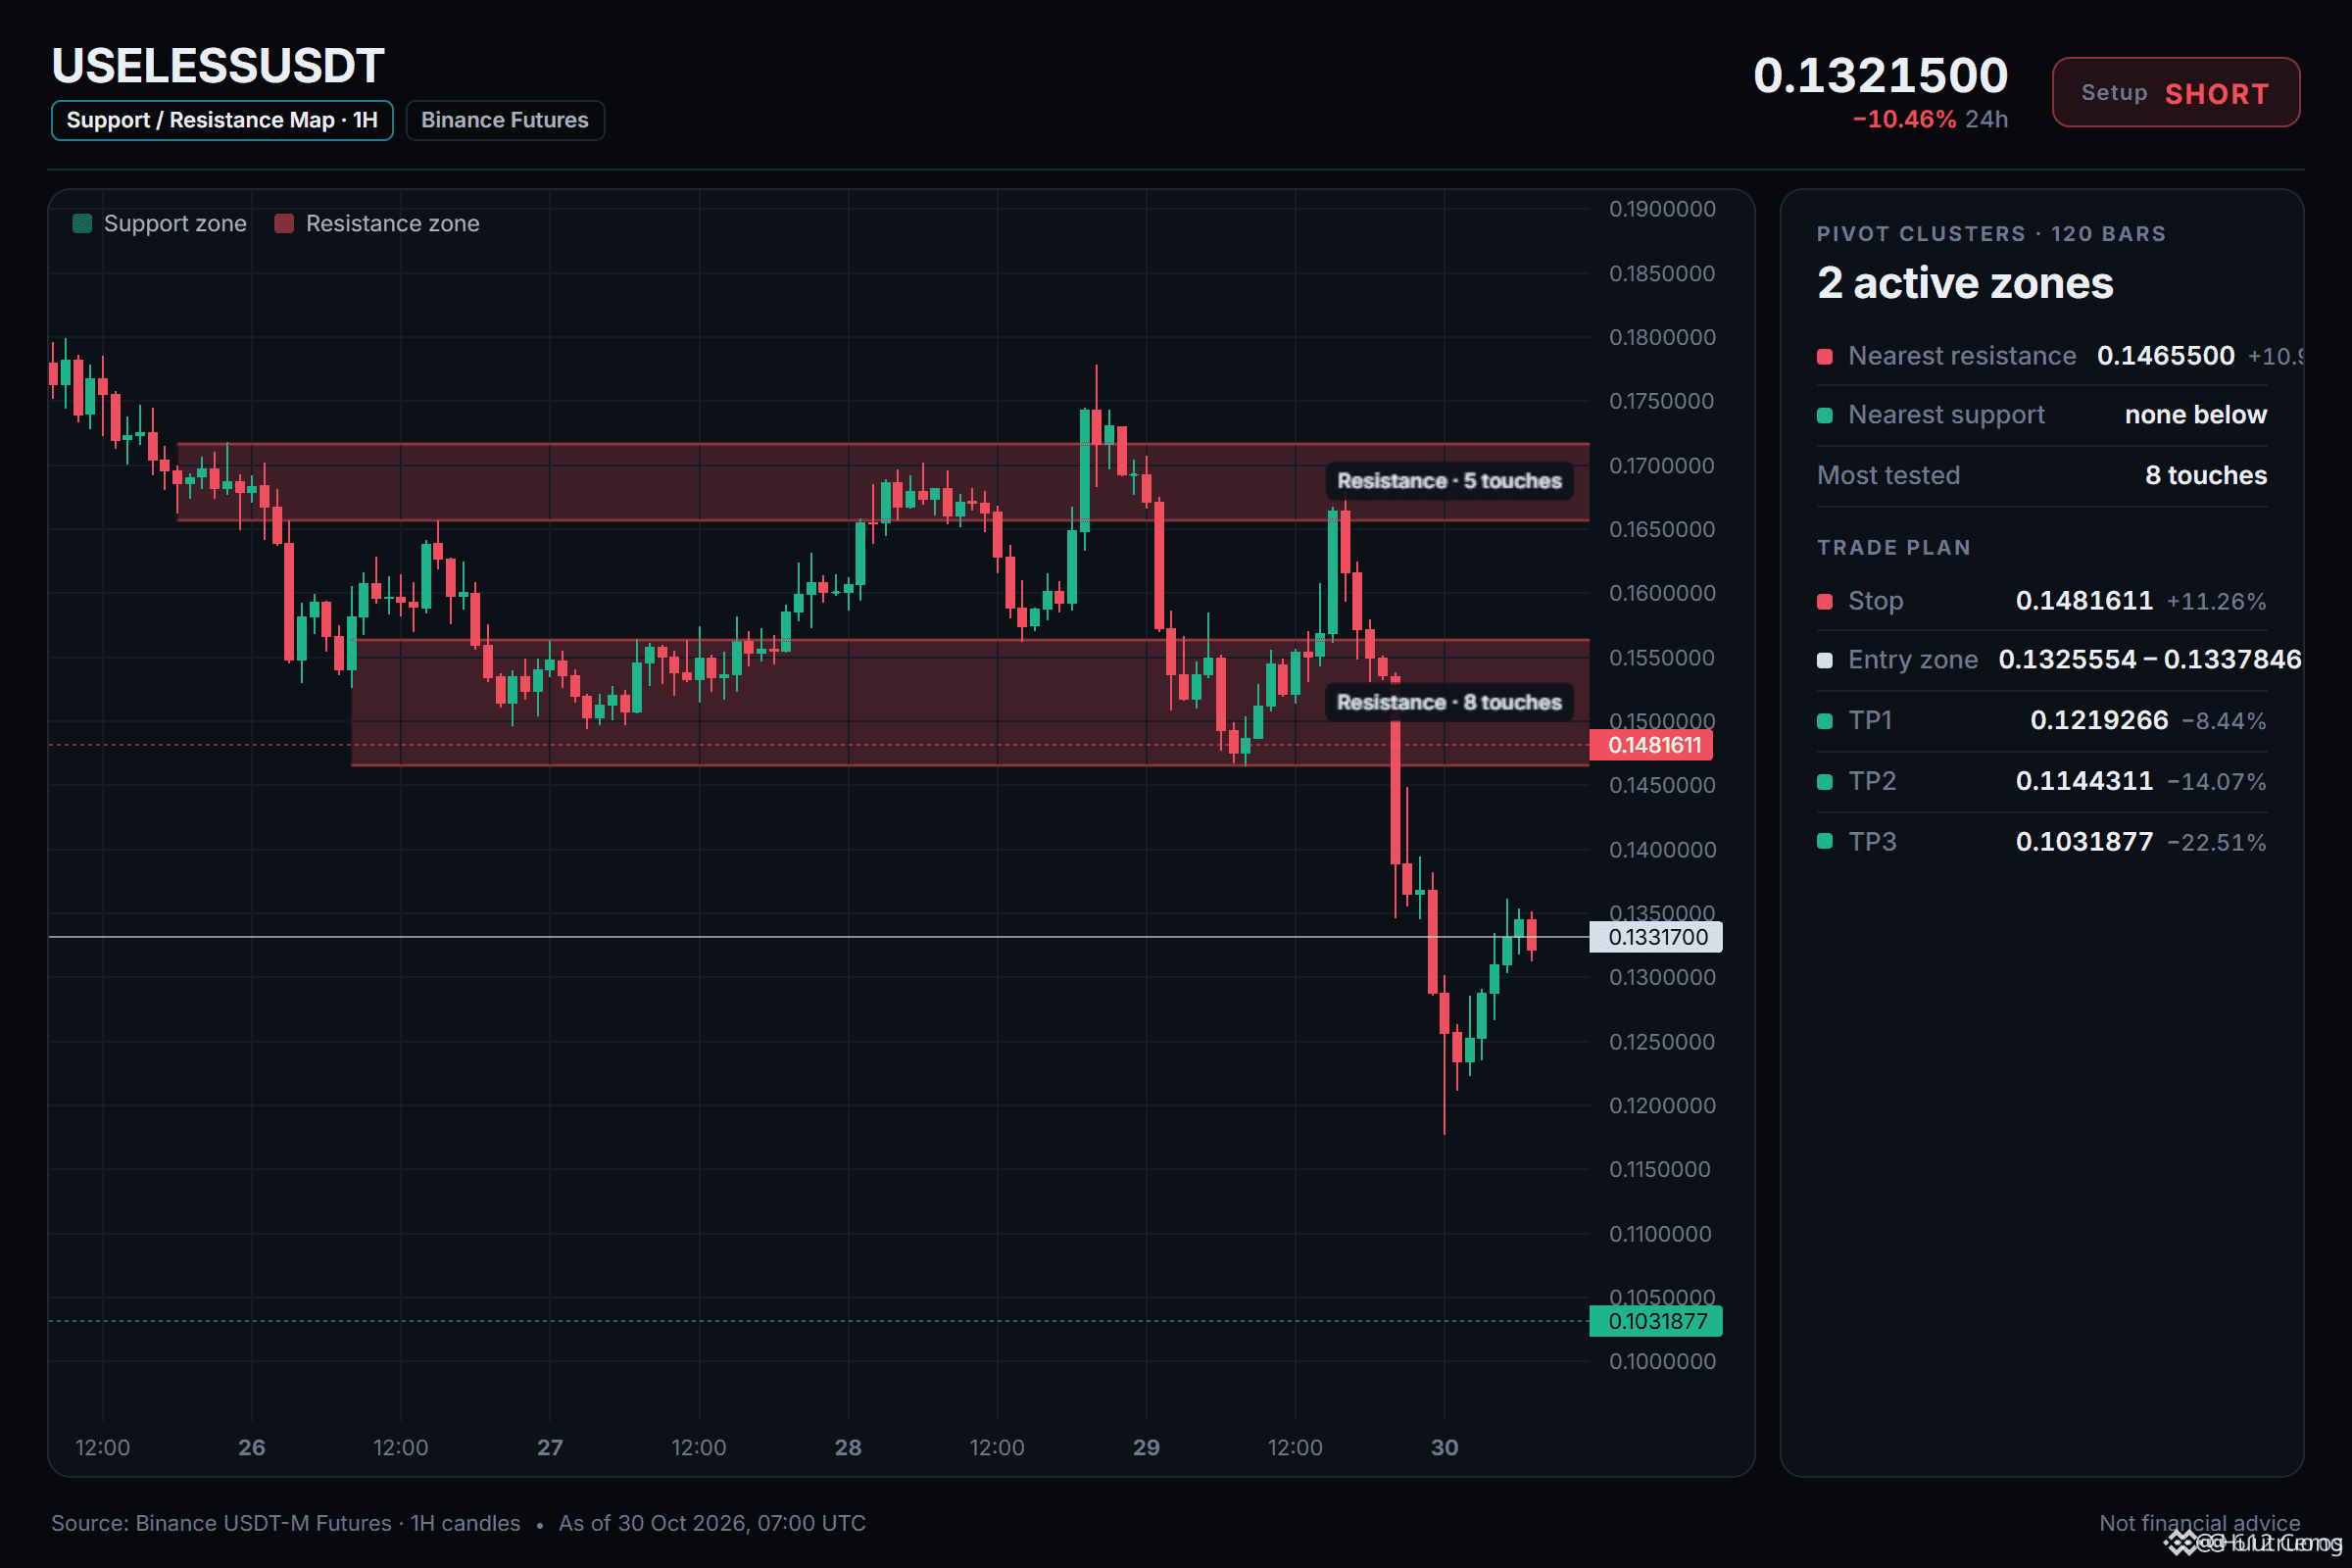
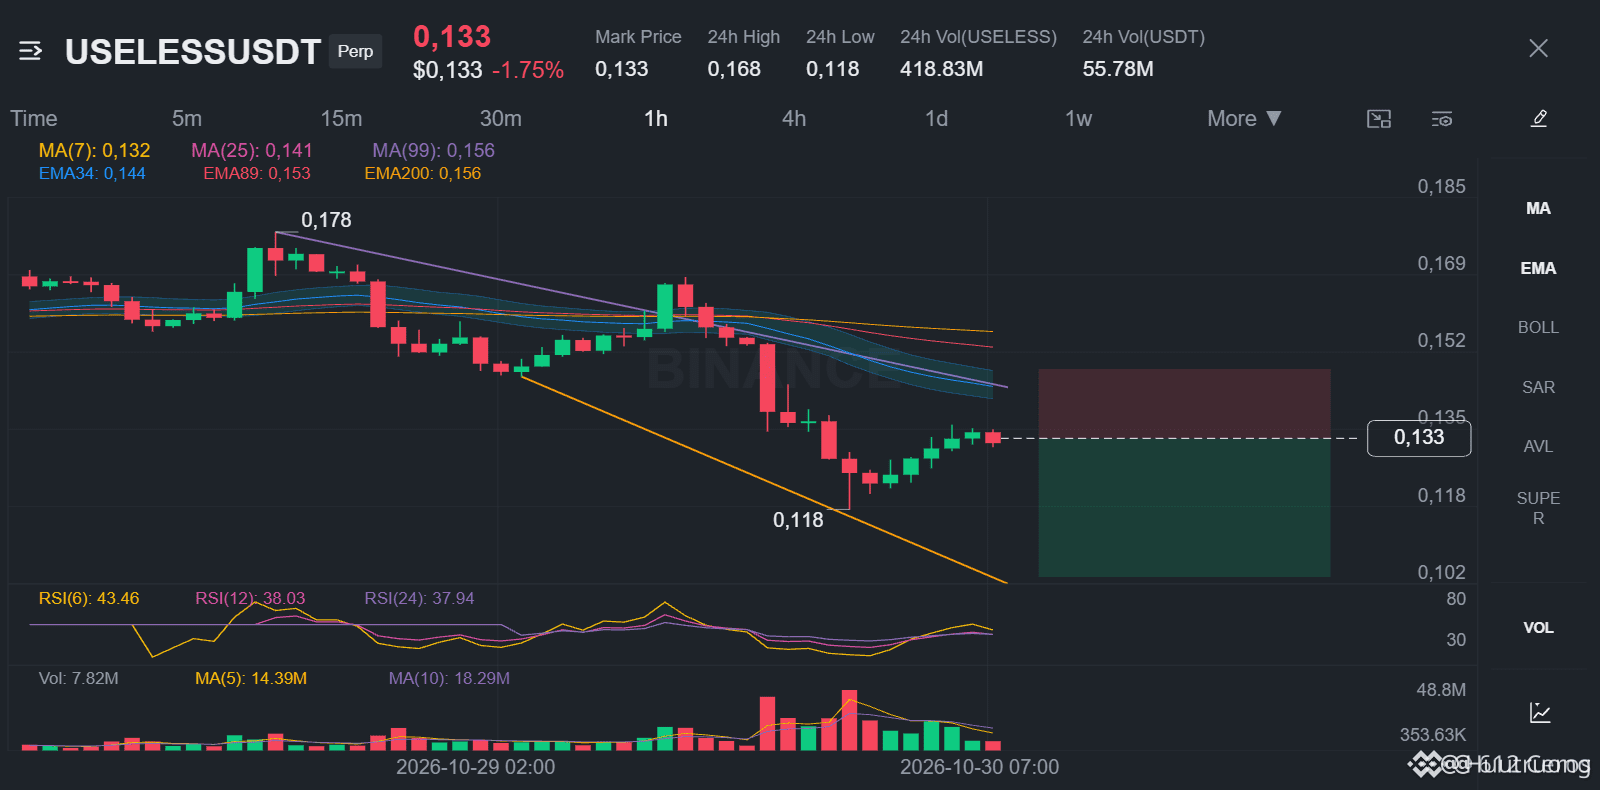
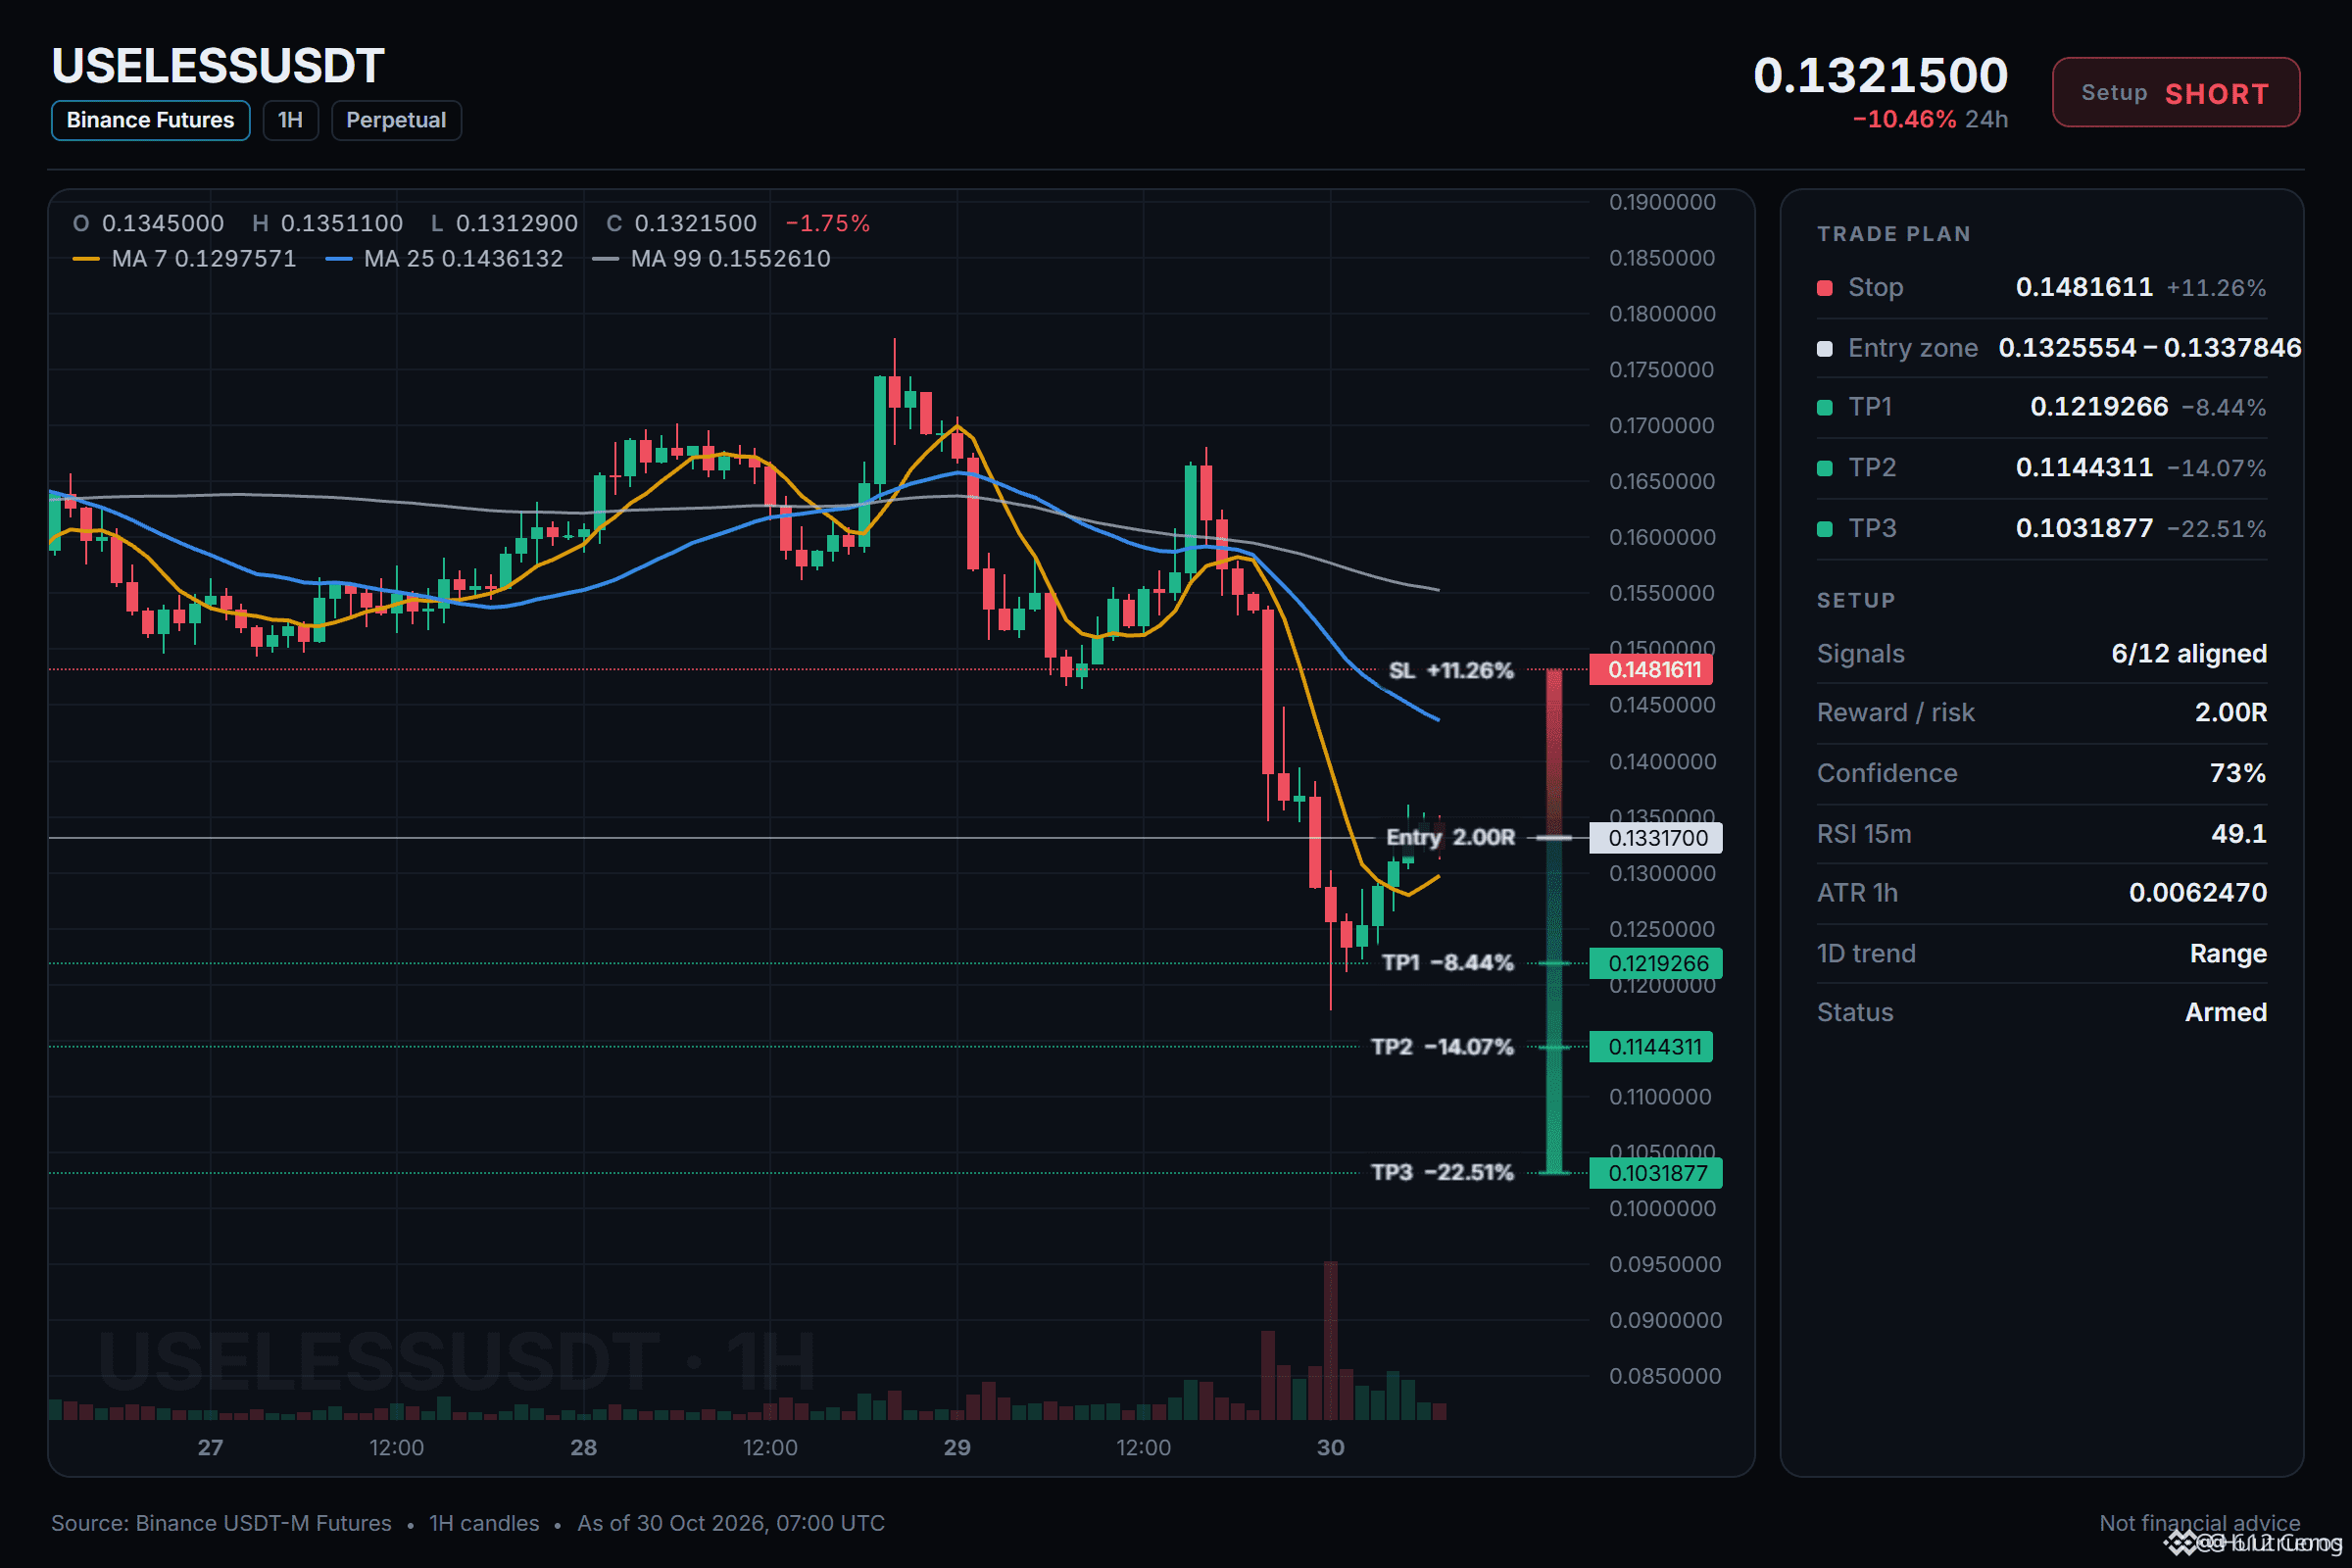
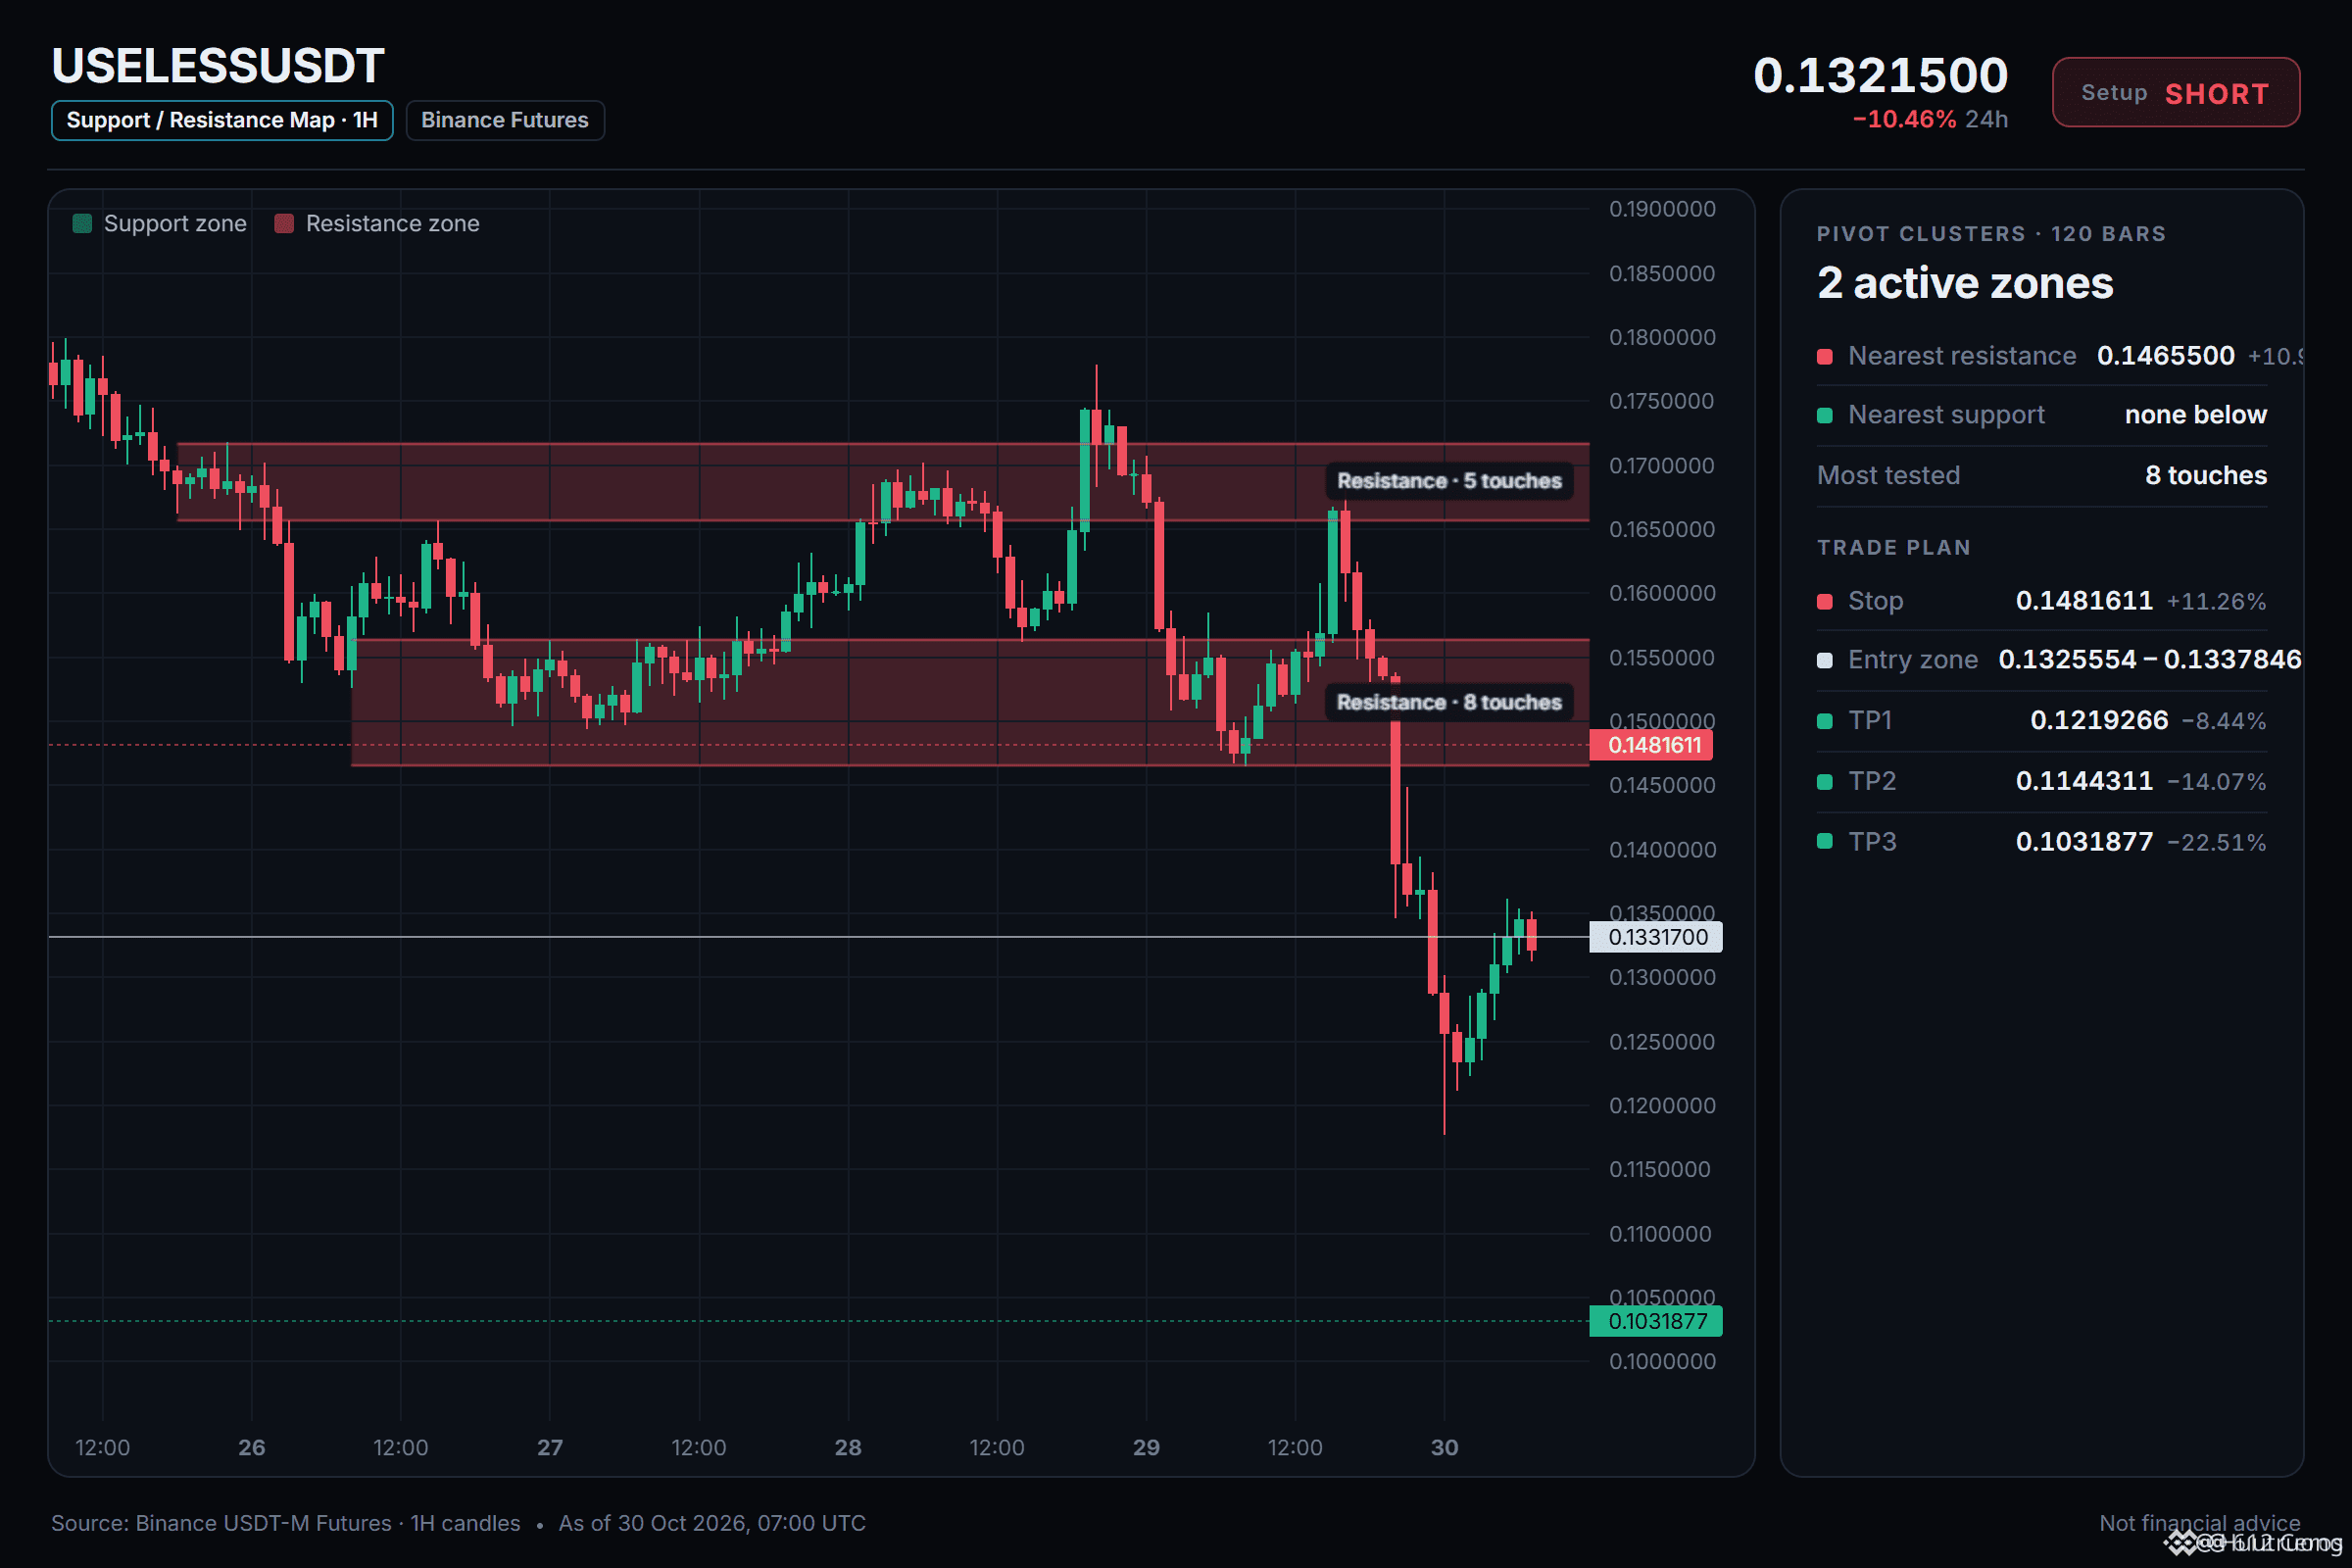
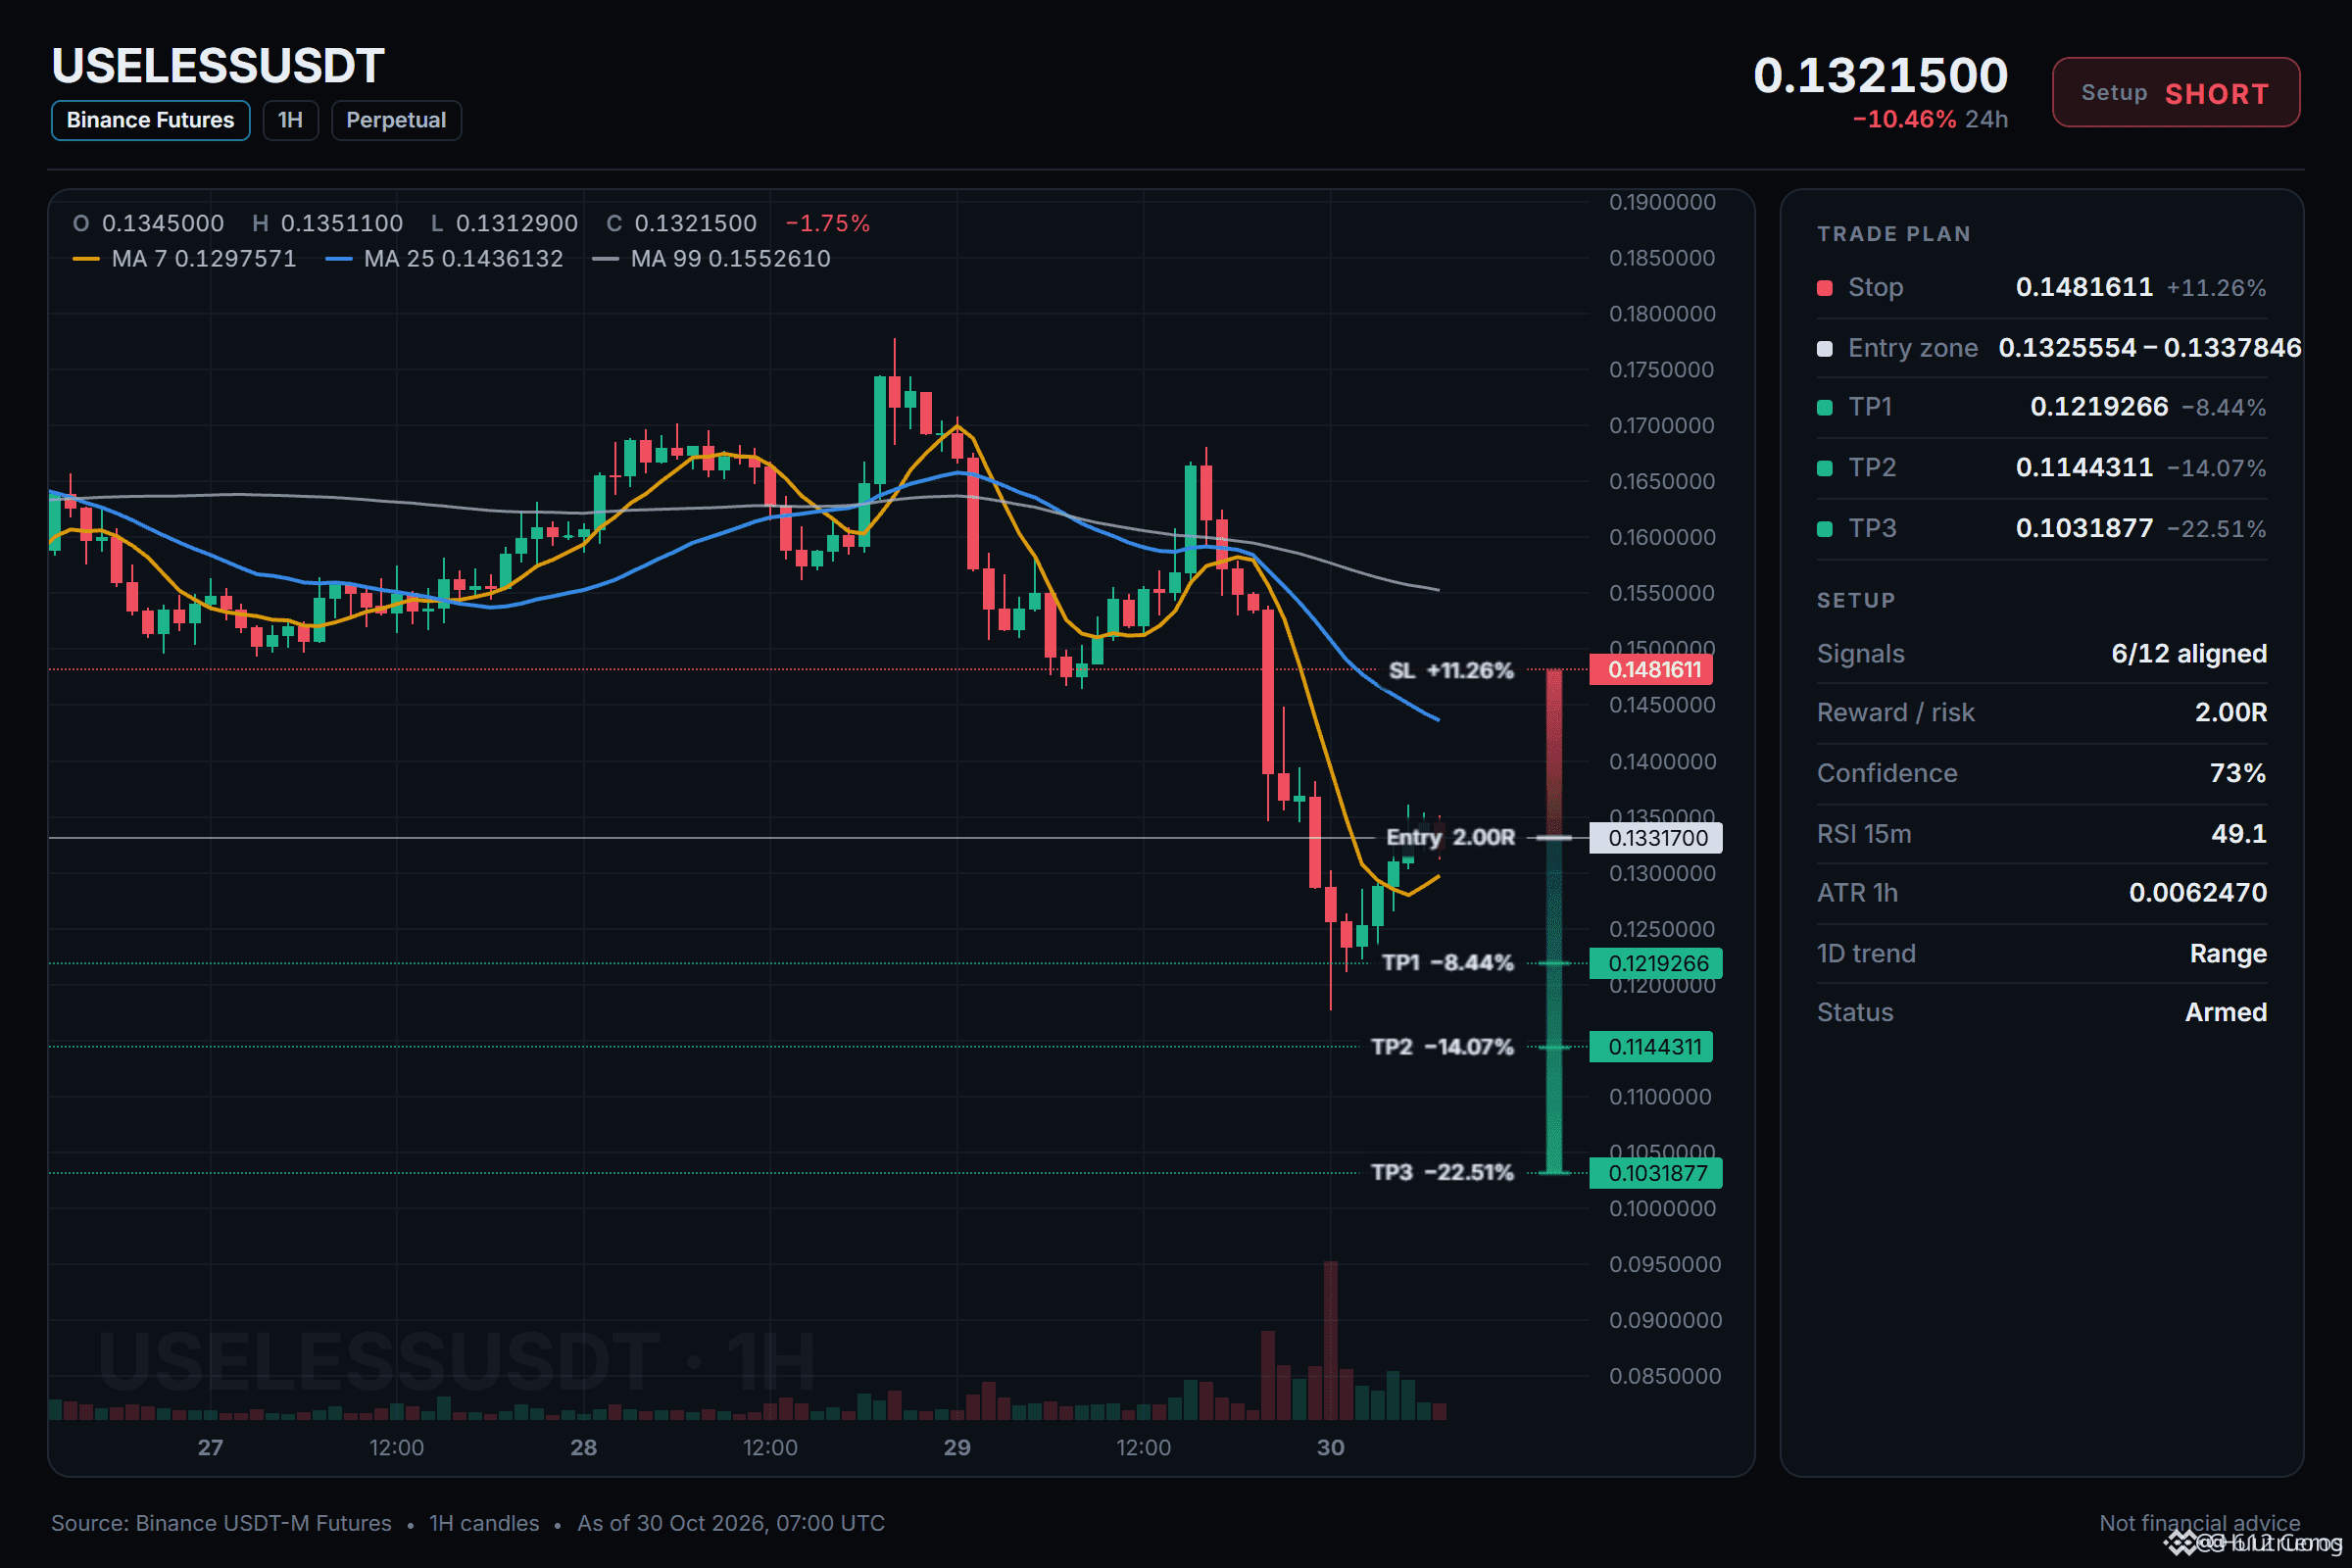
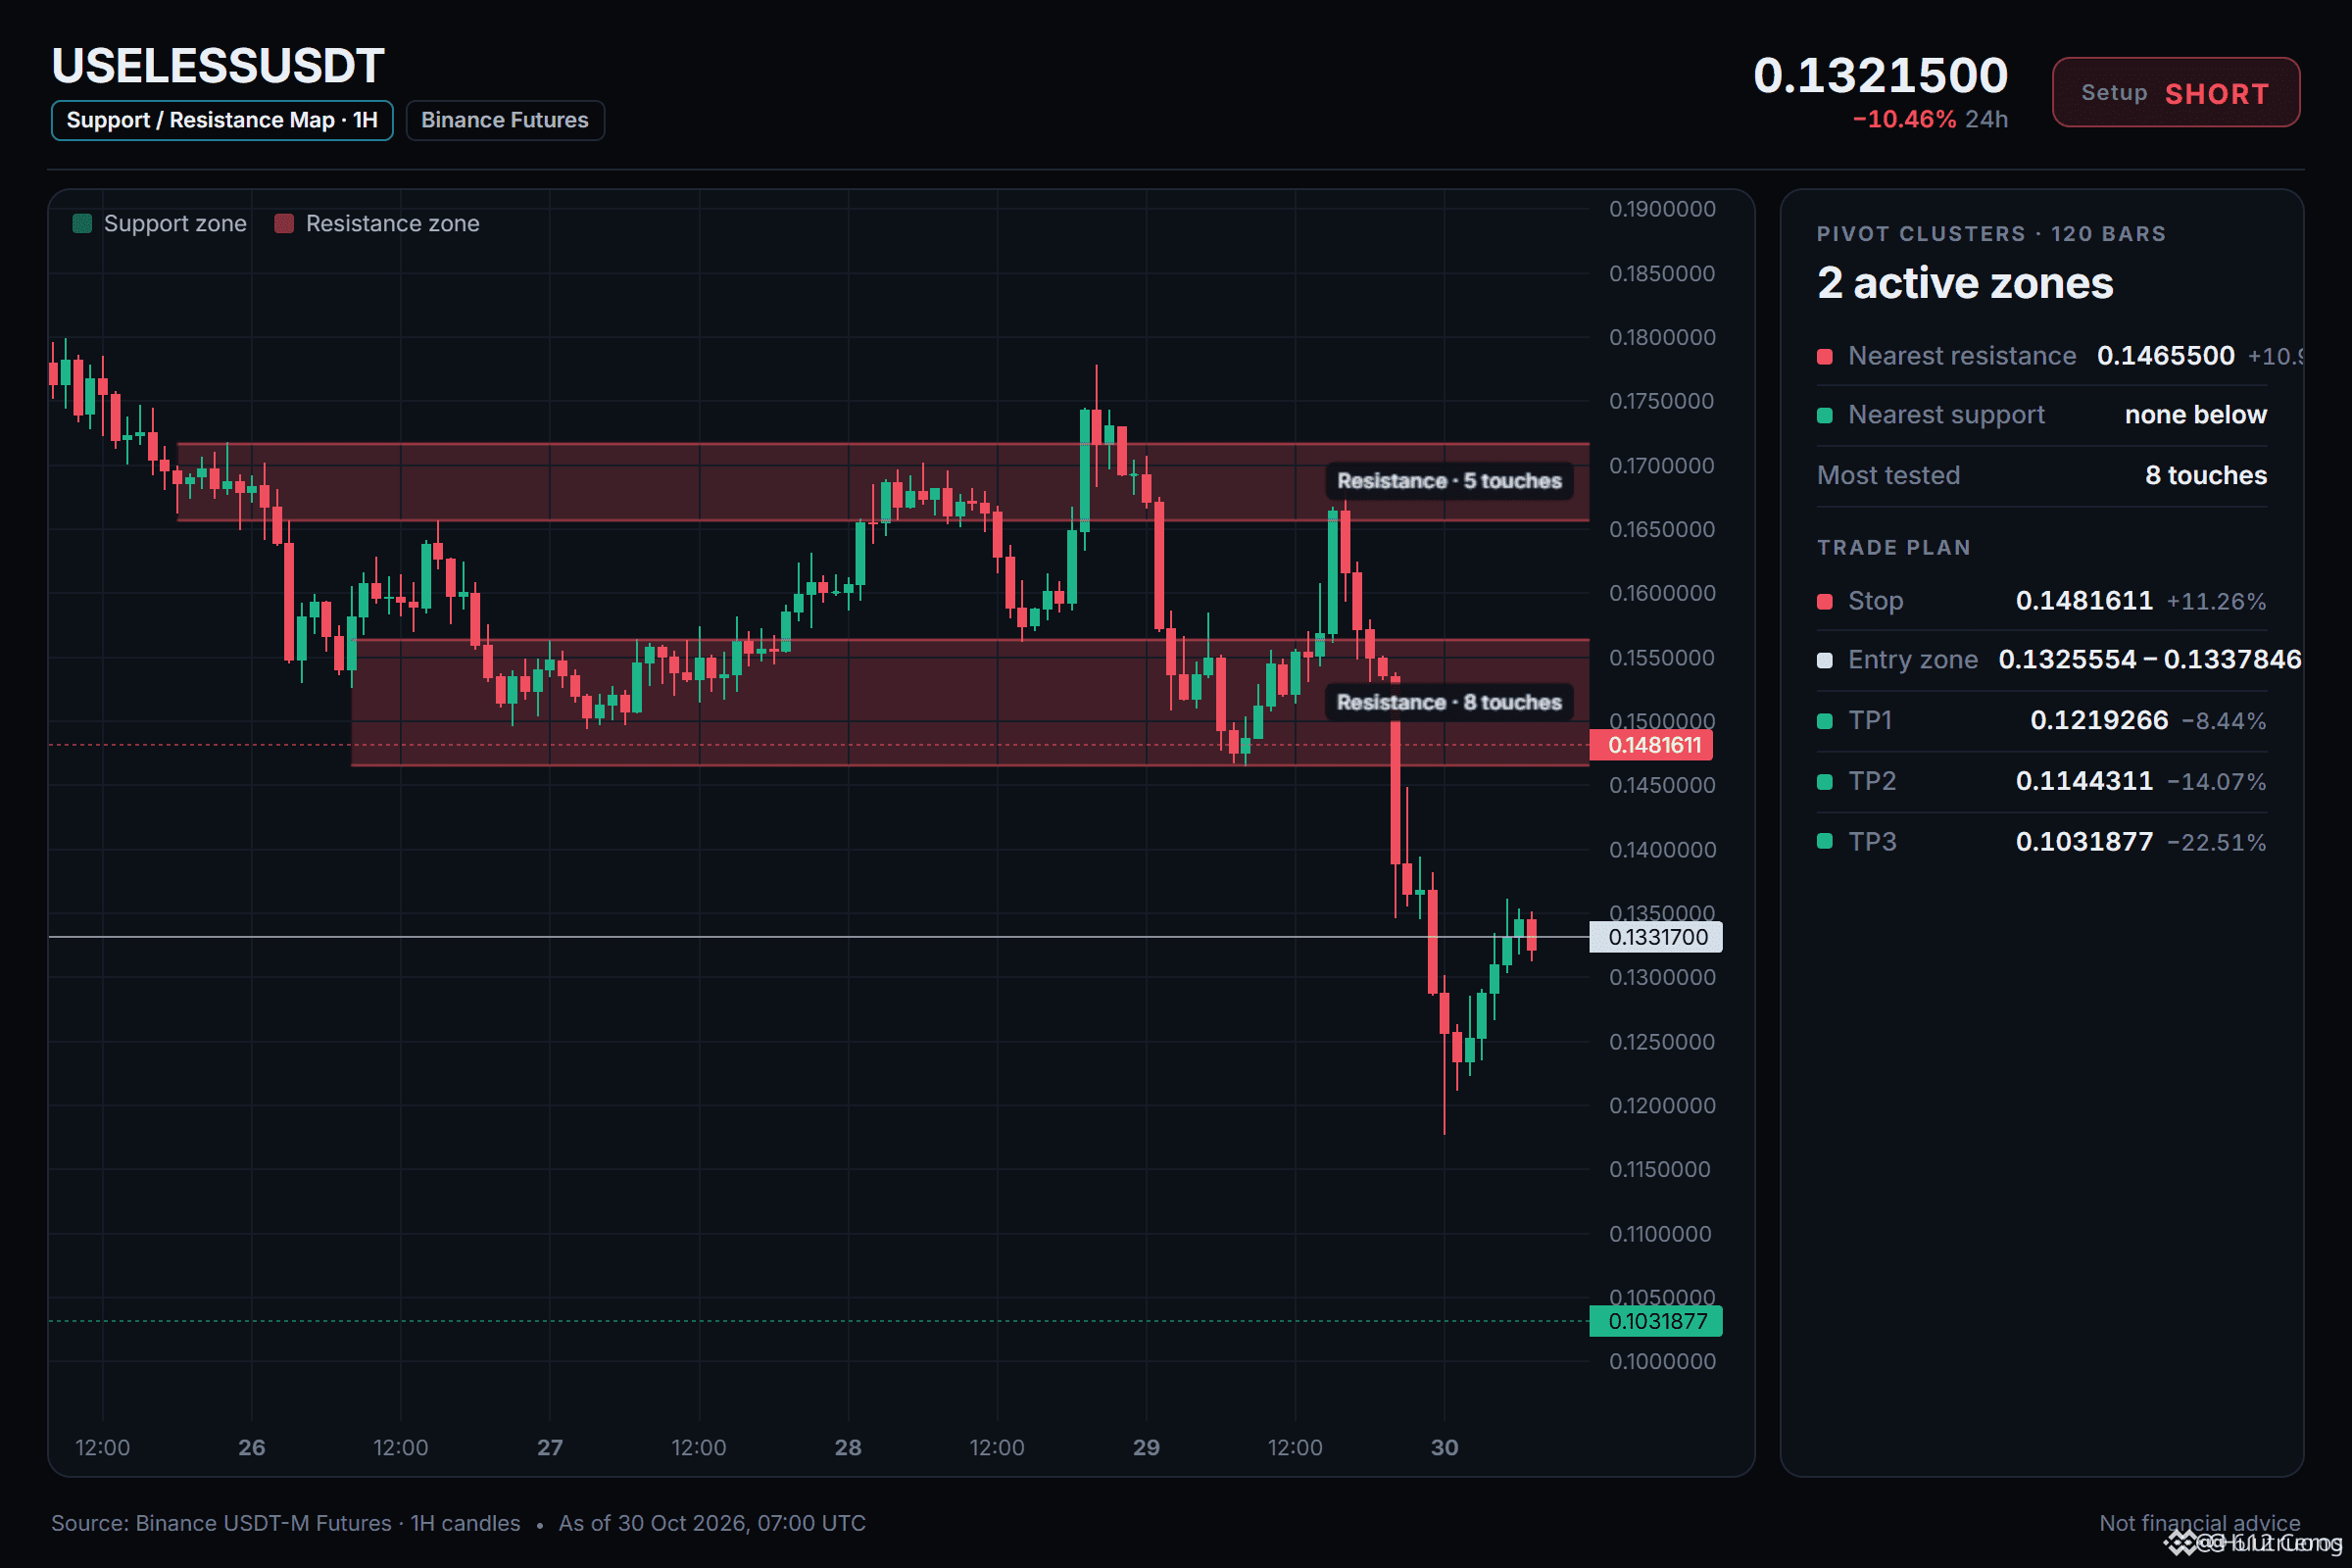
🔴 SHORT $USELESS /USDT: expecting price to go DOWN
Bias: SHORT · Strong
Entry: 0.1325554 – 0.1337846
TP1: 0.1219266 (-8.4%)
TP2: 0.1144311 (-14.1%)
TP3: 0.1031877 (-22.5%)
SL: 0.1481611 (+11.3%)
Plan: enter only inside the zone, close 50% at TP1, 25% at TP2, 25% at TP3, and move the stop to entry after TP1.
4h bearish stack intact while daily trend is range.
Why SHORT? 6/12 signals agree, 0 against.
• 4h trend down (below EMA50 & EMA200)
• 1h trend down (below EMA50 & EMA200)
• BTC is falling, this coin follows (corr 0.89)
The 1h price sits below the 1h EMA50 and EMA200 with bearish stack, and 4h RSI at 38.3 shows sellers have the momentum.
Where is your invalidation level against this short?
🔴 SHORT $USELESS /USDT: expecting price to go DOWN
Bias: SHORT · Strong
Entry: 0.1325554 – 0.1337846
TP1: 0.1219266 (-8.4%)
TP2: 0.1144311 (-14.1%)
TP3: 0.1031877 (-22.5%)
SL: 0.1481611 (+11.3%)
Plan: enter only inside the zone, close 50% at TP1, 25% at TP2, 25% at TP3, and move the stop to entry after TP1.
4h bearish stack intact while daily trend is range.
Why SHORT? 6/12 signals agree, 0 against.
• 4h trend down (below EMA50 & EMA200)
• 1h trend down (below EMA50 & EMA200)
• BTC is falling, this coin follows (corr 0.89)
The 1h price sits below the 1h EMA50 and EMA200 with bearish stack, and 4h RSI at 38.3 shows sellers have the momentum.
Where is your invalidation level against this short?
Bias: SHORT · Strong
Entry: 0.1325554 – 0.1337846
TP1: 0.1219266 (-8.4%)
TP2: 0.1144311 (-14.1%)
TP3: 0.1031877 (-22.5%)
SL: 0.1481611 (+11.3%)
Plan: enter only inside the zone, close 50% at TP1, 25% at TP2, 25% at TP3, and move the stop to entry after TP1.
4h bearish stack intact while daily trend is range.
Why SHORT? 6/12 signals agree, 0 against.
• 4h trend down (below EMA50 & EMA200)
• 1h trend down (below EMA50 & EMA200)
• BTC is falling, this coin follows (corr 0.89)
The 1h price sits below the 1h EMA50 and EMA200 with bearish stack, and 4h RSI at 38.3 shows sellers have the momentum.
Where is your invalidation level against this short?
5
·
--
Bajista
Ver traducción
🔴 BÁN KHỐNG $USELESS /USDT: dự đoán giá sẽ GIẢM
Xu hướng: BÁN KHỐNG · Mạnh
Điểm vào: 0.1325554 – 0.1337846
TP1: 0.1219266 (-8.4%)
TP2: 0.1144311 (-14.1%)
TP3: 0.1031877 (-22.5%)
Cắt lỗ: 0.1481611 (+11.3%)
Kế hoạch: chỉ vào lệnh trong vùng này, chốt 50% tại TP1, 25% tại TP2, 25% tại TP3 và dời mức cắt lỗ về điểm vào lệnh sau TP1.
Cấu trúc giảm giá trên khung 4 giờ vẫn nguyên vẹn, trong khi xu hướng ngày đang đi ngang trong vùng giá.
Vì sao BÁN KHỐNG? 6/12 tín hiệu đồng thuận, 0 tín hiệu phản đối.
• Xu hướng 4 giờ giảm (giá dưới EMA50 và EMA200)
• Xu hướng 1 giờ giảm (giá dưới EMA50 và EMA200)
• BTC đang giảm, đồng coin này đi theo (tương quan 0.89)
Giá trên khung 1 giờ nằm dưới EMA50 và EMA200, với cấu trúc xếp chồng giảm giá; RSI 4 giờ ở mức 38.3 cho thấy phe bán đang chiếm ưu thế.
Mức giá nào sẽ khiến bạn xem nhận định bán khống này là không còn hiệu lực?
🔴 BÁN KHỐNG $USELESS /USDT: dự đoán giá sẽ GIẢM
Xu hướng: BÁN KHỐNG · Mạnh
Điểm vào: 0.1325554 – 0.1337846
TP1: 0.1219266 (-8.4%)
TP2: 0.1144311 (-14.1%)
TP3: 0.1031877 (-22.5%)
Cắt lỗ: 0.1481611 (+11.3%)
Kế hoạch: chỉ vào lệnh trong vùng này, chốt 50% tại TP1, 25% tại TP2, 25% tại TP3 và dời mức cắt lỗ về điểm vào lệnh sau TP1.
Cấu trúc giảm giá trên khung 4 giờ vẫn nguyên vẹn, trong khi xu hướng ngày đang đi ngang trong vùng giá.
Vì sao BÁN KHỐNG? 6/12 tín hiệu đồng thuận, 0 tín hiệu phản đối.
• Xu hướng 4 giờ giảm (giá dưới EMA50 và EMA200)
• Xu hướng 1 giờ giảm (giá dưới EMA50 và EMA200)
• BTC đang giảm, đồng coin này đi theo (tương quan 0.89)
Giá trên khung 1 giờ nằm dưới EMA50 và EMA200, với cấu trúc xếp chồng giảm giá; RSI 4 giờ ở mức 38.3 cho thấy phe bán đang chiếm ưu thế.
Mức giá nào sẽ khiến bạn xem nhận định bán khống này là không còn hiệu lực?
Xu hướng: BÁN KHỐNG · Mạnh
Điểm vào: 0.1325554 – 0.1337846
TP1: 0.1219266 (-8.4%)
TP2: 0.1144311 (-14.1%)
TP3: 0.1031877 (-22.5%)
Cắt lỗ: 0.1481611 (+11.3%)
Kế hoạch: chỉ vào lệnh trong vùng này, chốt 50% tại TP1, 25% tại TP2, 25% tại TP3 và dời mức cắt lỗ về điểm vào lệnh sau TP1.
Cấu trúc giảm giá trên khung 4 giờ vẫn nguyên vẹn, trong khi xu hướng ngày đang đi ngang trong vùng giá.
Vì sao BÁN KHỐNG? 6/12 tín hiệu đồng thuận, 0 tín hiệu phản đối.
• Xu hướng 4 giờ giảm (giá dưới EMA50 và EMA200)
• Xu hướng 1 giờ giảm (giá dưới EMA50 và EMA200)
• BTC đang giảm, đồng coin này đi theo (tương quan 0.89)
Giá trên khung 1 giờ nằm dưới EMA50 và EMA200, với cấu trúc xếp chồng giảm giá; RSI 4 giờ ở mức 38.3 cho thấy phe bán đang chiếm ưu thế.
Mức giá nào sẽ khiến bạn xem nhận định bán khống này là không còn hiệu lực?
40
·
--
Bajista
Ver traducción
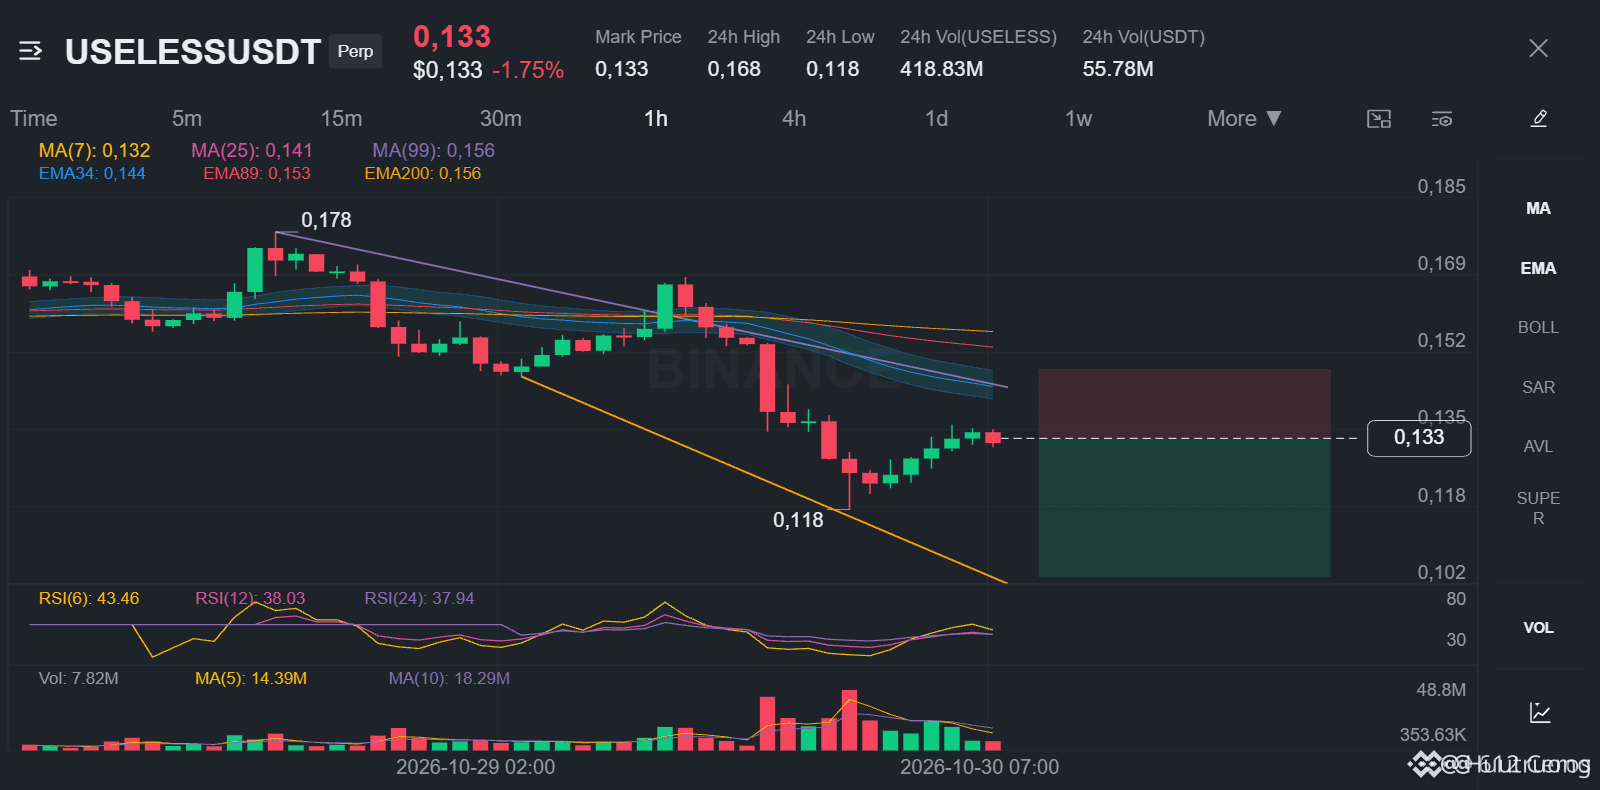
🔴 SHORT $USELESS /USDT: expecting price to go DOWN
Bias: SHORT · Strong
Entry: 0.1325554 – 0.1337846
TP1: 0.1219266 (-8.4%)
TP2: 0.1144311 (-14.1%)
TP3: 0.1031877 (-22.5%)
SL: 0.1481611 (+11.3%)
Plan: enter only inside the zone, close 50% at TP1, 25% at TP2, 25% at TP3, and move the stop to entry after TP1.
4h bearish stack intact while daily trend is range.
Why SHORT? 6/12 signals agree, 0 against.
• 4h trend down (below EMA50 & EMA200)
• 1h trend down (below EMA50 & EMA200)
• BTC is falling, this coin follows (corr 0.89)
The 1h price sits below the 1h EMA50 and EMA200 with bearish stack, and 4h RSI at 38.3 shows sellers have the momentum.
Where is your invalidation level against this short?
🔴 SHORT $USELESS /USDT: expecting price to go DOWN
Bias: SHORT · Strong
Entry: 0.1325554 – 0.1337846
TP1: 0.1219266 (-8.4%)
TP2: 0.1144311 (-14.1%)
TP3: 0.1031877 (-22.5%)
SL: 0.1481611 (+11.3%)
Plan: enter only inside the zone, close 50% at TP1, 25% at TP2, 25% at TP3, and move the stop to entry after TP1.
4h bearish stack intact while daily trend is range.
Why SHORT? 6/12 signals agree, 0 against.
• 4h trend down (below EMA50 & EMA200)
• 1h trend down (below EMA50 & EMA200)
• BTC is falling, this coin follows (corr 0.89)
The 1h price sits below the 1h EMA50 and EMA200 with bearish stack, and 4h RSI at 38.3 shows sellers have the momentum.
Where is your invalidation level against this short?
Bias: SHORT · Strong
Entry: 0.1325554 – 0.1337846
TP1: 0.1219266 (-8.4%)
TP2: 0.1144311 (-14.1%)
TP3: 0.1031877 (-22.5%)
SL: 0.1481611 (+11.3%)
Plan: enter only inside the zone, close 50% at TP1, 25% at TP2, 25% at TP3, and move the stop to entry after TP1.
4h bearish stack intact while daily trend is range.
Why SHORT? 6/12 signals agree, 0 against.
• 4h trend down (below EMA50 & EMA200)
• 1h trend down (below EMA50 & EMA200)
• BTC is falling, this coin follows (corr 0.89)
The 1h price sits below the 1h EMA50 and EMA200 with bearish stack, and 4h RSI at 38.3 shows sellers have the momentum.
Where is your invalidation level against this short?
5
·
--
Bajista
Ver traducción
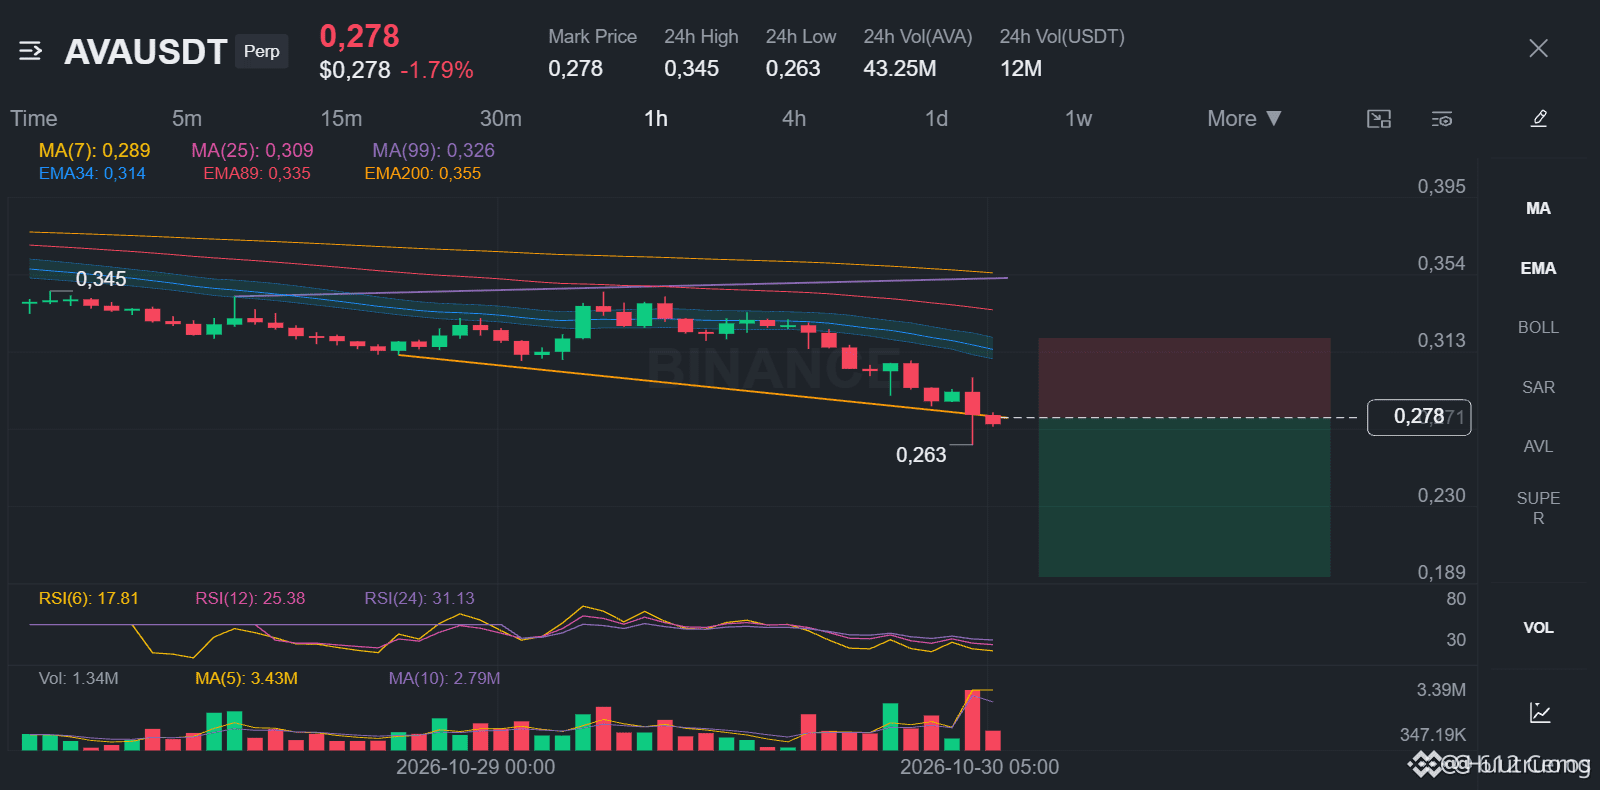
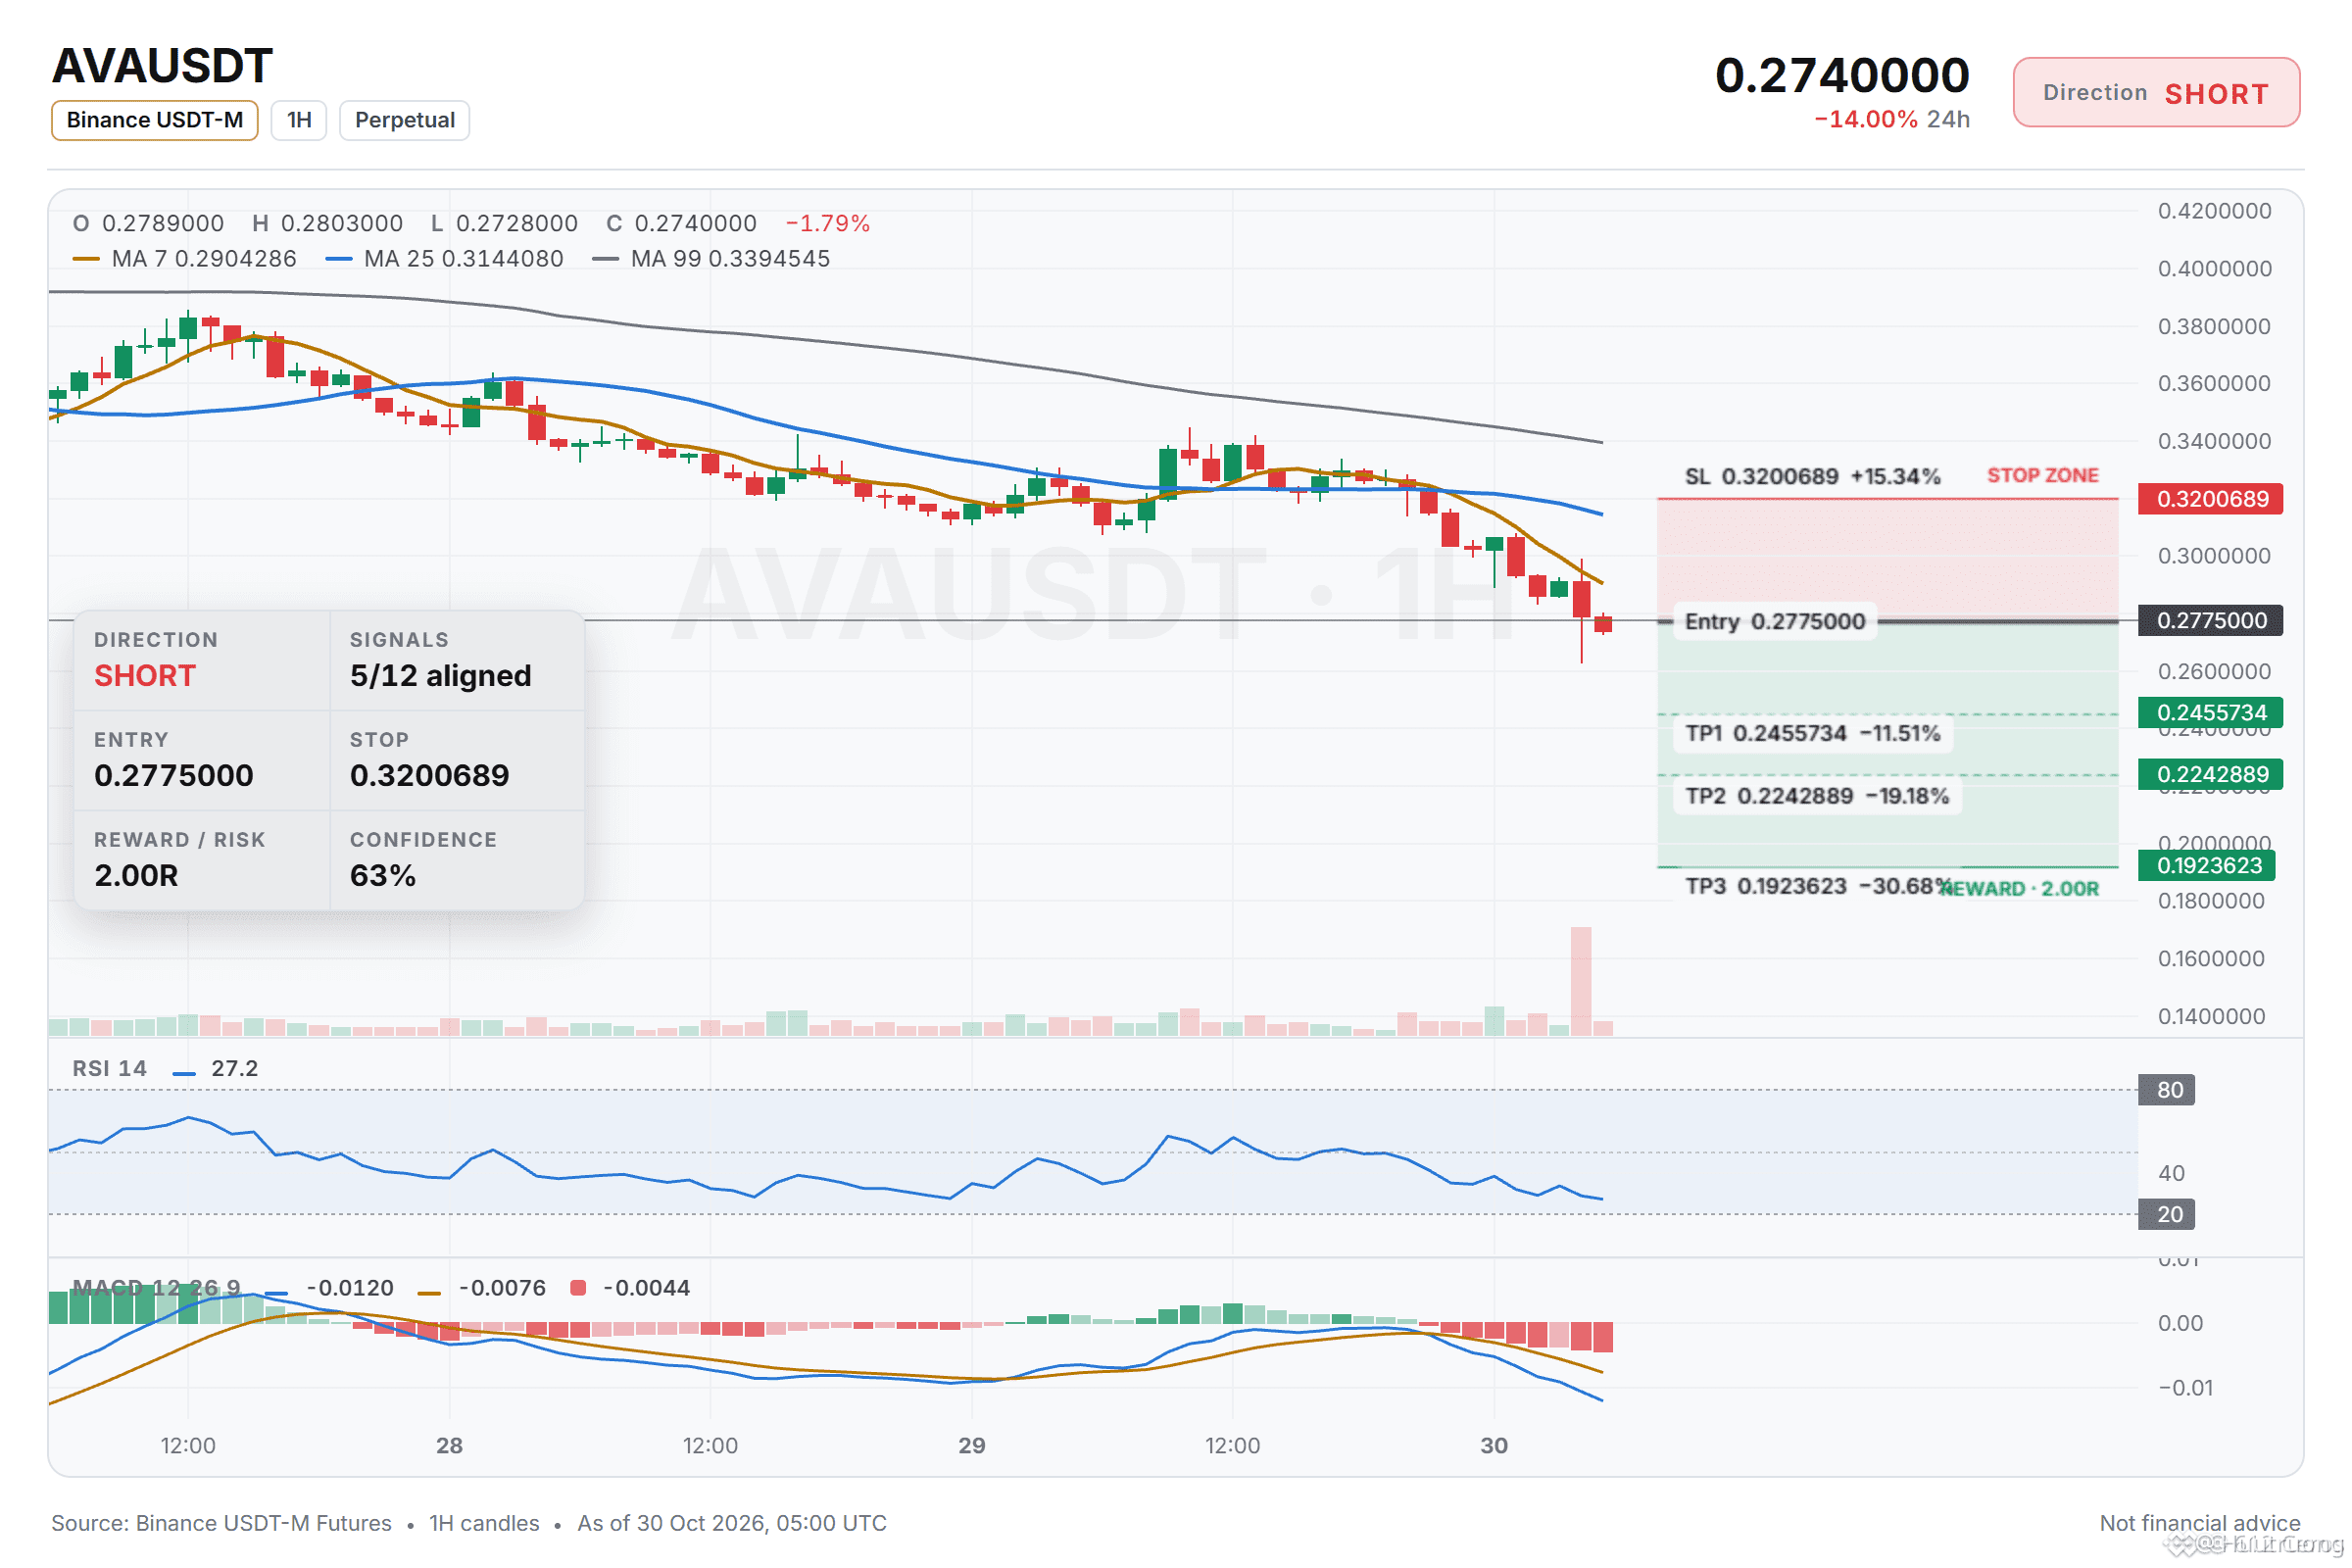
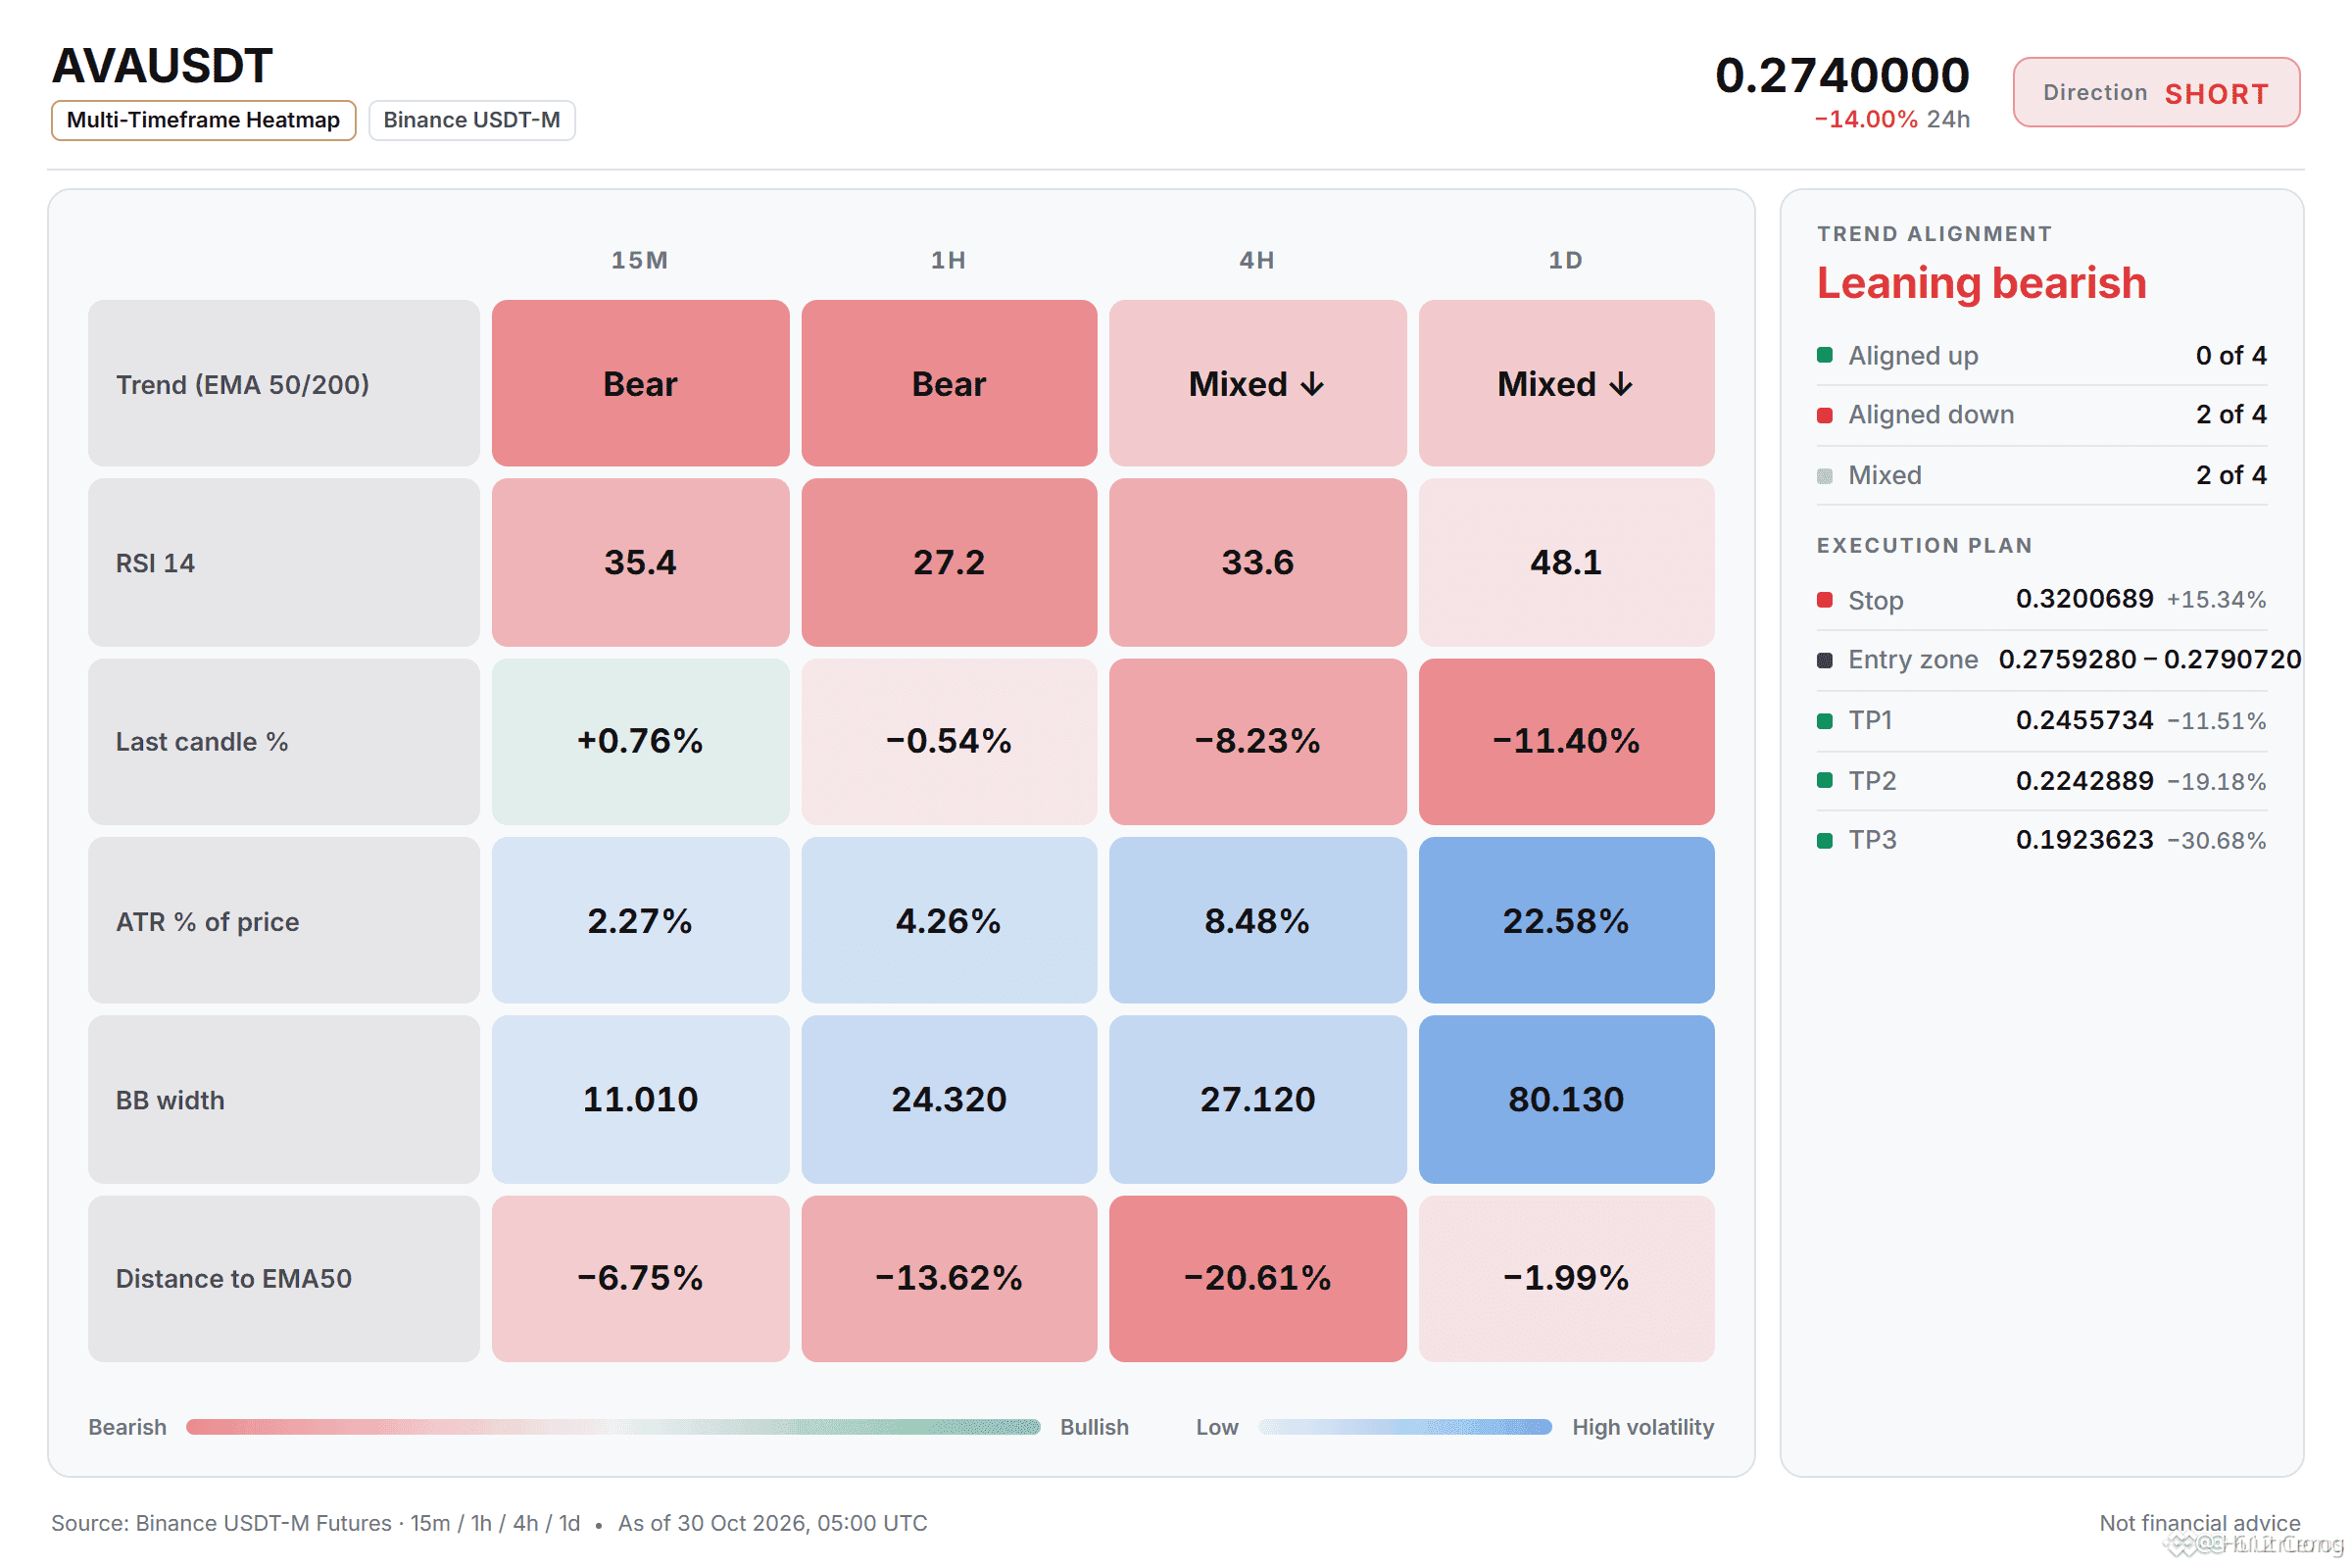
AVAs daily range breaks down but the stack still holds.
🔴 SHORT $AVA /USDT: expecting price to go DOWN
Bias: SHORT · Leaning
Entry: 0.2759280 – 0.2790720
TP1: 0.2455734 (-11.5%)
TP2: 0.2242889 (-19.2%)
TP3: 0.1923623 (-30.7%)
SL: 0.3200689 (+15.3%)
Plan: enter only inside the zone, close 50% at TP1, 25% at TP2, 25% at TP3, and move the stop to entry after TP1.
Note: moderate conviction only, keep size light.
Why SHORT? 5/12 signals agree, 1 against.
• 1h trend down (below EMA50 & EMA200)
• Sellers are driving the move (15m ADX 45.1)
• Sellers have the momentum (4h RSI 33.6)
Risk: Far below its average, bounce likely (−3.7 ATR from 1h EMA50)
Plan A:
Price should keep sliding toward the 1h EMA50 as the bearish stack drives sellers lower.
Plan B (invalidation):
A bounce back above the entry level would prove the short wrong, so I would exit.
Where do you take profits on a move like this?
AVAs daily range breaks down but the stack still holds.
🔴 SHORT $AVA /USDT: expecting price to go DOWN
Bias: SHORT · Leaning
Entry: 0.2759280 – 0.2790720
TP1: 0.2455734 (-11.5%)
TP2: 0.2242889 (-19.2%)
TP3: 0.1923623 (-30.7%)
SL: 0.3200689 (+15.3%)
Plan: enter only inside the zone, close 50% at TP1, 25% at TP2, 25% at TP3, and move the stop to entry after TP1.
Note: moderate conviction only, keep size light.
Why SHORT? 5/12 signals agree, 1 against.
• 1h trend down (below EMA50 & EMA200)
• Sellers are driving the move (15m ADX 45.1)
• Sellers have the momentum (4h RSI 33.6)
Risk: Far below its average, bounce likely (−3.7 ATR from 1h EMA50)
Plan A:
Price should keep sliding toward the 1h EMA50 as the bearish stack drives sellers lower.
Plan B (invalidation):
A bounce back above the entry level would prove the short wrong, so I would exit.
Where do you take profits on a move like this?
🔴 SHORT $AVA /USDT: expecting price to go DOWN
Bias: SHORT · Leaning
Entry: 0.2759280 – 0.2790720
TP1: 0.2455734 (-11.5%)
TP2: 0.2242889 (-19.2%)
TP3: 0.1923623 (-30.7%)
SL: 0.3200689 (+15.3%)
Plan: enter only inside the zone, close 50% at TP1, 25% at TP2, 25% at TP3, and move the stop to entry after TP1.
Note: moderate conviction only, keep size light.
Why SHORT? 5/12 signals agree, 1 against.
• 1h trend down (below EMA50 & EMA200)
• Sellers are driving the move (15m ADX 45.1)
• Sellers have the momentum (4h RSI 33.6)
Risk: Far below its average, bounce likely (−3.7 ATR from 1h EMA50)
Plan A:
Price should keep sliding toward the 1h EMA50 as the bearish stack drives sellers lower.
Plan B (invalidation):
A bounce back above the entry level would prove the short wrong, so I would exit.
Where do you take profits on a move like this?
6
·
--
Bajista
Ver traducción
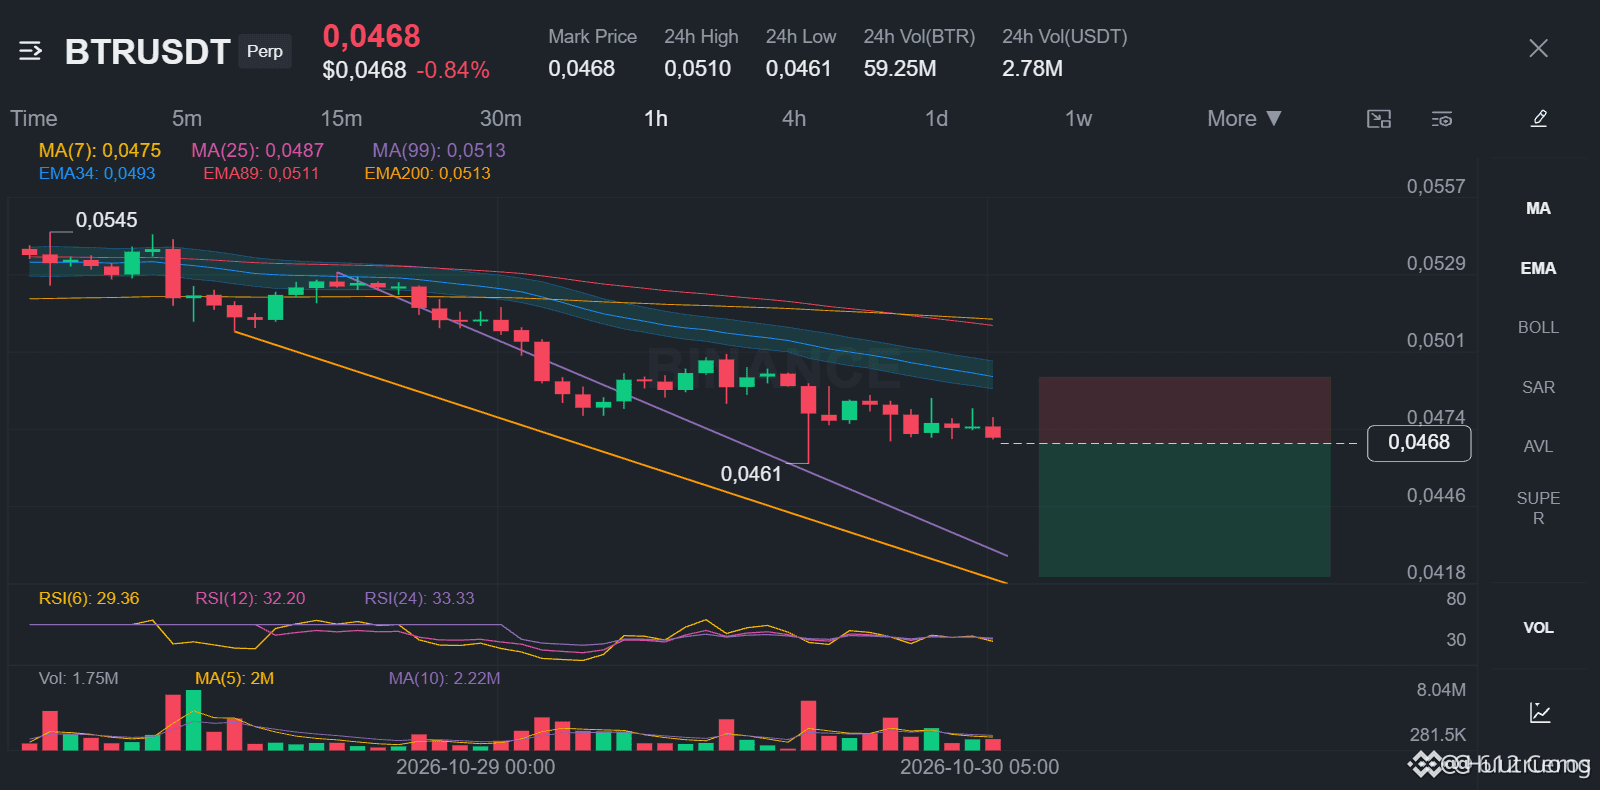
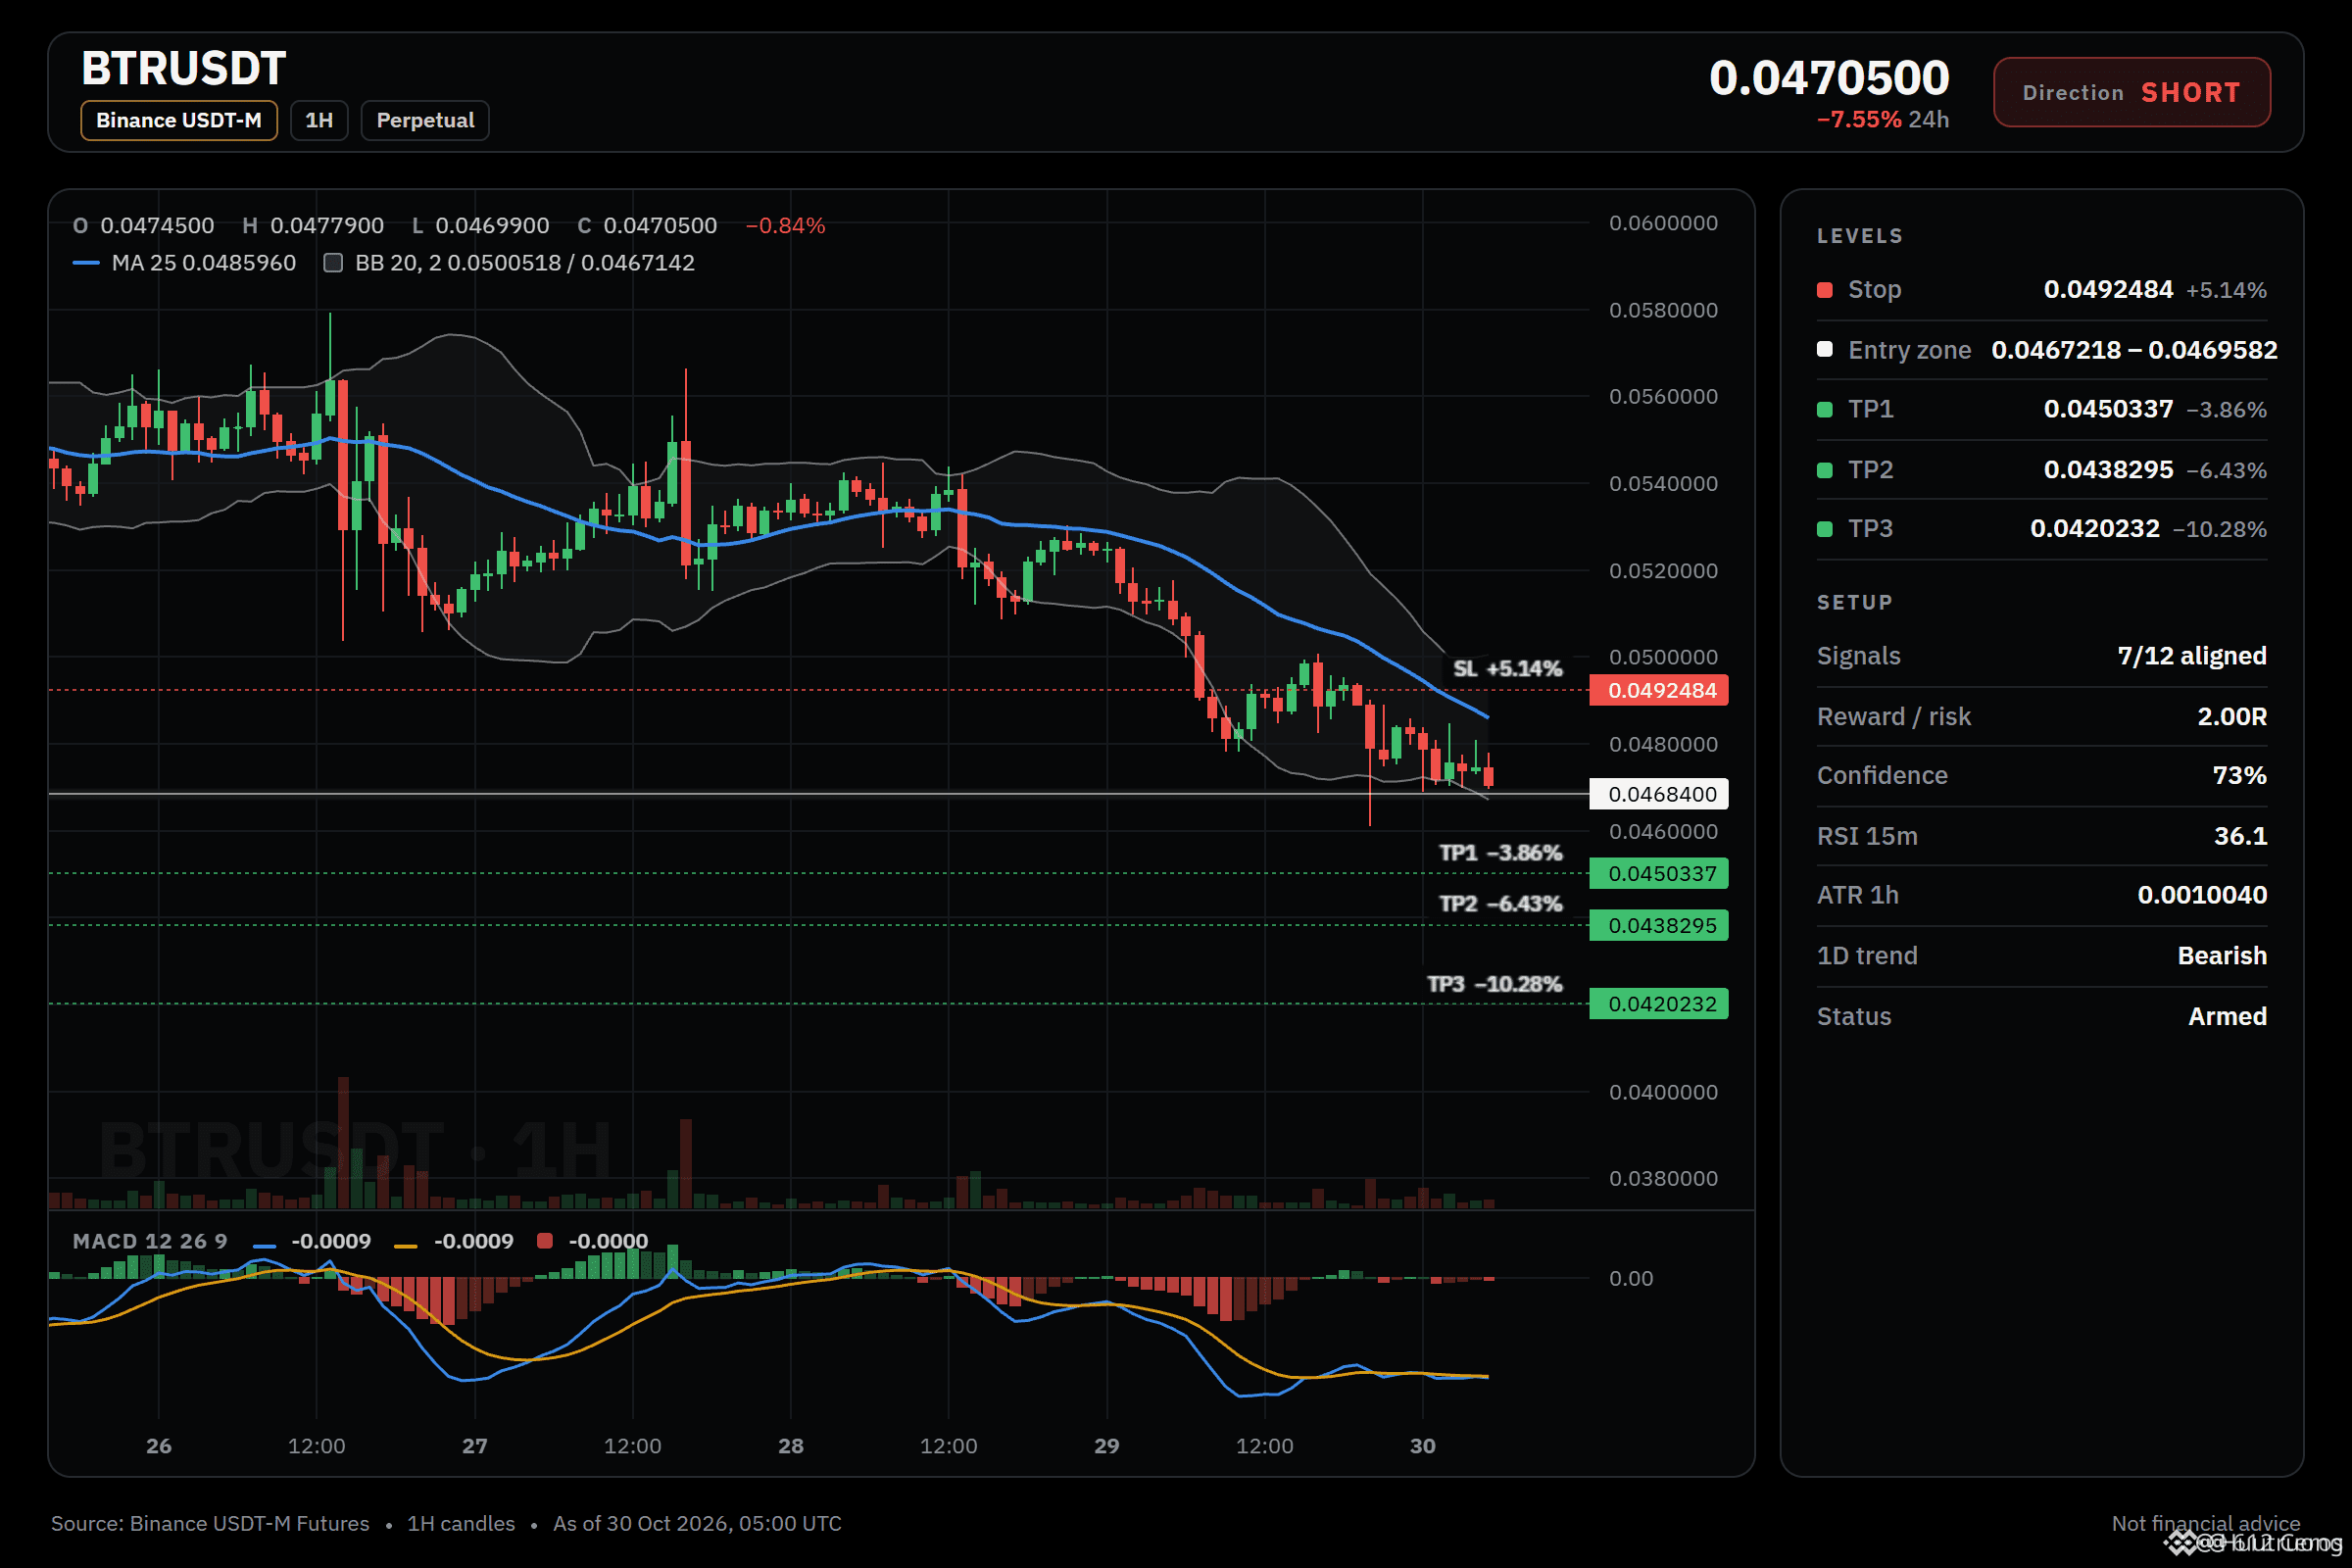
Bearish stack intact while the daily trend drags lower.
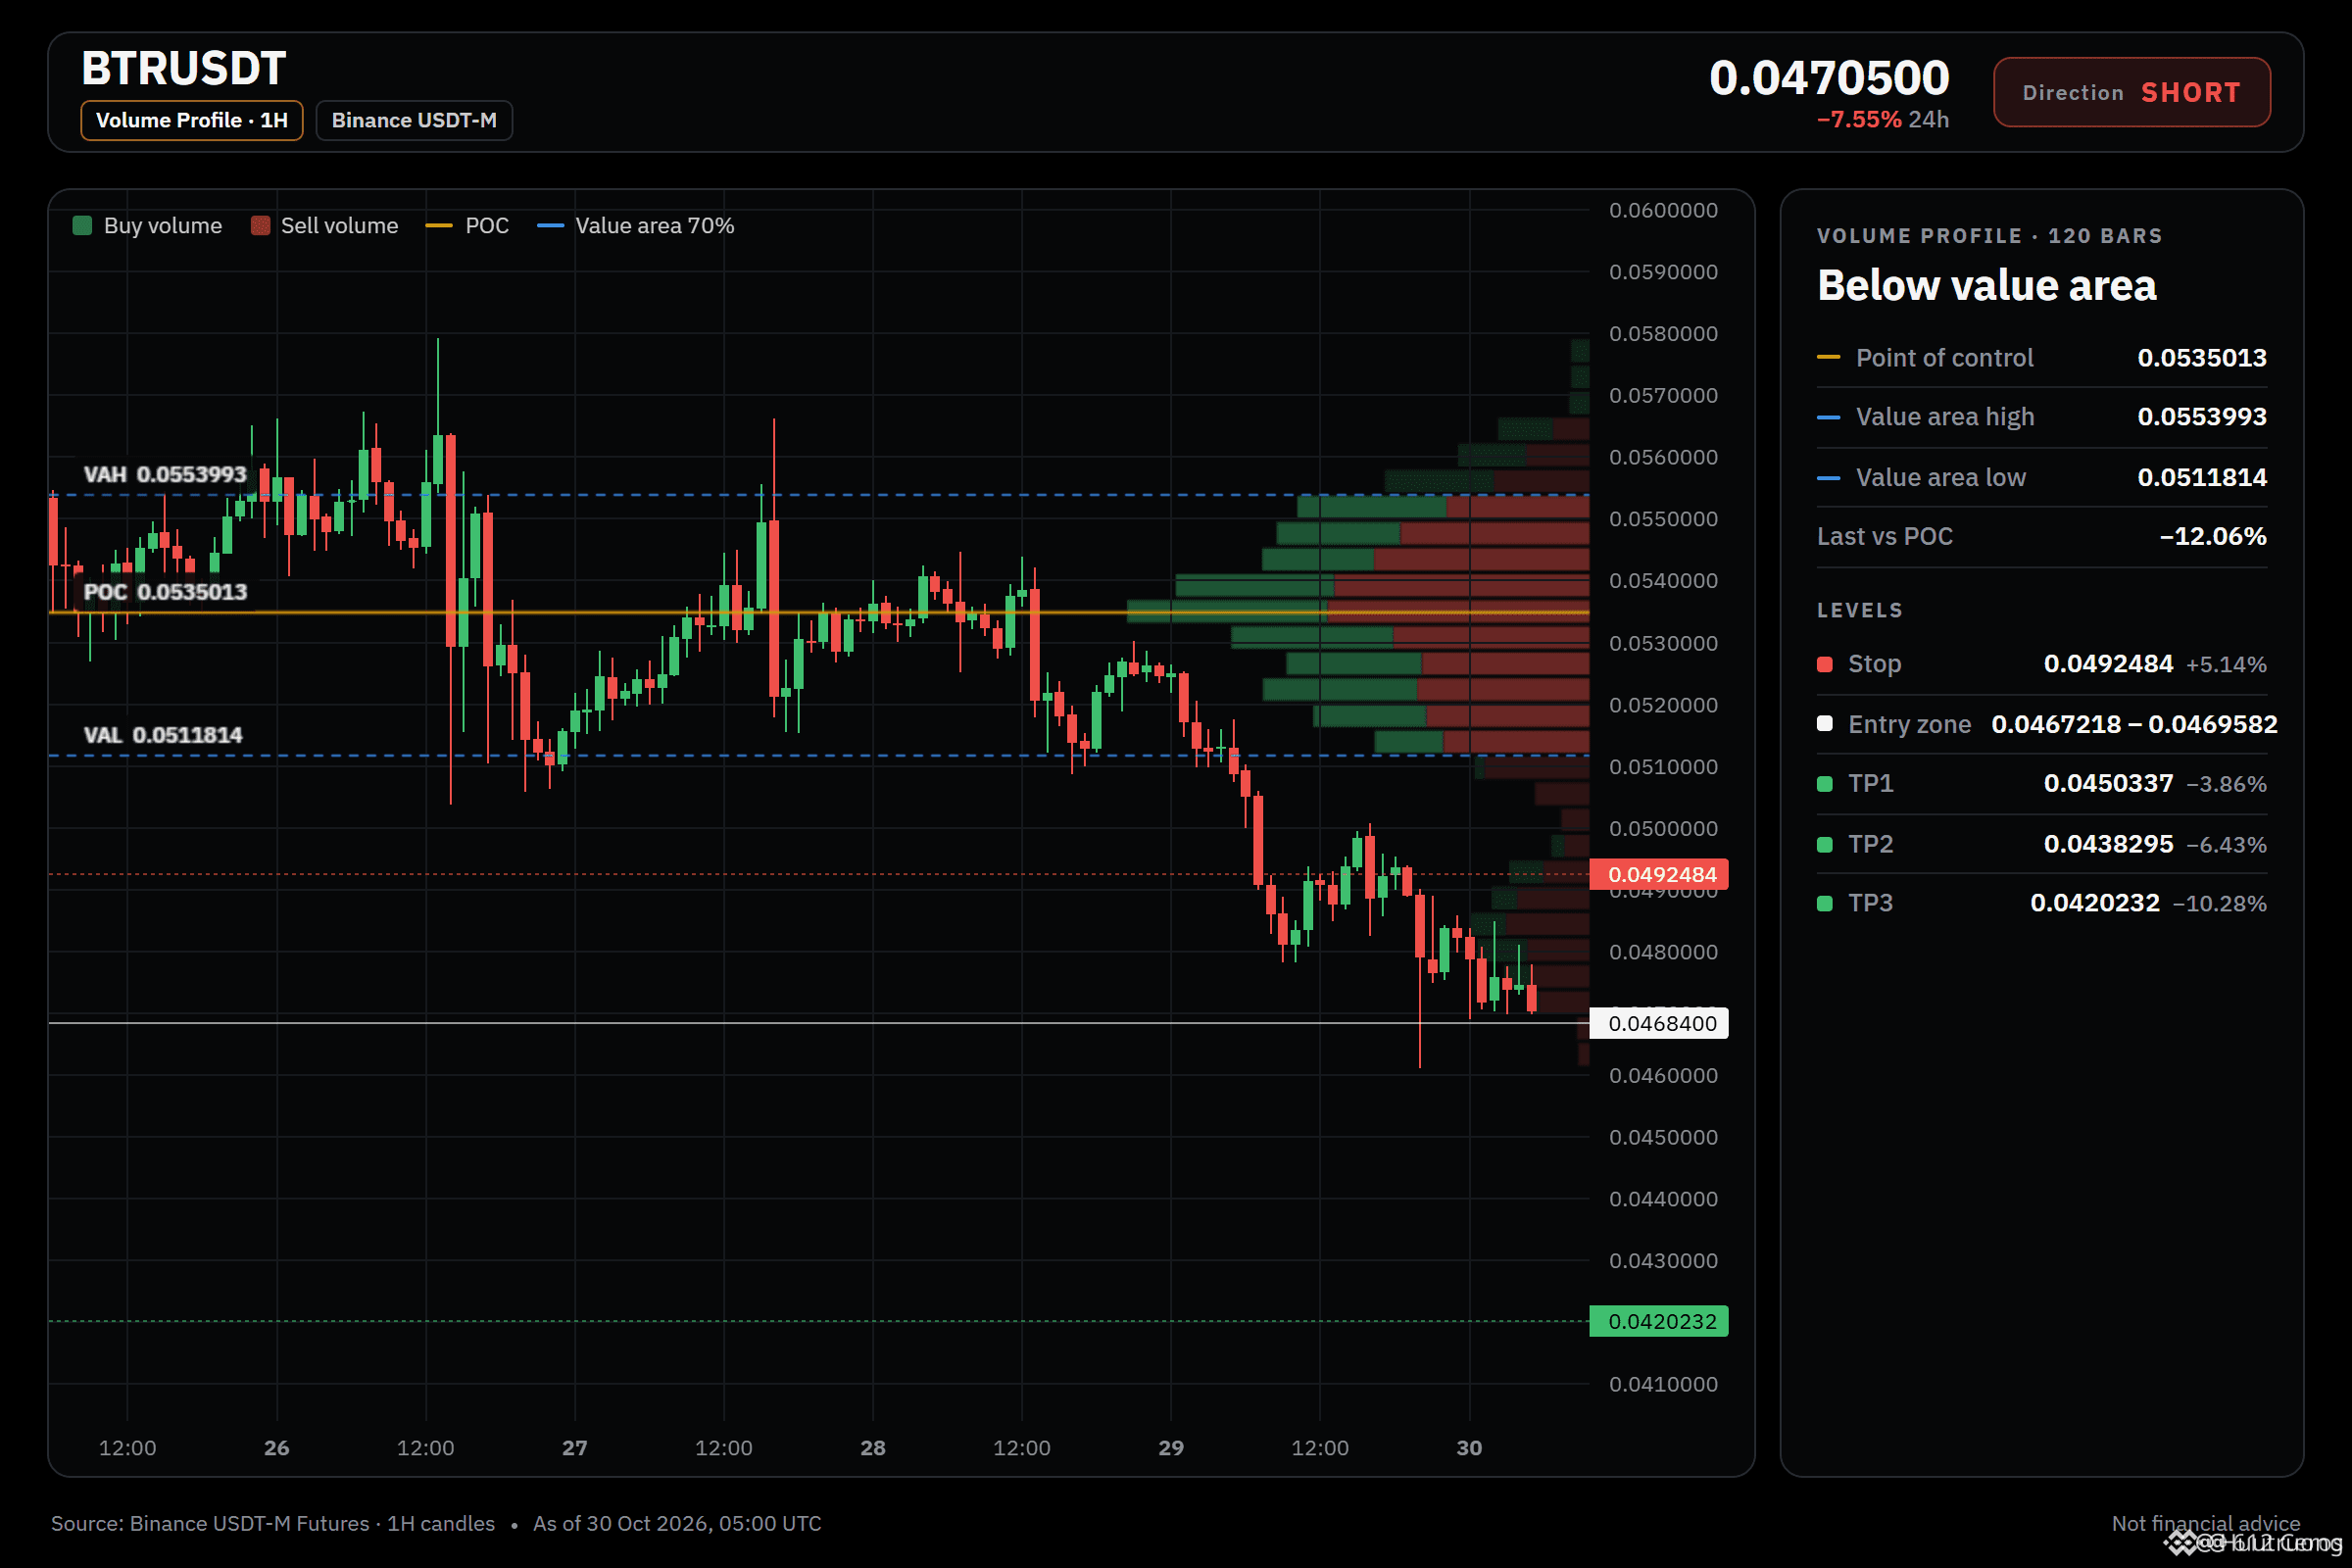
🔴 SHORT $BTR /USDT: expecting price to go DOWN
Bias: SHORT · Strong
Entry: 0.0467218 – 0.0469582
TP1: 0.0450337 (-3.9%)
TP2: 0.0438295 (-6.4%)
TP3: 0.0420232 (-10.3%)
SL: 0.0492484 (+5.1%)
Plan: enter only inside the zone, close 50% at TP1, 25% at TP2, 25% at TP3, and move the stop to entry after TP1.
Why SHORT? What I checked: 7/12 agree, 1 against.
• Daily trend down (below EMA50 & EMA200)
• 1h trend down (below EMA50 & EMA200)
• Sellers are driving the move (15m ADX 31.0)
Watch: Far below its average, bounce likely (−3.1 ATR from 1h EMA50)
Watch: The idea is wrong if price reaches the stop at 0.0492484
Verdict: The daily and 1h trends are both bearish with sellers in control, but the price is 3.1 ATR below its 1h average, so a bounce is likely.
Where would you place your short level on BTR ?
Bearish stack intact while the daily trend drags lower.
🔴 SHORT $BTR /USDT: expecting price to go DOWN
Bias: SHORT · Strong
Entry: 0.0467218 – 0.0469582
TP1: 0.0450337 (-3.9%)
TP2: 0.0438295 (-6.4%)
TP3: 0.0420232 (-10.3%)
SL: 0.0492484 (+5.1%)
Plan: enter only inside the zone, close 50% at TP1, 25% at TP2, 25% at TP3, and move the stop to entry after TP1.
Why SHORT? What I checked: 7/12 agree, 1 against.
• Daily trend down (below EMA50 & EMA200)
• 1h trend down (below EMA50 & EMA200)
• Sellers are driving the move (15m ADX 31.0)
Watch: Far below its average, bounce likely (−3.1 ATR from 1h EMA50)
Watch: The idea is wrong if price reaches the stop at 0.0492484
Verdict: The daily and 1h trends are both bearish with sellers in control, but the price is 3.1 ATR below its 1h average, so a bounce is likely.
Where would you place your short level on BTR ?
🔴 SHORT $BTR /USDT: expecting price to go DOWN
Bias: SHORT · Strong
Entry: 0.0467218 – 0.0469582
TP1: 0.0450337 (-3.9%)
TP2: 0.0438295 (-6.4%)
TP3: 0.0420232 (-10.3%)
SL: 0.0492484 (+5.1%)
Plan: enter only inside the zone, close 50% at TP1, 25% at TP2, 25% at TP3, and move the stop to entry after TP1.
Why SHORT? What I checked: 7/12 agree, 1 against.
• Daily trend down (below EMA50 & EMA200)
• 1h trend down (below EMA50 & EMA200)
• Sellers are driving the move (15m ADX 31.0)
Watch: Far below its average, bounce likely (−3.1 ATR from 1h EMA50)
Watch: The idea is wrong if price reaches the stop at 0.0492484
Verdict: The daily and 1h trends are both bearish with sellers in control, but the price is 3.1 ATR below its 1h average, so a bounce is likely.
Where would you place your short level on BTR ?
7
·
--
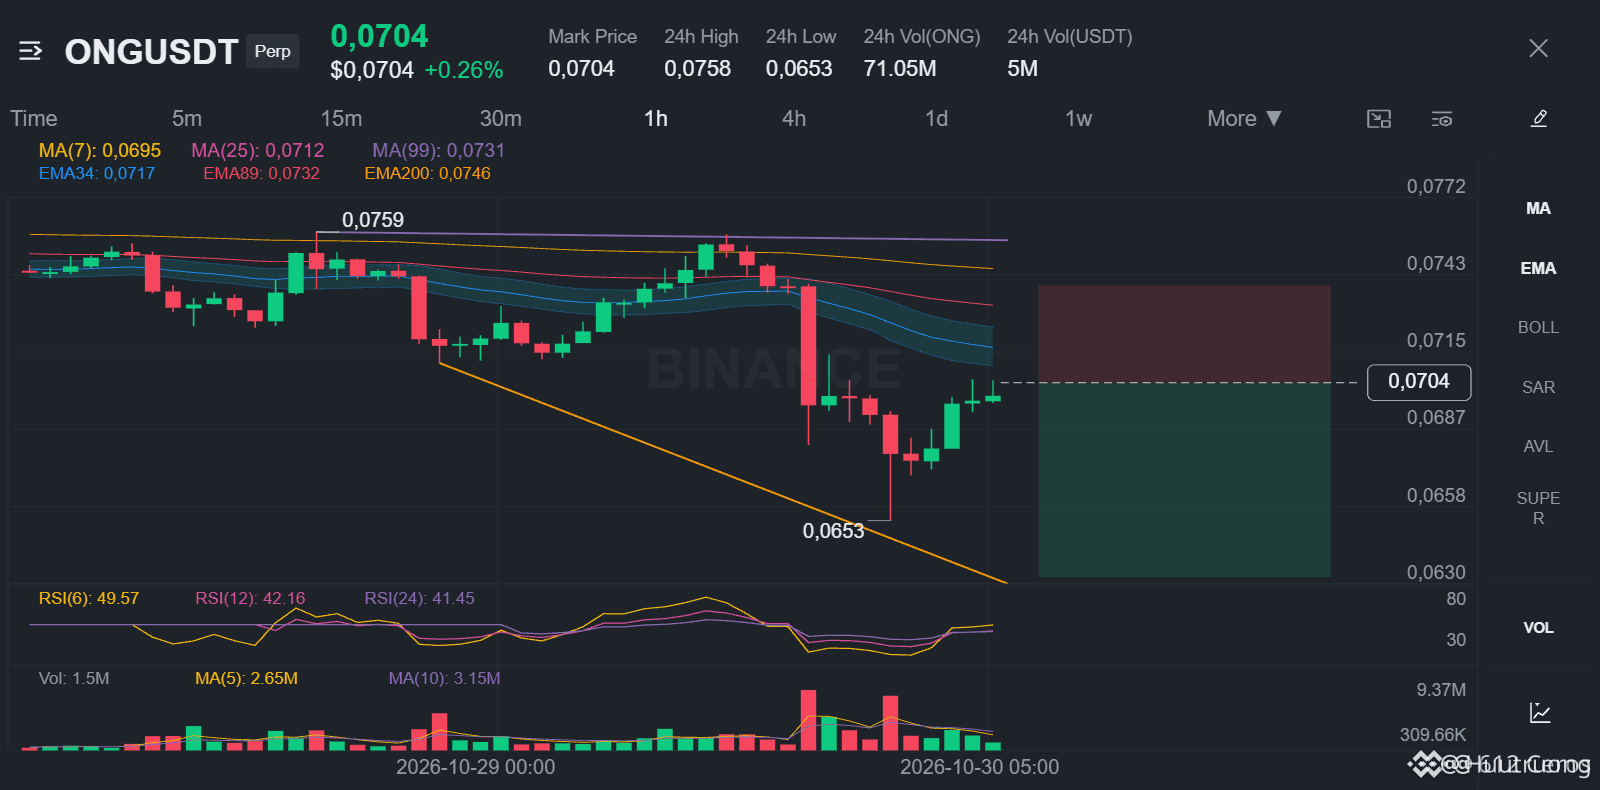
Bajista
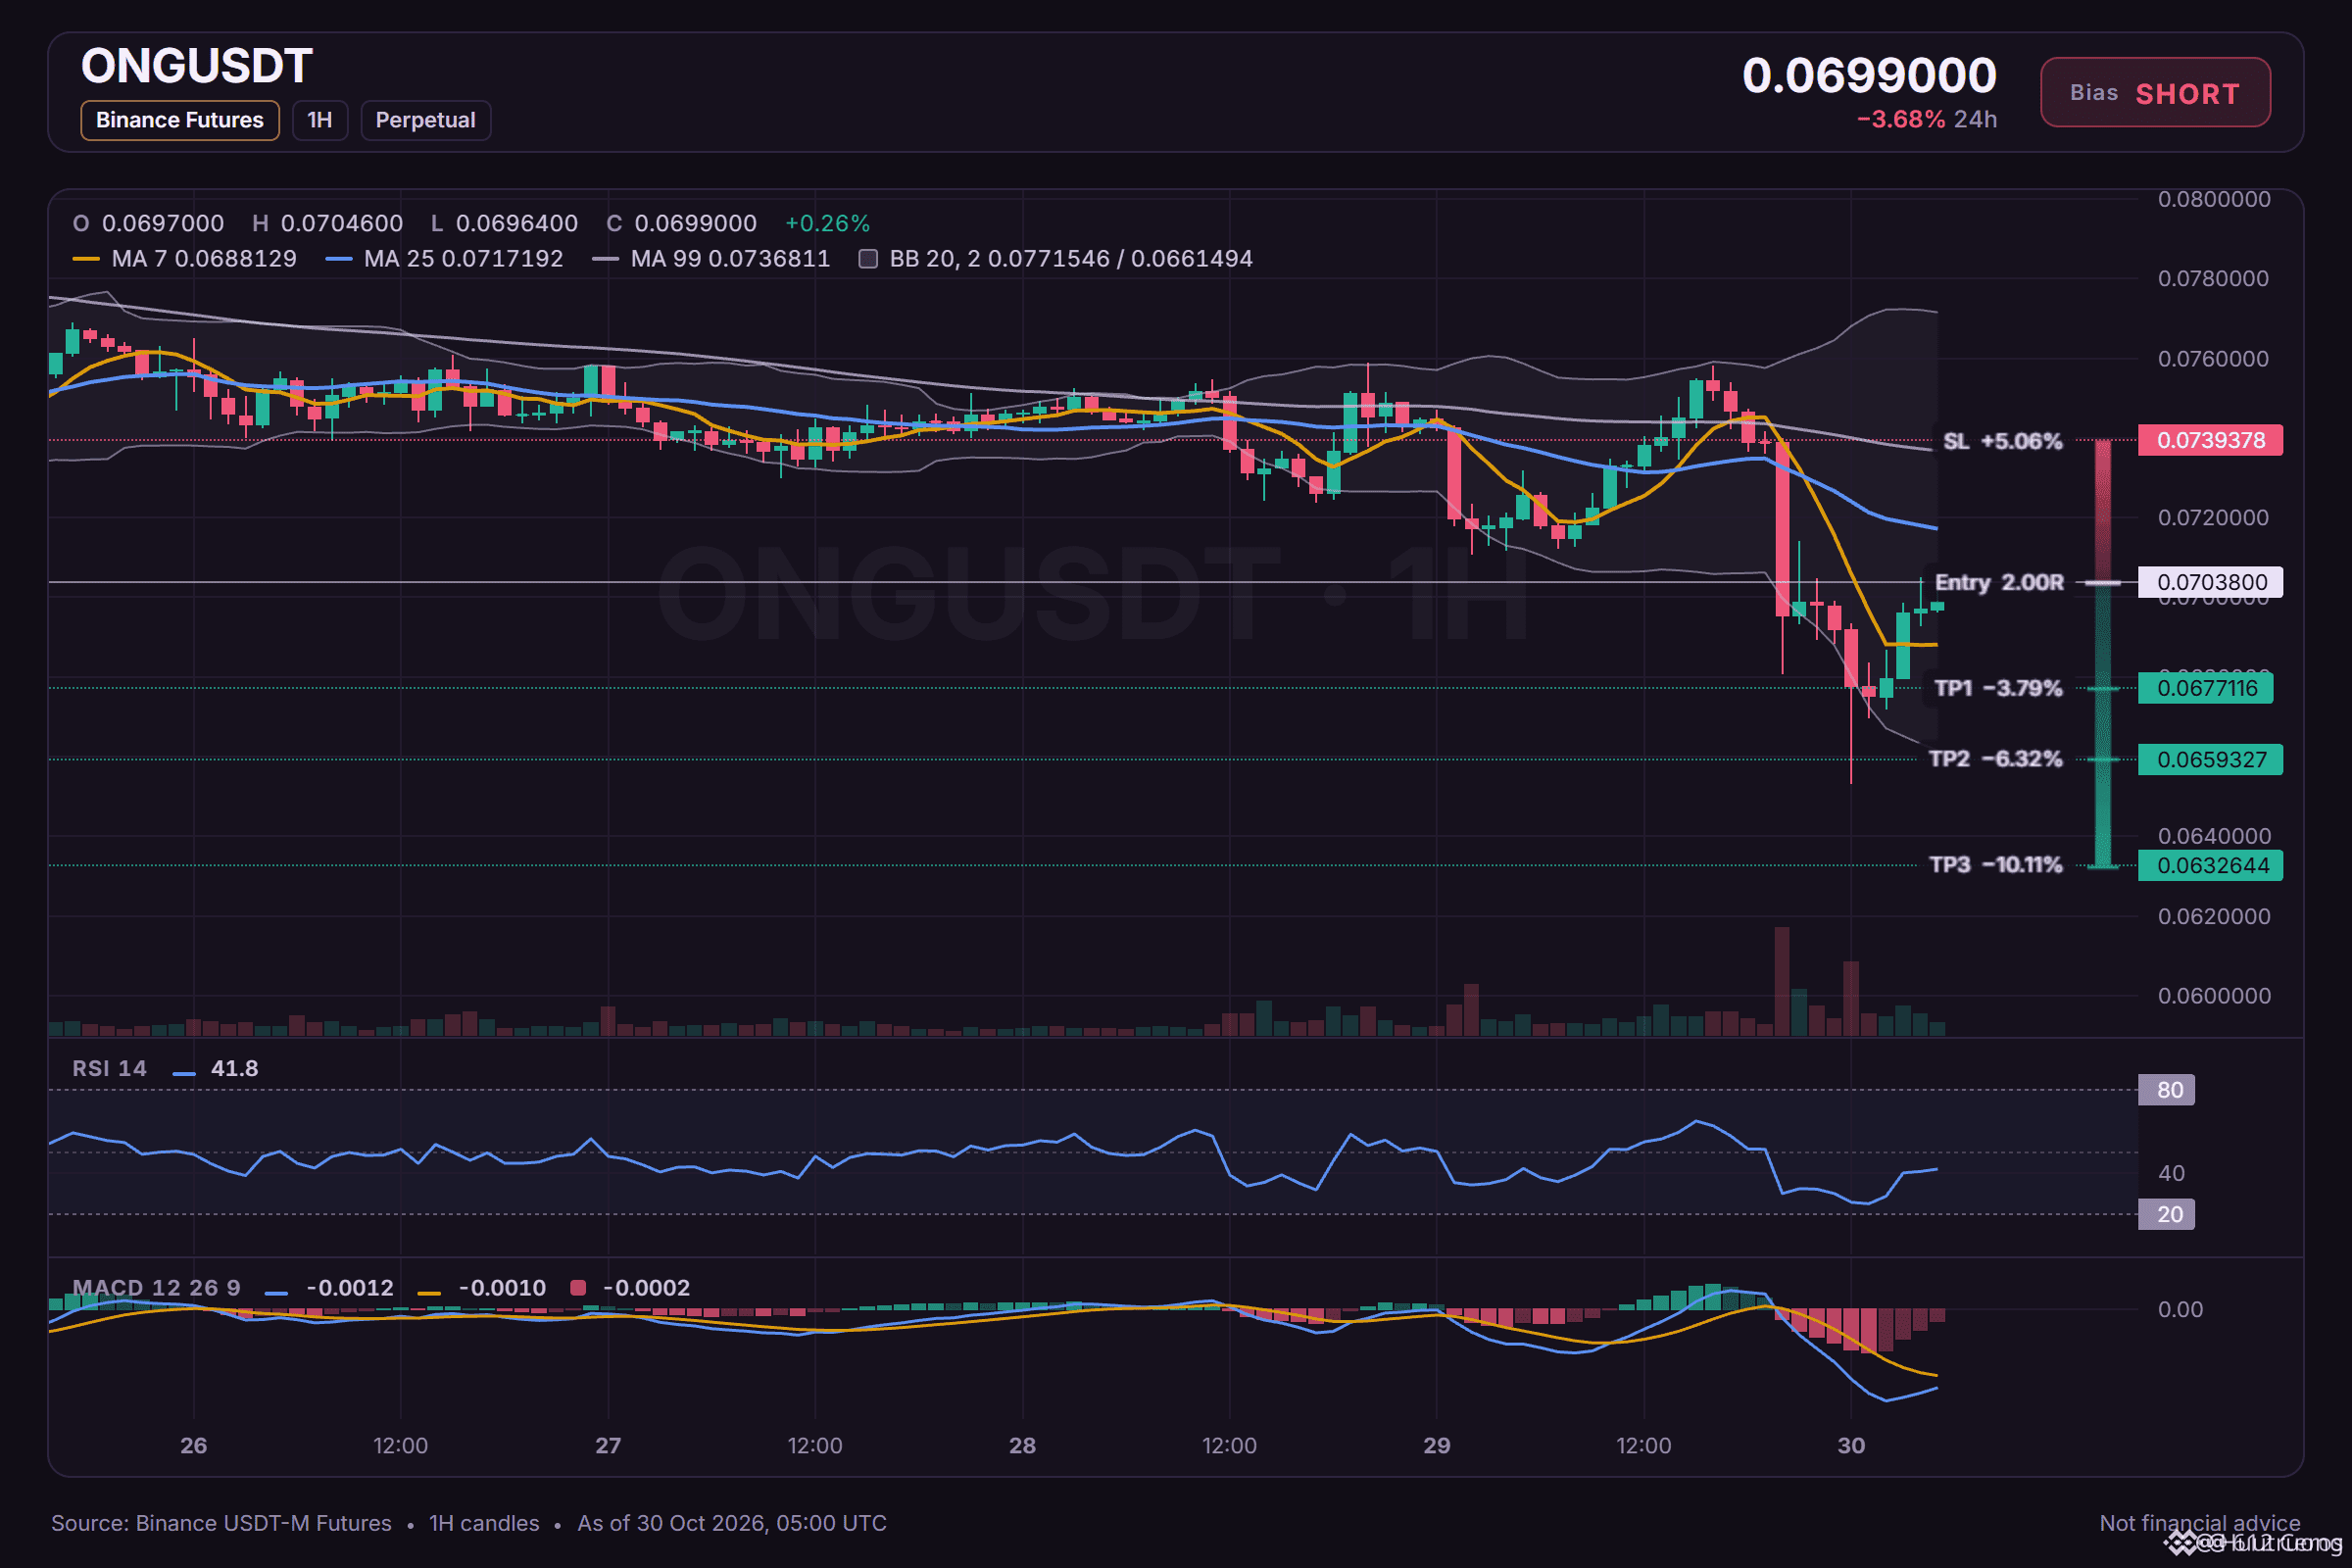
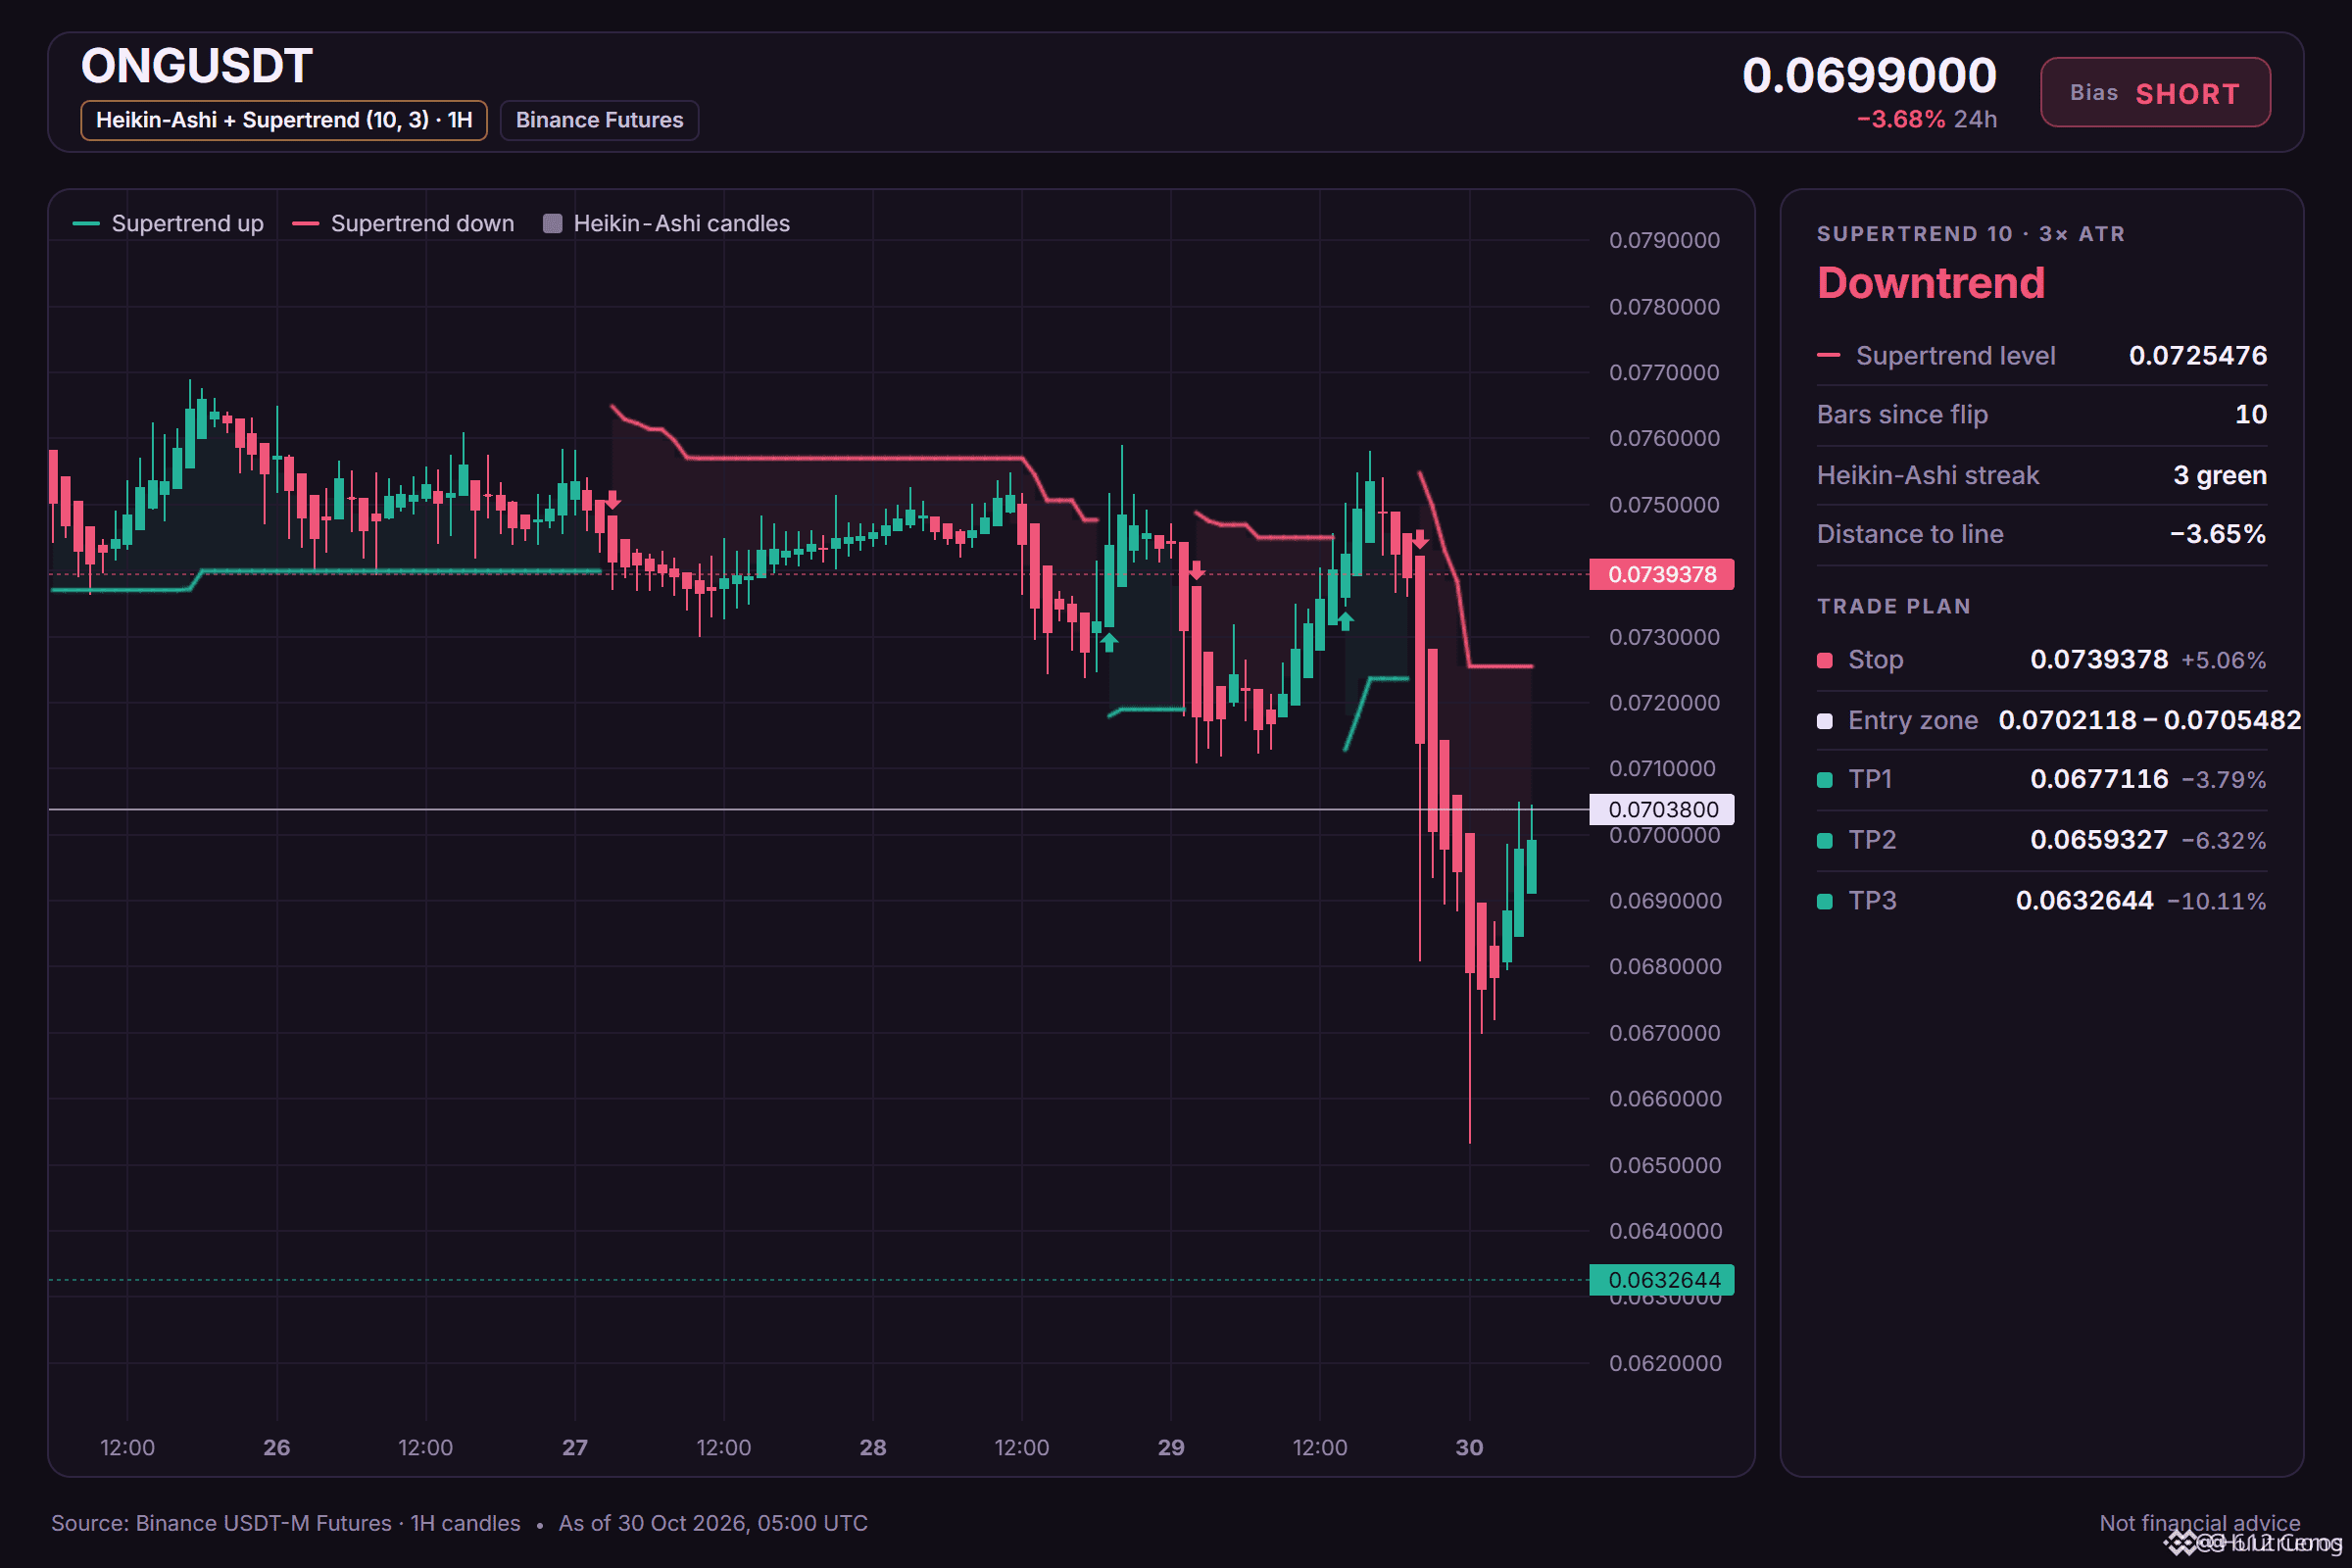
La estructura bajista de 1h se mantiene mientras la tendencia diaria está en rango.
🔴 CORTO $ONG /USDT: se espera que el precio BAJE
Sesgo: CORTO · Tendencia
Entrada: 0.0702118 – 0.0705482
TP1: 0.0677116 (-3.8%)
TP2: 0.0659327 (-6.3%)
TP3: 0.0632644 (-10.1%)
SL: 0.0739378 (+5.1%)
Plan: entrar solo dentro de la zona, cerrar el 50% en TP1, el 25% en TP2, el 25% en TP3 y mover el stop al precio de entrada después de TP1.
Nota: convicción moderada; mantener un tamaño de posición pequeño.
¿Por qué CORTO? 5/12 señales coinciden, 1 está en contra.
• Tendencia bajista en 4h (por debajo de EMA50 y EMA200)
• Tendencia bajista en 1h (por debajo de EMA50 y EMA200)
• Los vendedores están impulsando el movimiento (ADX de 15m: 24.4)
Riesgo: los compradores están presionando ahora mismo (vela de 15m: +0.69%)
Mi análisis de ONG hoy
Estoy atento a una posición corta en ONG con convicción. El precio en 1h está cerca de 0.0703800 y la tendencia en 4h es bajista, pero la tendencia diaria está en rango. Quiero ver que el precio respete el nivel de invalidación en el máximo de entrada de 0.0705482.
¿Dónde pondrías el stop si abrieras una posición corta aquí?
La estructura bajista de 1h se mantiene mientras la tendencia diaria está en rango.
🔴 CORTO $ONG /USDT: se espera que el precio BAJE
Sesgo: CORTO · Tendencia
Entrada: 0.0702118 – 0.0705482
TP1: 0.0677116 (-3.8%)
TP2: 0.0659327 (-6.3%)
TP3: 0.0632644 (-10.1%)
SL: 0.0739378 (+5.1%)
Plan: entrar solo dentro de la zona, cerrar el 50% en TP1, el 25% en TP2, el 25% en TP3 y mover el stop al precio de entrada después de TP1.
Nota: convicción moderada; mantener un tamaño de posición pequeño.
¿Por qué CORTO? 5/12 señales coinciden, 1 está en contra.
• Tendencia bajista en 4h (por debajo de EMA50 y EMA200)
• Tendencia bajista en 1h (por debajo de EMA50 y EMA200)
• Los vendedores están impulsando el movimiento (ADX de 15m: 24.4)
Riesgo: los compradores están presionando ahora mismo (vela de 15m: +0.69%)
Mi análisis de ONG hoy
Estoy atento a una posición corta en ONG con convicción. El precio en 1h está cerca de 0.0703800 y la tendencia en 4h es bajista, pero la tendencia diaria está en rango. Quiero ver que el precio respete el nivel de invalidación en el máximo de entrada de 0.0705482.
¿Dónde pondrías el stop si abrieras una posición corta aquí?
🔴 CORTO $ONG /USDT: se espera que el precio BAJE
Sesgo: CORTO · Tendencia
Entrada: 0.0702118 – 0.0705482
TP1: 0.0677116 (-3.8%)
TP2: 0.0659327 (-6.3%)
TP3: 0.0632644 (-10.1%)
SL: 0.0739378 (+5.1%)
Plan: entrar solo dentro de la zona, cerrar el 50% en TP1, el 25% en TP2, el 25% en TP3 y mover el stop al precio de entrada después de TP1.
Nota: convicción moderada; mantener un tamaño de posición pequeño.
¿Por qué CORTO? 5/12 señales coinciden, 1 está en contra.
• Tendencia bajista en 4h (por debajo de EMA50 y EMA200)
• Tendencia bajista en 1h (por debajo de EMA50 y EMA200)
• Los vendedores están impulsando el movimiento (ADX de 15m: 24.4)
Riesgo: los compradores están presionando ahora mismo (vela de 15m: +0.69%)
Mi análisis de ONG hoy
Estoy atento a una posición corta en ONG con convicción. El precio en 1h está cerca de 0.0703800 y la tendencia en 4h es bajista, pero la tendencia diaria está en rango. Quiero ver que el precio respete el nivel de invalidación en el máximo de entrada de 0.0705482.
¿Dónde pondrías el stop si abrieras una posición corta aquí?
4
·
--
Bajista
Ver traducción
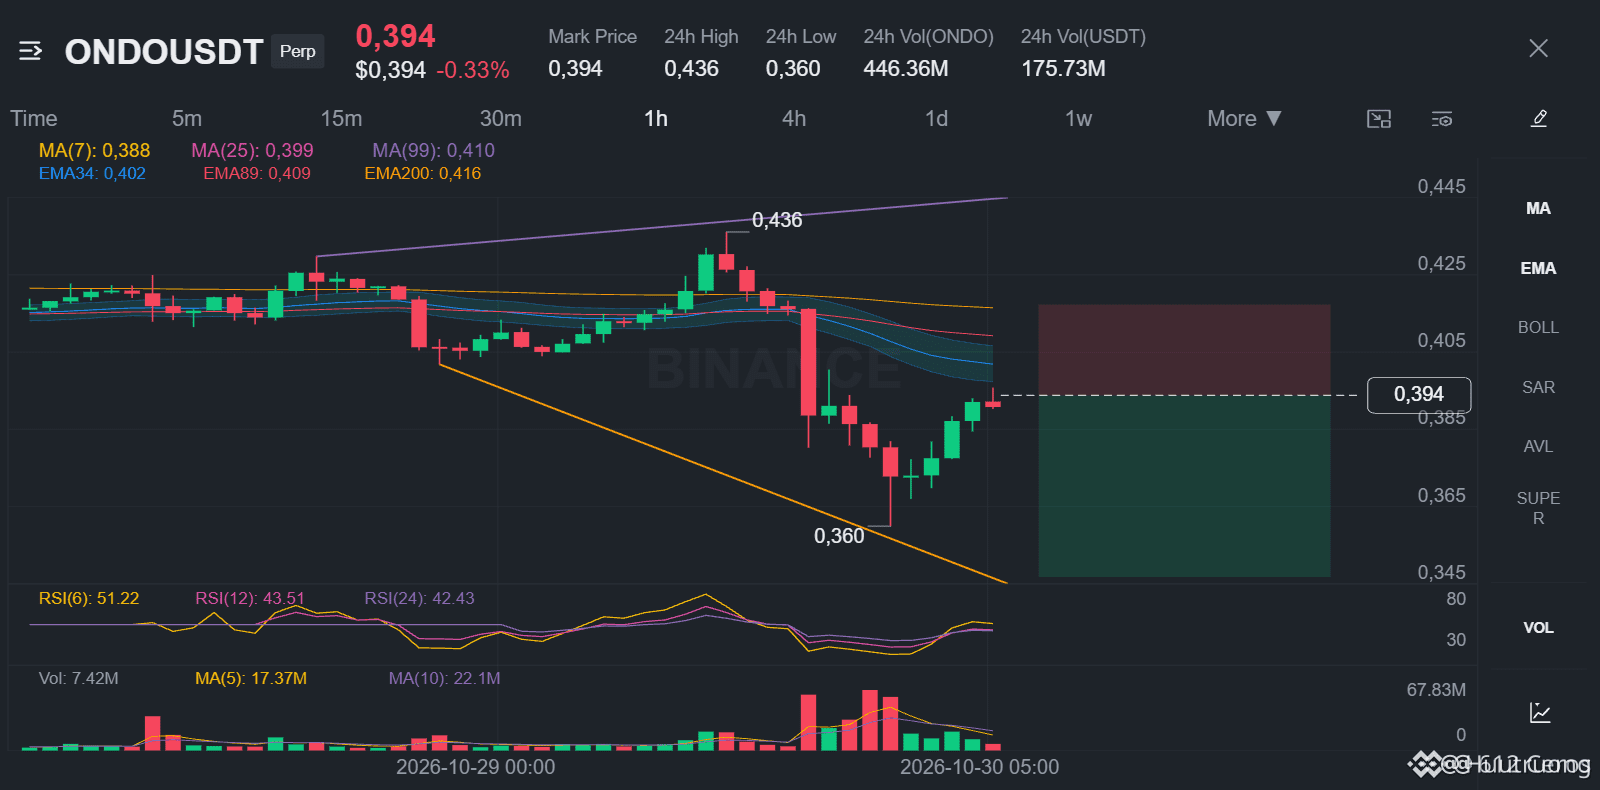
Range breaks are often short traps here.
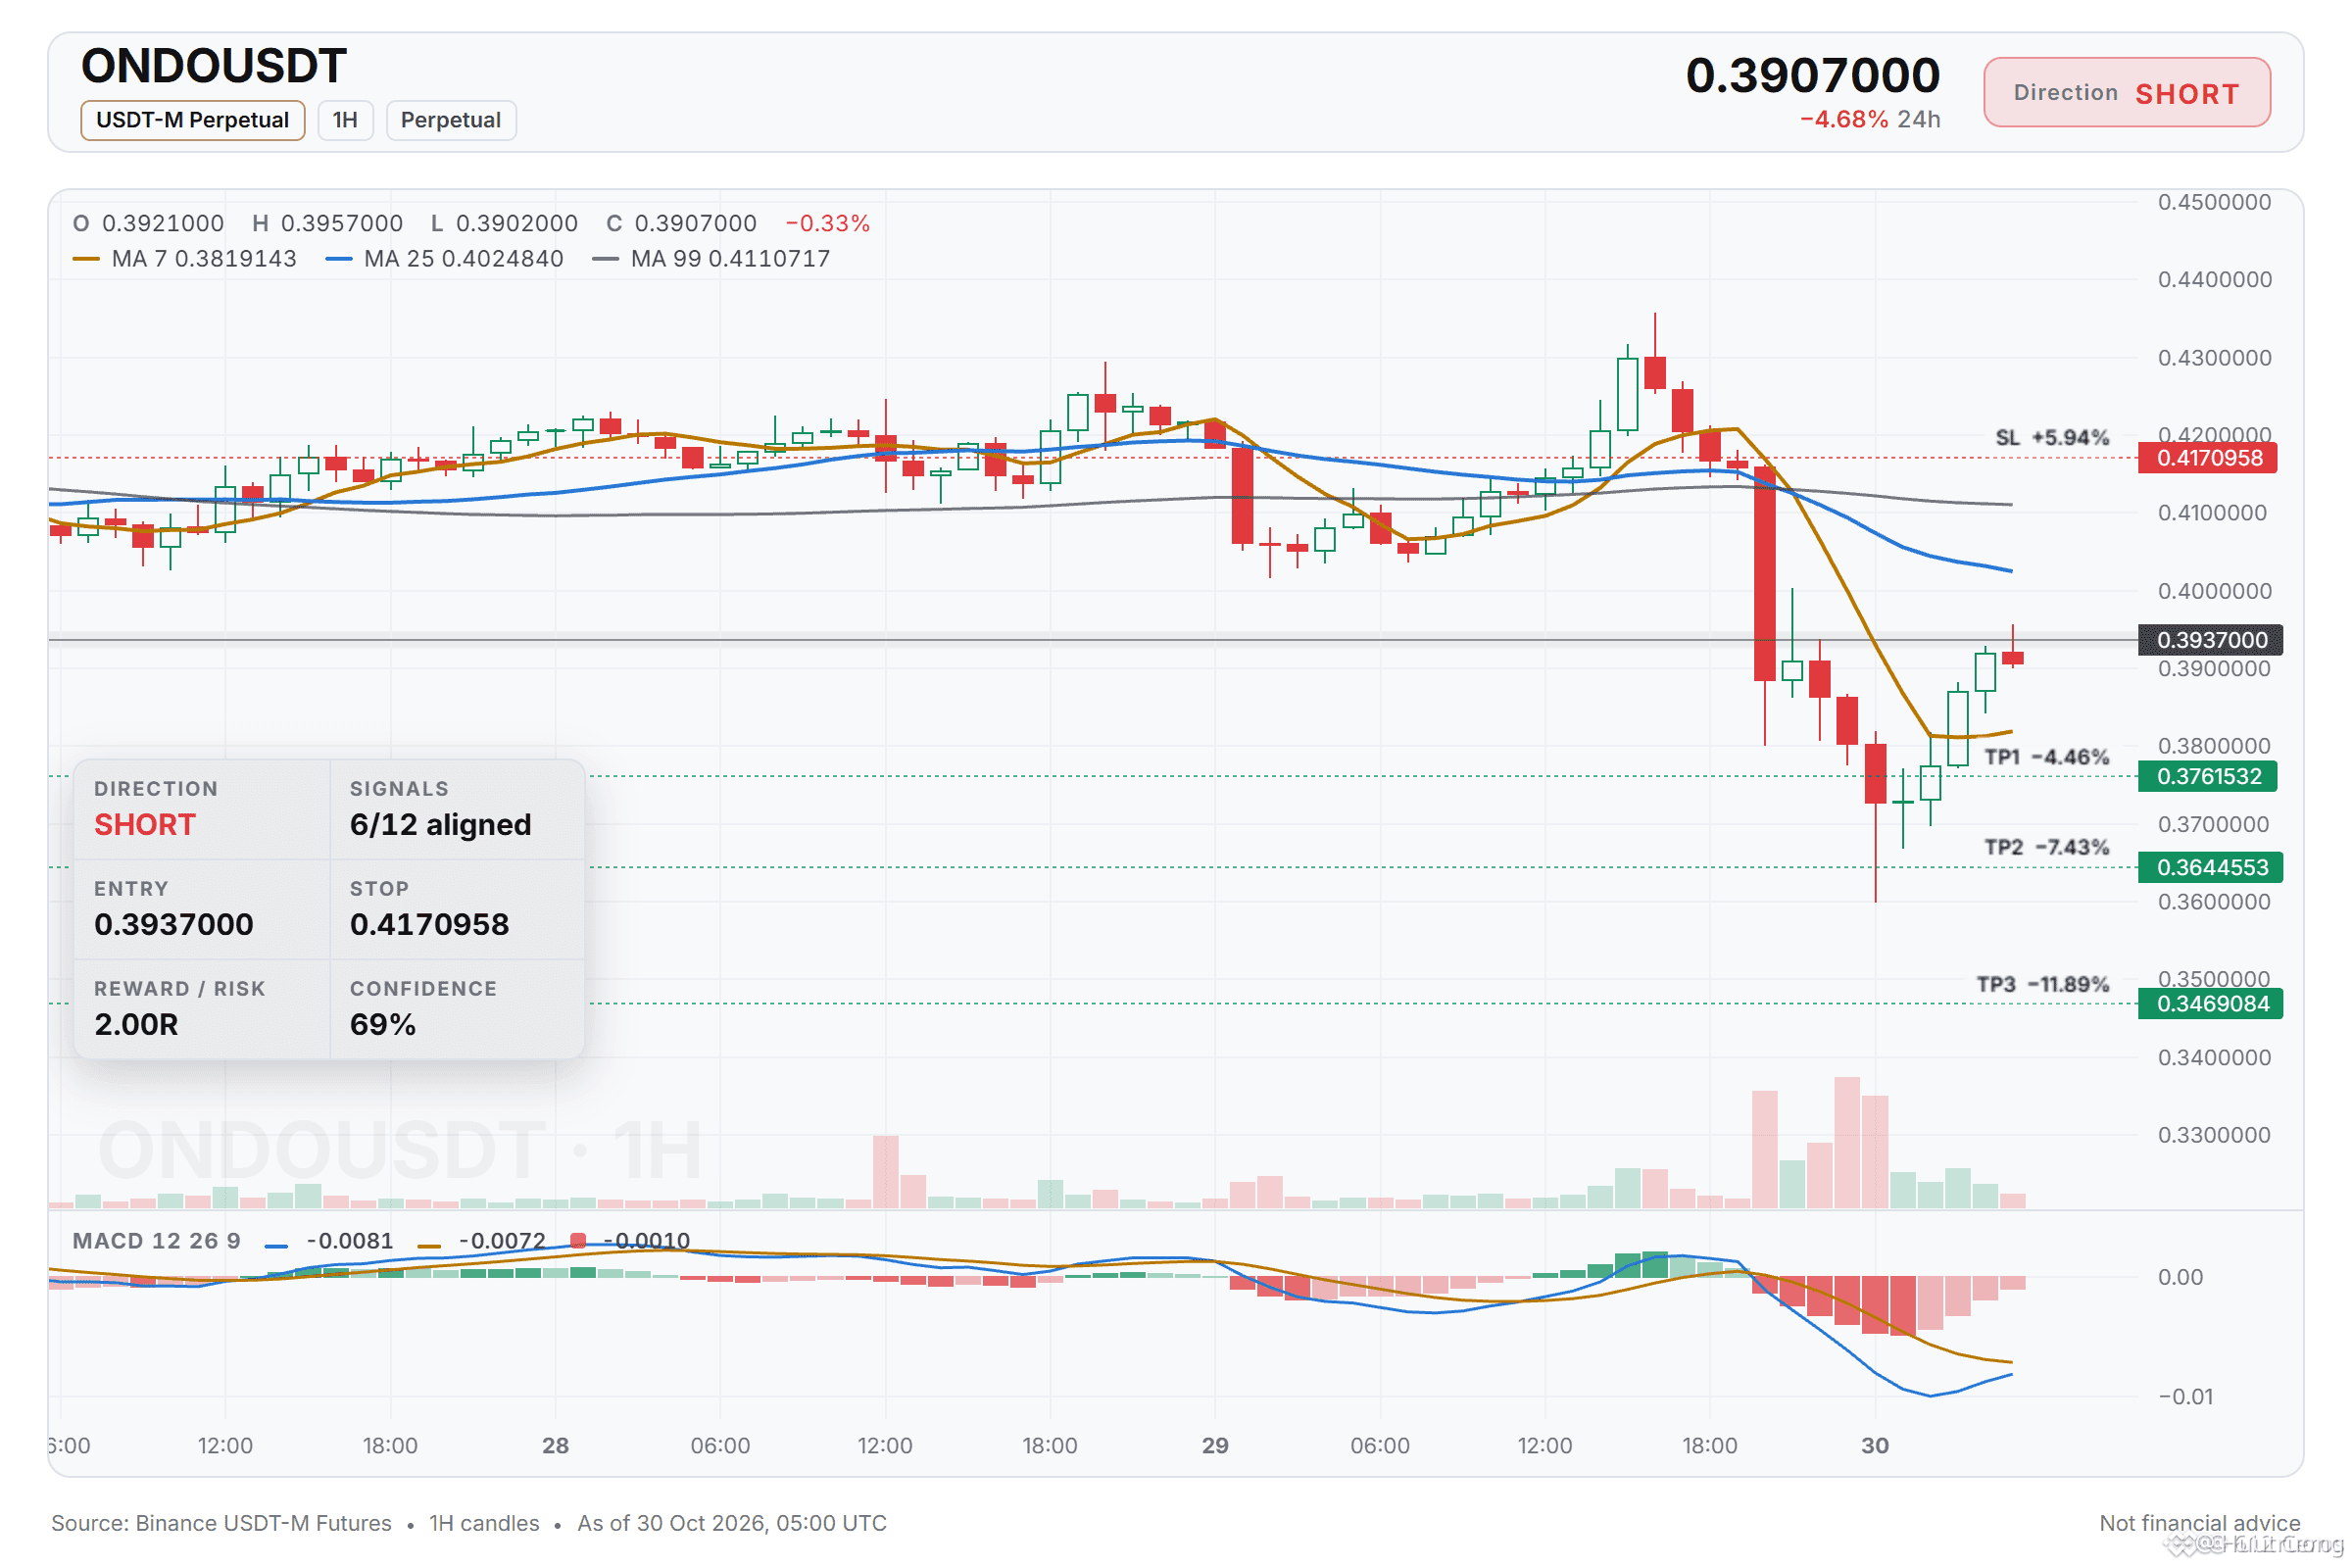
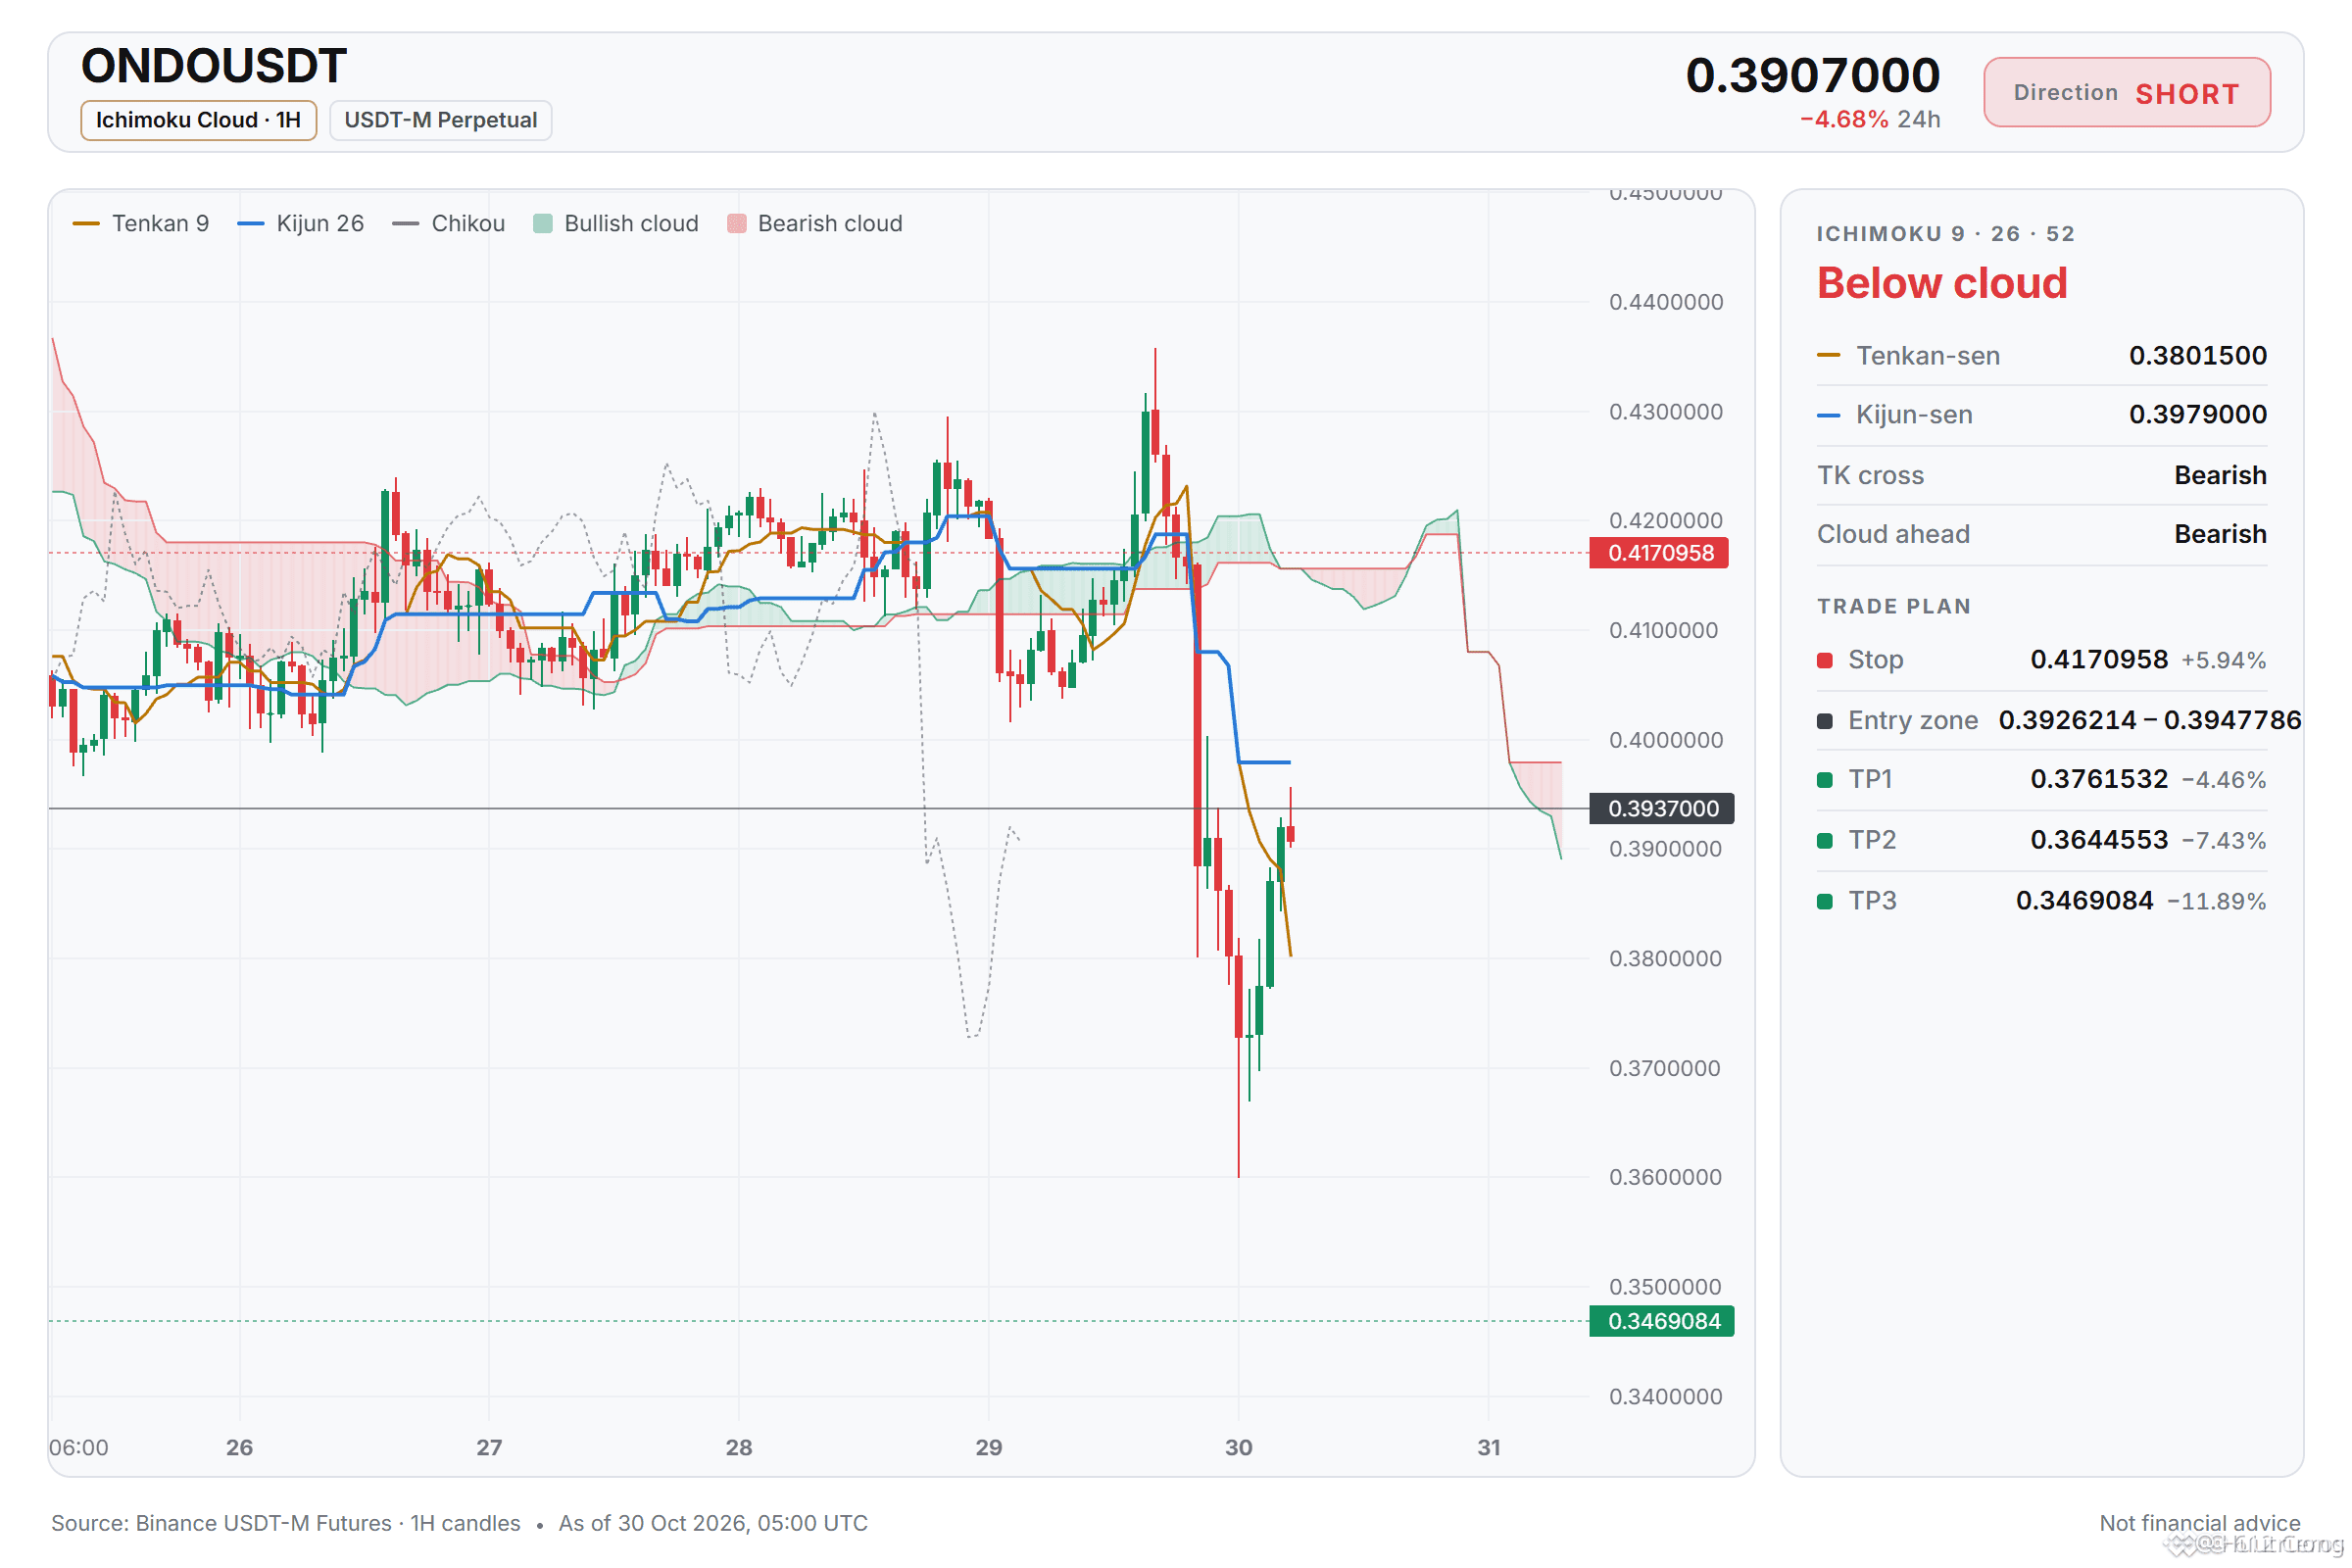
🔴 SHORT $ONDO /USDT: expecting price to go DOWN
Bias: SHORT · Strong
Entry: 0.3926214 – 0.3947786
TP1: 0.3761532 (-4.5%)
TP2: 0.3644553 (-7.4%)
TP3: 0.3469084 (-11.9%)
SL: 0.4170958 (+5.9%)
Plan: enter only inside the zone, close 50% at TP1, 25% at TP2, 25% at TP3, and move the stop to entry after TP1.
Why SHORT? 6/12 signals agree, 1 against.
• 4h trend down (below EMA50 & EMA200)
• 1h trend down (below EMA50 & EMA200)
• Sellers are driving the move (15m ADX 25.9)
Risk: Buyers are pushing right now (+0.77% 15m candle)
ONDO in 3 points:
1/3 The 4h trend keeps price below EMA50 and EMA200, a bearish stack pointing down.
2/3 1h RSI sits at 42.9, below 45, so sellers still have the momentum.
3/3 A 15m RSI z-score of +1.24 with a +0.77% candle shows buyers are pressing now.
Where do you want to fade this move instead?
Range breaks are often short traps here.
🔴 SHORT $ONDO /USDT: expecting price to go DOWN
Bias: SHORT · Strong
Entry: 0.3926214 – 0.3947786
TP1: 0.3761532 (-4.5%)
TP2: 0.3644553 (-7.4%)
TP3: 0.3469084 (-11.9%)
SL: 0.4170958 (+5.9%)
Plan: enter only inside the zone, close 50% at TP1, 25% at TP2, 25% at TP3, and move the stop to entry after TP1.
Why SHORT? 6/12 signals agree, 1 against.
• 4h trend down (below EMA50 & EMA200)
• 1h trend down (below EMA50 & EMA200)
• Sellers are driving the move (15m ADX 25.9)
Risk: Buyers are pushing right now (+0.77% 15m candle)
ONDO in 3 points:
1/3 The 4h trend keeps price below EMA50 and EMA200, a bearish stack pointing down.
2/3 1h RSI sits at 42.9, below 45, so sellers still have the momentum.
3/3 A 15m RSI z-score of +1.24 with a +0.77% candle shows buyers are pressing now.
Where do you want to fade this move instead?
🔴 SHORT $ONDO /USDT: expecting price to go DOWN
Bias: SHORT · Strong
Entry: 0.3926214 – 0.3947786
TP1: 0.3761532 (-4.5%)
TP2: 0.3644553 (-7.4%)
TP3: 0.3469084 (-11.9%)
SL: 0.4170958 (+5.9%)
Plan: enter only inside the zone, close 50% at TP1, 25% at TP2, 25% at TP3, and move the stop to entry after TP1.
Why SHORT? 6/12 signals agree, 1 against.
• 4h trend down (below EMA50 & EMA200)
• 1h trend down (below EMA50 & EMA200)
• Sellers are driving the move (15m ADX 25.9)
Risk: Buyers are pushing right now (+0.77% 15m candle)
ONDO in 3 points:
1/3 The 4h trend keeps price below EMA50 and EMA200, a bearish stack pointing down.
2/3 1h RSI sits at 42.9, below 45, so sellers still have the momentum.
3/3 A 15m RSI z-score of +1.24 with a +0.77% candle shows buyers are pressing now.
Where do you want to fade this move instead?
13
·
--
Bajista
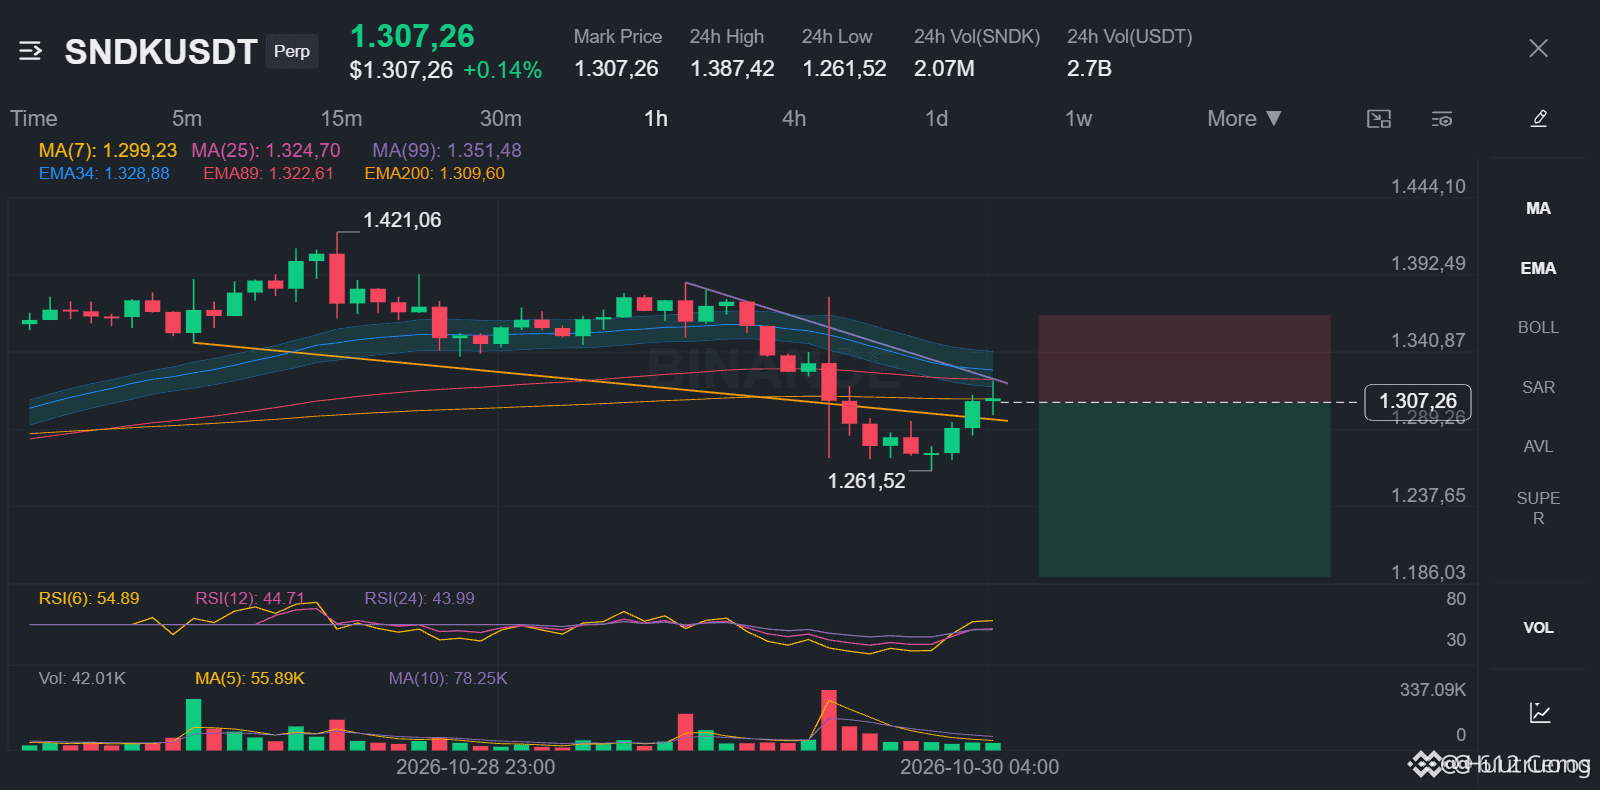
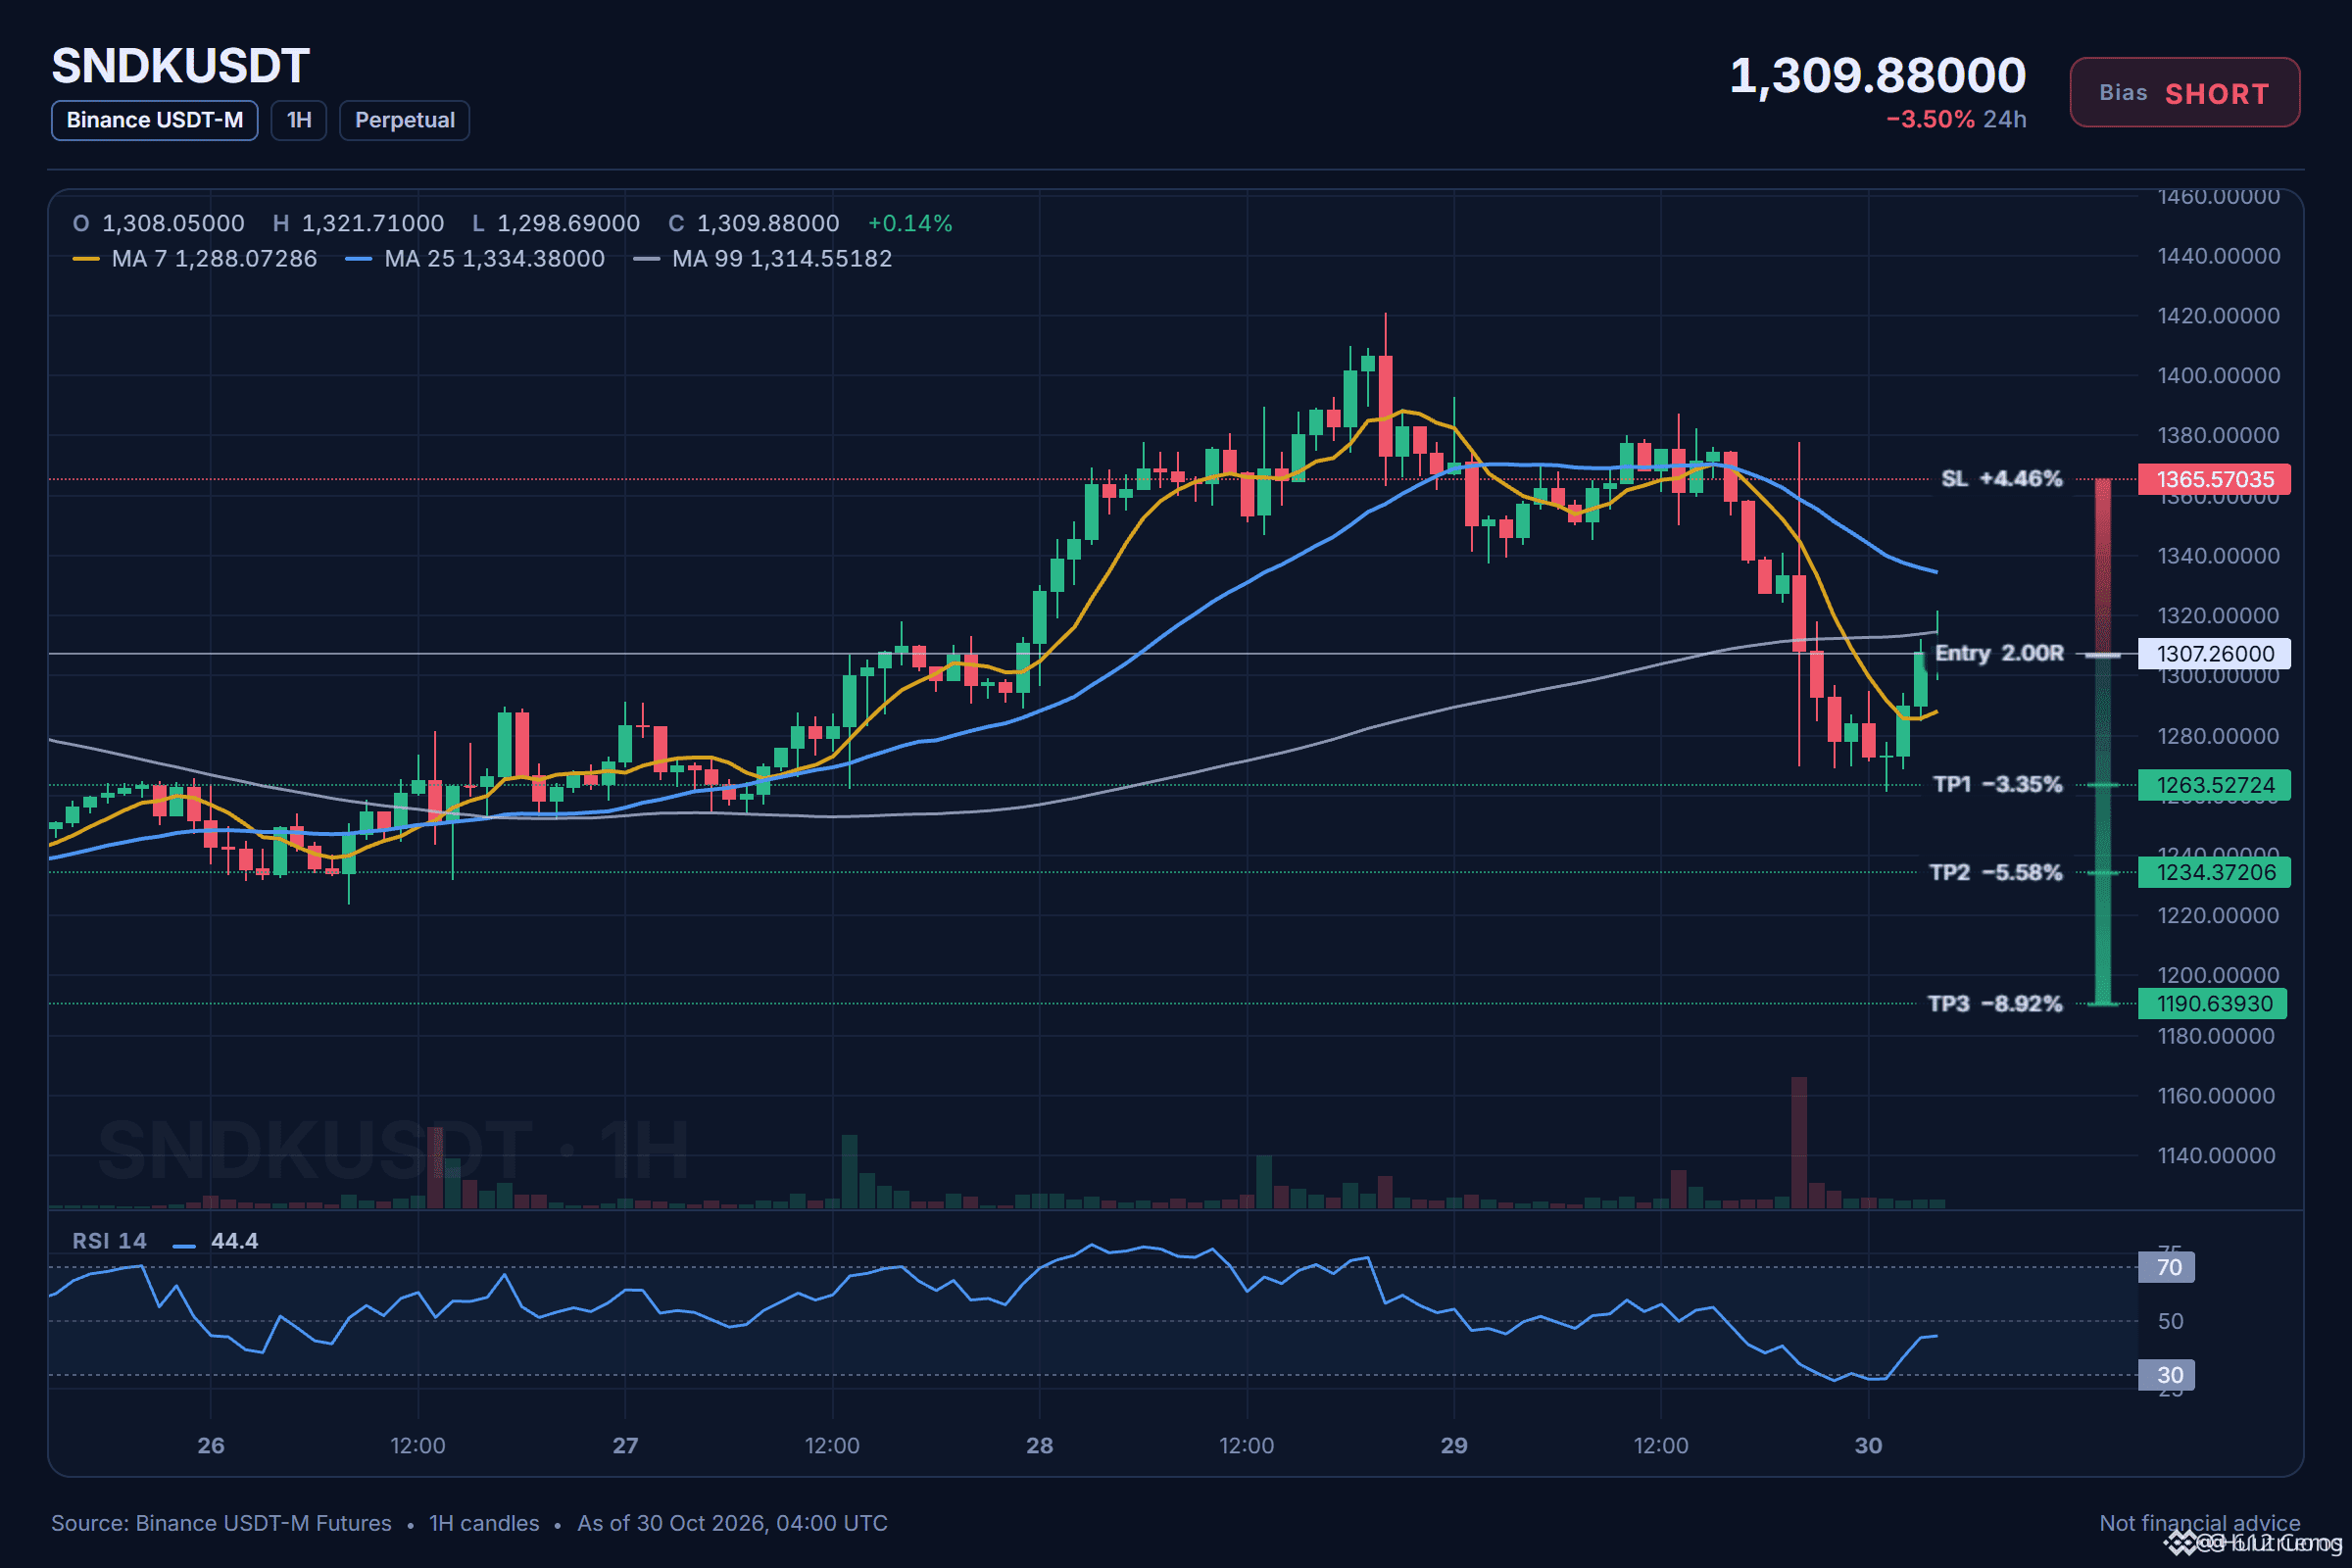
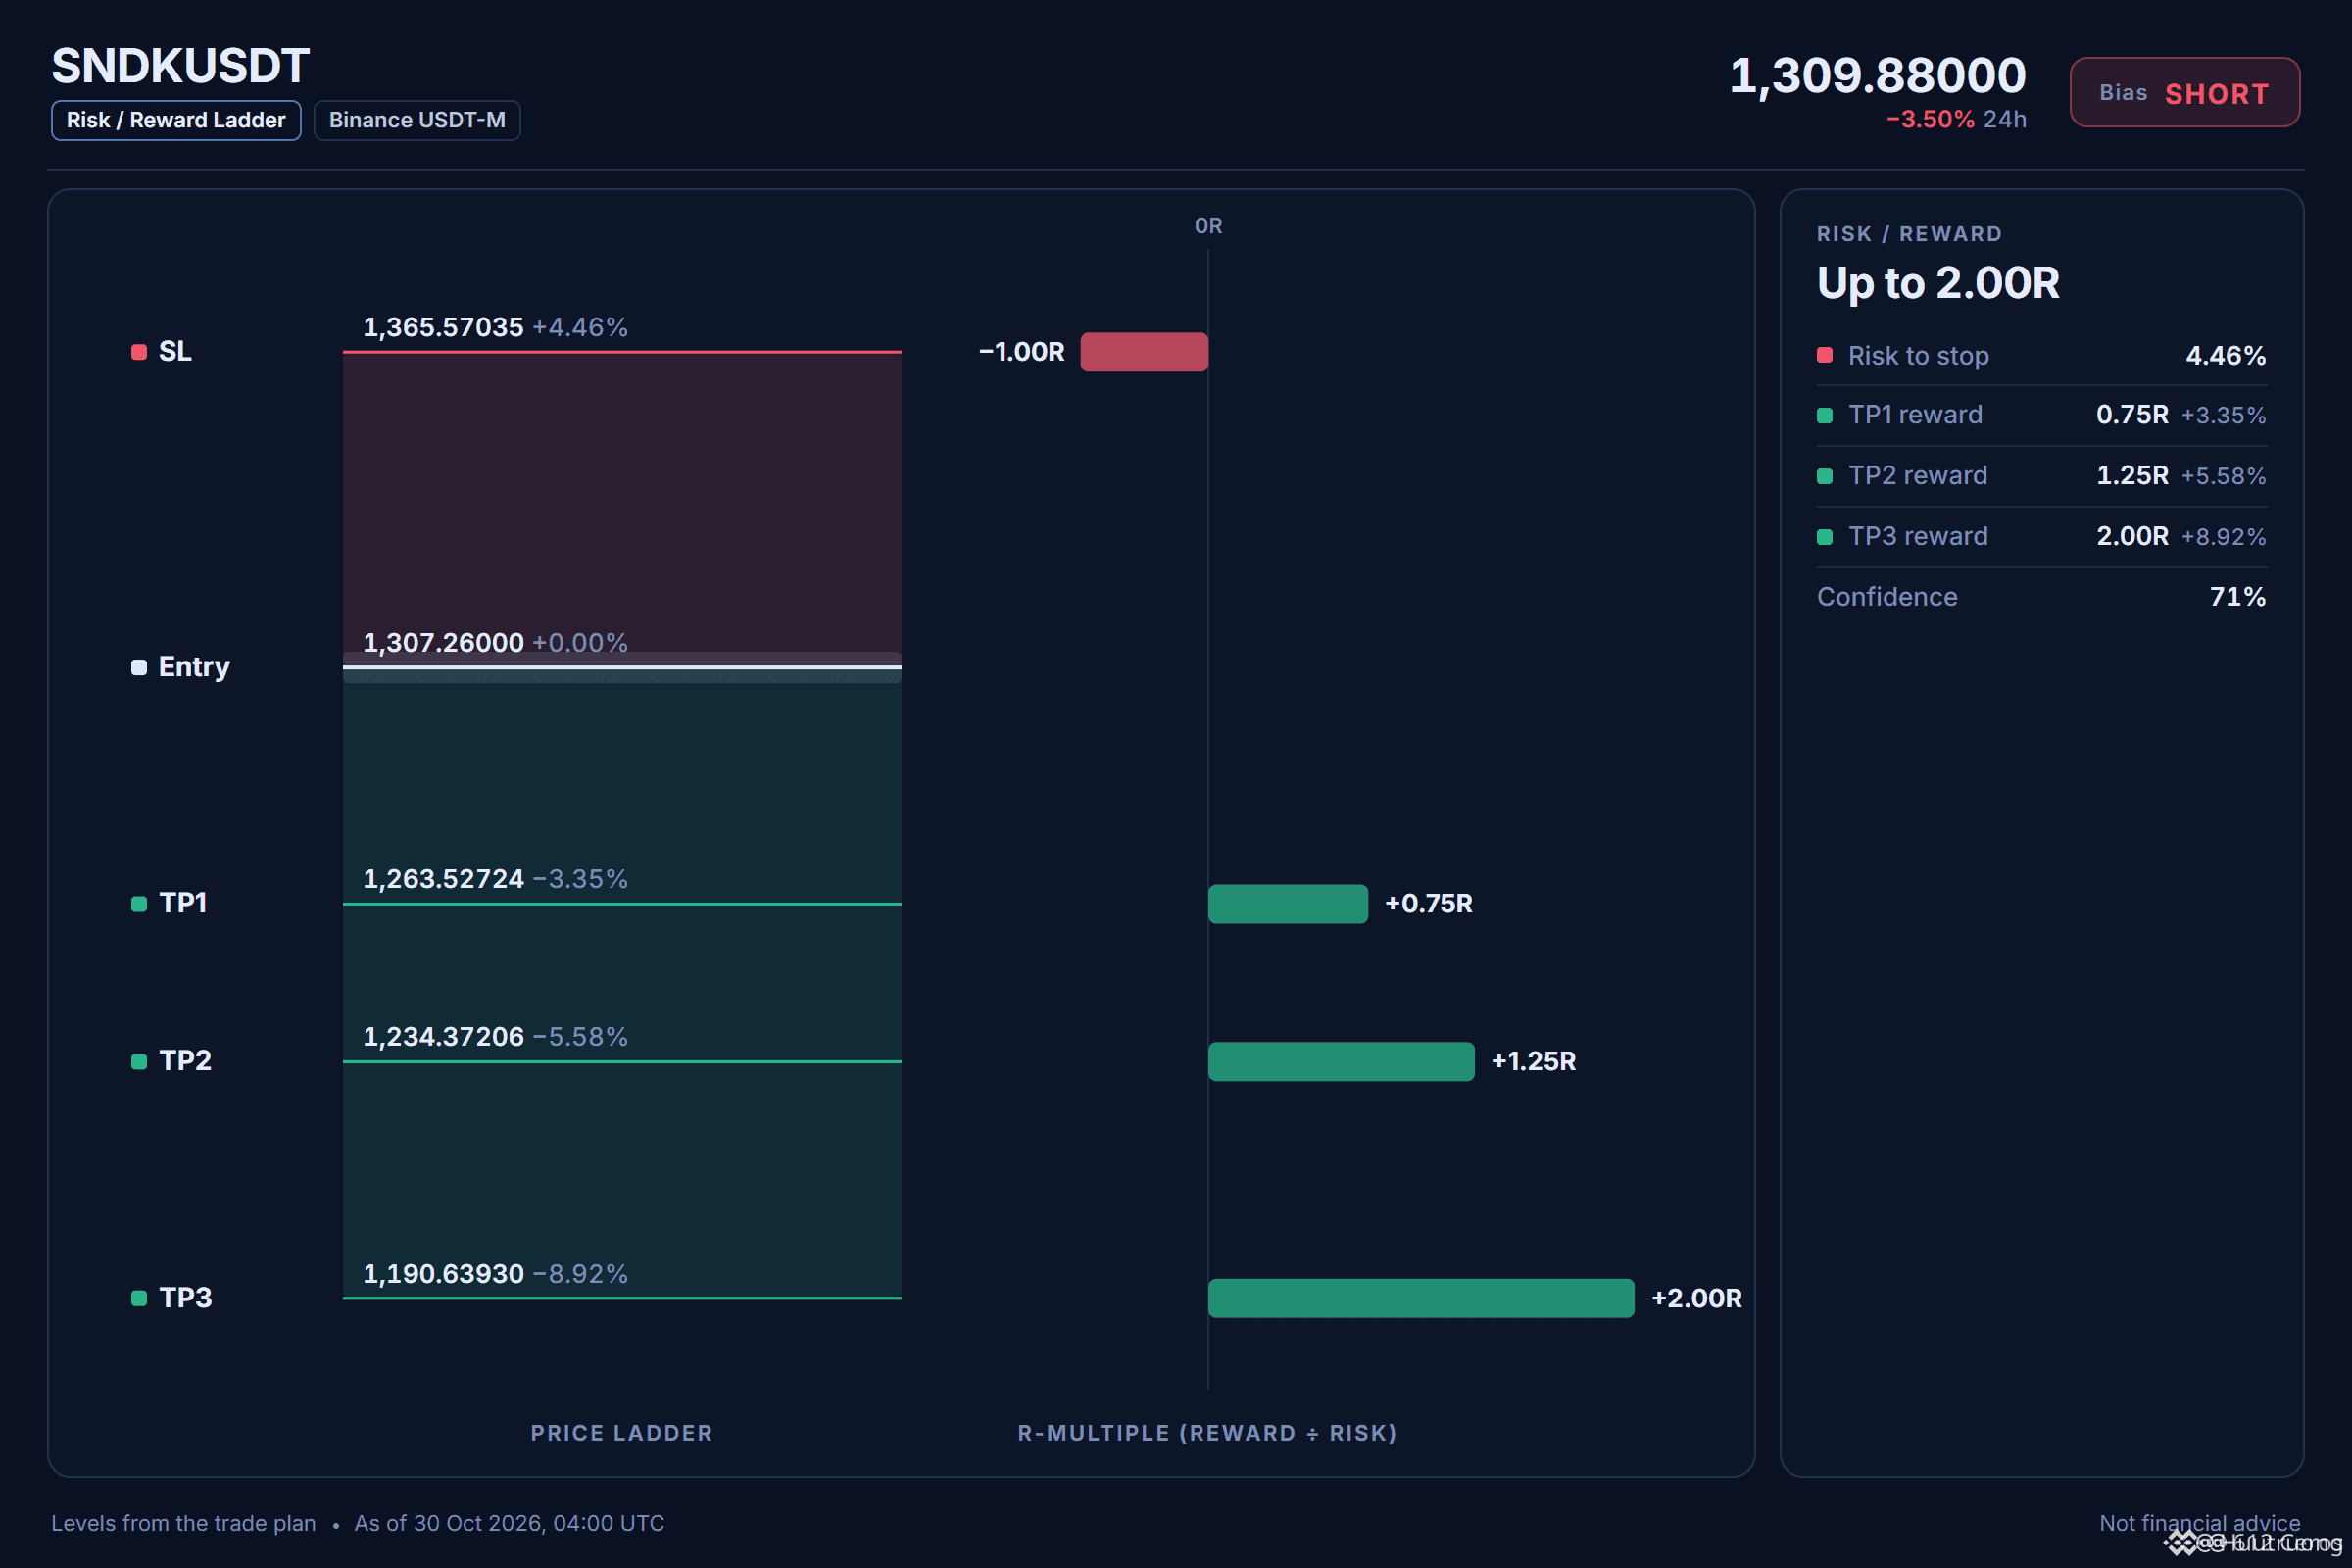
🔴 CORTO $SNDK /USDT: se espera que el precio BAJE
Sesgo: CORTO · Inclinación
Entrada: 1304.32803 – 1310.19197
TP1: 1263.52724 (-3.3%)
TP2: 1234.37206 (-5.6%)
TP3: 1190.63930 (-8.9%)
SL: 1365.57035 (+4.5%)
Plan: entra solo dentro de la zona, cierra el 50% en TP1, el 25% en TP2, el 25% en TP3 y mueve el stop al precio de entrada después de TP1.
Nota: convicción moderada; mantén un tamaño de posición pequeño.
SNDK no es un rebote seguro, a pesar de la reciente compresión.
¿Por qué CORTO? 5/12 señales coinciden, 0 en contra.
• Tendencia diaria bajista (por debajo de EMA50 y EMA200)
• Tendencia de 4 h bajista (por debajo de EMA50 y EMA200)
• Los vendedores tienen el impulso (RSI de 1 h: 44.4)
La tendencia diaria es bajista, con el precio por debajo de EMA50 y EMA200, y el RSI de 1 h está en 44.4, lo que muestra un impulso bajista por debajo de 45.
¿Cuál es tu nivel de invalidación para esta posición corta en SNDK?
🔴 CORTO $SNDK /USDT: se espera que el precio BAJE
Sesgo: CORTO · Inclinación
Entrada: 1304.32803 – 1310.19197
TP1: 1263.52724 (-3.3%)
TP2: 1234.37206 (-5.6%)
TP3: 1190.63930 (-8.9%)
SL: 1365.57035 (+4.5%)
Plan: entra solo dentro de la zona, cierra el 50% en TP1, el 25% en TP2, el 25% en TP3 y mueve el stop al precio de entrada después de TP1.
Nota: convicción moderada; mantén un tamaño de posición pequeño.
SNDK no es un rebote seguro, a pesar de la reciente compresión.
¿Por qué CORTO? 5/12 señales coinciden, 0 en contra.
• Tendencia diaria bajista (por debajo de EMA50 y EMA200)
• Tendencia de 4 h bajista (por debajo de EMA50 y EMA200)
• Los vendedores tienen el impulso (RSI de 1 h: 44.4)
La tendencia diaria es bajista, con el precio por debajo de EMA50 y EMA200, y el RSI de 1 h está en 44.4, lo que muestra un impulso bajista por debajo de 45.
¿Cuál es tu nivel de invalidación para esta posición corta en SNDK?
Sesgo: CORTO · Inclinación
Entrada: 1304.32803 – 1310.19197
TP1: 1263.52724 (-3.3%)
TP2: 1234.37206 (-5.6%)
TP3: 1190.63930 (-8.9%)
SL: 1365.57035 (+4.5%)
Plan: entra solo dentro de la zona, cierra el 50% en TP1, el 25% en TP2, el 25% en TP3 y mueve el stop al precio de entrada después de TP1.
Nota: convicción moderada; mantén un tamaño de posición pequeño.
SNDK no es un rebote seguro, a pesar de la reciente compresión.
¿Por qué CORTO? 5/12 señales coinciden, 0 en contra.
• Tendencia diaria bajista (por debajo de EMA50 y EMA200)
• Tendencia de 4 h bajista (por debajo de EMA50 y EMA200)
• Los vendedores tienen el impulso (RSI de 1 h: 44.4)
La tendencia diaria es bajista, con el precio por debajo de EMA50 y EMA200, y el RSI de 1 h está en 44.4, lo que muestra un impulso bajista por debajo de 45.
¿Cuál es tu nivel de invalidación para esta posición corta en SNDK?
10
·
--
Bajista
El cierre de ayer rompió una estructura que se mantuvo durante semanas.
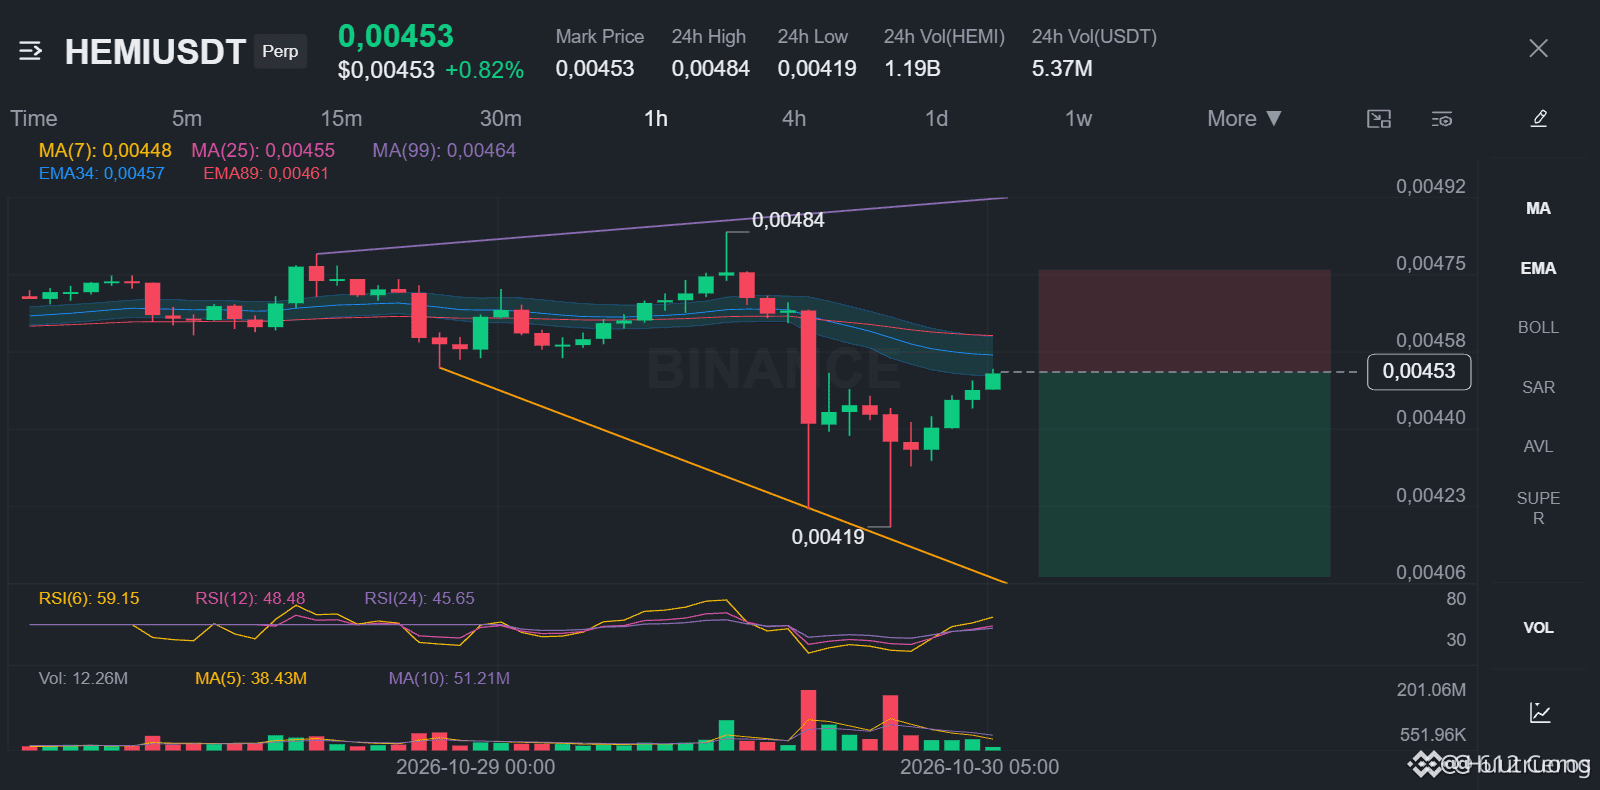
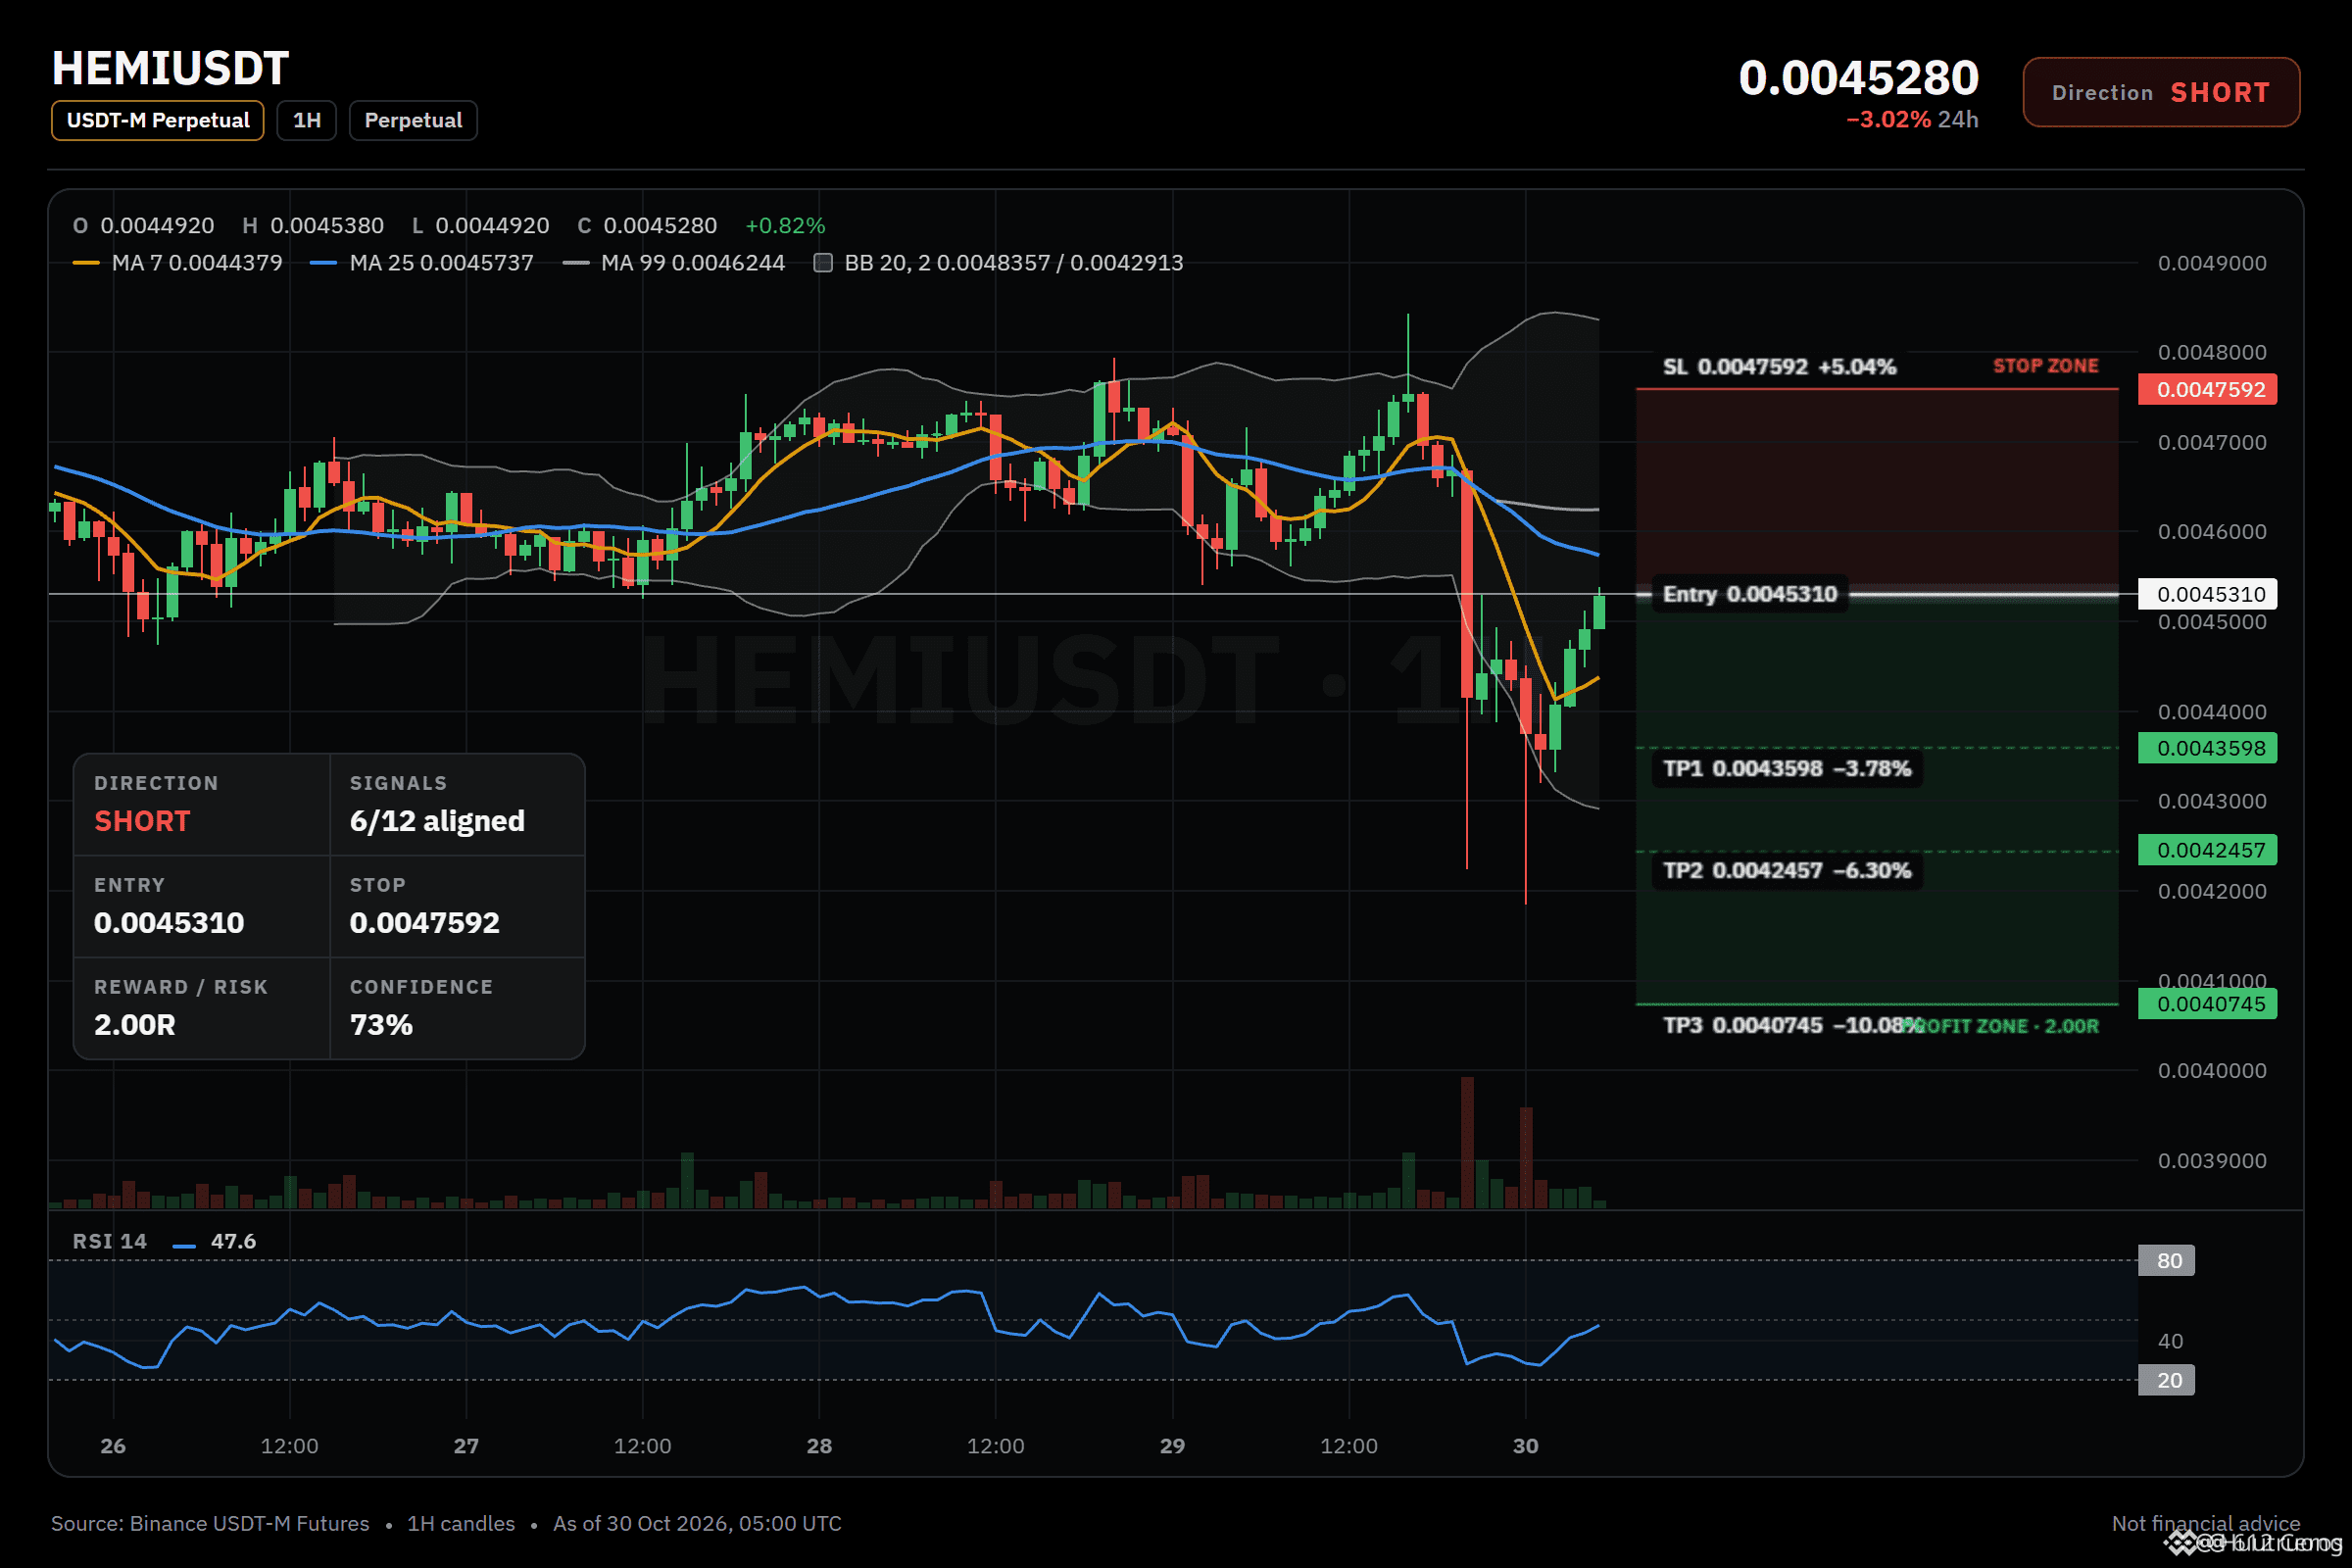
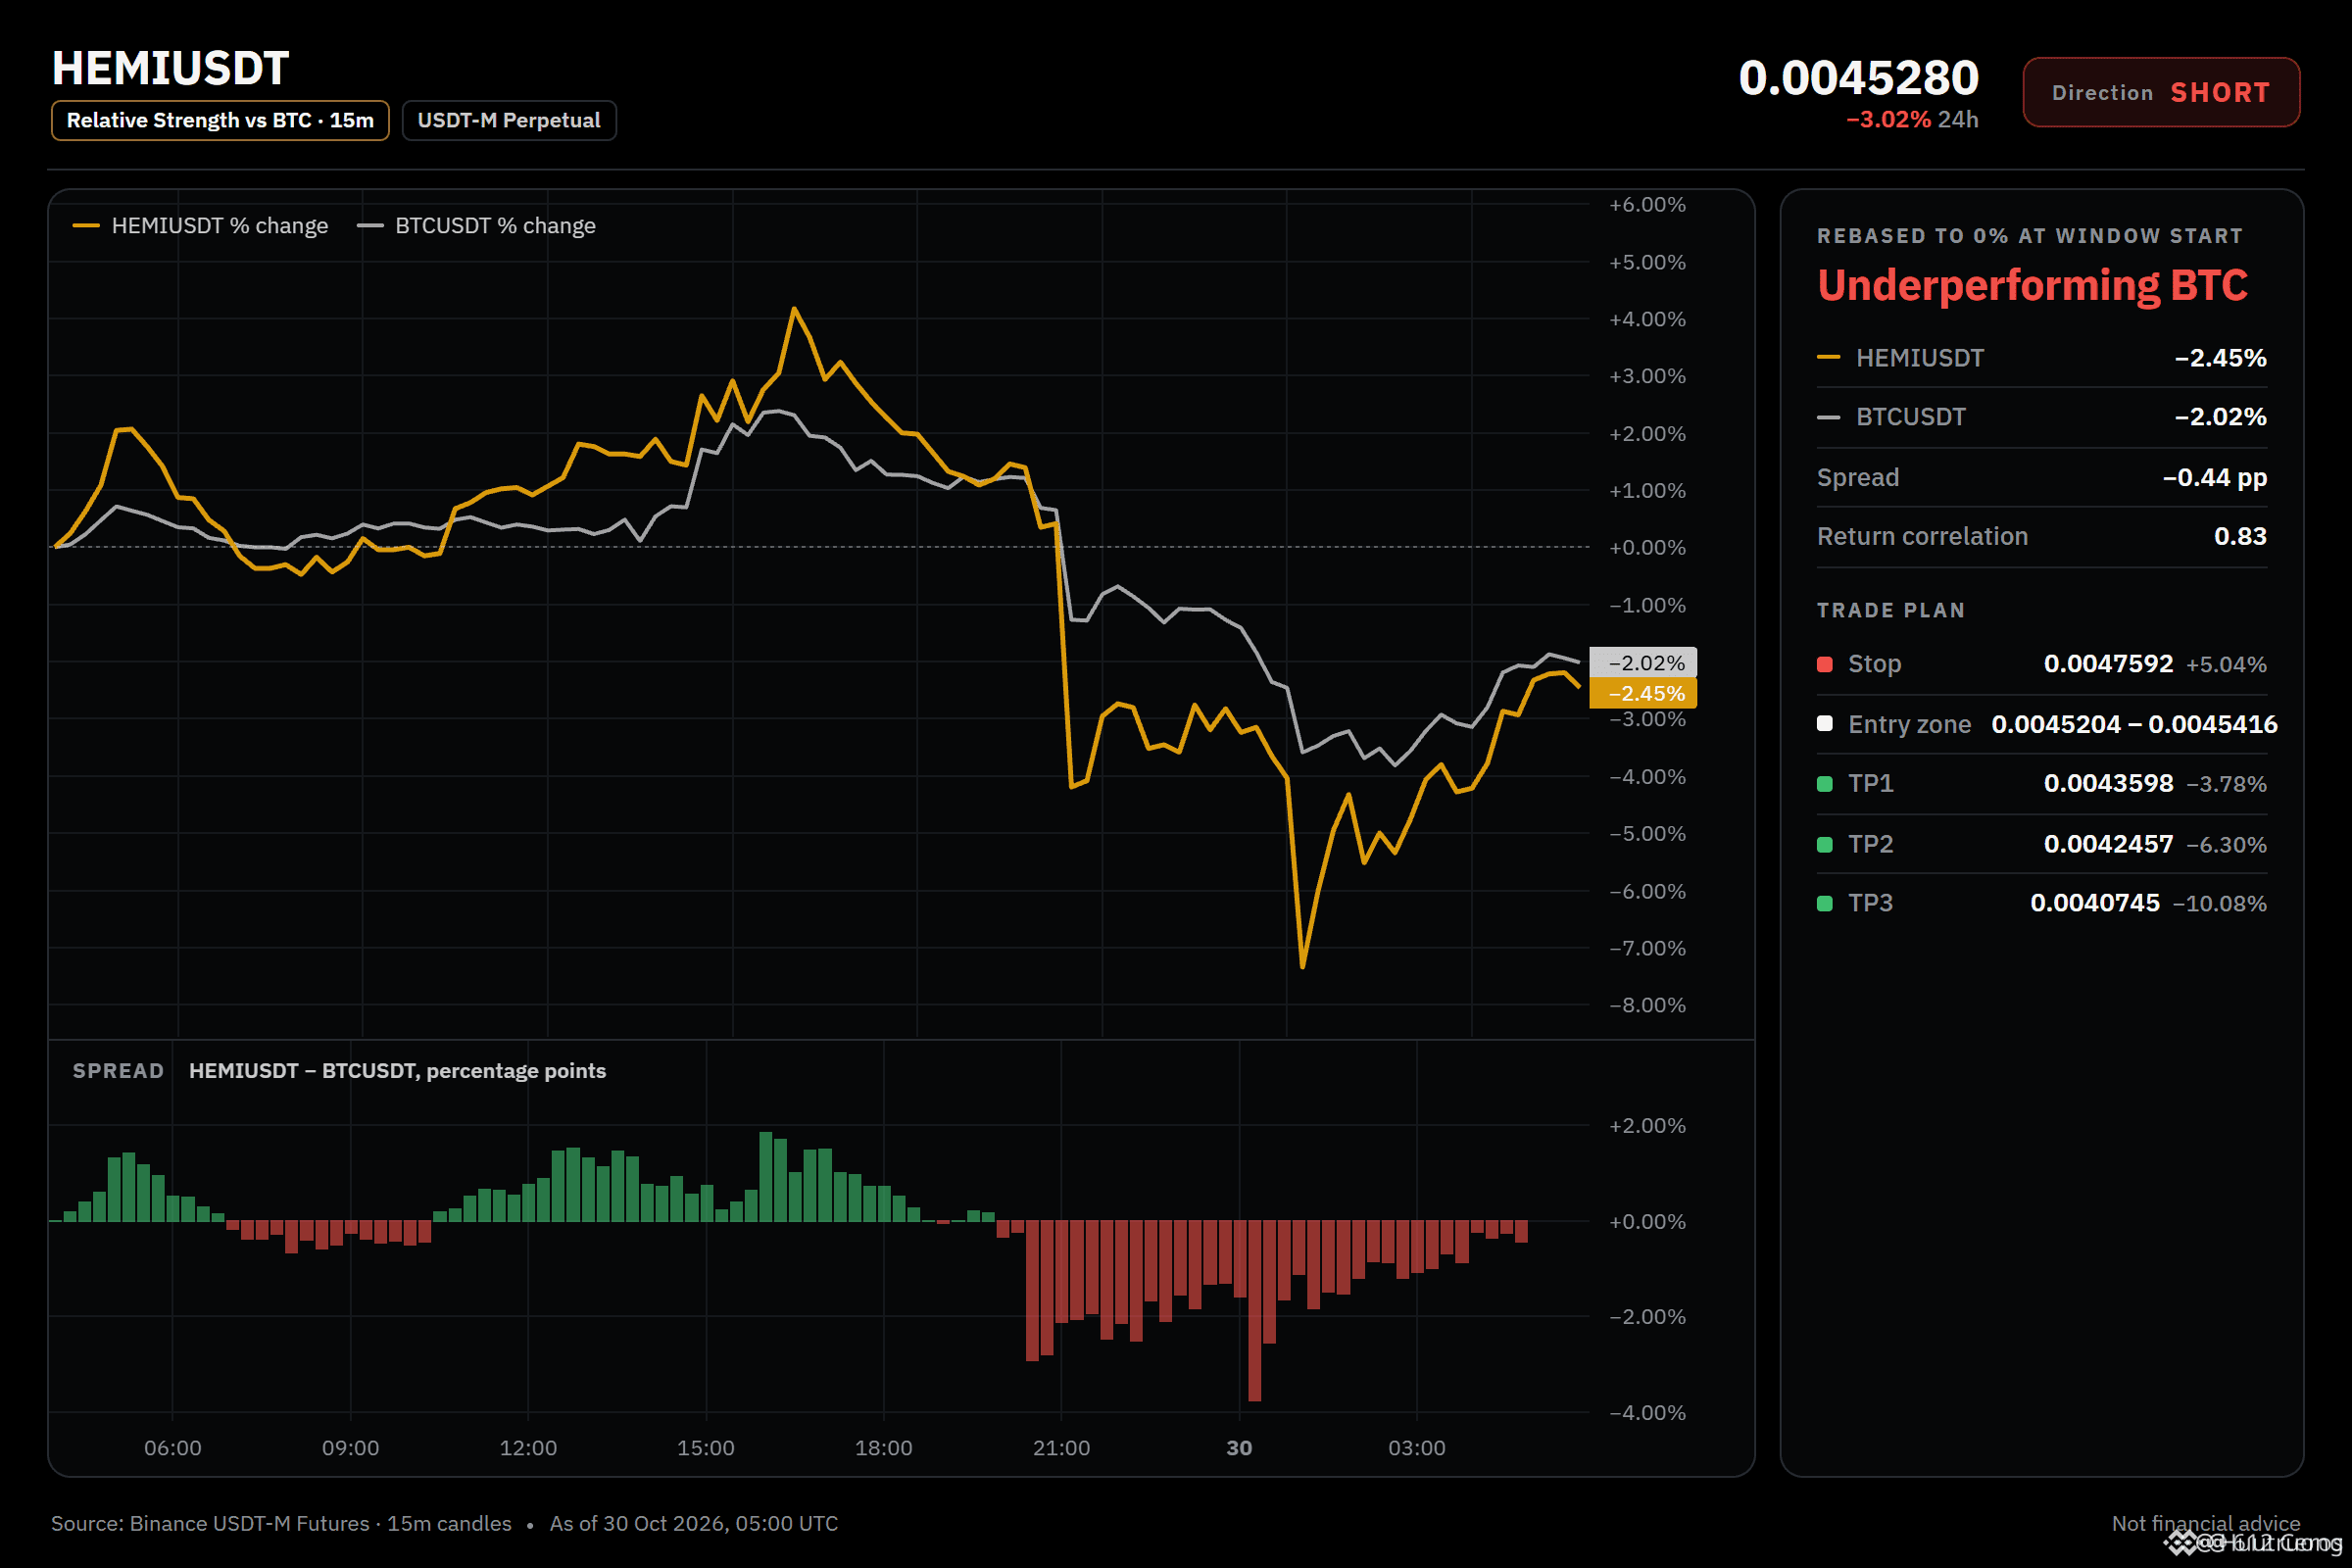
🔴 CORTO $HEMI /USDT: se espera que el precio BAJE
Sesgo: CORTO · Fuerte
Entrada: 0.0045204 – 0.0045416
TP1: 0.0043598 (-3.8%)
TP2: 0.0042457 (-6.3%)
TP3: 0.0040745 (-10.1%)
SL: 0.0047592 (+5.0%)
Plan: entrar solo dentro de la zona, cerrar el 50% en TP1, el 25% en TP2, el 25% en TP3 y mover el stop al precio de entrada después de TP1.
¿Por qué CORTO? Lista de verificación de HEMI: 6/12 están de acuerdo, 1 en contra.
• Tendencia diaria bajista (por debajo de EMA50 y EMA200)
• Tendencia de 4 h bajista (por debajo de EMA50 y EMA200)
• Tendencia de 1 h bajista (por debajo de EMA50 y EMA200)
Atención: Los compradores están presionando ahora mismo (vela de 15 min: +0.62%)
Atención: La idea queda invalidada si el precio alcanza el stop en 0.0047592
Lectura general: Las estructuras bajistas diaria, de 4 h y de 1 h confirman que la tendencia general es bajista, y pesan más que los compradores que están presionando ahora mismo en el gráfico de 15 min.
¿Cuál es tu nivel si no estás en corto?
El cierre de ayer rompió una estructura que se mantuvo durante semanas.
🔴 CORTO $HEMI /USDT: se espera que el precio BAJE
Sesgo: CORTO · Fuerte
Entrada: 0.0045204 – 0.0045416
TP1: 0.0043598 (-3.8%)
TP2: 0.0042457 (-6.3%)
TP3: 0.0040745 (-10.1%)
SL: 0.0047592 (+5.0%)
Plan: entrar solo dentro de la zona, cerrar el 50% en TP1, el 25% en TP2, el 25% en TP3 y mover el stop al precio de entrada después de TP1.
¿Por qué CORTO? Lista de verificación de HEMI: 6/12 están de acuerdo, 1 en contra.
• Tendencia diaria bajista (por debajo de EMA50 y EMA200)
• Tendencia de 4 h bajista (por debajo de EMA50 y EMA200)
• Tendencia de 1 h bajista (por debajo de EMA50 y EMA200)
Atención: Los compradores están presionando ahora mismo (vela de 15 min: +0.62%)
Atención: La idea queda invalidada si el precio alcanza el stop en 0.0047592
Lectura general: Las estructuras bajistas diaria, de 4 h y de 1 h confirman que la tendencia general es bajista, y pesan más que los compradores que están presionando ahora mismo en el gráfico de 15 min.
¿Cuál es tu nivel si no estás en corto?
🔴 CORTO $HEMI /USDT: se espera que el precio BAJE
Sesgo: CORTO · Fuerte
Entrada: 0.0045204 – 0.0045416
TP1: 0.0043598 (-3.8%)
TP2: 0.0042457 (-6.3%)
TP3: 0.0040745 (-10.1%)
SL: 0.0047592 (+5.0%)
Plan: entrar solo dentro de la zona, cerrar el 50% en TP1, el 25% en TP2, el 25% en TP3 y mover el stop al precio de entrada después de TP1.
¿Por qué CORTO? Lista de verificación de HEMI: 6/12 están de acuerdo, 1 en contra.
• Tendencia diaria bajista (por debajo de EMA50 y EMA200)
• Tendencia de 4 h bajista (por debajo de EMA50 y EMA200)
• Tendencia de 1 h bajista (por debajo de EMA50 y EMA200)
Atención: Los compradores están presionando ahora mismo (vela de 15 min: +0.62%)
Atención: La idea queda invalidada si el precio alcanza el stop en 0.0047592
Lectura general: Las estructuras bajistas diaria, de 4 h y de 1 h confirman que la tendencia general es bajista, y pesan más que los compradores que están presionando ahora mismo en el gráfico de 15 min.
¿Cuál es tu nivel si no estás en corto?
7
·
--
Bajista
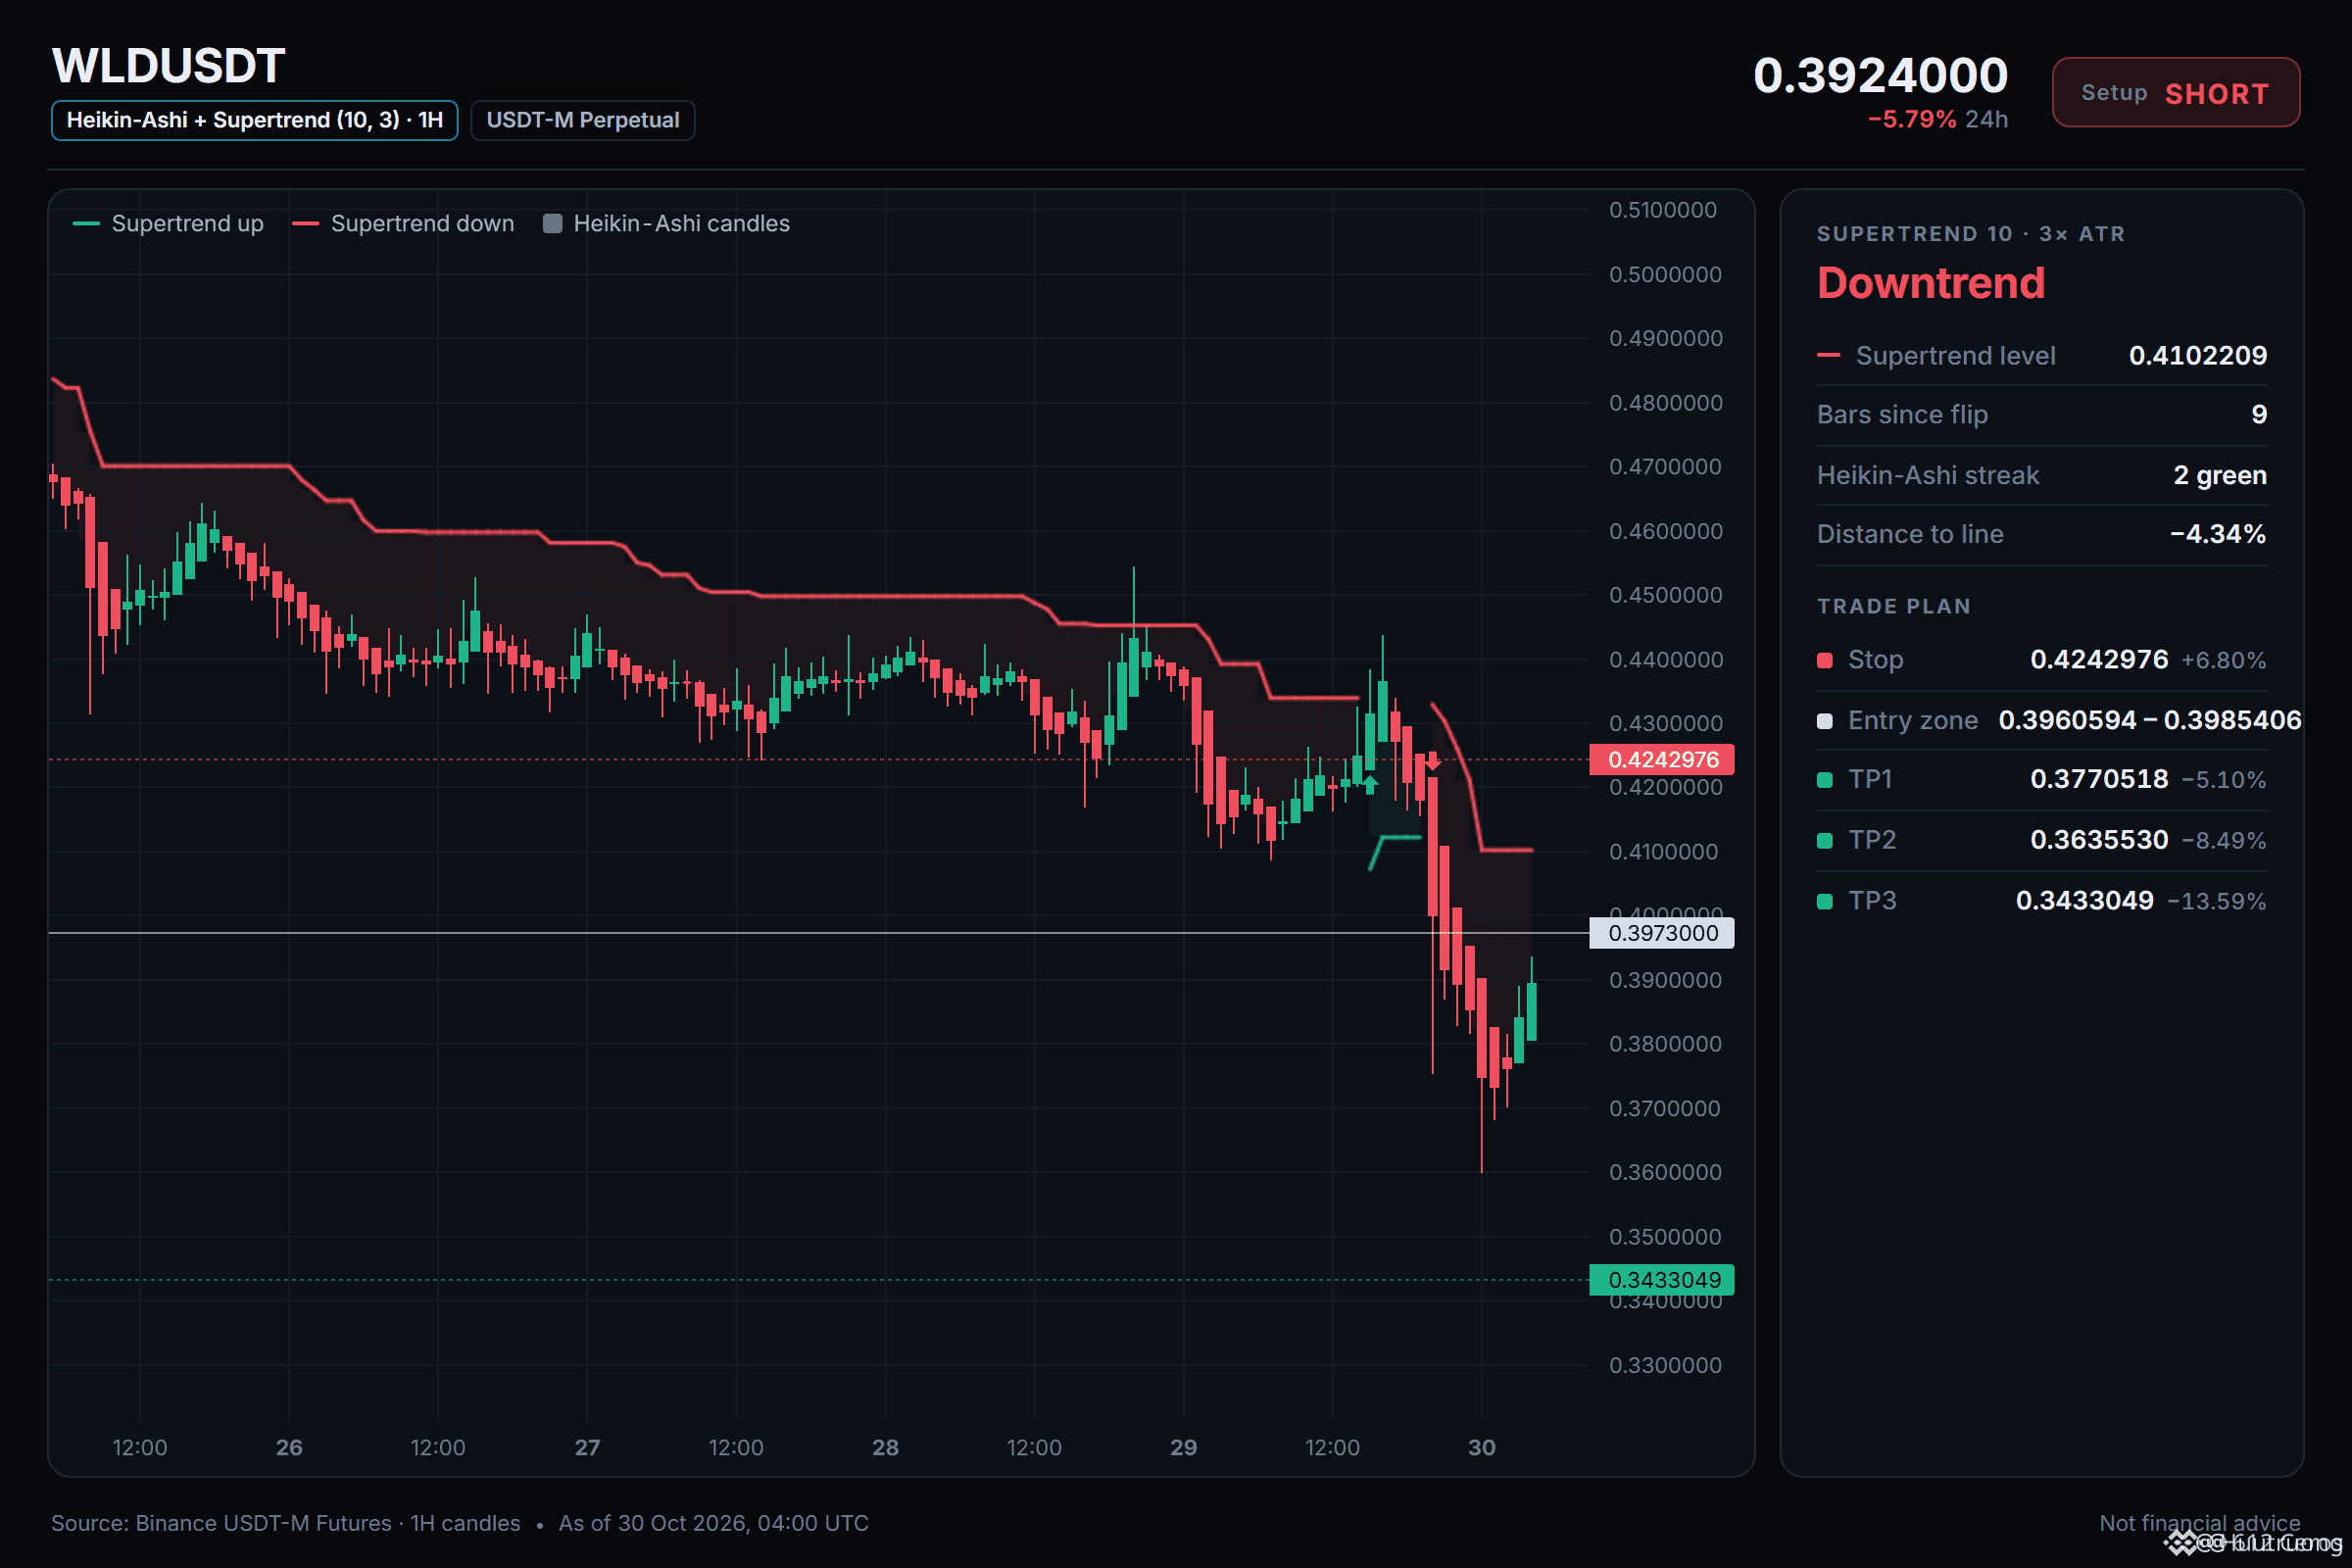
La tendencia diaria está lateral, pero la estructura de 4h es bajista.
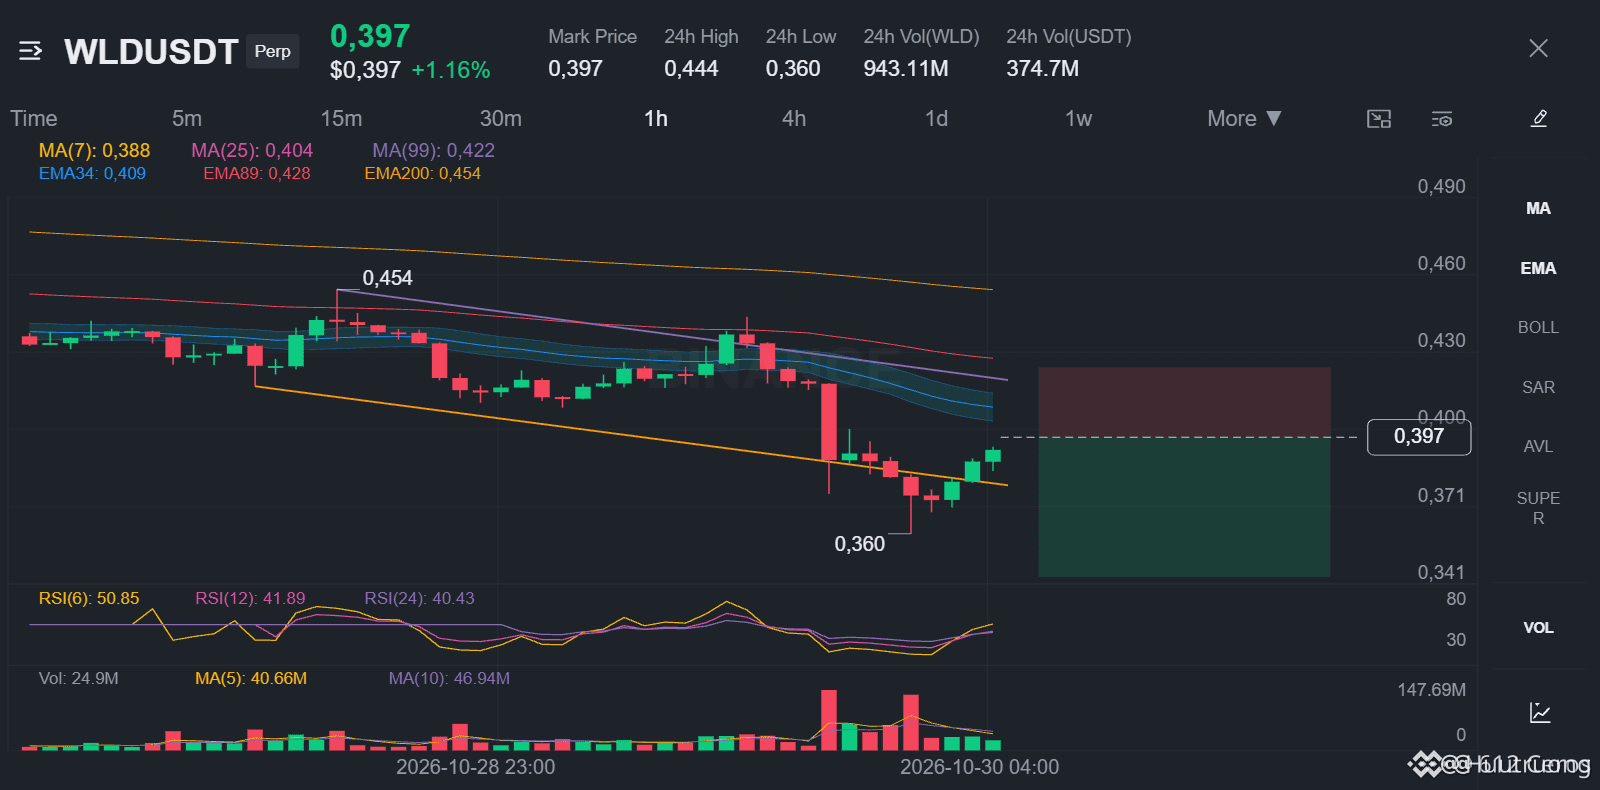
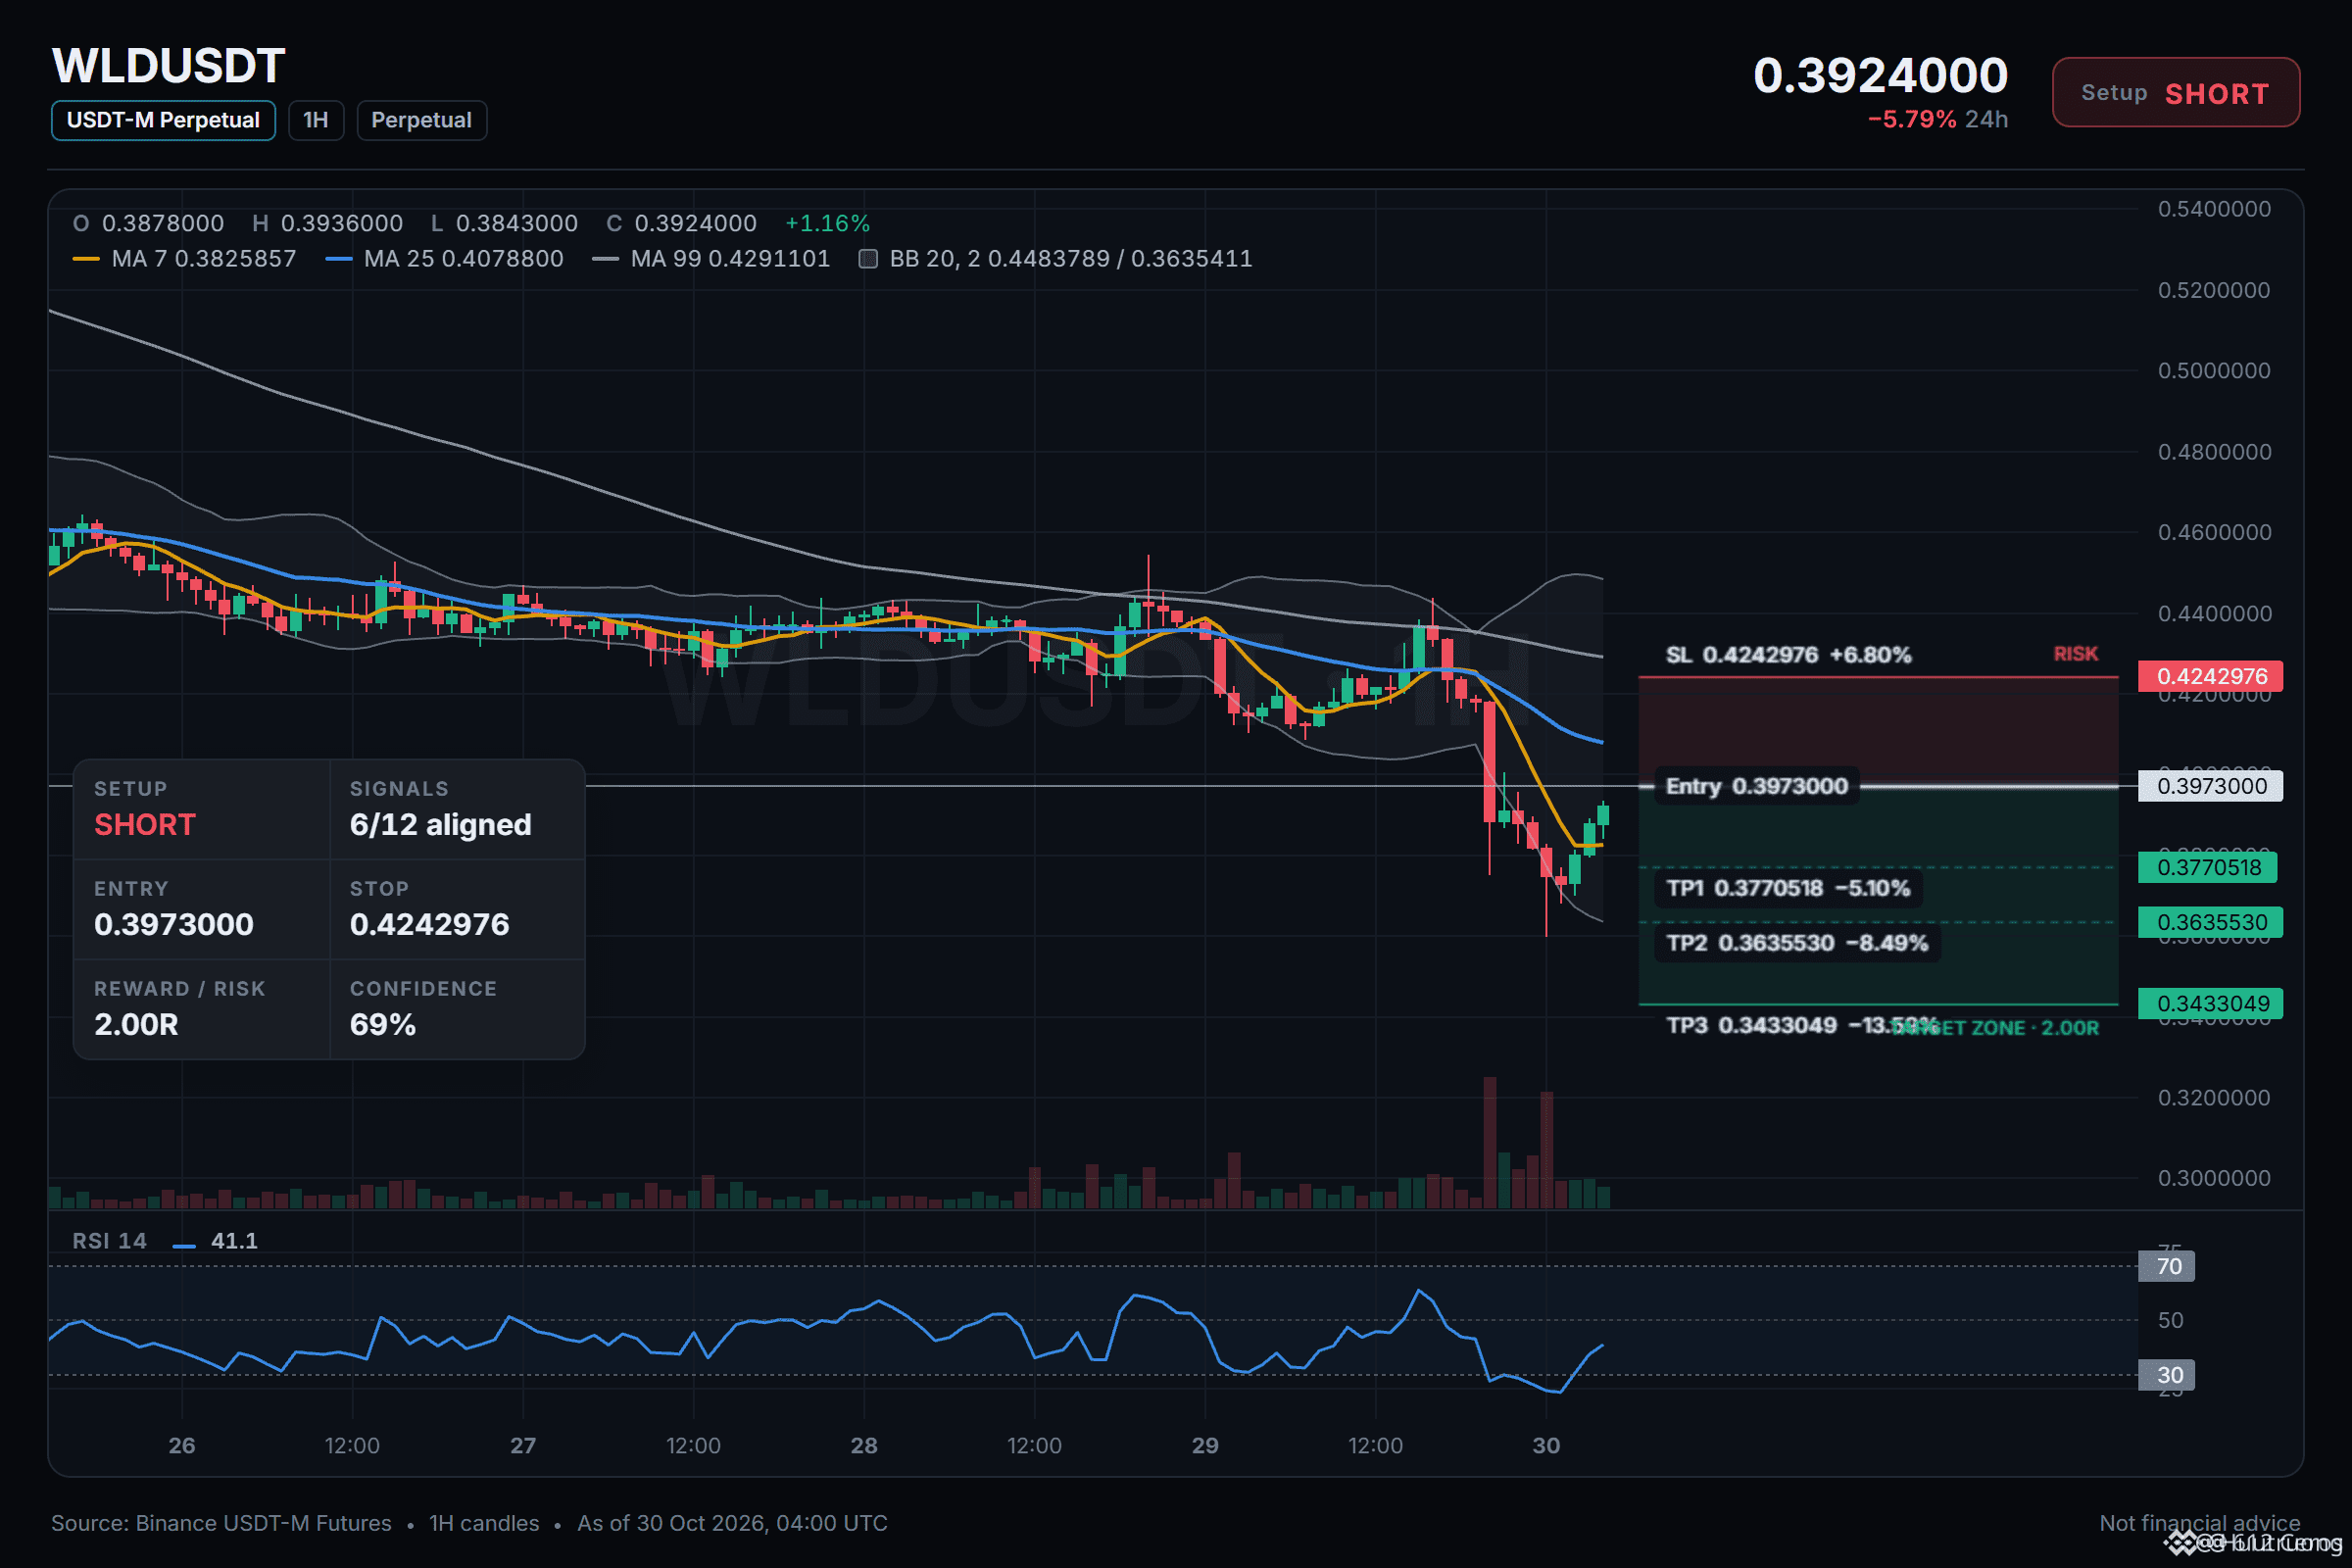
🔴 CORTO $WLD /USDT: se espera que el precio BAJE
Sesgo: CORTO · Fuerte
Entrada: 0.3960594 – 0.3985406
TP1: 0.3770518 (-5.1%)
TP2: 0.3635530 (-8.5%)
TP3: 0.3433049 (-13.6%)
SL: 0.4242976 (+6.8%)
Plan: entrar solo dentro de la zona, cerrar el 50% en TP1, el 25% en TP2, el 25% en TP3 y mover el stop al precio de entrada después de TP1.
¿Por qué CORTO? 6/12 señales coinciden, 1 está en contra.
• Tendencia de 4h bajista (por debajo de EMA50 y EMA200)
• Tendencia de 1h bajista (por debajo de EMA50 y EMA200)
• Los vendedores están impulsando el movimiento (ADX de 15m: 38.2)
Riesgo: Los compradores están presionando ahora mismo (vela de 15m: +1.92%)
Nota del diario: WLD
Estoy siguiendo WLD para abrir una posición corta cerca del precio de 1h de 0.3973000. La tendencia de 4h muestra que el precio está por debajo de EMA50 y EMA200, con una estructura bajista, lo que confirma que la tendencia a corto plazo es descendente. Los vendedores están impulsando el movimiento, con un ADX de 38.2 y DI negativo por encima de DI positivo, mientras que el RSI de 4h en 31.3 muestra un impulso bajista por debajo de 45. Quiero ver que el nivel de invalidación se mantenga por encima del mínimo de entrada de 0.3960594 antes de realizar la operación. El principal riesgo es que la puntuación z del RSI de 15m es positiva, de +1.80, y la última vela ganó un 1.92%, lo que significa que los compradores están presionando ahora mismo.
¿Dónde quieres que se sitúe la invalidación por encima de 0.3960594?
La tendencia diaria está lateral, pero la estructura de 4h es bajista.
🔴 CORTO $WLD /USDT: se espera que el precio BAJE
Sesgo: CORTO · Fuerte
Entrada: 0.3960594 – 0.3985406
TP1: 0.3770518 (-5.1%)
TP2: 0.3635530 (-8.5%)
TP3: 0.3433049 (-13.6%)
SL: 0.4242976 (+6.8%)
Plan: entrar solo dentro de la zona, cerrar el 50% en TP1, el 25% en TP2, el 25% en TP3 y mover el stop al precio de entrada después de TP1.
¿Por qué CORTO? 6/12 señales coinciden, 1 está en contra.
• Tendencia de 4h bajista (por debajo de EMA50 y EMA200)
• Tendencia de 1h bajista (por debajo de EMA50 y EMA200)
• Los vendedores están impulsando el movimiento (ADX de 15m: 38.2)
Riesgo: Los compradores están presionando ahora mismo (vela de 15m: +1.92%)
Nota del diario: WLD
Estoy siguiendo WLD para abrir una posición corta cerca del precio de 1h de 0.3973000. La tendencia de 4h muestra que el precio está por debajo de EMA50 y EMA200, con una estructura bajista, lo que confirma que la tendencia a corto plazo es descendente. Los vendedores están impulsando el movimiento, con un ADX de 38.2 y DI negativo por encima de DI positivo, mientras que el RSI de 4h en 31.3 muestra un impulso bajista por debajo de 45. Quiero ver que el nivel de invalidación se mantenga por encima del mínimo de entrada de 0.3960594 antes de realizar la operación. El principal riesgo es que la puntuación z del RSI de 15m es positiva, de +1.80, y la última vela ganó un 1.92%, lo que significa que los compradores están presionando ahora mismo.
¿Dónde quieres que se sitúe la invalidación por encima de 0.3960594?
🔴 CORTO $WLD /USDT: se espera que el precio BAJE
Sesgo: CORTO · Fuerte
Entrada: 0.3960594 – 0.3985406
TP1: 0.3770518 (-5.1%)
TP2: 0.3635530 (-8.5%)
TP3: 0.3433049 (-13.6%)
SL: 0.4242976 (+6.8%)
Plan: entrar solo dentro de la zona, cerrar el 50% en TP1, el 25% en TP2, el 25% en TP3 y mover el stop al precio de entrada después de TP1.
¿Por qué CORTO? 6/12 señales coinciden, 1 está en contra.
• Tendencia de 4h bajista (por debajo de EMA50 y EMA200)
• Tendencia de 1h bajista (por debajo de EMA50 y EMA200)
• Los vendedores están impulsando el movimiento (ADX de 15m: 38.2)
Riesgo: Los compradores están presionando ahora mismo (vela de 15m: +1.92%)
Nota del diario: WLD
Estoy siguiendo WLD para abrir una posición corta cerca del precio de 1h de 0.3973000. La tendencia de 4h muestra que el precio está por debajo de EMA50 y EMA200, con una estructura bajista, lo que confirma que la tendencia a corto plazo es descendente. Los vendedores están impulsando el movimiento, con un ADX de 38.2 y DI negativo por encima de DI positivo, mientras que el RSI de 4h en 31.3 muestra un impulso bajista por debajo de 45. Quiero ver que el nivel de invalidación se mantenga por encima del mínimo de entrada de 0.3960594 antes de realizar la operación. El principal riesgo es que la puntuación z del RSI de 15m es positiva, de +1.80, y la última vela ganó un 1.92%, lo que significa que los compradores están presionando ahora mismo.
¿Dónde quieres que se sitúe la invalidación por encima de 0.3960594?
8
·
--
Bajista
La configuración bajista de 1h se mantiene mientras la tendencia de 4h sigue a la baja.
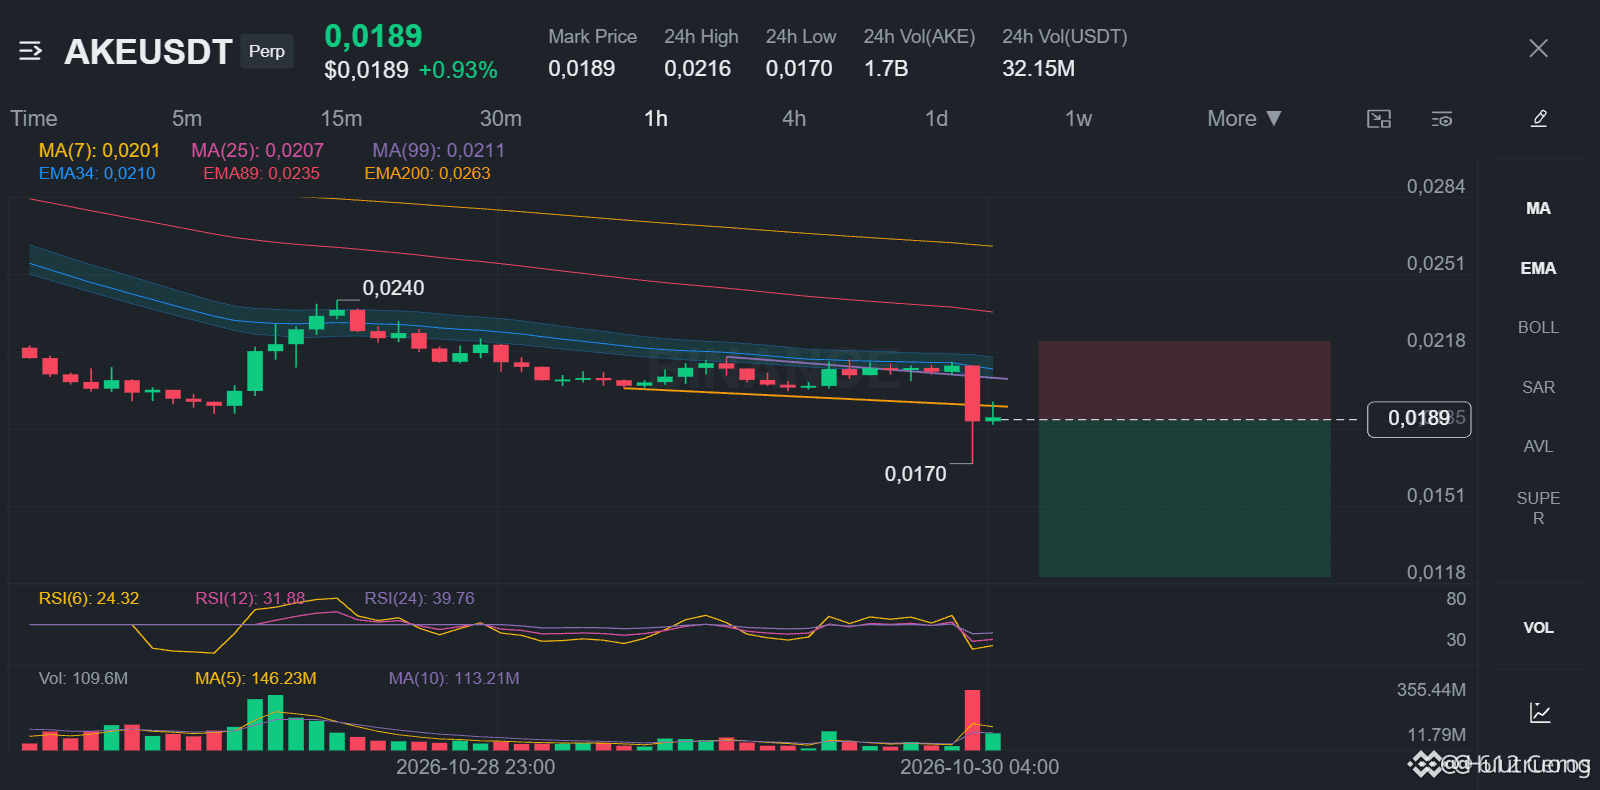
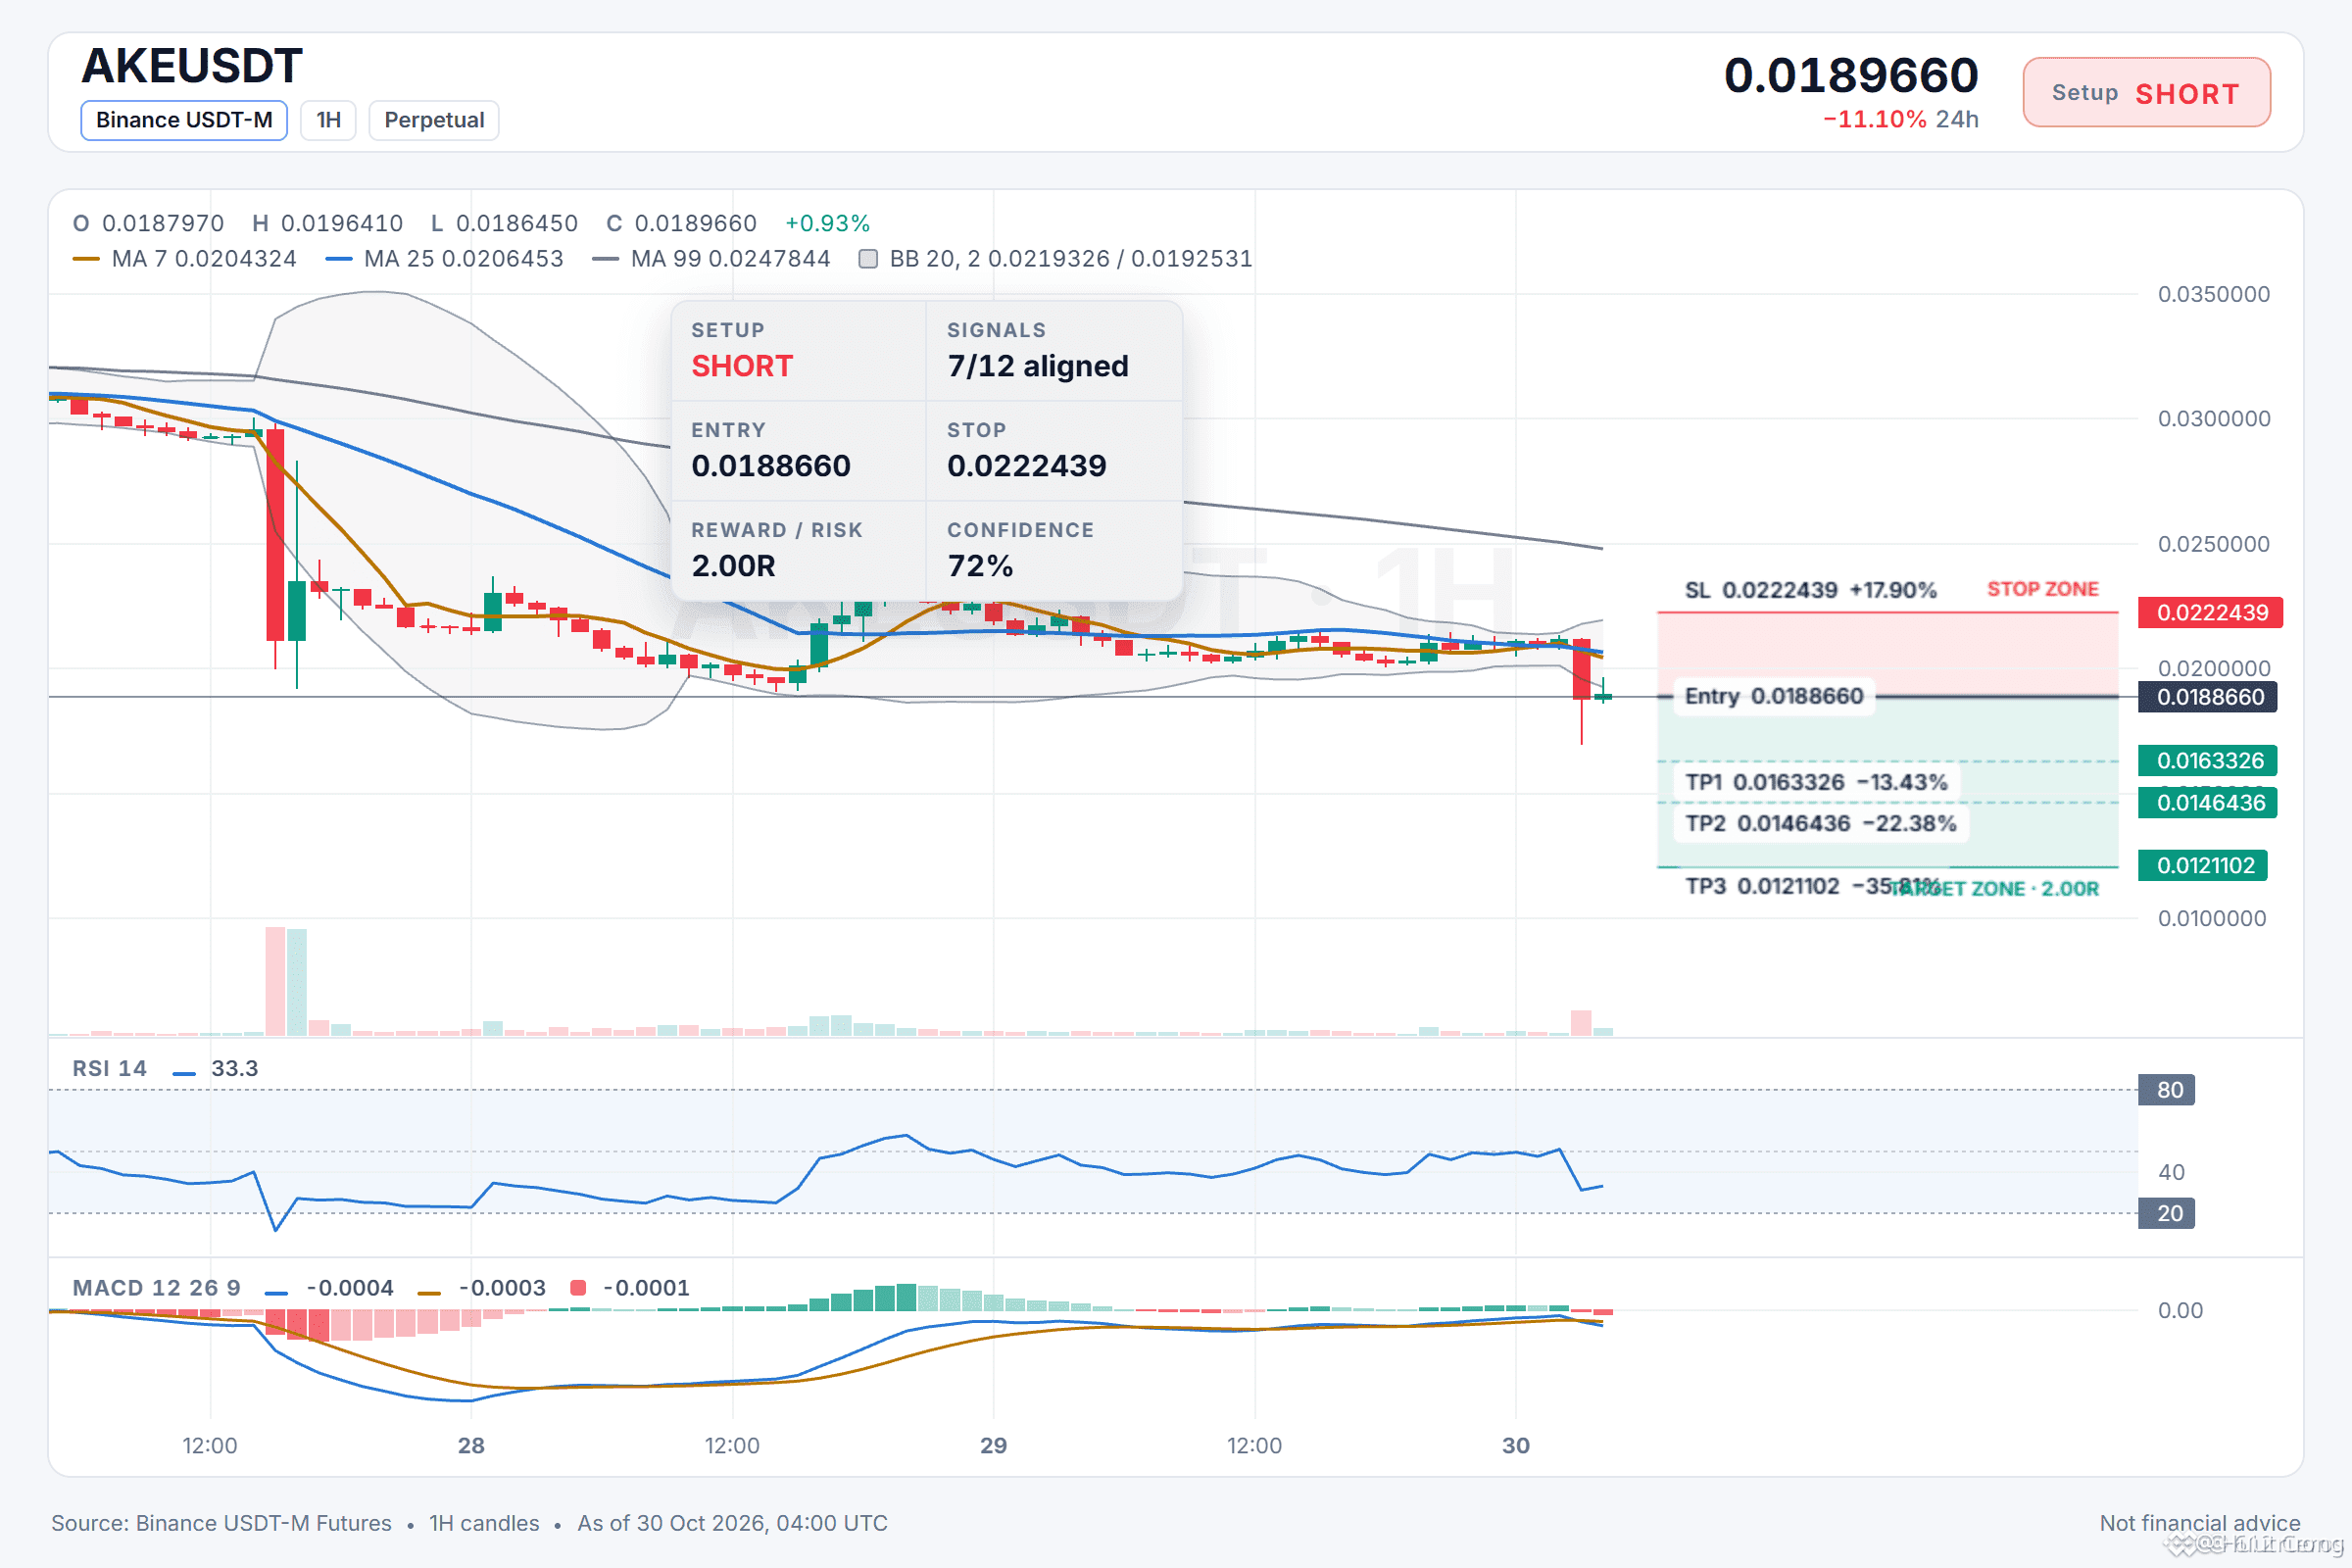
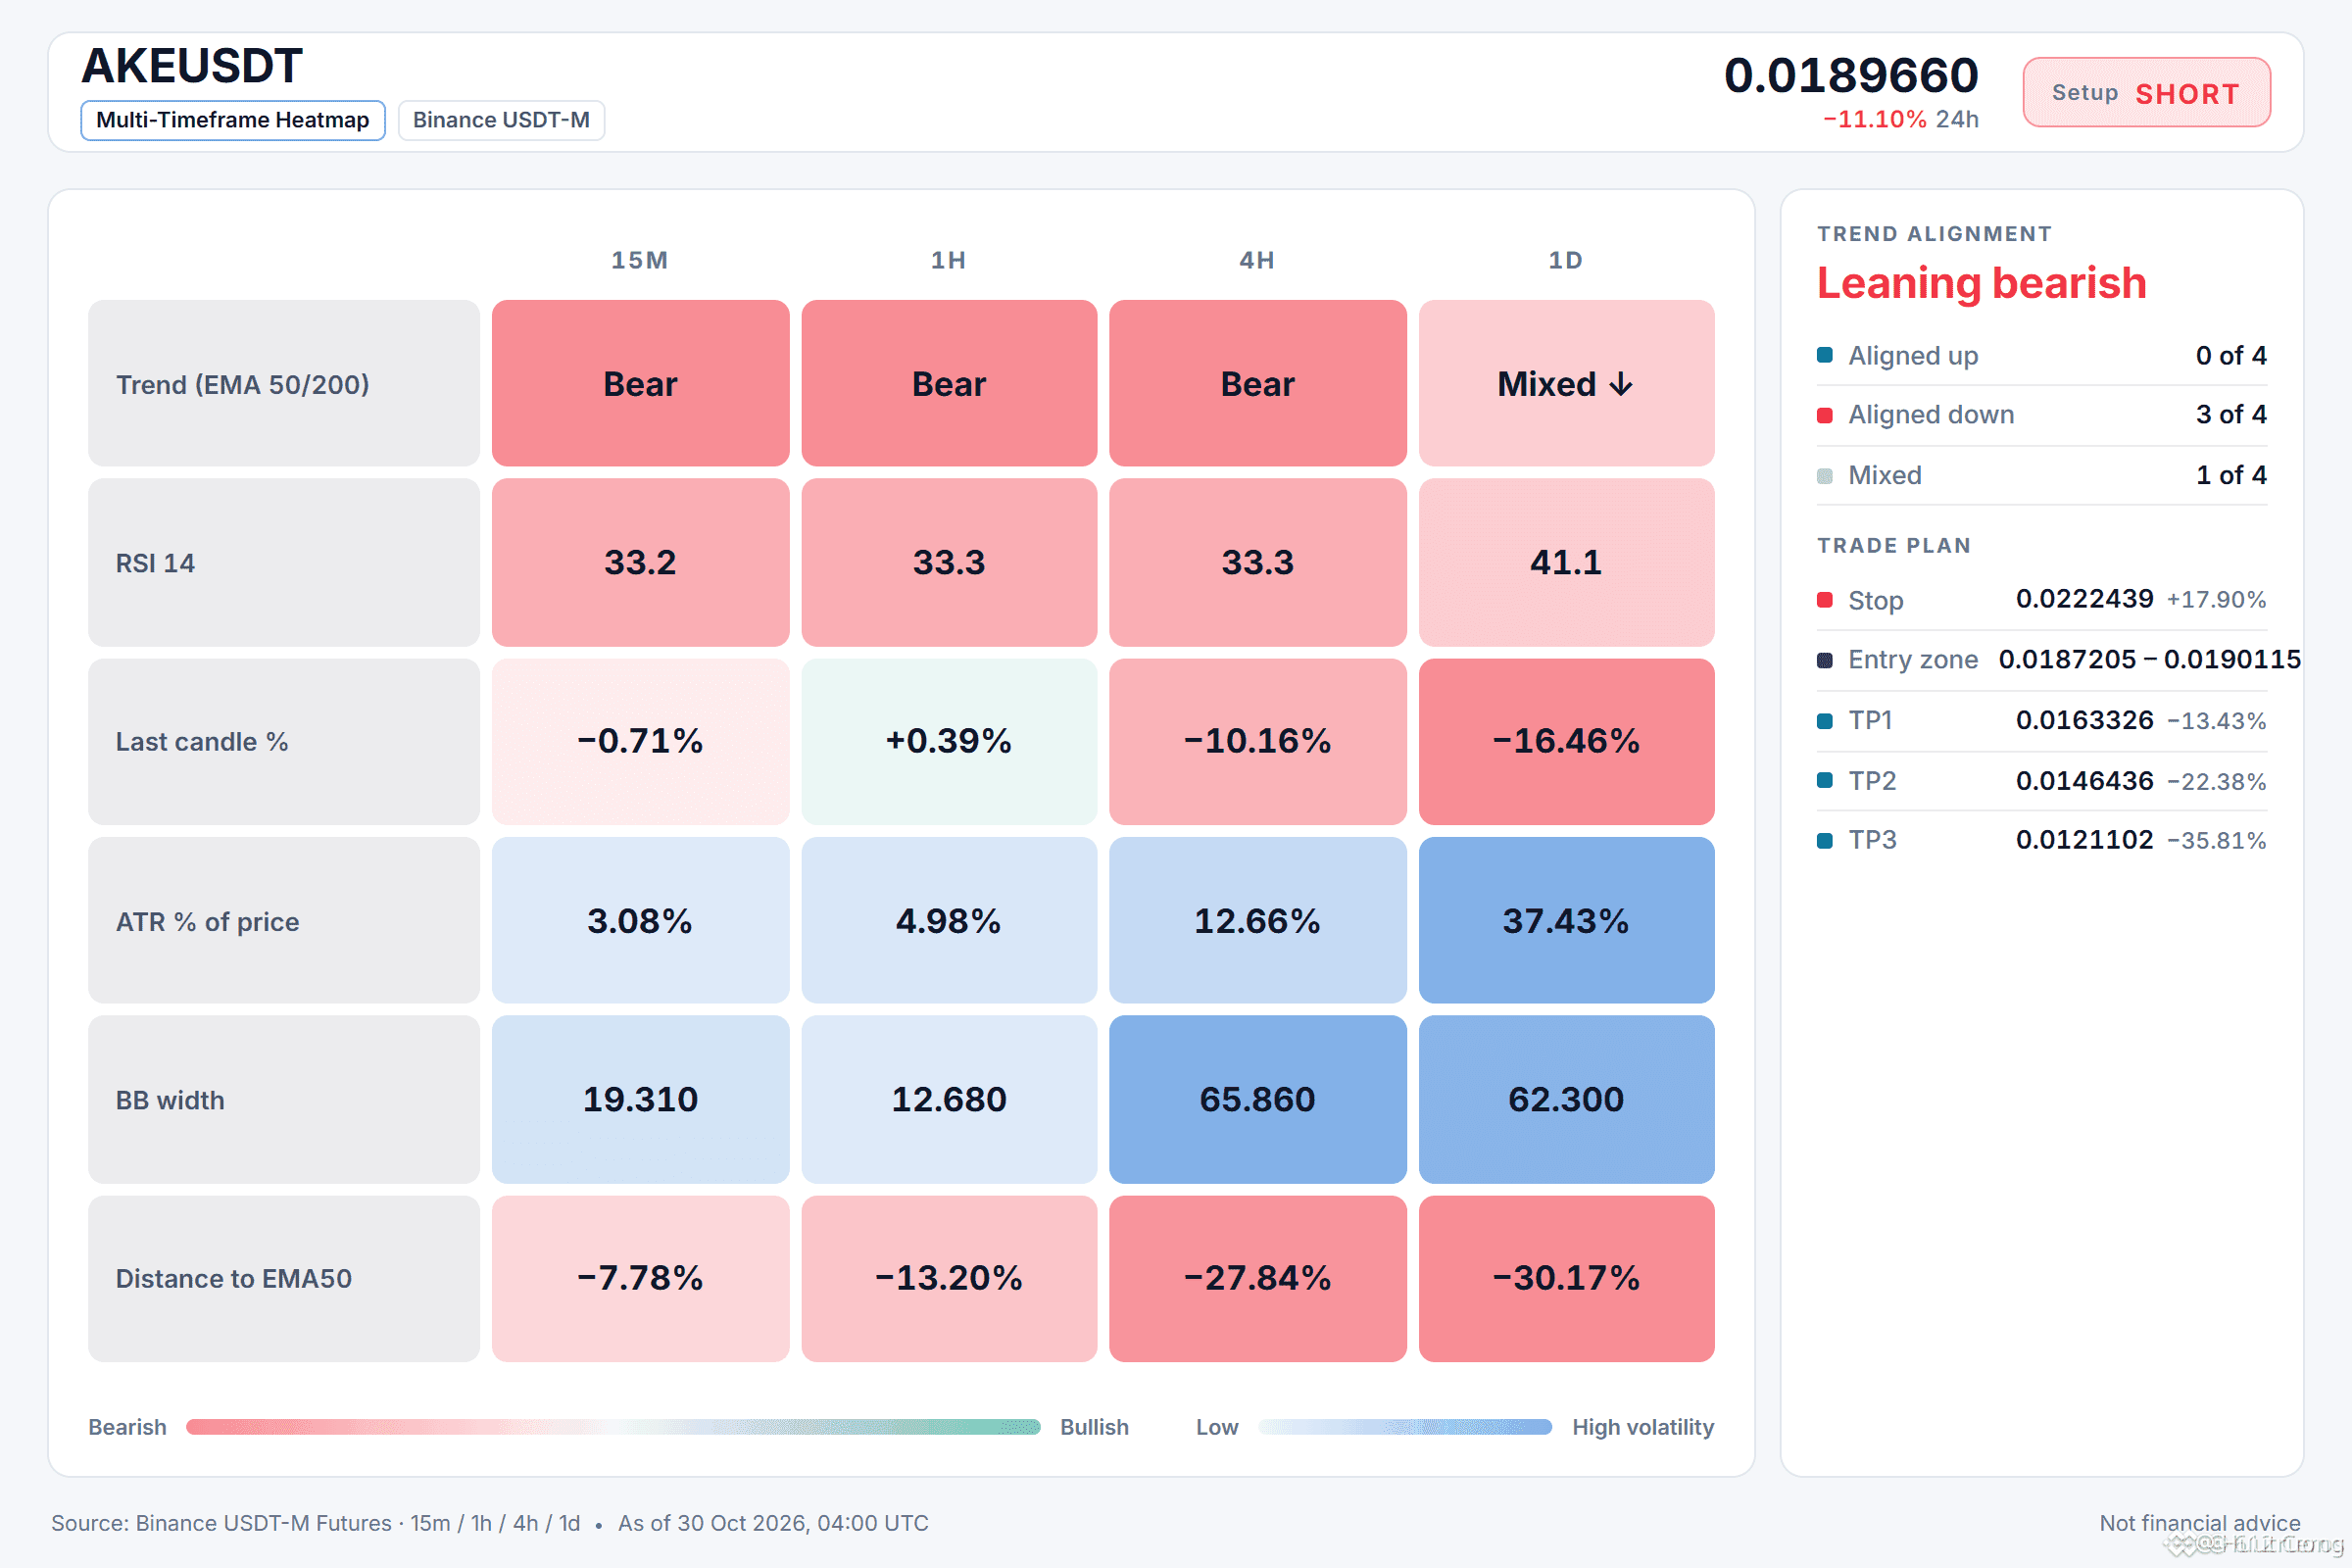
🔴 CORTO $AKE /USDT: se espera que el precio BAJE
Sesgo: CORTO · Fuerte
Entrada: 0.0187205 – 0.0190115
TP1: 0.0163326 (-13.4%)
TP2: 0.0146436 (-22.4%)
TP3: 0.0121102 (-35.8%)
SL: 0.0222439 (+17.9%)
Plan: entrar solo dentro de la zona, cerrar el 50% en TP1, el 25% en TP2 y el 25% en TP3, y mover el stop al precio de entrada después de TP1.
¿Por qué CORTO? 7/12 señales están de acuerdo, 1 en contra.
• Tendencia de 4h bajista (por debajo de EMA50 y EMA200)
• Tendencia de 1h bajista (por debajo de EMA50 y EMA200)
• Los vendedores impulsan el movimiento (ADX de 15m: 36.2)
Riesgo: Muy por debajo de su promedio; es probable un rebote (−3.1 ATR desde la EMA50 de 1h)
En resumen:
1. La tendencia de 4h muestra que el precio está por debajo de EMA50 y EMA200, en una configuración bajista que confirma que la tendencia del movimiento es descendente.
2. El RSI de 1h está en 33.3, lo que indica un impulso bajista y que los vendedores controlan el movimiento.
3. La configuración deja de ser válida si el precio recupera el nivel de entrada en 0.0190115, lo que indicaría que está en marcha un rebote.
¿Dónde esperas que los vendedores vuelvan a defender el precio?
La configuración bajista de 1h se mantiene mientras la tendencia de 4h sigue a la baja.
🔴 CORTO $AKE /USDT: se espera que el precio BAJE
Sesgo: CORTO · Fuerte
Entrada: 0.0187205 – 0.0190115
TP1: 0.0163326 (-13.4%)
TP2: 0.0146436 (-22.4%)
TP3: 0.0121102 (-35.8%)
SL: 0.0222439 (+17.9%)
Plan: entrar solo dentro de la zona, cerrar el 50% en TP1, el 25% en TP2 y el 25% en TP3, y mover el stop al precio de entrada después de TP1.
¿Por qué CORTO? 7/12 señales están de acuerdo, 1 en contra.
• Tendencia de 4h bajista (por debajo de EMA50 y EMA200)
• Tendencia de 1h bajista (por debajo de EMA50 y EMA200)
• Los vendedores impulsan el movimiento (ADX de 15m: 36.2)
Riesgo: Muy por debajo de su promedio; es probable un rebote (−3.1 ATR desde la EMA50 de 1h)
En resumen:
1. La tendencia de 4h muestra que el precio está por debajo de EMA50 y EMA200, en una configuración bajista que confirma que la tendencia del movimiento es descendente.
2. El RSI de 1h está en 33.3, lo que indica un impulso bajista y que los vendedores controlan el movimiento.
3. La configuración deja de ser válida si el precio recupera el nivel de entrada en 0.0190115, lo que indicaría que está en marcha un rebote.
¿Dónde esperas que los vendedores vuelvan a defender el precio?
🔴 CORTO $AKE /USDT: se espera que el precio BAJE
Sesgo: CORTO · Fuerte
Entrada: 0.0187205 – 0.0190115
TP1: 0.0163326 (-13.4%)
TP2: 0.0146436 (-22.4%)
TP3: 0.0121102 (-35.8%)
SL: 0.0222439 (+17.9%)
Plan: entrar solo dentro de la zona, cerrar el 50% en TP1, el 25% en TP2 y el 25% en TP3, y mover el stop al precio de entrada después de TP1.
¿Por qué CORTO? 7/12 señales están de acuerdo, 1 en contra.
• Tendencia de 4h bajista (por debajo de EMA50 y EMA200)
• Tendencia de 1h bajista (por debajo de EMA50 y EMA200)
• Los vendedores impulsan el movimiento (ADX de 15m: 36.2)
Riesgo: Muy por debajo de su promedio; es probable un rebote (−3.1 ATR desde la EMA50 de 1h)
En resumen:
1. La tendencia de 4h muestra que el precio está por debajo de EMA50 y EMA200, en una configuración bajista que confirma que la tendencia del movimiento es descendente.
2. El RSI de 1h está en 33.3, lo que indica un impulso bajista y que los vendedores controlan el movimiento.
3. La configuración deja de ser válida si el precio recupera el nivel de entrada en 0.0190115, lo que indicaría que está en marcha un rebote.
¿Dónde esperas que los vendedores vuelvan a defender el precio?
28
·
--
Bajista
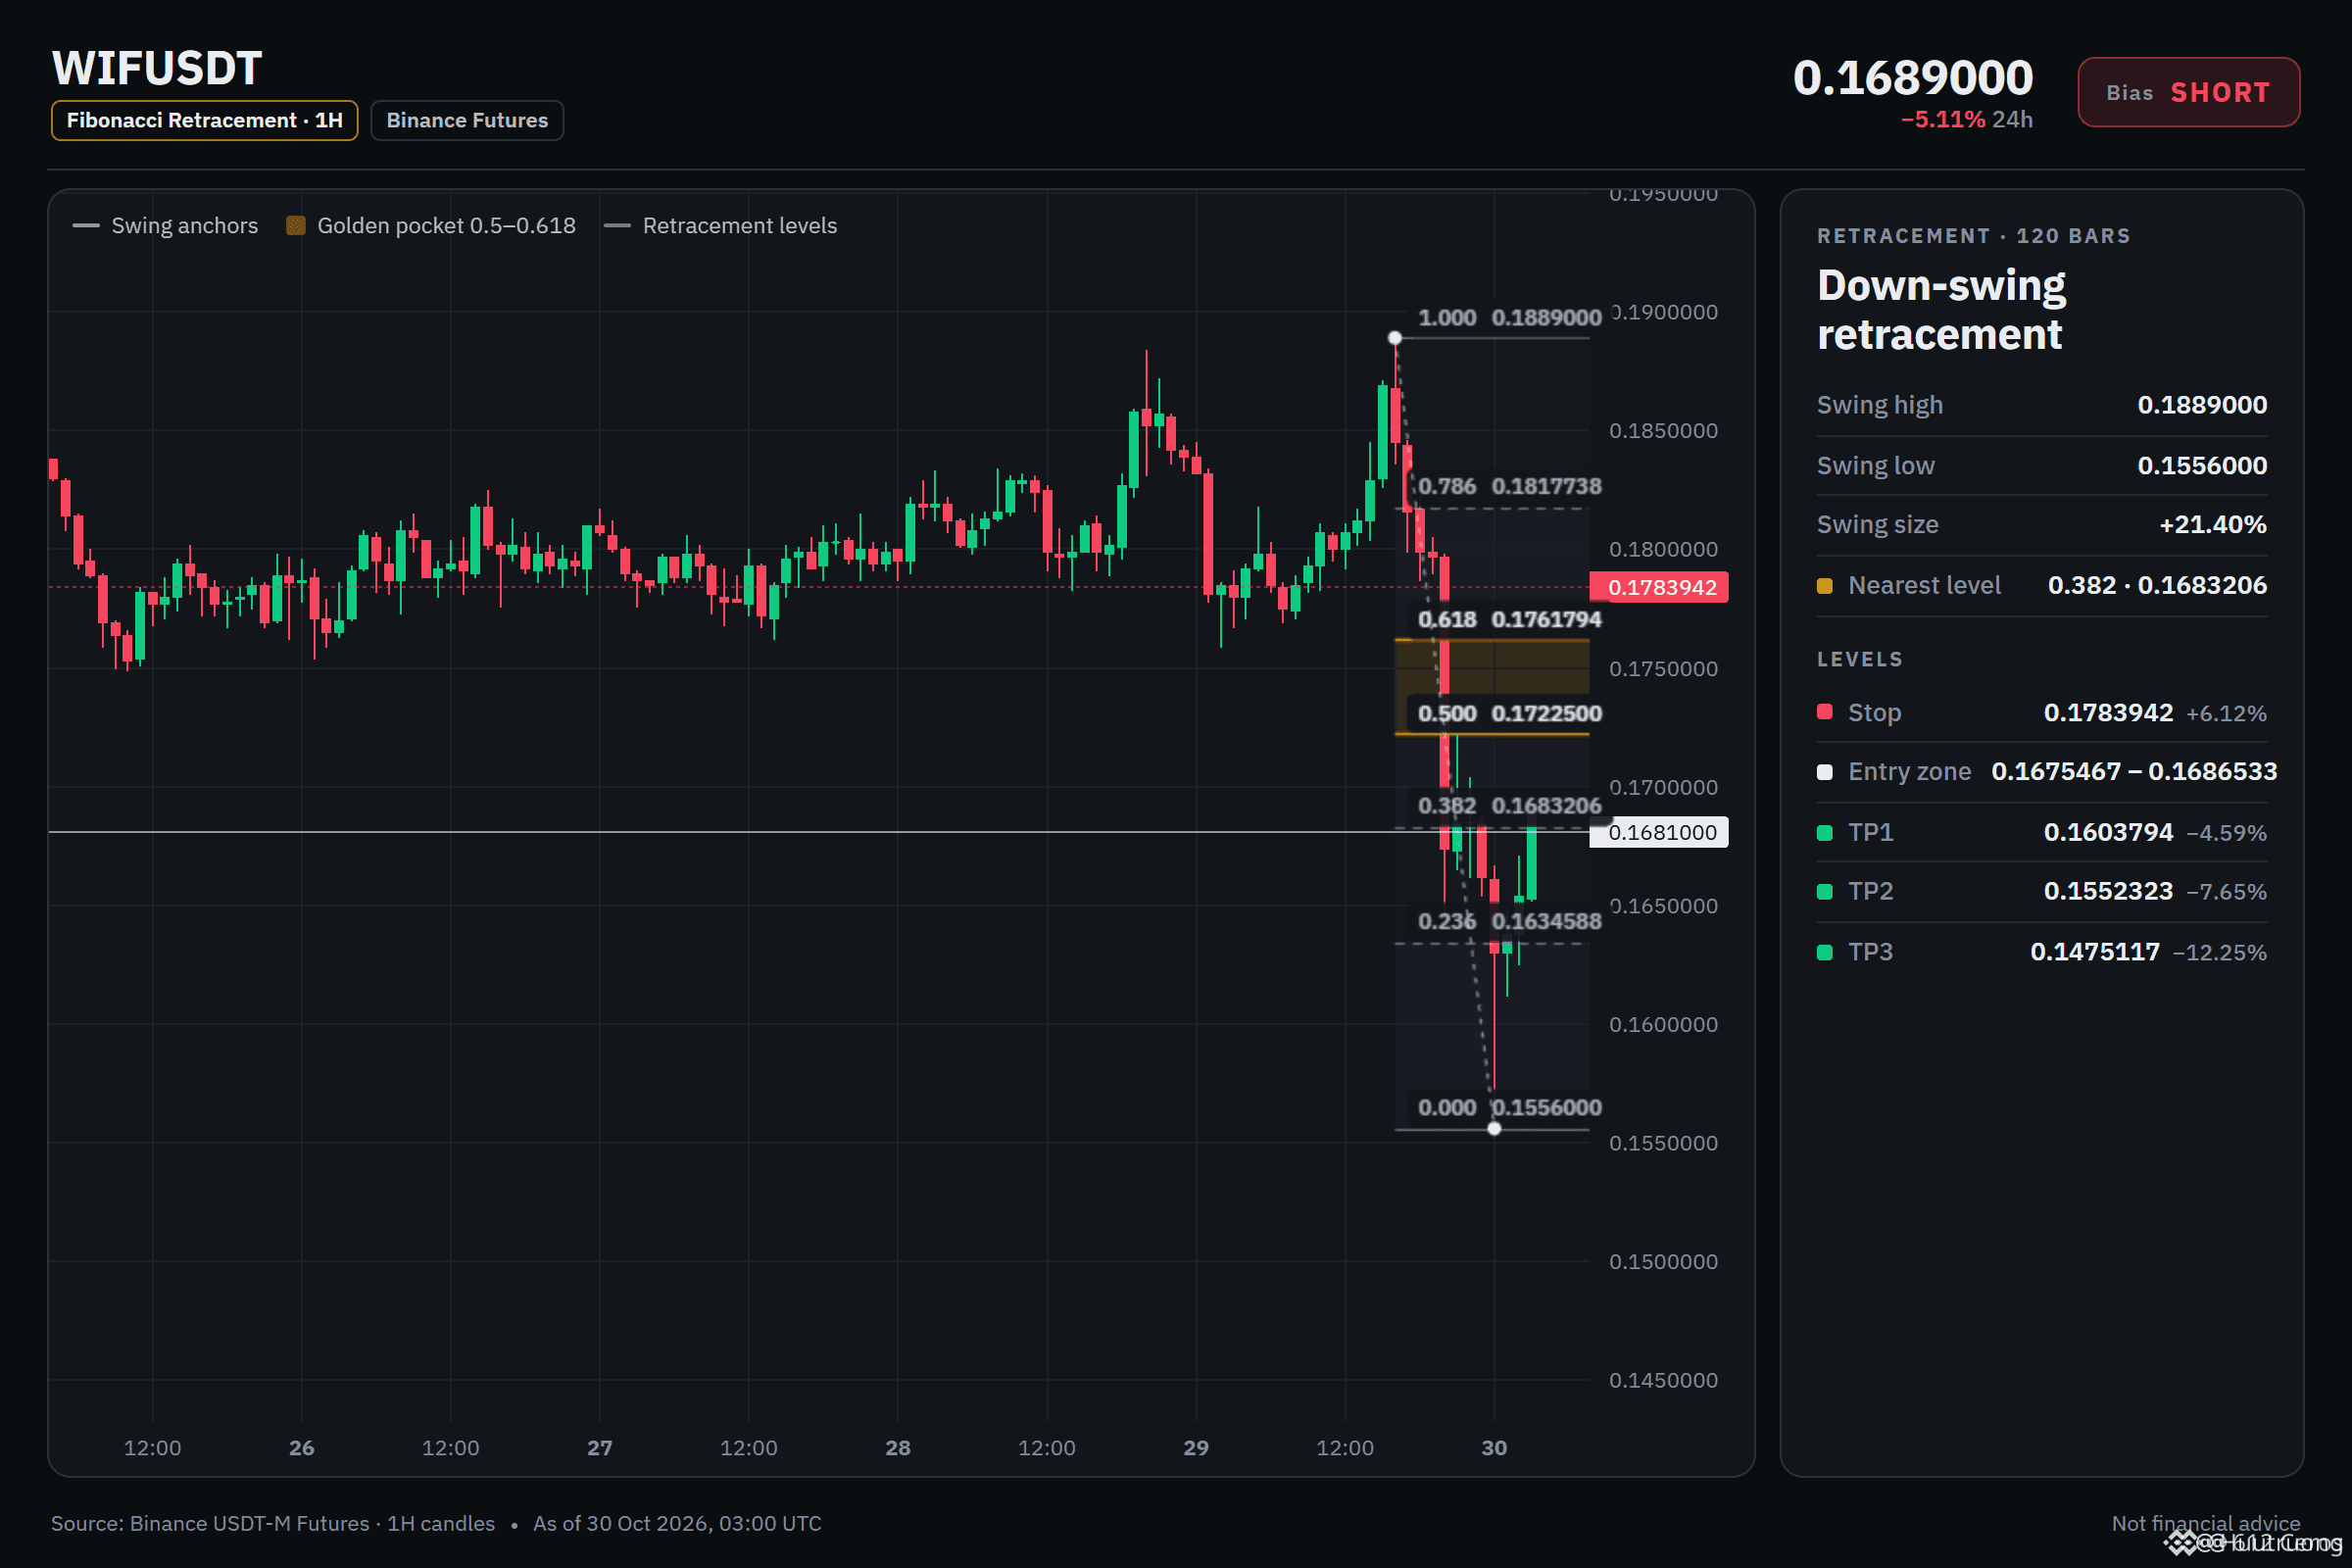
WIF, configuración en corto: los niveles que estoy observando
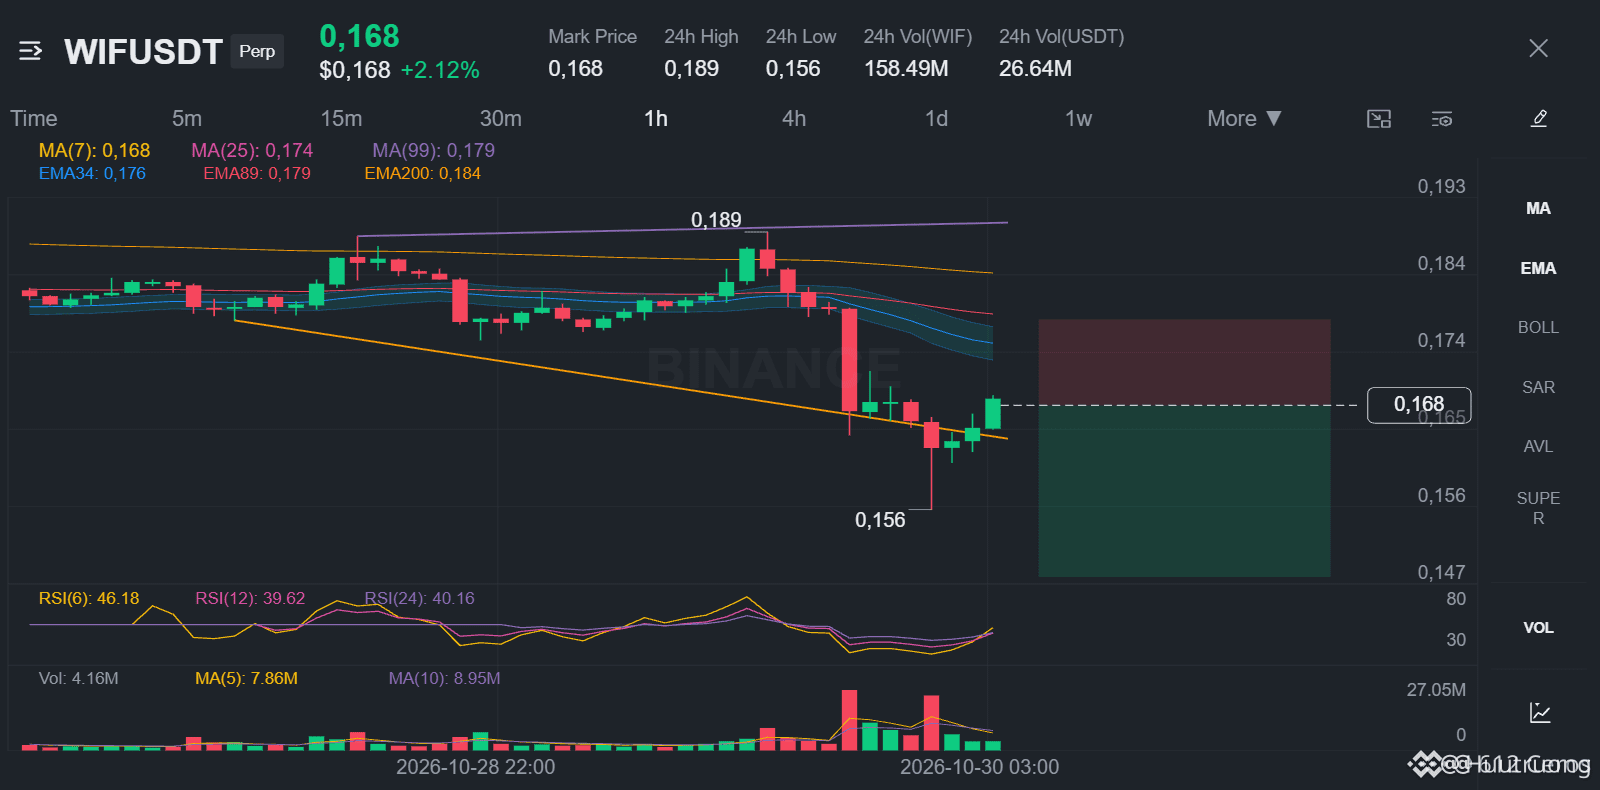
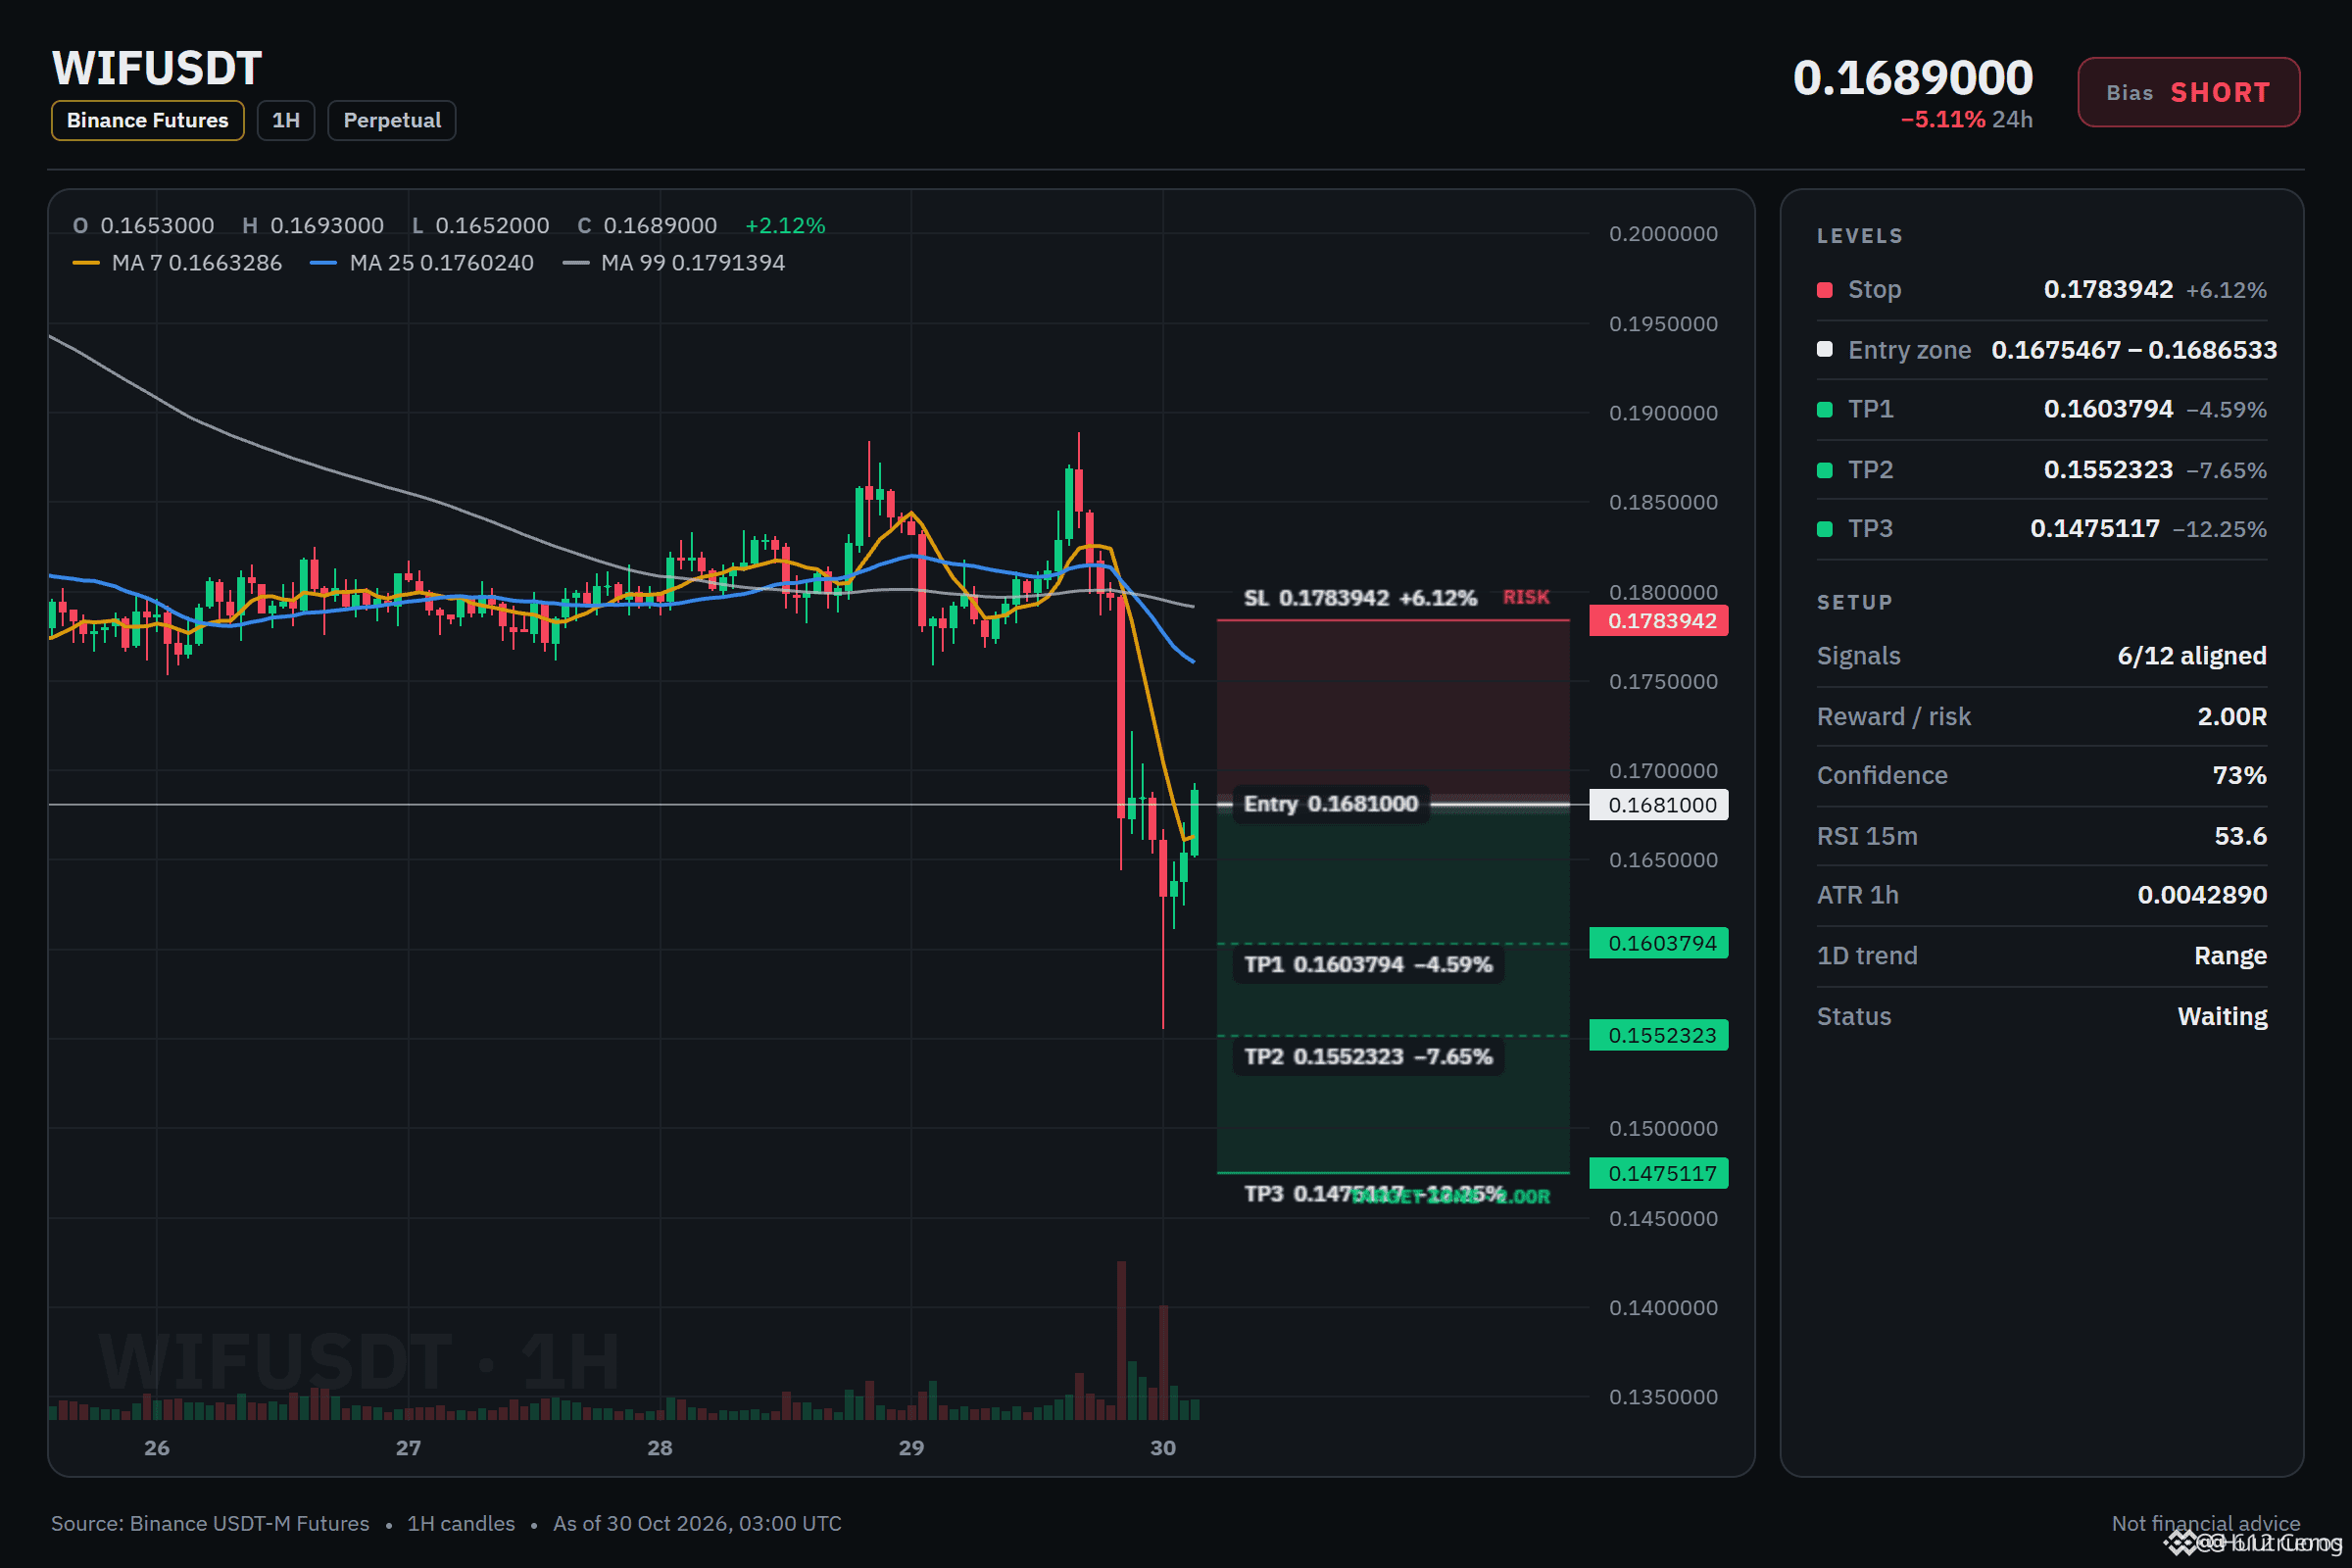
🔴 CORTO $WIF /USDT: espero que el precio BAJE
Sesgo: CORTO · Fuerte
Entrada: 0.1675467 – 0.1686533
TP1: 0.1603794 (-4.6%)
TP2: 0.1552323 (-7.7%)
TP3: 0.1475117 (-12.2%)
SL: 0.1783942 (+6.1%)
Plan: entrar solo dentro de la zona, cerrar el 50% en TP1, el 25% en TP2 y el 25% en TP3, y mover el stop al precio de entrada después de TP1.
¿Por qué CORTO? 6/12 señales coinciden, 0 están en contra.
• Tendencia bajista en 4 h (por debajo de EMA50 y EMA200)
• Tendencia bajista en 1 h (por debajo de EMA50 y EMA200)
• Los vendedores impulsan el movimiento (ADX de 15 min: 42.5)
¿Por qué ahora?
La tendencia diaria indica un rango, y 6/12 señales alineadas favorecen la posición en corto. El plan es operar en la zona de 0.1675467 – 0.1686533, cerrar posiciones gradualmente en 0.1603794 y 0.1552323, y esperar con paciencia hasta 0.1475117. Un movimiento por encima de 0.1783942 significa que la idea es errónea y que el stop está cumpliendo su función.
¿WIF alcanza primero 0.1603794 o el stop?
WIF, configuración en corto: los niveles que estoy observando
🔴 CORTO $WIF /USDT: espero que el precio BAJE
Sesgo: CORTO · Fuerte
Entrada: 0.1675467 – 0.1686533
TP1: 0.1603794 (-4.6%)
TP2: 0.1552323 (-7.7%)
TP3: 0.1475117 (-12.2%)
SL: 0.1783942 (+6.1%)
Plan: entrar solo dentro de la zona, cerrar el 50% en TP1, el 25% en TP2 y el 25% en TP3, y mover el stop al precio de entrada después de TP1.
¿Por qué CORTO? 6/12 señales coinciden, 0 están en contra.
• Tendencia bajista en 4 h (por debajo de EMA50 y EMA200)
• Tendencia bajista en 1 h (por debajo de EMA50 y EMA200)
• Los vendedores impulsan el movimiento (ADX de 15 min: 42.5)
¿Por qué ahora?
La tendencia diaria indica un rango, y 6/12 señales alineadas favorecen la posición en corto. El plan es operar en la zona de 0.1675467 – 0.1686533, cerrar posiciones gradualmente en 0.1603794 y 0.1552323, y esperar con paciencia hasta 0.1475117. Un movimiento por encima de 0.1783942 significa que la idea es errónea y que el stop está cumpliendo su función.
¿WIF alcanza primero 0.1603794 o el stop?
🔴 CORTO $WIF /USDT: espero que el precio BAJE
Sesgo: CORTO · Fuerte
Entrada: 0.1675467 – 0.1686533
TP1: 0.1603794 (-4.6%)
TP2: 0.1552323 (-7.7%)
TP3: 0.1475117 (-12.2%)
SL: 0.1783942 (+6.1%)
Plan: entrar solo dentro de la zona, cerrar el 50% en TP1, el 25% en TP2 y el 25% en TP3, y mover el stop al precio de entrada después de TP1.
¿Por qué CORTO? 6/12 señales coinciden, 0 están en contra.
• Tendencia bajista en 4 h (por debajo de EMA50 y EMA200)
• Tendencia bajista en 1 h (por debajo de EMA50 y EMA200)
• Los vendedores impulsan el movimiento (ADX de 15 min: 42.5)
¿Por qué ahora?
La tendencia diaria indica un rango, y 6/12 señales alineadas favorecen la posición en corto. El plan es operar en la zona de 0.1675467 – 0.1686533, cerrar posiciones gradualmente en 0.1603794 y 0.1552323, y esperar con paciencia hasta 0.1475117. Un movimiento por encima de 0.1783942 significa que la idea es errónea y que el stop está cumpliendo su función.
¿WIF alcanza primero 0.1603794 o el stop?
14
·
--
Bajista
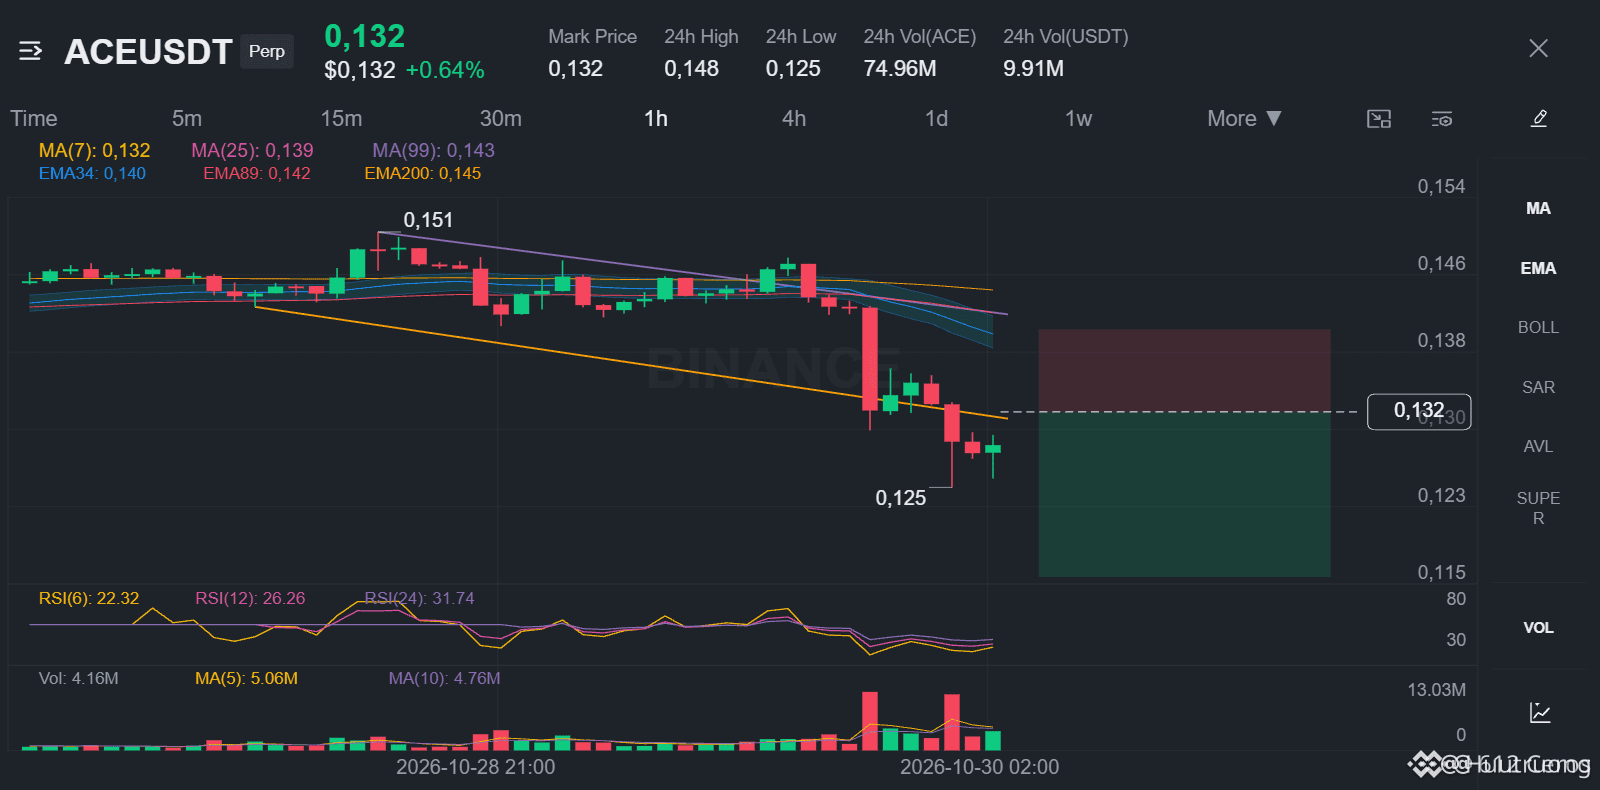
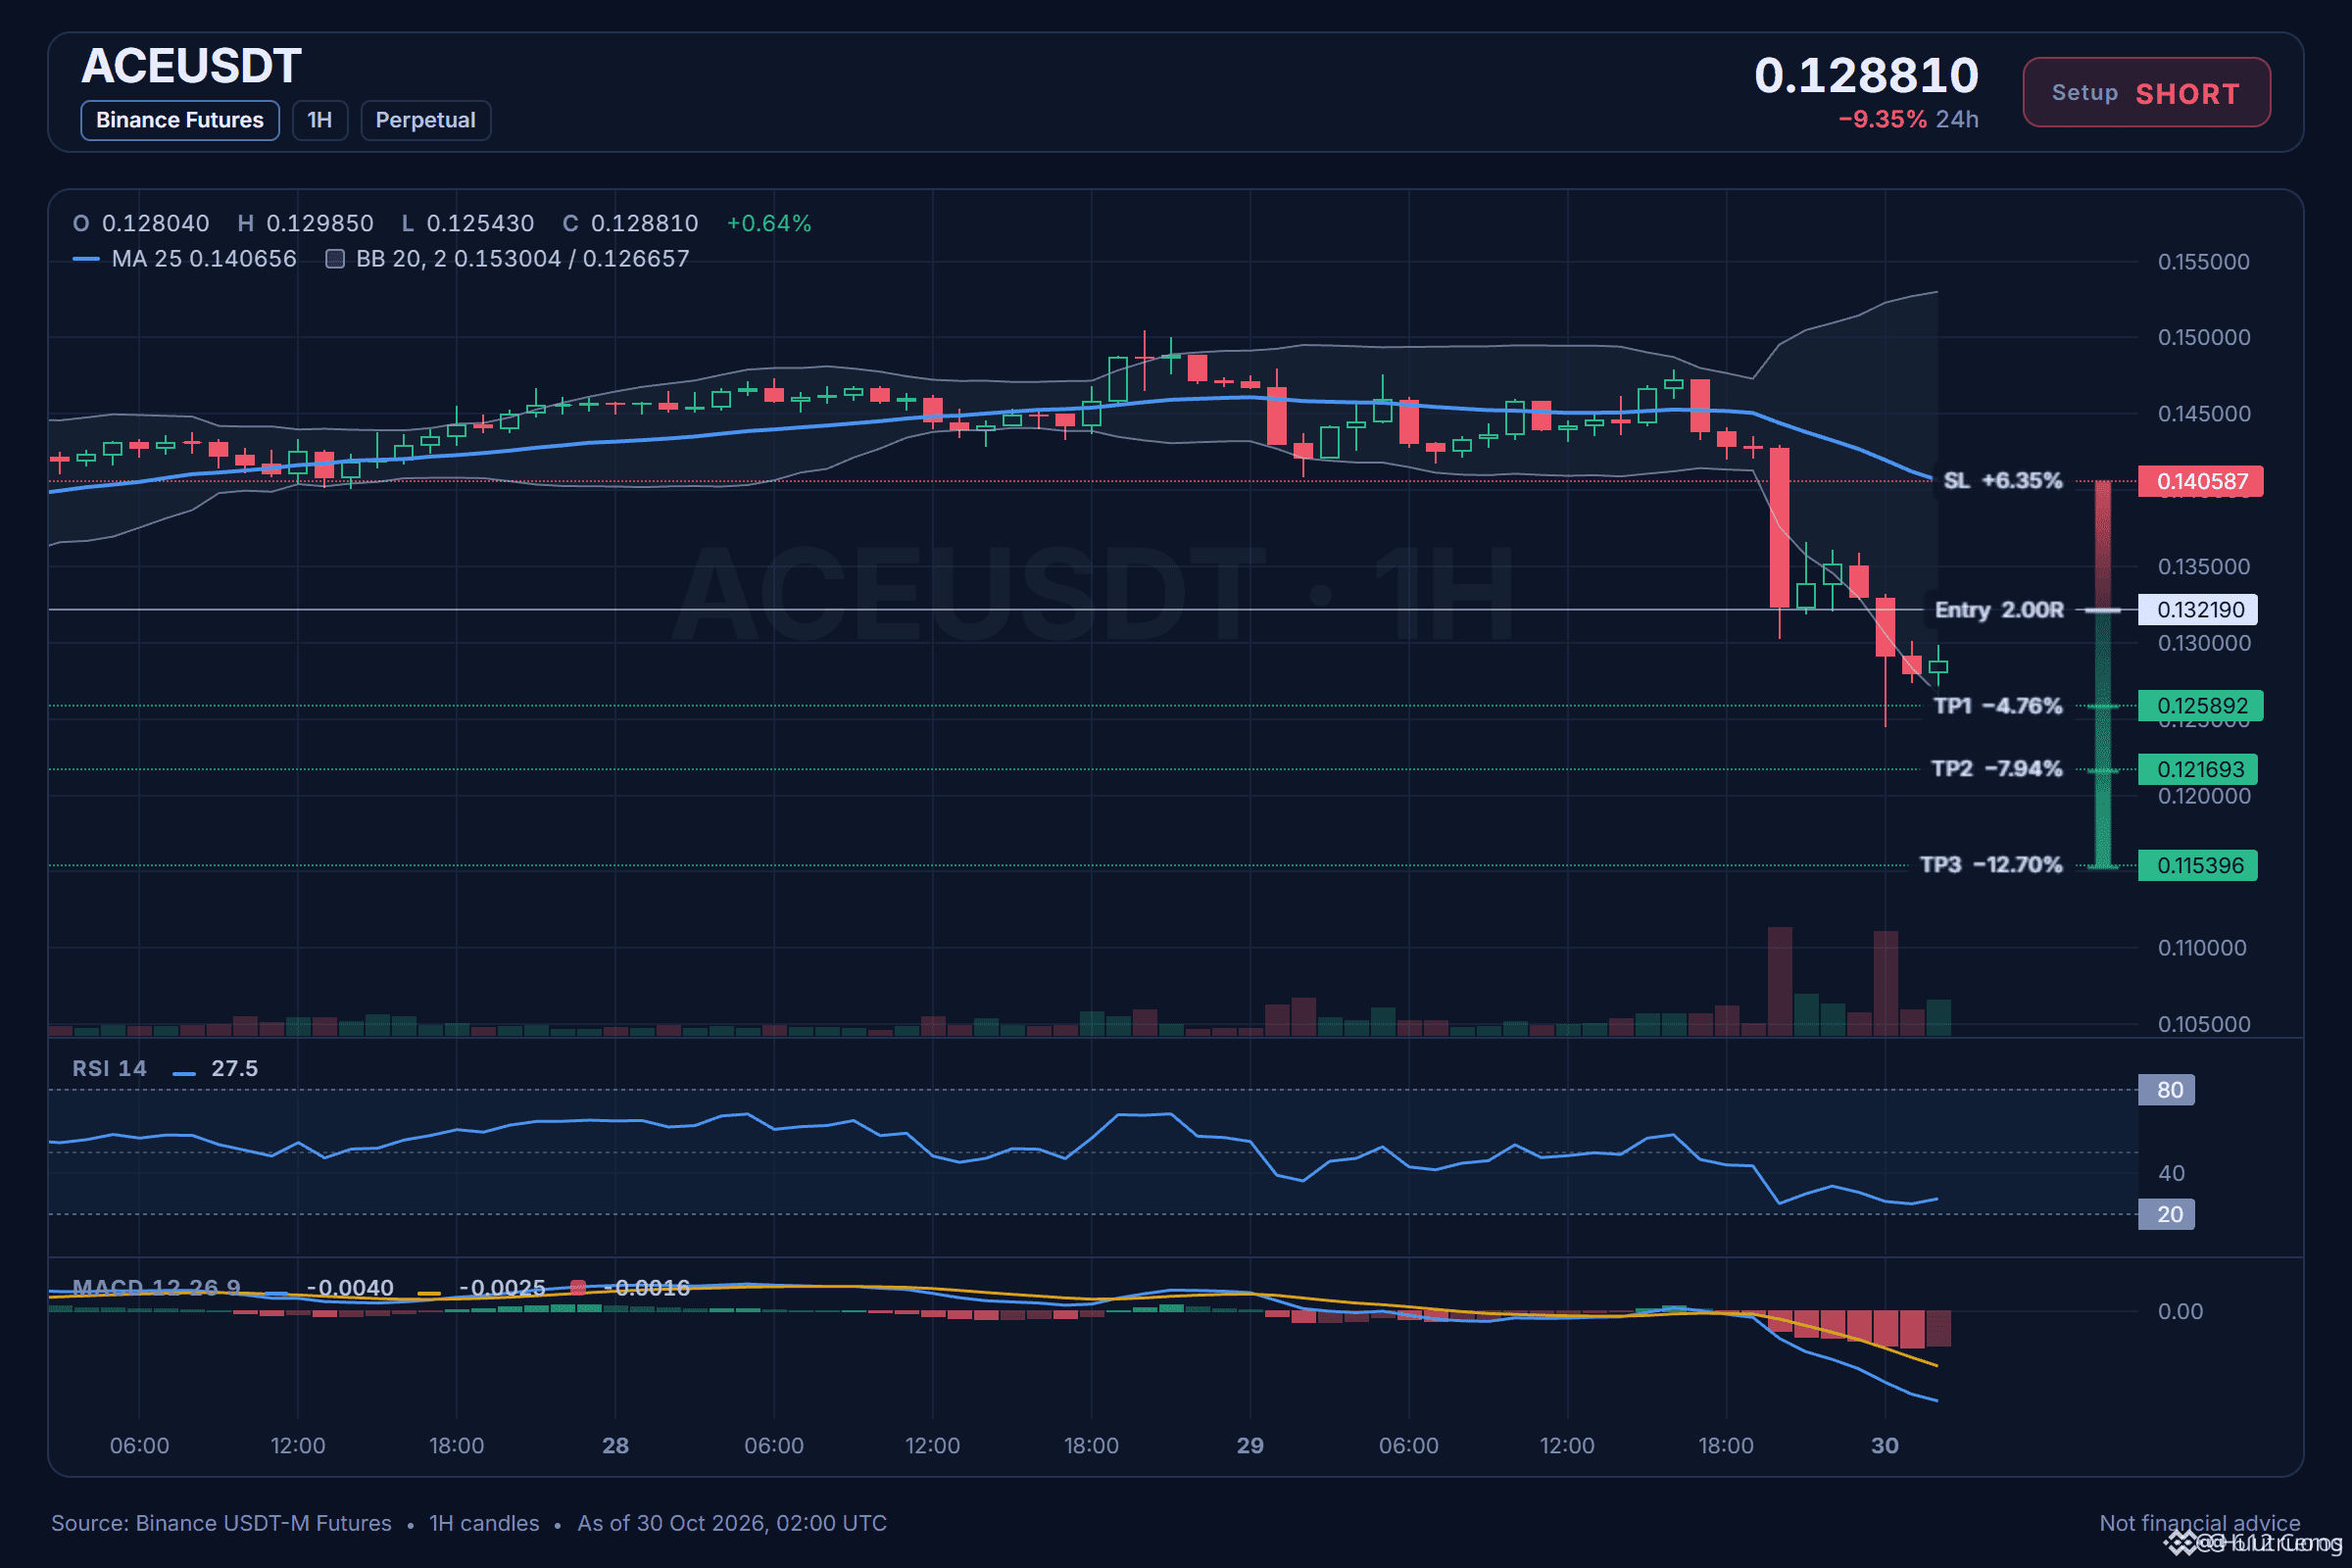
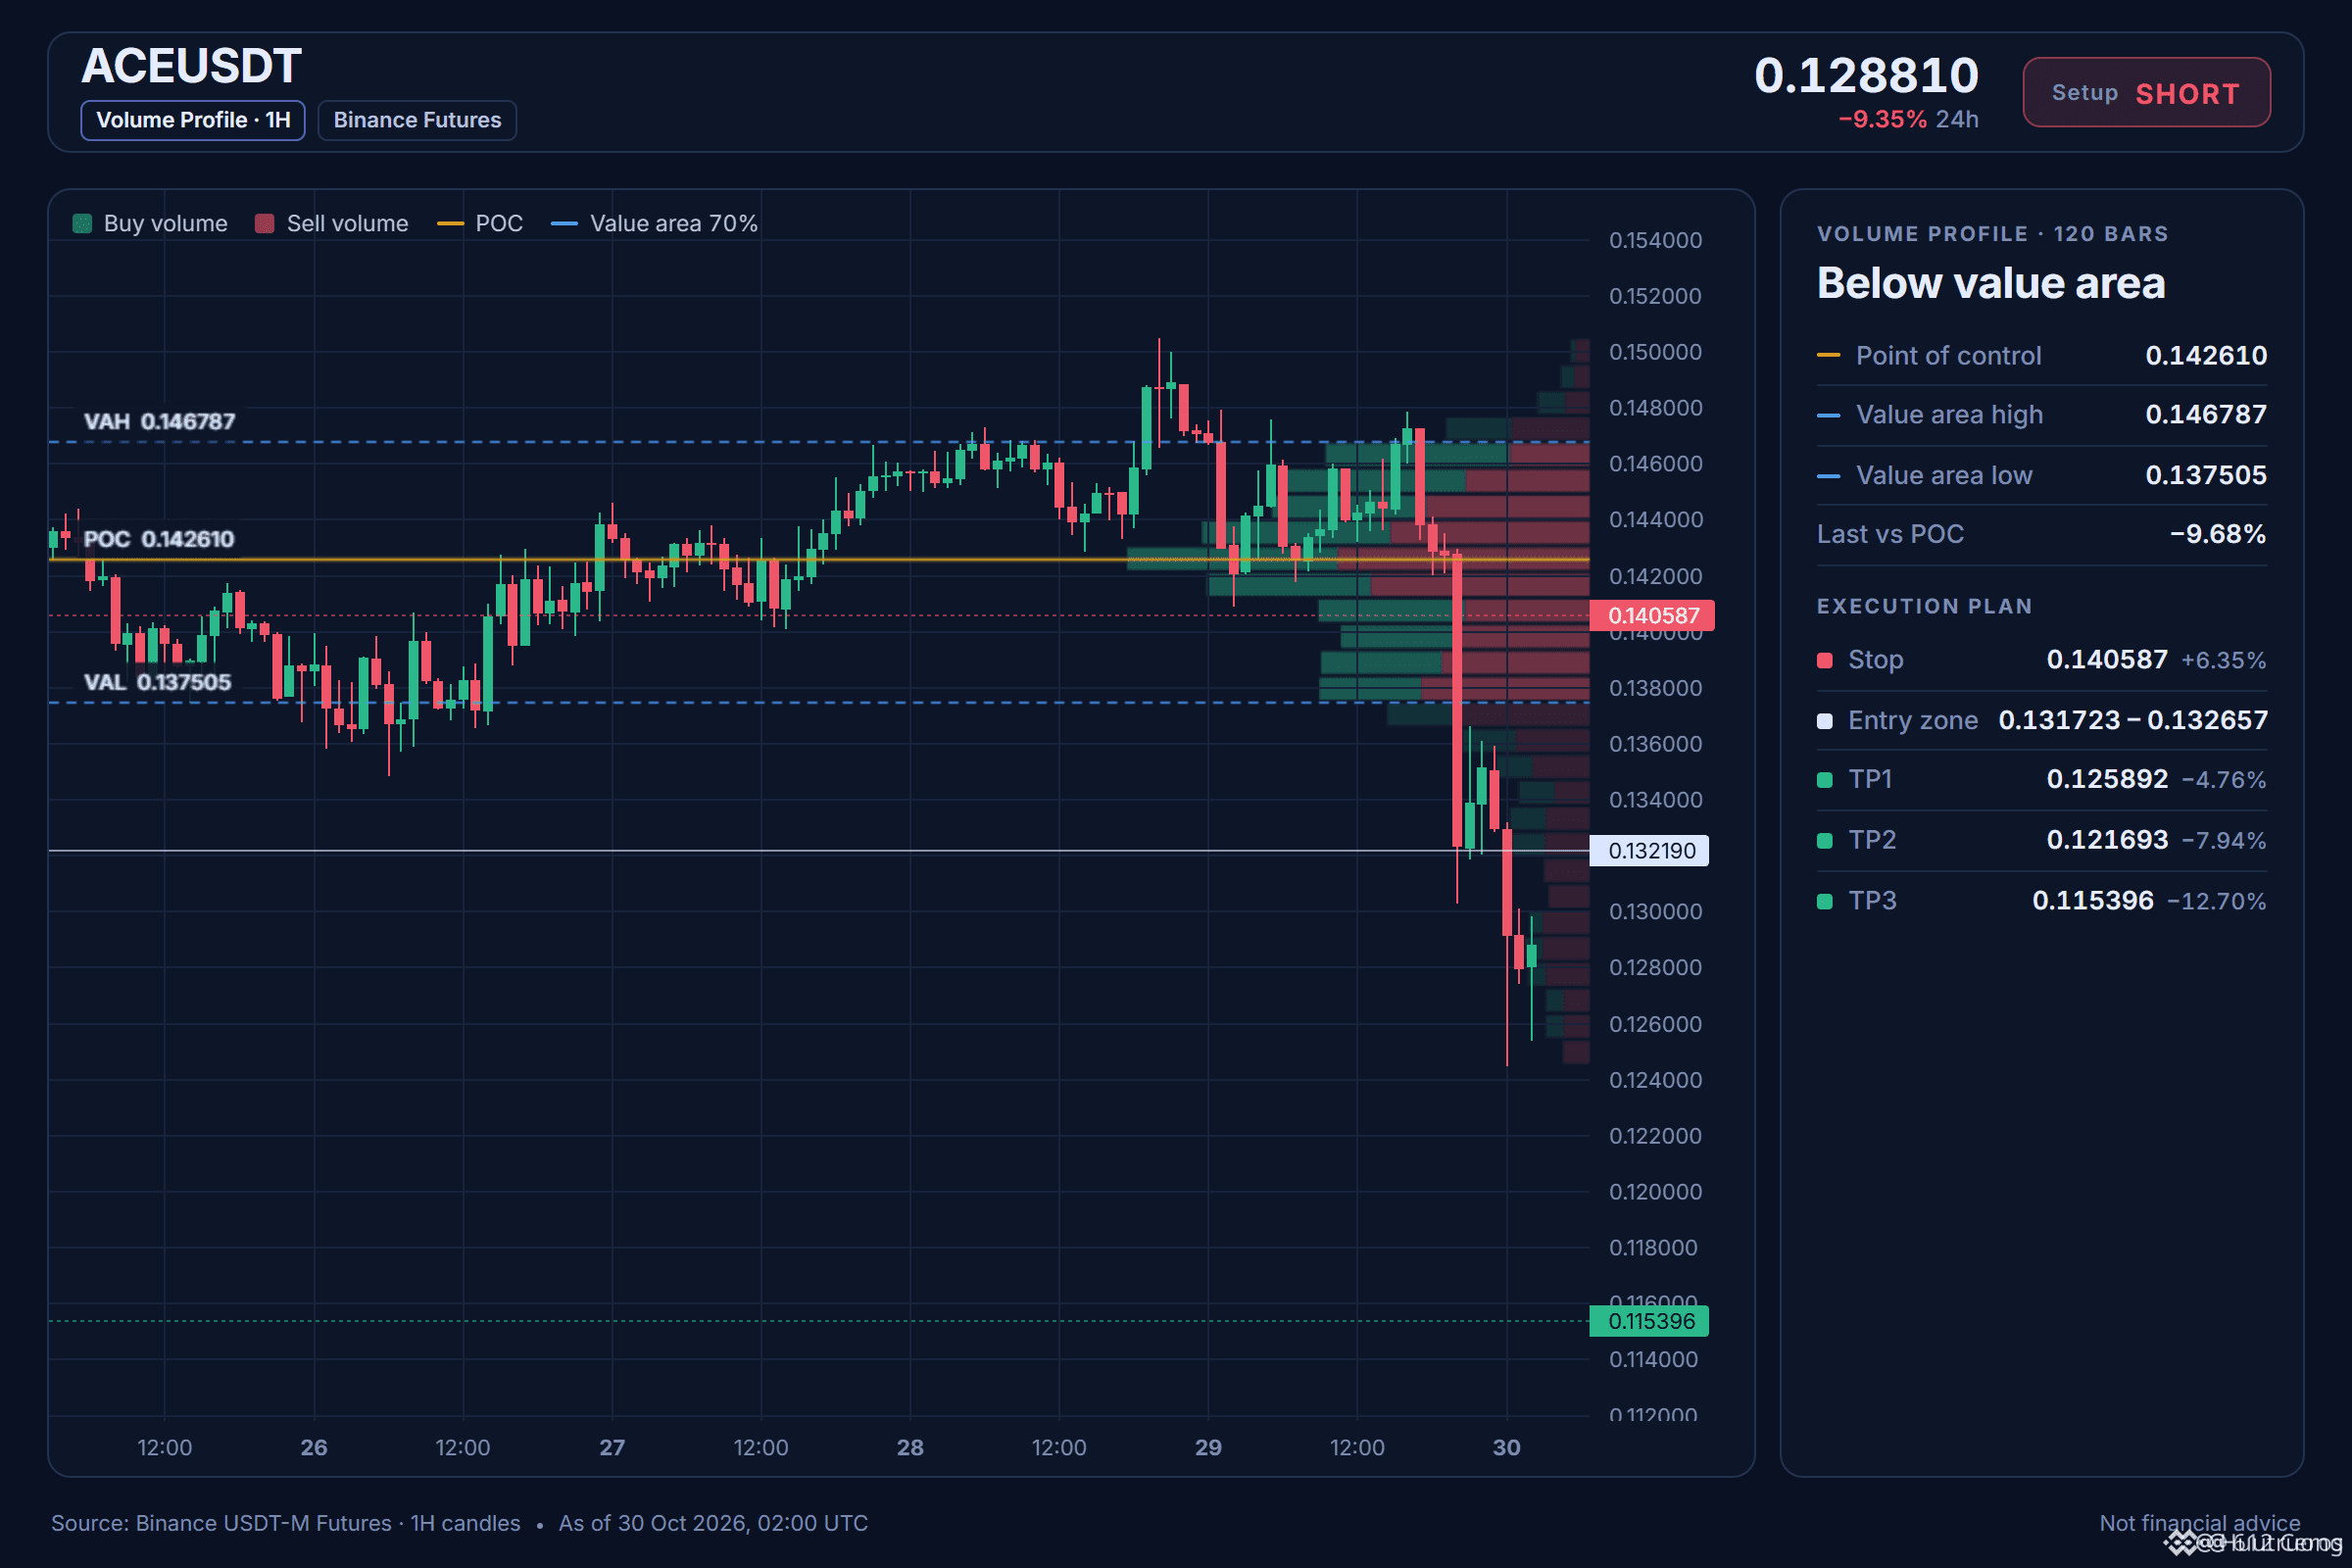
ACE está cayendo dentro de una estructura bajista en el gráfico de 4 h.
🔴 CORTO $ACE /USDT: se espera que el precio BAJE
Sesgo: CORTO · Fuerte
Entrada: 0.131723 – 0.132657
TP1: 0.125892 (-4.8%)
TP2: 0.121693 (-7.9%)
TP3: 0.115396 (-12.7%)
SL: 0.140587 (+6.4%)
Plan: entrar solo dentro de la zona, cerrar el 50% en TP1, el 25% en TP2 y el 25% en TP3, y mover el stop al precio de entrada después de TP1.
¿Por qué CORTO? 6/12 señales están de acuerdo, 1 en contra.
• Tendencia bajista en 4 h (por debajo de EMA50 y EMA200)
• Tendencia bajista en 1 h (por debajo de EMA50 y EMA200)
• Los vendedores están impulsando el movimiento (ADX de 15 min: 47.8)
Riesgo: los compradores están presionando ahora mismo (vela de 15 min: +1.42%)
Escenario bajista:
Si la posición corta se mantiene, el precio debería seguir cayendo hacia el mínimo de entrada, ya que la tendencia de 4 h muestra que el precio está por debajo de ambas EMA.
Qué lo invalida:
Un fuerte repunte por encima del máximo de entrada demostraría que la idea es incorrecta, así que cerraría la posición y asumiría la pérdida.
¿Dónde colocarías el stop para esta posición corta?
ACE está cayendo dentro de una estructura bajista en el gráfico de 4 h.
🔴 CORTO $ACE /USDT: se espera que el precio BAJE
Sesgo: CORTO · Fuerte
Entrada: 0.131723 – 0.132657
TP1: 0.125892 (-4.8%)
TP2: 0.121693 (-7.9%)
TP3: 0.115396 (-12.7%)
SL: 0.140587 (+6.4%)
Plan: entrar solo dentro de la zona, cerrar el 50% en TP1, el 25% en TP2 y el 25% en TP3, y mover el stop al precio de entrada después de TP1.
¿Por qué CORTO? 6/12 señales están de acuerdo, 1 en contra.
• Tendencia bajista en 4 h (por debajo de EMA50 y EMA200)
• Tendencia bajista en 1 h (por debajo de EMA50 y EMA200)
• Los vendedores están impulsando el movimiento (ADX de 15 min: 47.8)
Riesgo: los compradores están presionando ahora mismo (vela de 15 min: +1.42%)
Escenario bajista:
Si la posición corta se mantiene, el precio debería seguir cayendo hacia el mínimo de entrada, ya que la tendencia de 4 h muestra que el precio está por debajo de ambas EMA.
Qué lo invalida:
Un fuerte repunte por encima del máximo de entrada demostraría que la idea es incorrecta, así que cerraría la posición y asumiría la pérdida.
¿Dónde colocarías el stop para esta posición corta?
🔴 CORTO $ACE /USDT: se espera que el precio BAJE
Sesgo: CORTO · Fuerte
Entrada: 0.131723 – 0.132657
TP1: 0.125892 (-4.8%)
TP2: 0.121693 (-7.9%)
TP3: 0.115396 (-12.7%)
SL: 0.140587 (+6.4%)
Plan: entrar solo dentro de la zona, cerrar el 50% en TP1, el 25% en TP2 y el 25% en TP3, y mover el stop al precio de entrada después de TP1.
¿Por qué CORTO? 6/12 señales están de acuerdo, 1 en contra.
• Tendencia bajista en 4 h (por debajo de EMA50 y EMA200)
• Tendencia bajista en 1 h (por debajo de EMA50 y EMA200)
• Los vendedores están impulsando el movimiento (ADX de 15 min: 47.8)
Riesgo: los compradores están presionando ahora mismo (vela de 15 min: +1.42%)
Escenario bajista:
Si la posición corta se mantiene, el precio debería seguir cayendo hacia el mínimo de entrada, ya que la tendencia de 4 h muestra que el precio está por debajo de ambas EMA.
Qué lo invalida:
Un fuerte repunte por encima del máximo de entrada demostraría que la idea es incorrecta, así que cerraría la posición y asumiría la pérdida.
¿Dónde colocarías el stop para esta posición corta?
9
·
--
Bajista
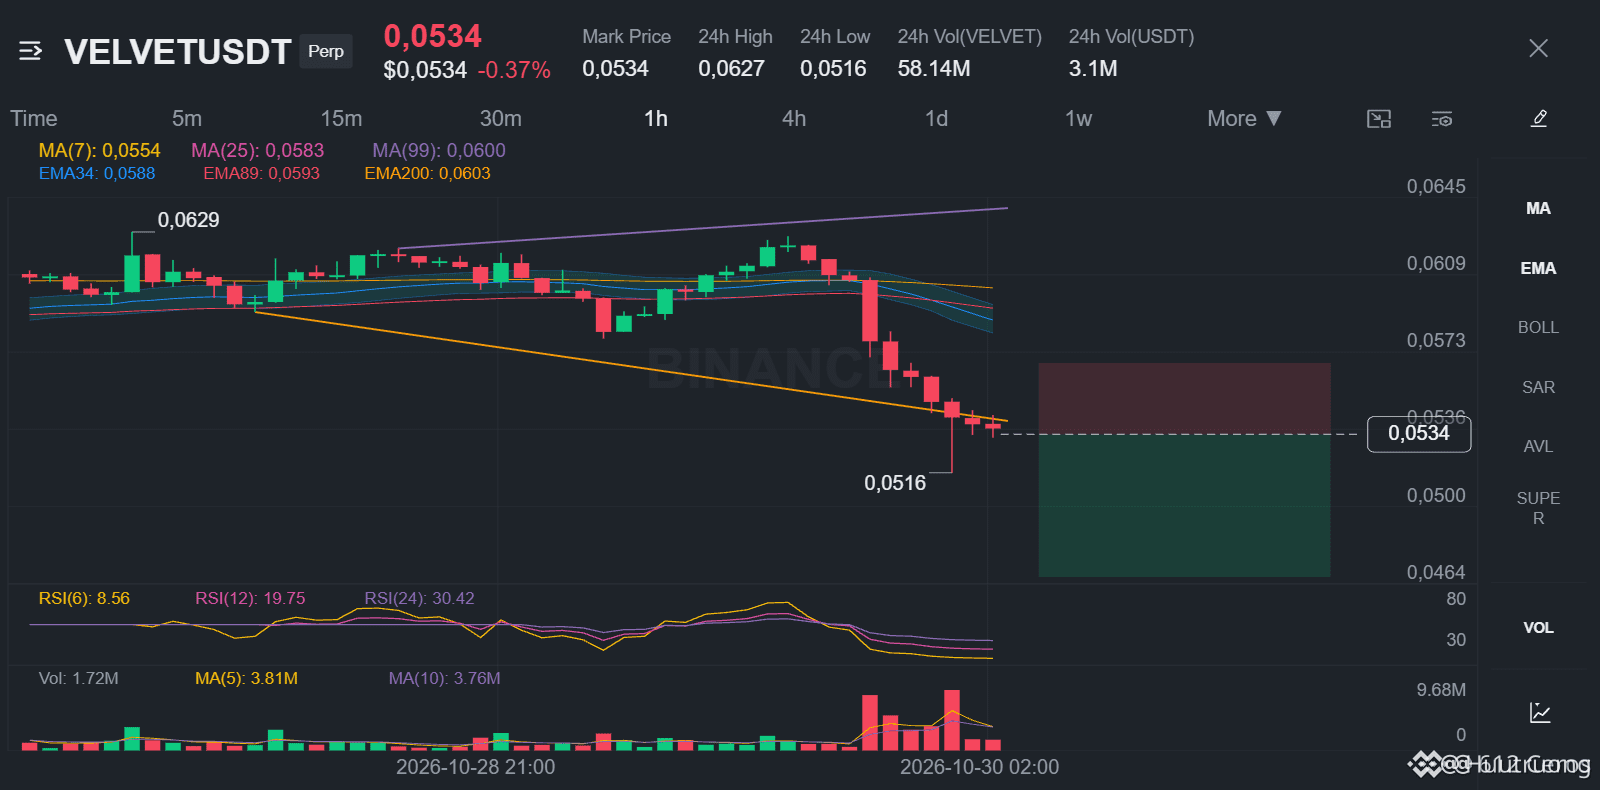
VELVET no es un rebote seguro a pesar de la reciente compresión.
🔴 CORTO $VELVET /USDT: se espera que el precio BAJE
Sesgo: CORTO · Fuerte
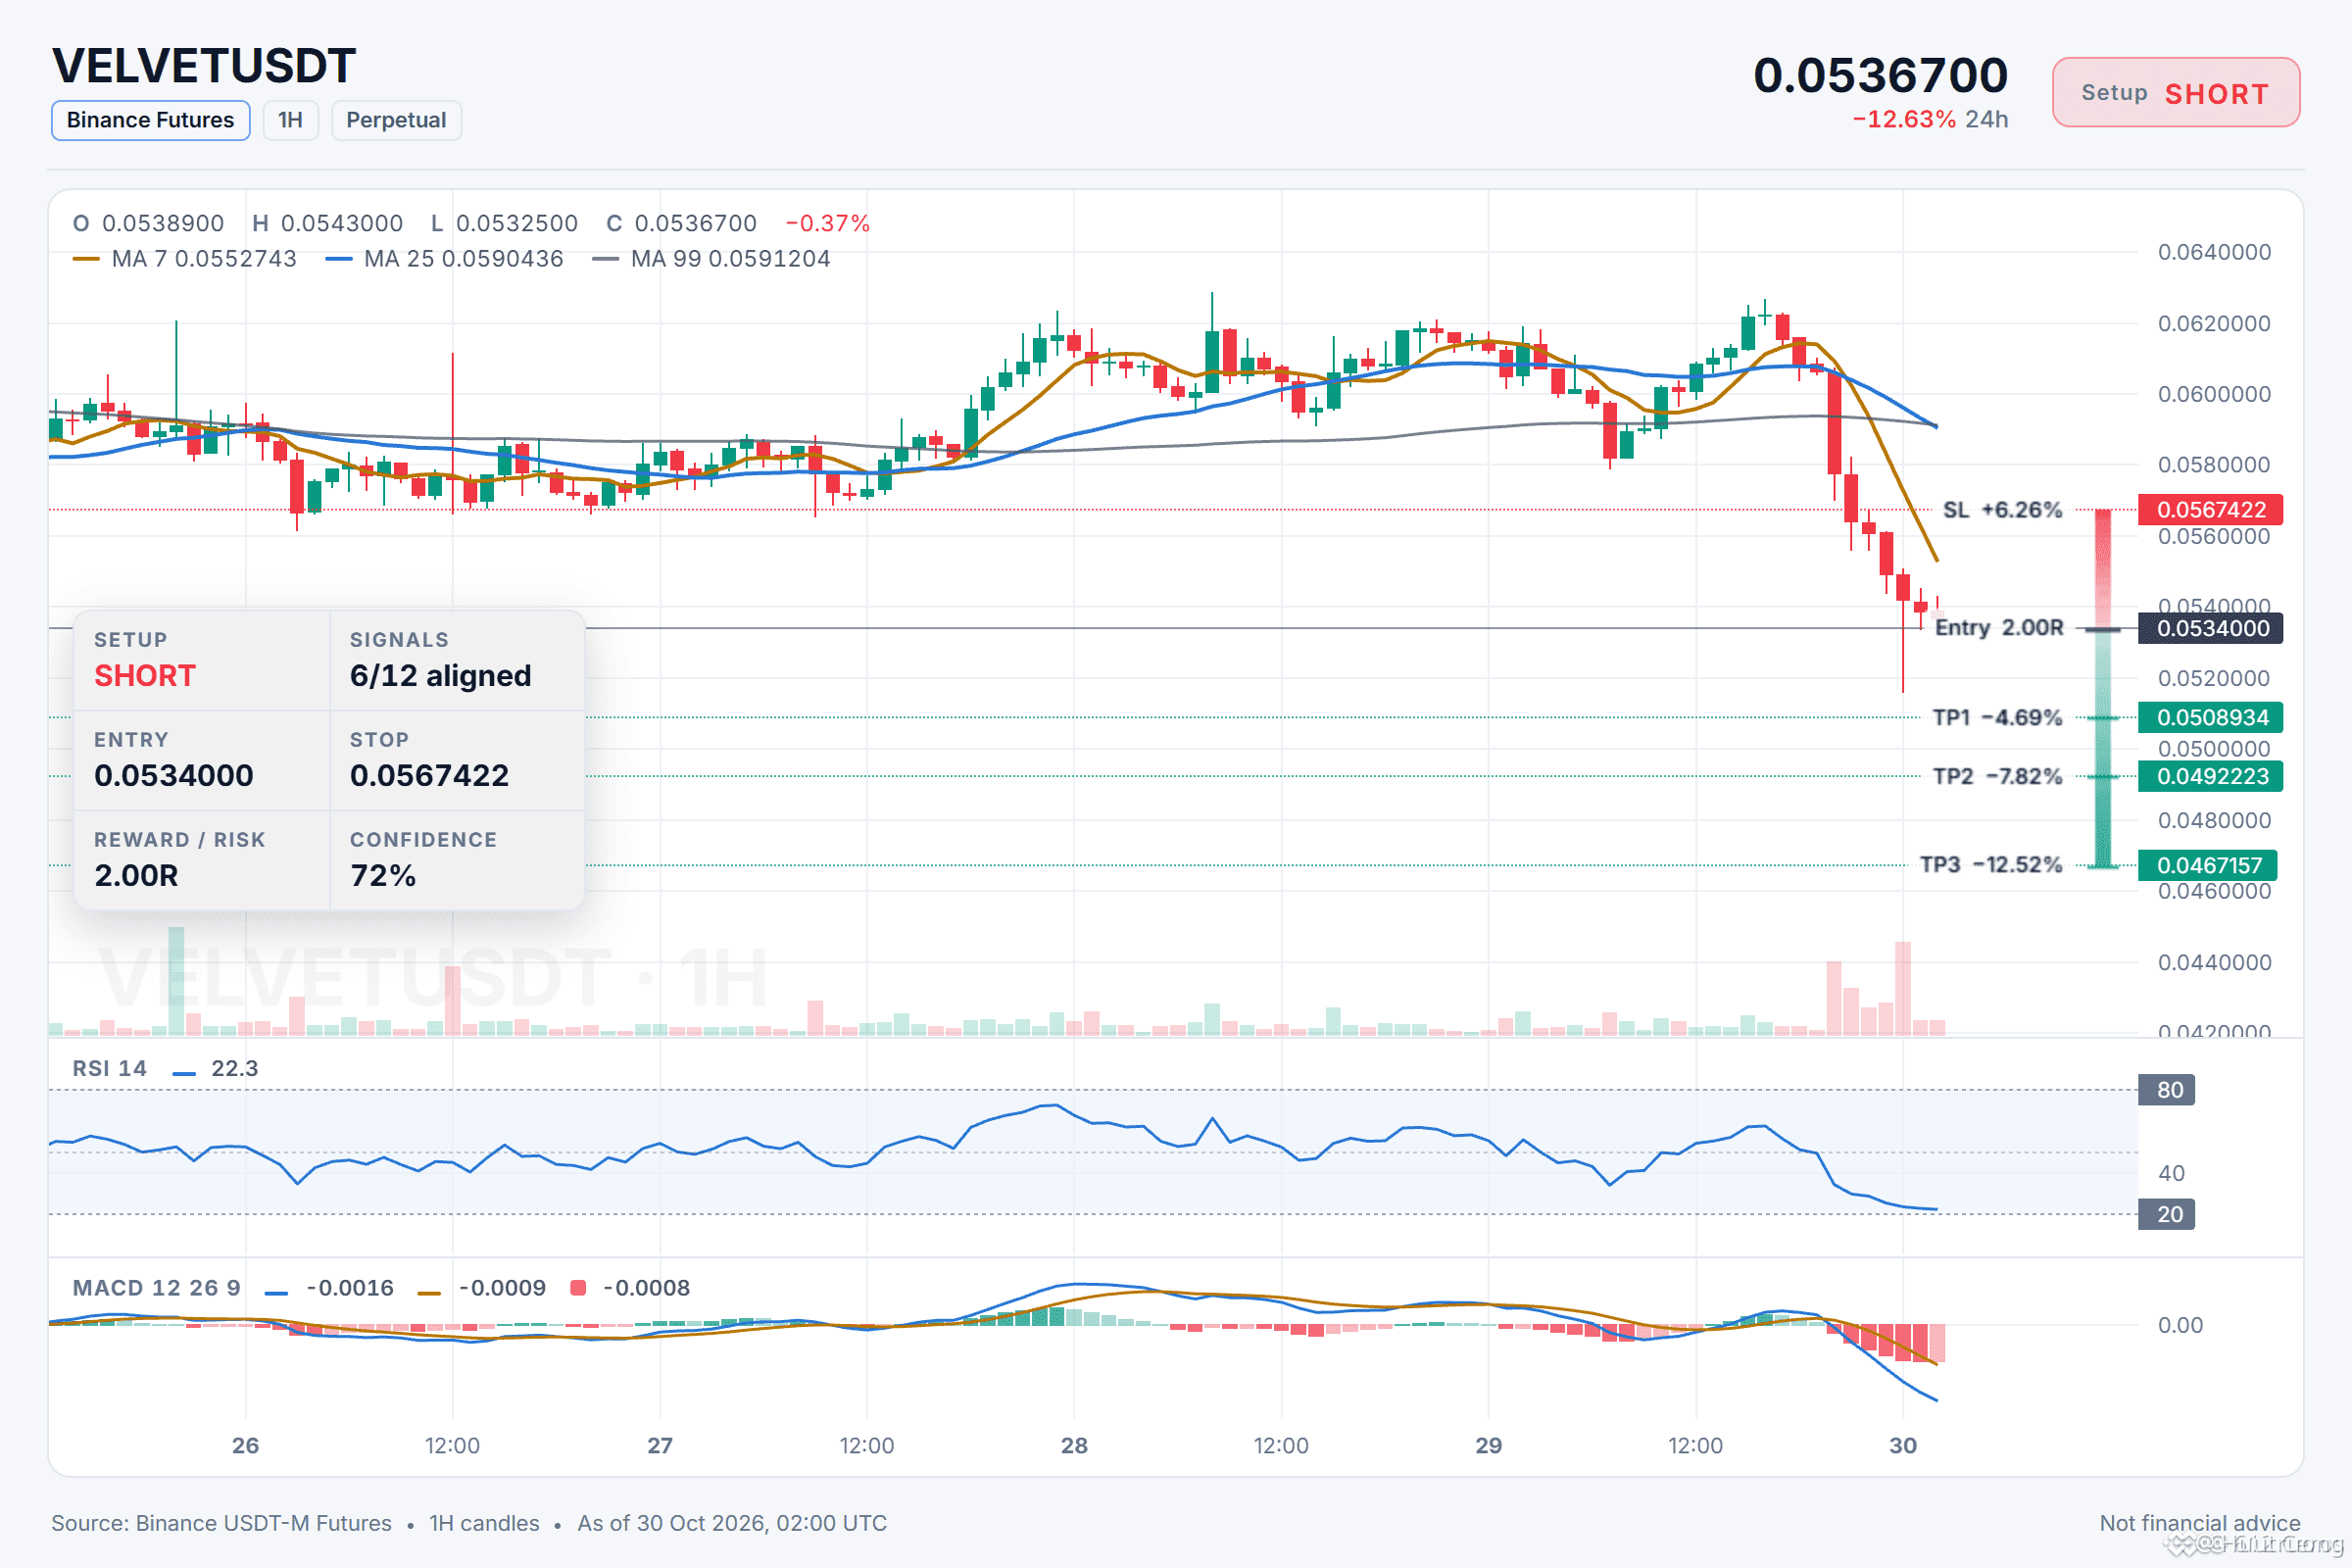
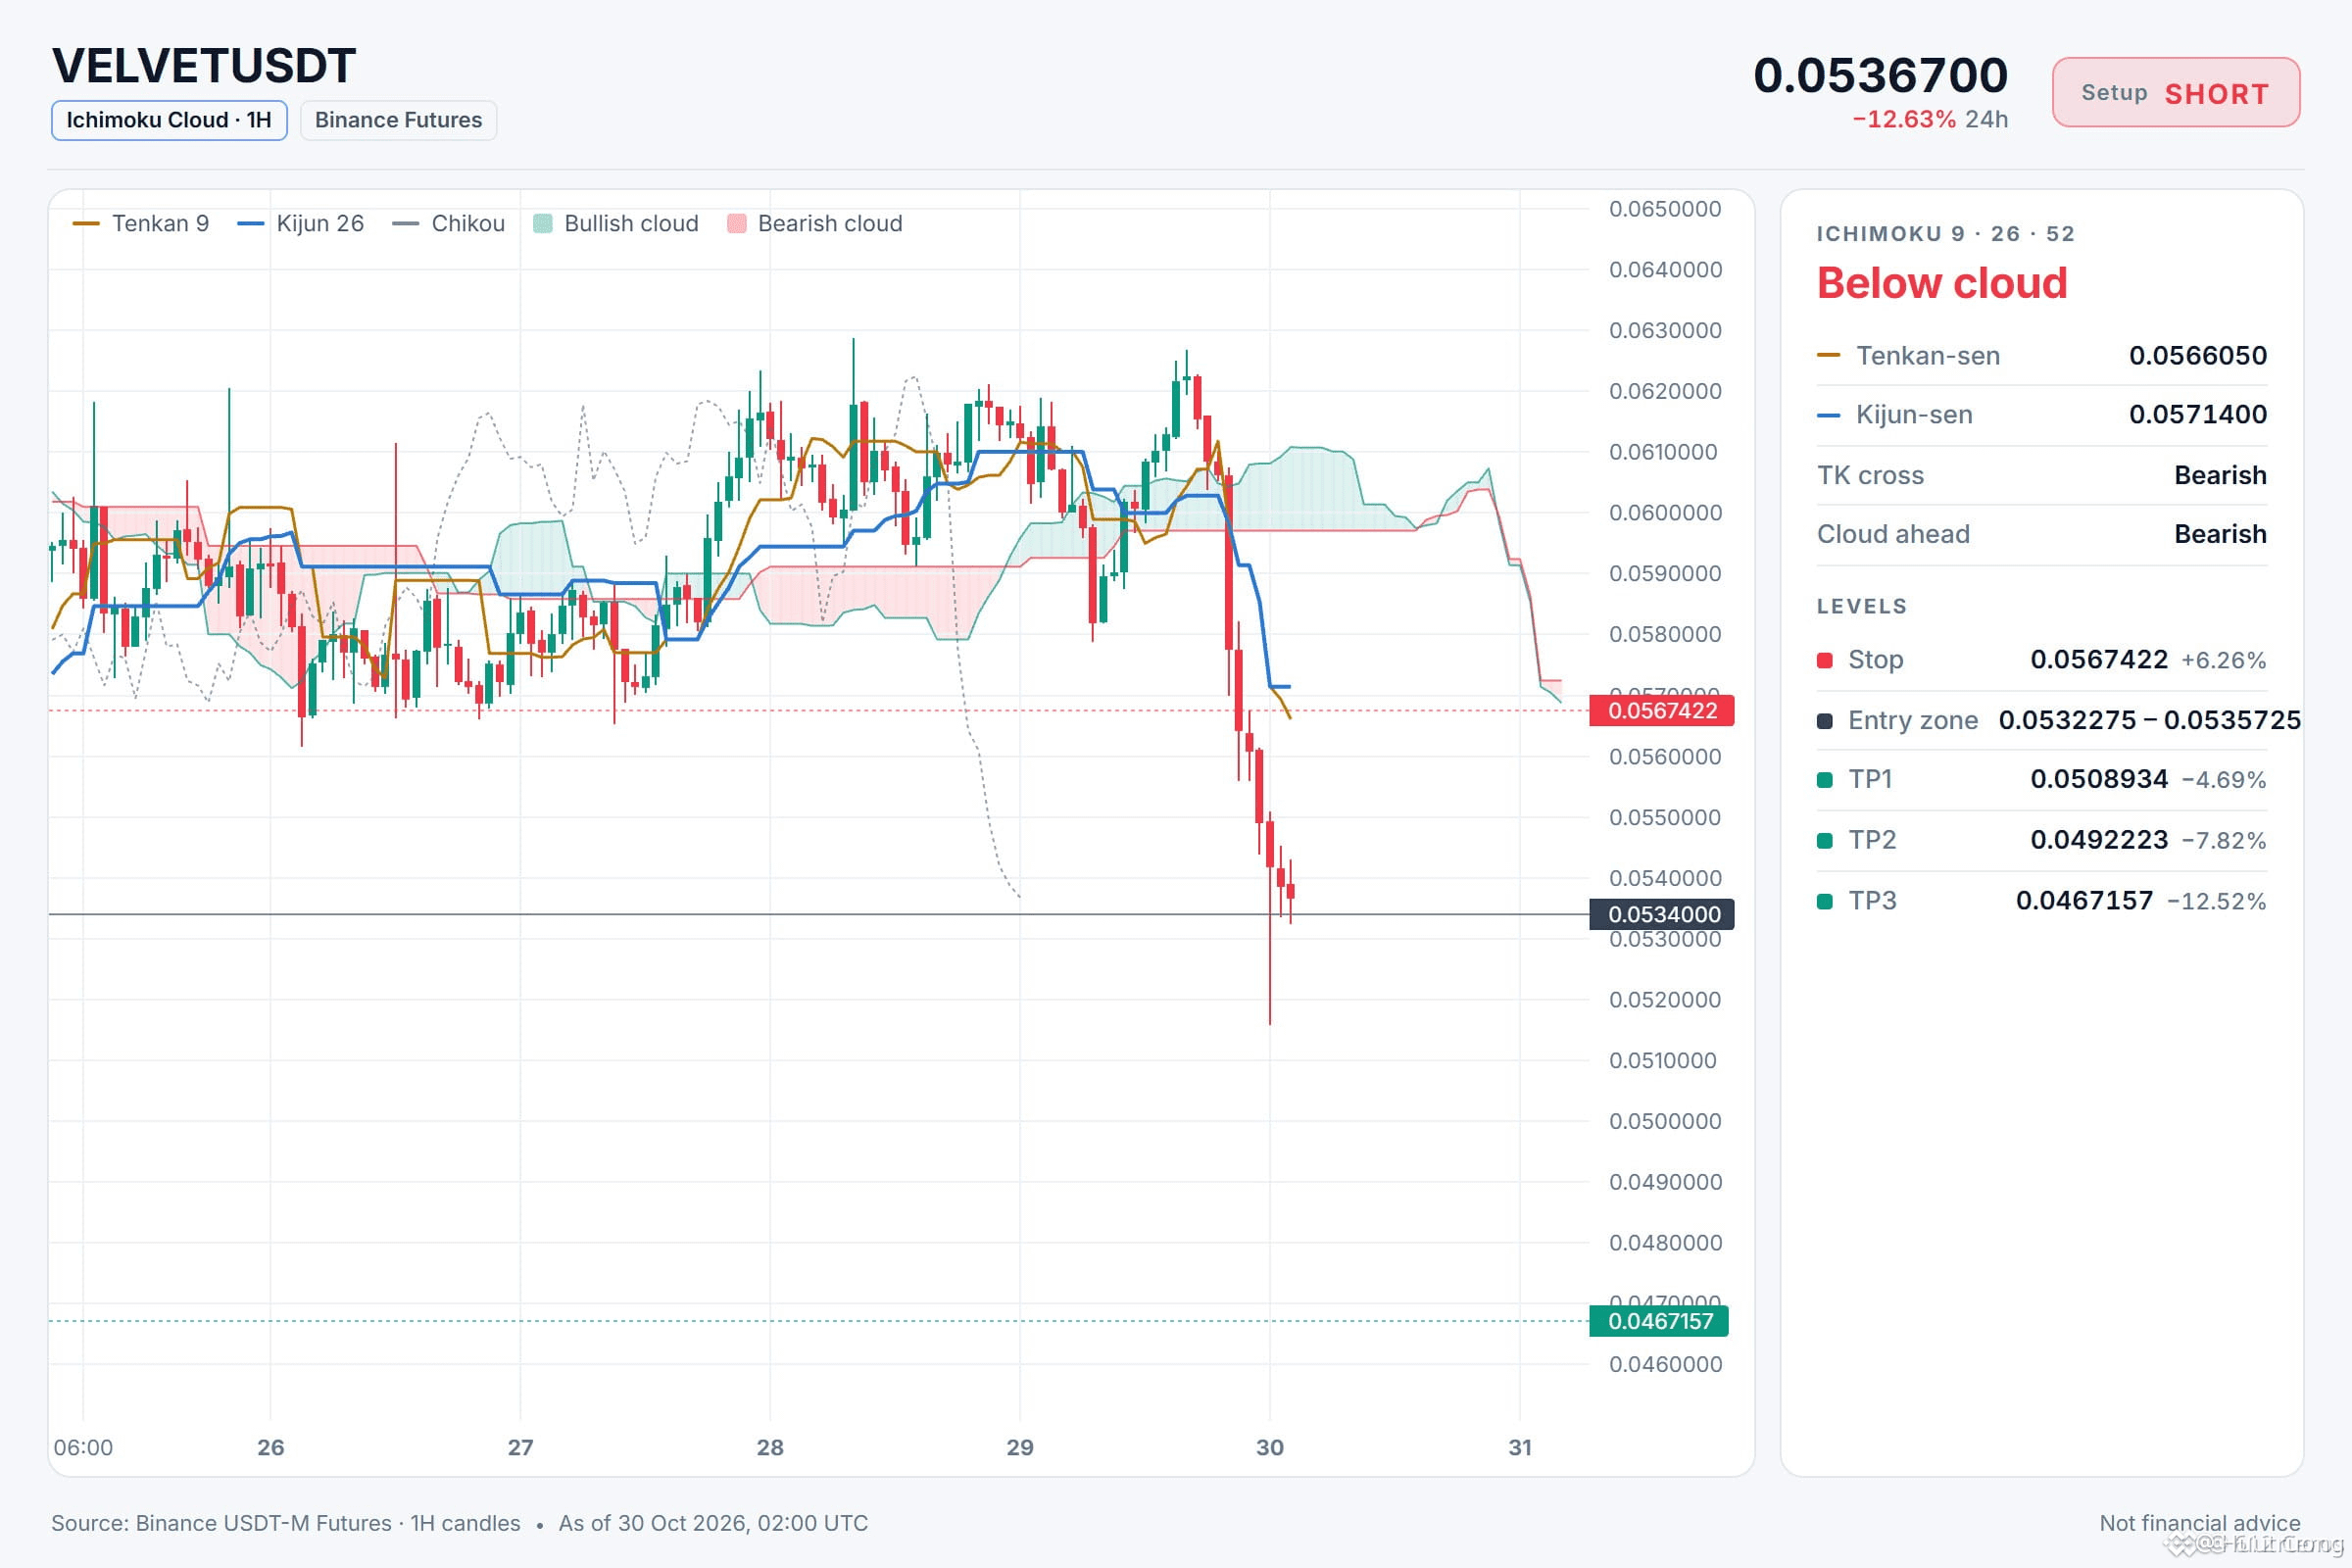
Entrada: 0.0532275 – 0.0535725
TP1: 0.0508934 (-4.7%)
TP2: 0.0492223 (-7.8%)
TP3: 0.0467157 (-12.5%)
SL: 0.0567422 (+6.3%)
Plan: entra solo dentro de la zona, cierra el 50% en TP1, el 25% en TP2, el 25% en TP3 y mueve el stop al precio de entrada después de TP1.
¿Por qué CORTO? 6/12 señales coinciden, 1 está en contra.
• Tendencia diaria bajista (por debajo de EMA50 y EMA200)
• Tendencia de 4 h bajista (por debajo de EMA50 y EMA200)
• Tendencia de 1 h bajista (por debajo de EMA50 y EMA200)
Riesgo: el precio está muy castigado; los rebotes son frecuentes desde aquí (RSI de 1 h: 22.3, sobrevendido)
¿Por qué ahora?
VELVET sigue cayendo porque las tendencias diaria, de 4 h y de 1 h son bajistas. El precio en 1 h es 0.0534000 y está muy por debajo de su EMA50, lo que significa que ha caído demasiado y demasiado rápido. Los vendedores tienen el control, con un ADX de 63.3, pero el RSI de 1 h ya está en 22.3, por lo que es probable un rebote.
¿Dónde fijarías tu nivel de invalidación si no estás en corto?
VELVET no es un rebote seguro a pesar de la reciente compresión.
🔴 CORTO $VELVET /USDT: se espera que el precio BAJE
Sesgo: CORTO · Fuerte
Entrada: 0.0532275 – 0.0535725
TP1: 0.0508934 (-4.7%)
TP2: 0.0492223 (-7.8%)
TP3: 0.0467157 (-12.5%)
SL: 0.0567422 (+6.3%)
Plan: entra solo dentro de la zona, cierra el 50% en TP1, el 25% en TP2, el 25% en TP3 y mueve el stop al precio de entrada después de TP1.
¿Por qué CORTO? 6/12 señales coinciden, 1 está en contra.
• Tendencia diaria bajista (por debajo de EMA50 y EMA200)
• Tendencia de 4 h bajista (por debajo de EMA50 y EMA200)
• Tendencia de 1 h bajista (por debajo de EMA50 y EMA200)
Riesgo: el precio está muy castigado; los rebotes son frecuentes desde aquí (RSI de 1 h: 22.3, sobrevendido)
¿Por qué ahora?
VELVET sigue cayendo porque las tendencias diaria, de 4 h y de 1 h son bajistas. El precio en 1 h es 0.0534000 y está muy por debajo de su EMA50, lo que significa que ha caído demasiado y demasiado rápido. Los vendedores tienen el control, con un ADX de 63.3, pero el RSI de 1 h ya está en 22.3, por lo que es probable un rebote.
¿Dónde fijarías tu nivel de invalidación si no estás en corto?
🔴 CORTO $VELVET /USDT: se espera que el precio BAJE
Sesgo: CORTO · Fuerte
Entrada: 0.0532275 – 0.0535725
TP1: 0.0508934 (-4.7%)
TP2: 0.0492223 (-7.8%)
TP3: 0.0467157 (-12.5%)
SL: 0.0567422 (+6.3%)
Plan: entra solo dentro de la zona, cierra el 50% en TP1, el 25% en TP2, el 25% en TP3 y mueve el stop al precio de entrada después de TP1.
¿Por qué CORTO? 6/12 señales coinciden, 1 está en contra.
• Tendencia diaria bajista (por debajo de EMA50 y EMA200)
• Tendencia de 4 h bajista (por debajo de EMA50 y EMA200)
• Tendencia de 1 h bajista (por debajo de EMA50 y EMA200)
Riesgo: el precio está muy castigado; los rebotes son frecuentes desde aquí (RSI de 1 h: 22.3, sobrevendido)
¿Por qué ahora?
VELVET sigue cayendo porque las tendencias diaria, de 4 h y de 1 h son bajistas. El precio en 1 h es 0.0534000 y está muy por debajo de su EMA50, lo que significa que ha caído demasiado y demasiado rápido. Los vendedores tienen el control, con un ADX de 63.3, pero el RSI de 1 h ya está en 22.3, por lo que es probable un rebote.
¿Dónde fijarías tu nivel de invalidación si no estás en corto?
14
·
--
Bajista
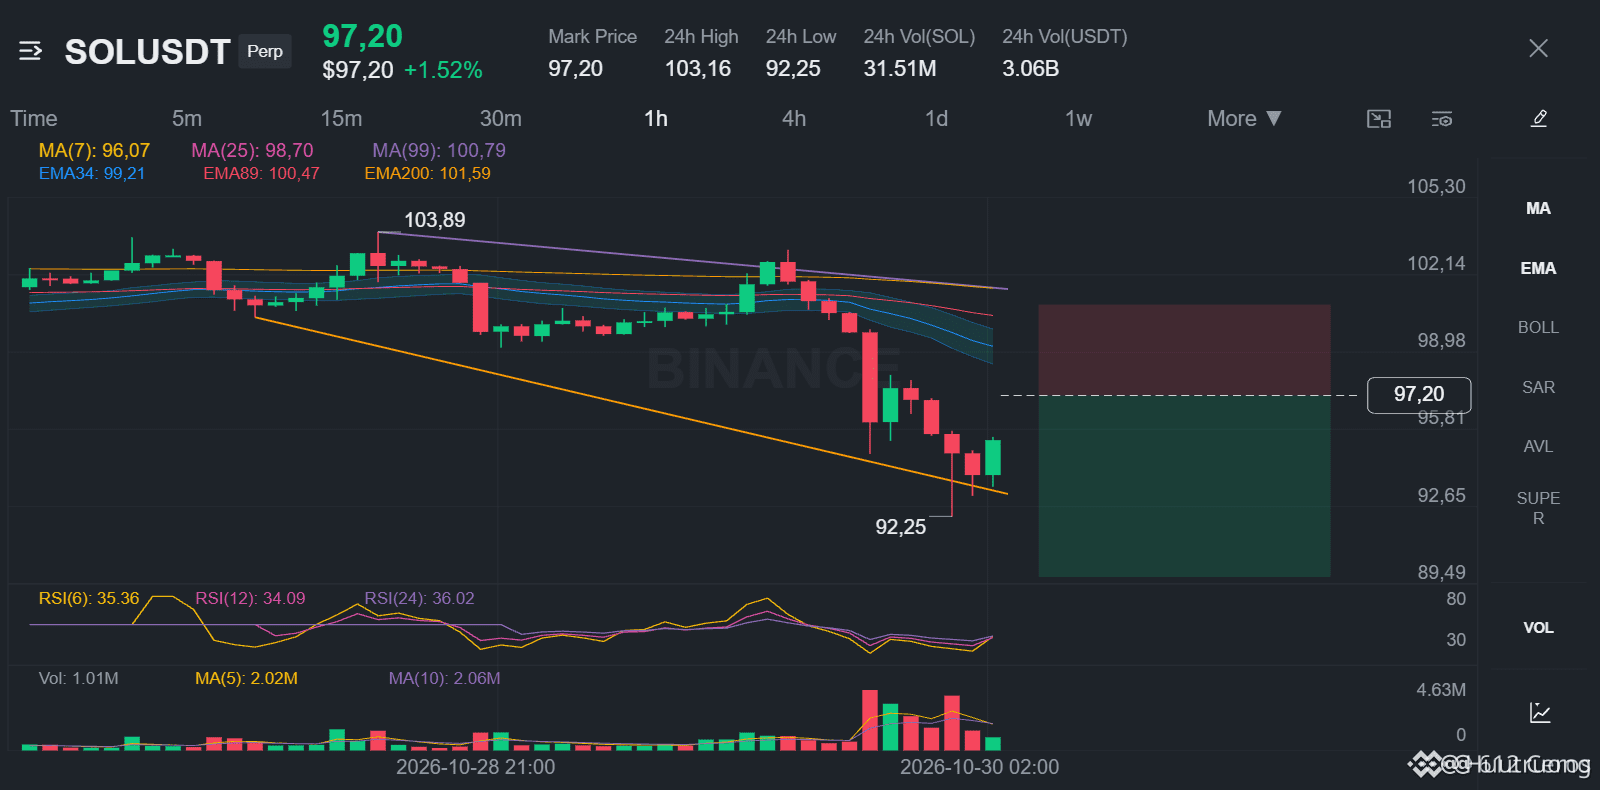
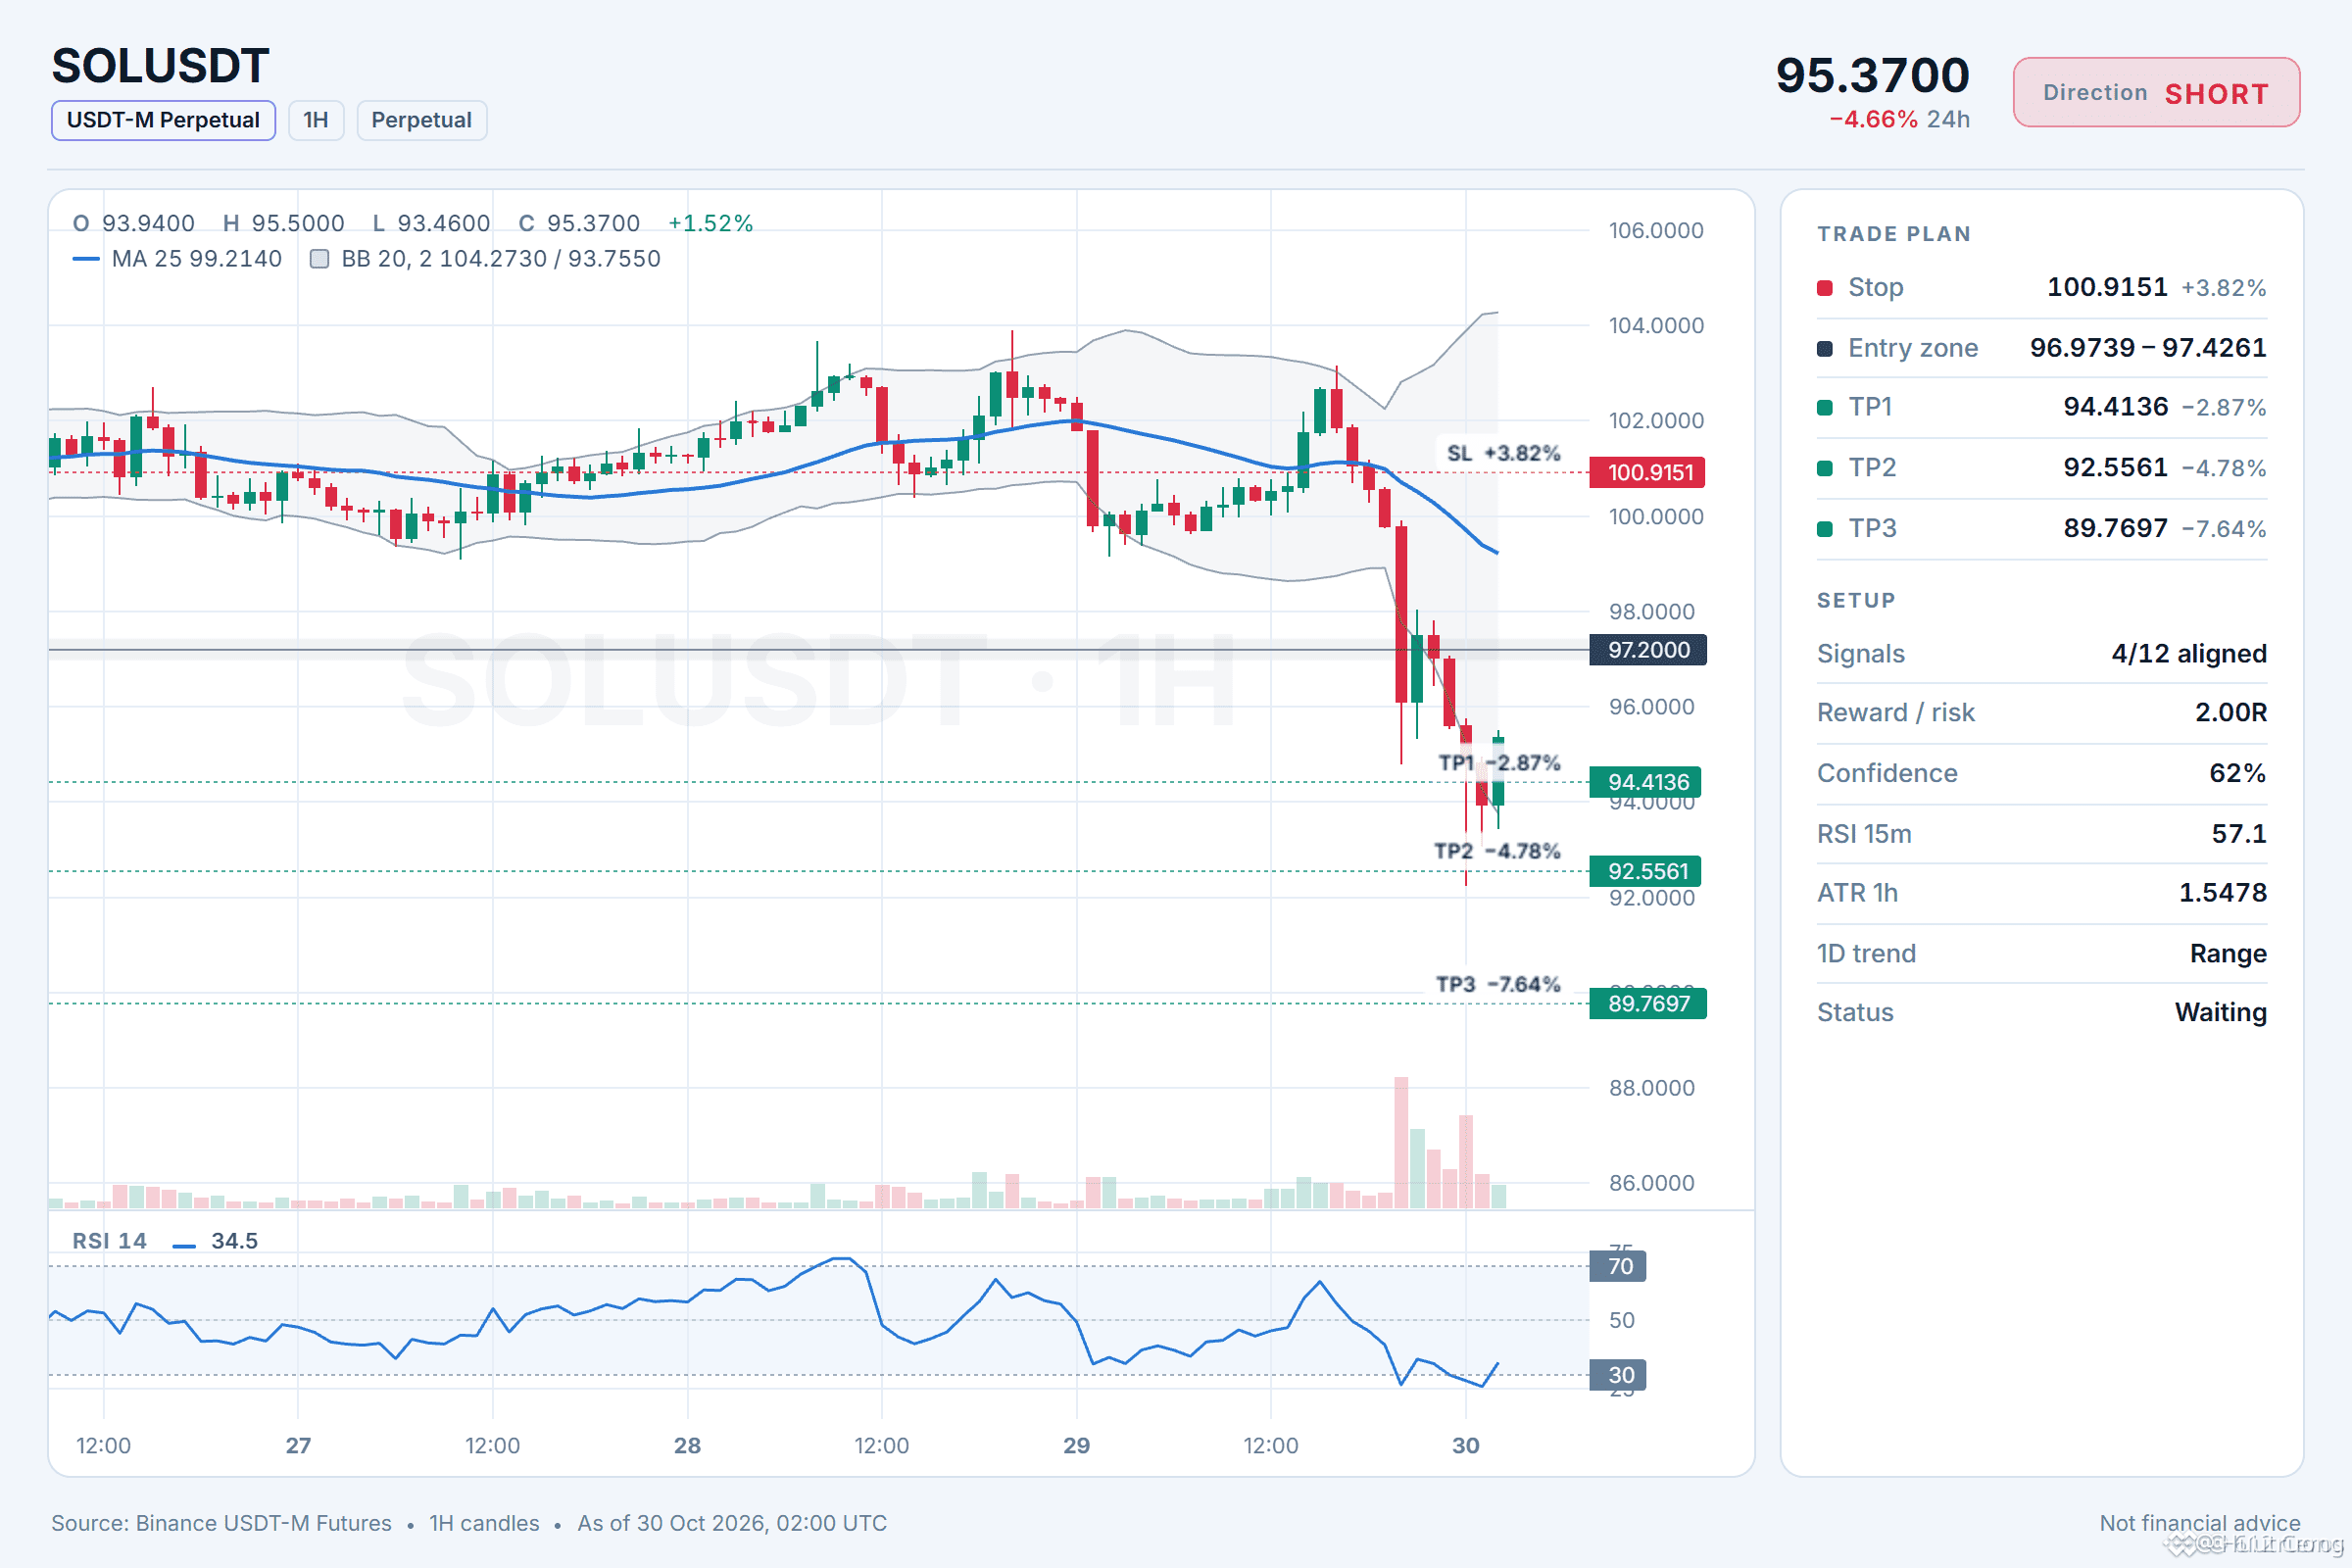
Busco vender el rebote de SOL .
🔴 CORTO $SOL /USDT: se espera que el precio BAJE
Sesgo: CORTO · Tendencia
Entrada: 96.9739 – 97.4261
TP1: 94.4136 (-2.9%)
TP2: 92.5561 (-4.8%)
TP3: 89.7697 (-7.6%)
SL: 100.9151 (+3.8%)
Plan: entra solo dentro de la zona, cierra el 50% en TP1, el 25% en TP2 y el 25% en TP3, y mueve el stop al precio de entrada después de TP1.
Nota: la convicción es moderada; mantén un tamaño de posición pequeño.
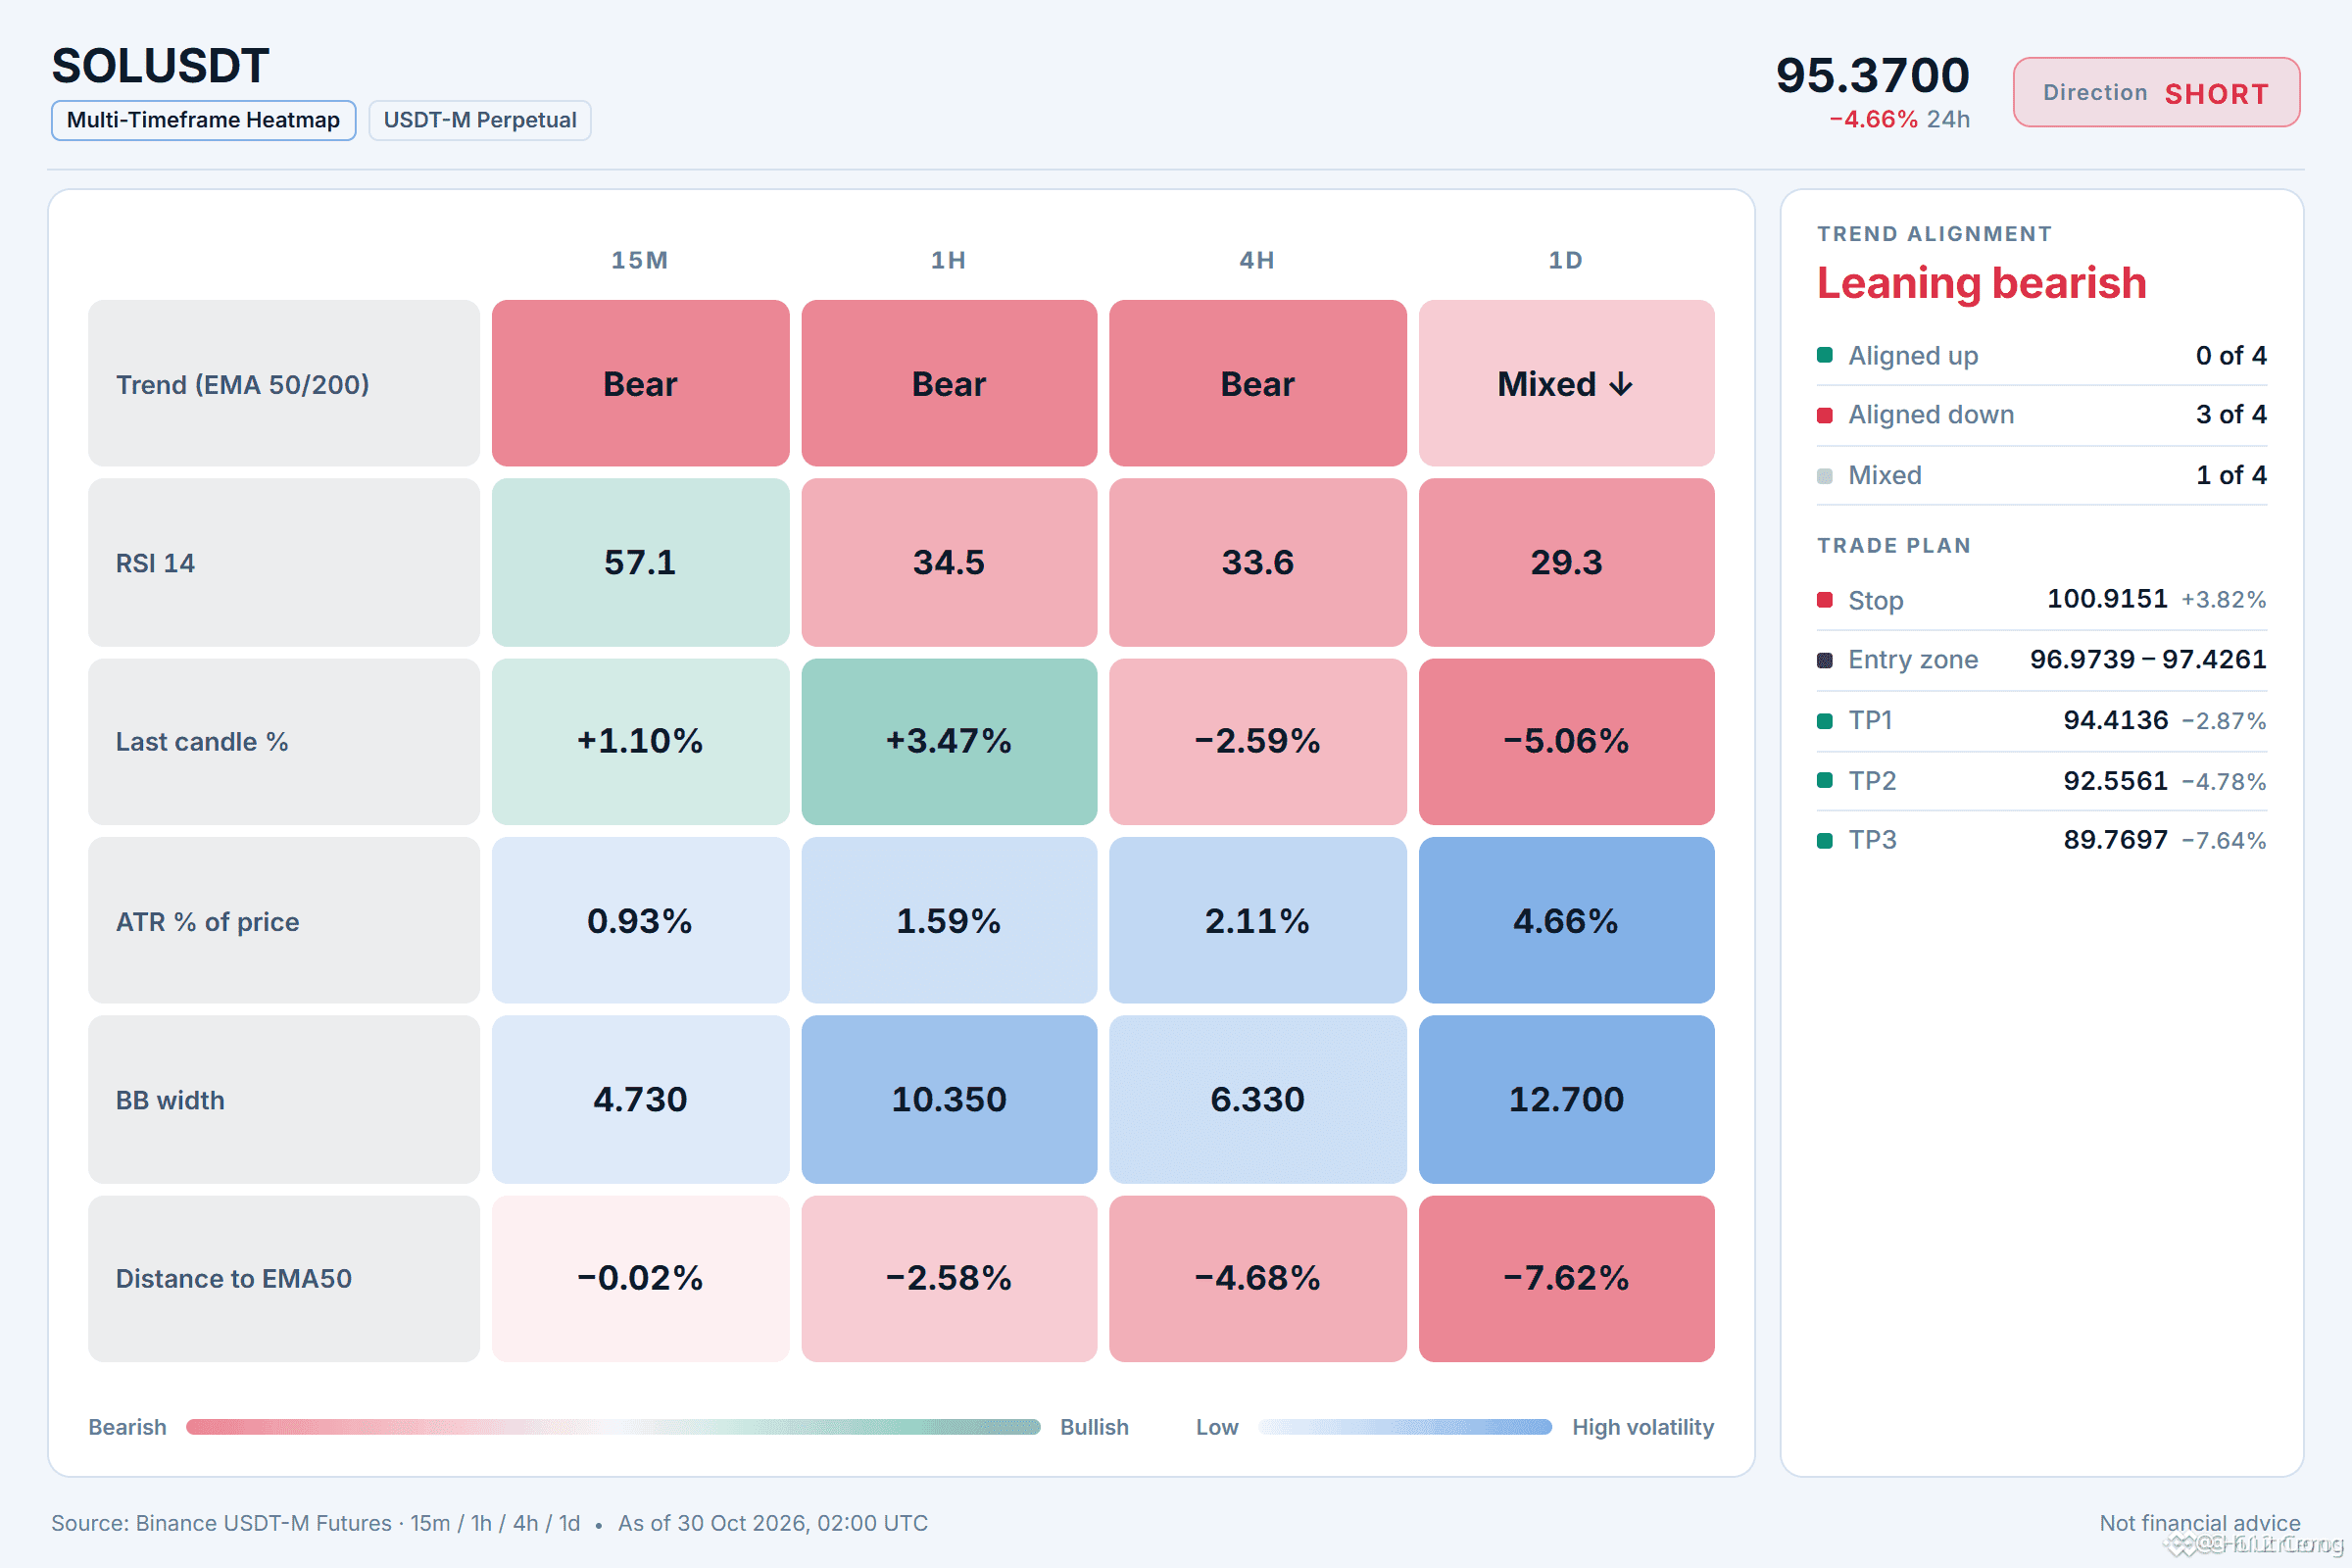
¿Por qué CORTO? 4/12 señales están de acuerdo, 1 en contra.
• Tendencia bajista en 4 h (por debajo de EMA50 y EMA200)
• Tendencia bajista en 1 h (por debajo de EMA50 y EMA200)
• Los vendedores tienen el impulso (RSI de 4 h: 33.6)
Riesgo: los compradores están presionando ahora mismo (vela de 15 min: +1.10%)
Mi análisis de SOL hoy
Estoy observando el precio de 1 h alrededor de 97.2000, mientras la tendencia diaria se mantiene dentro de un rango. Quiero ver que el precio vuelva a subir hacia 100.9151, que es el nivel de invalidación. La tendencia de 4 h es bajista y tiene un impulso bajista, pero el impulso de 15 min muestra que los compradores están presionando, así que la convicción sigue siendo moderada.
¿Cuál es tu nivel de invalidación para esta configuración?
Busco vender el rebote de SOL .
🔴 CORTO $SOL /USDT: se espera que el precio BAJE
Sesgo: CORTO · Tendencia
Entrada: 96.9739 – 97.4261
TP1: 94.4136 (-2.9%)
TP2: 92.5561 (-4.8%)
TP3: 89.7697 (-7.6%)
SL: 100.9151 (+3.8%)
Plan: entra solo dentro de la zona, cierra el 50% en TP1, el 25% en TP2 y el 25% en TP3, y mueve el stop al precio de entrada después de TP1.
Nota: la convicción es moderada; mantén un tamaño de posición pequeño.
¿Por qué CORTO? 4/12 señales están de acuerdo, 1 en contra.
• Tendencia bajista en 4 h (por debajo de EMA50 y EMA200)
• Tendencia bajista en 1 h (por debajo de EMA50 y EMA200)
• Los vendedores tienen el impulso (RSI de 4 h: 33.6)
Riesgo: los compradores están presionando ahora mismo (vela de 15 min: +1.10%)
Mi análisis de SOL hoy
Estoy observando el precio de 1 h alrededor de 97.2000, mientras la tendencia diaria se mantiene dentro de un rango. Quiero ver que el precio vuelva a subir hacia 100.9151, que es el nivel de invalidación. La tendencia de 4 h es bajista y tiene un impulso bajista, pero el impulso de 15 min muestra que los compradores están presionando, así que la convicción sigue siendo moderada.
¿Cuál es tu nivel de invalidación para esta configuración?
🔴 CORTO $SOL /USDT: se espera que el precio BAJE
Sesgo: CORTO · Tendencia
Entrada: 96.9739 – 97.4261
TP1: 94.4136 (-2.9%)
TP2: 92.5561 (-4.8%)
TP3: 89.7697 (-7.6%)
SL: 100.9151 (+3.8%)
Plan: entra solo dentro de la zona, cierra el 50% en TP1, el 25% en TP2 y el 25% en TP3, y mueve el stop al precio de entrada después de TP1.
Nota: la convicción es moderada; mantén un tamaño de posición pequeño.
¿Por qué CORTO? 4/12 señales están de acuerdo, 1 en contra.
• Tendencia bajista en 4 h (por debajo de EMA50 y EMA200)
• Tendencia bajista en 1 h (por debajo de EMA50 y EMA200)
• Los vendedores tienen el impulso (RSI de 4 h: 33.6)
Riesgo: los compradores están presionando ahora mismo (vela de 15 min: +1.10%)
Mi análisis de SOL hoy
Estoy observando el precio de 1 h alrededor de 97.2000, mientras la tendencia diaria se mantiene dentro de un rango. Quiero ver que el precio vuelva a subir hacia 100.9151, que es el nivel de invalidación. La tendencia de 4 h es bajista y tiene un impulso bajista, pero el impulso de 15 min muestra que los compradores están presionando, así que la convicción sigue siendo moderada.
¿Cuál es tu nivel de invalidación para esta configuración?
9
·
--
Bajista
La mayoría de los traders todavía espera un rebote.
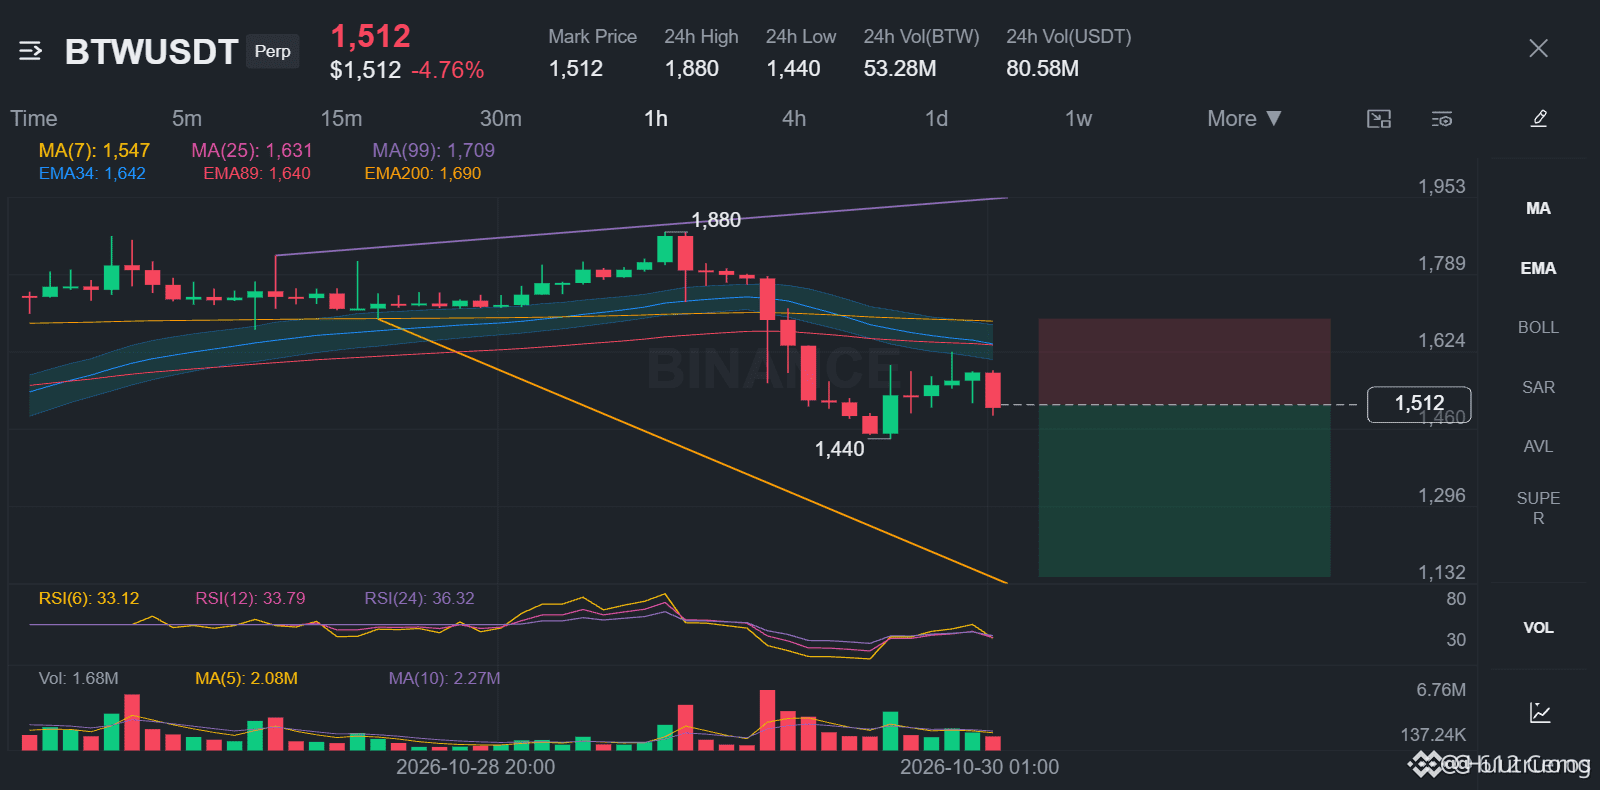
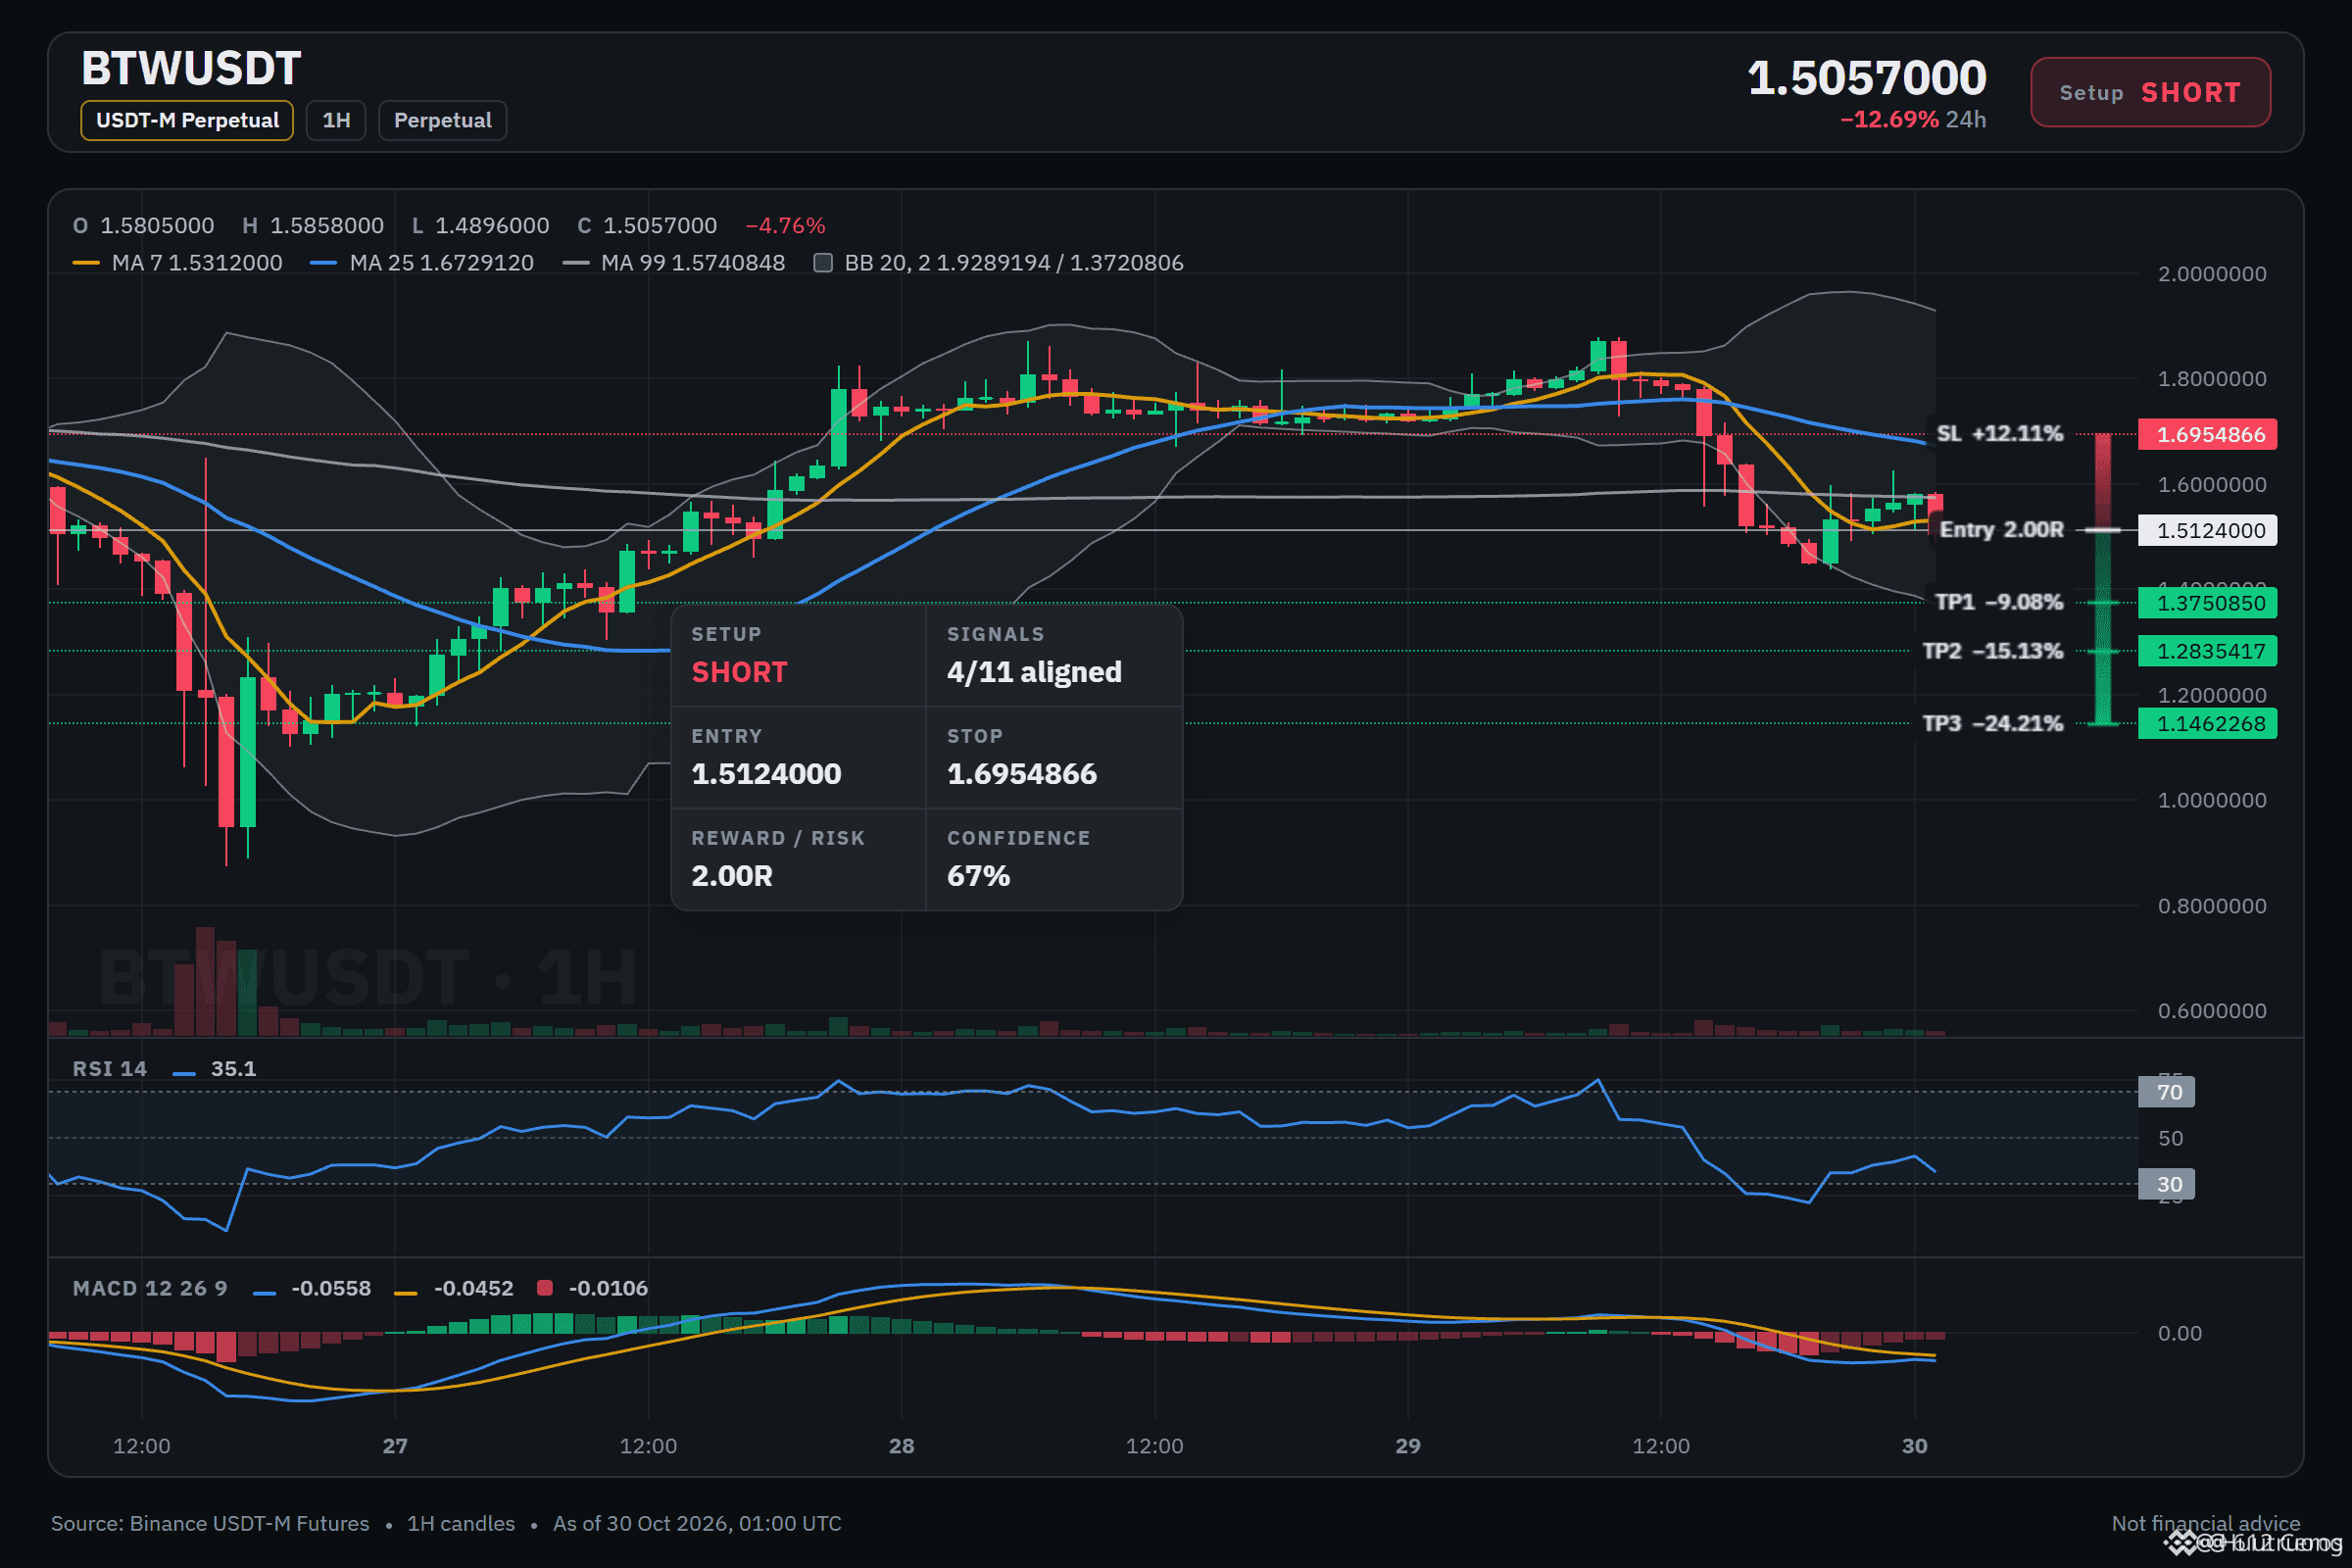
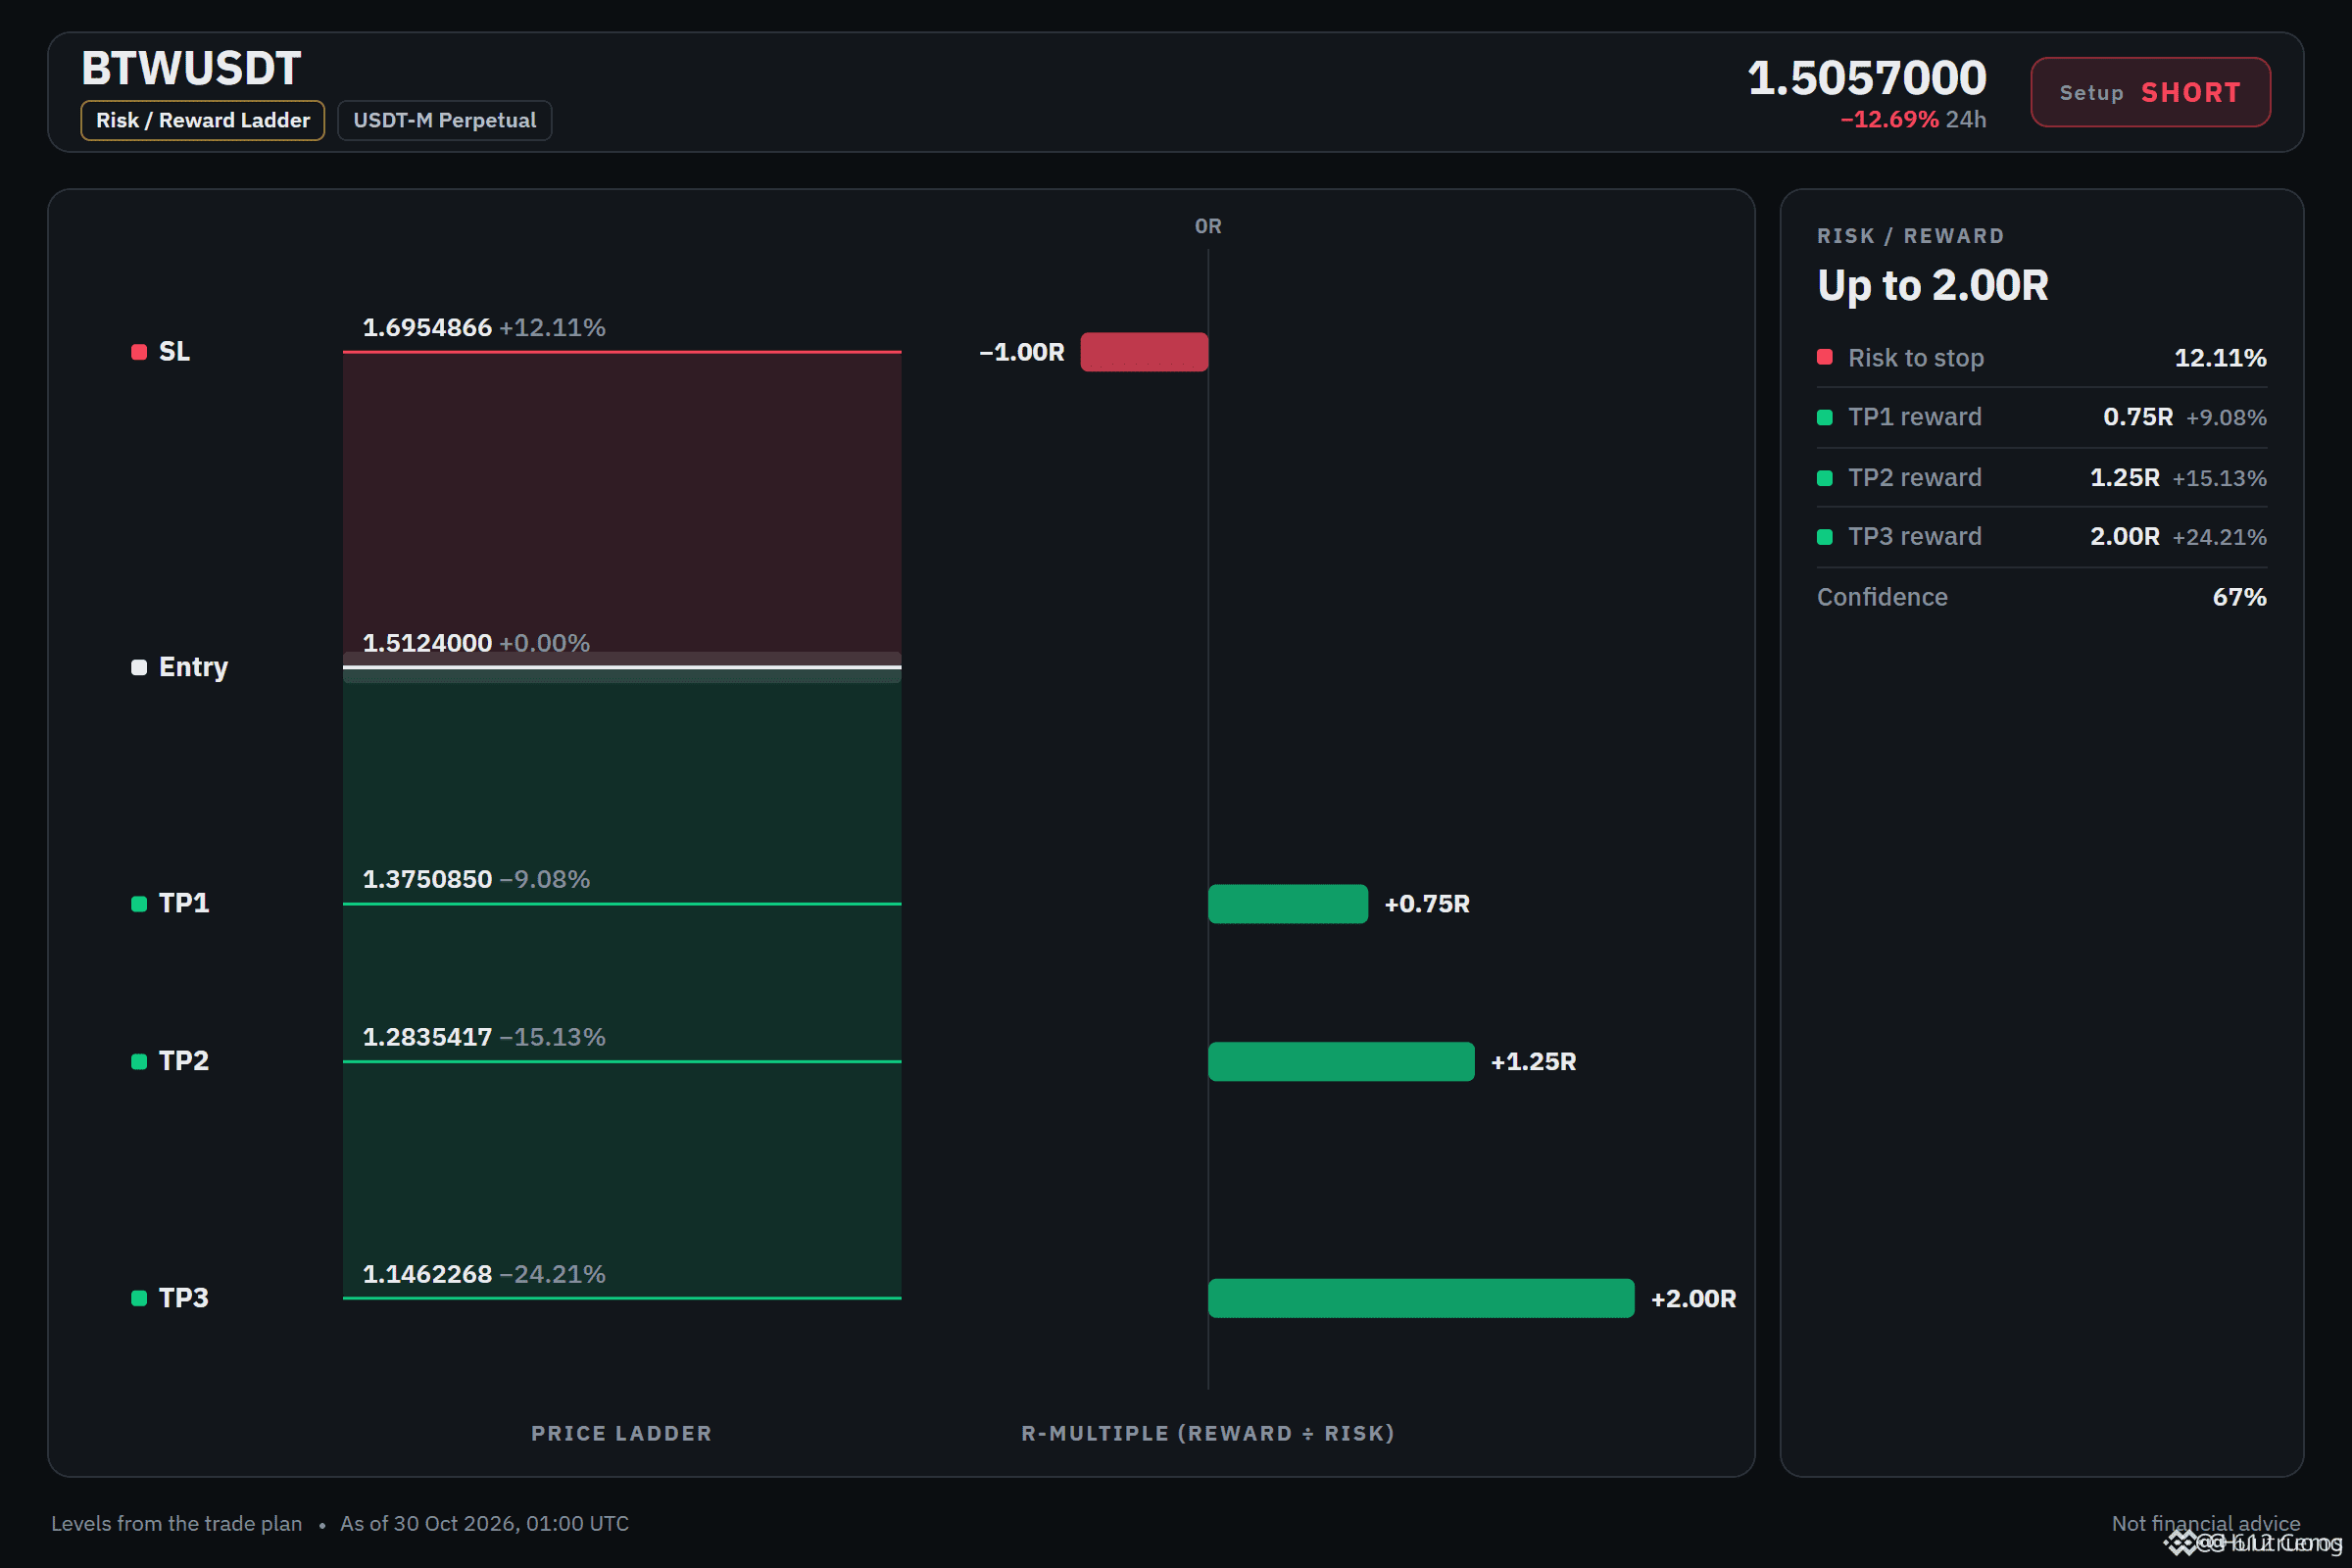
🔴 CORTO $BTW /USDT: se espera que el precio BAJE
Sesgo: CORTO · Inclinación
Entrada: 1.5031280 – 1.5216720
TP1: 1.3750850 (-9.1%)
TP2: 1.2835417 (-15.1%)
TP3: 1.1462268 (-24.2%)
SL: 1.6954866 (+12.1%)
Plan: entrar solo dentro de la zona, cerrar el 50% en TP1, el 25% en TP2, el 25% en TP3 y mover el stop al precio de entrada después de TP1.
Nota: convicción moderada; mantén una posición pequeña.
¿Por qué CORTO? Lo que comprobé: 4/11 están de acuerdo, 0 en contra.
• Tendencia bajista en 1h (por debajo de EMA50 y EMA200)
• Los vendedores están impulsando el movimiento (ADX de 15m: 23.0)
• Los vendedores tienen el impulso (RSI de 1h: 35.1)
Atención: La idea es errónea si el precio alcanza el stop en 1.6954866
Lectura neta: La tendencia de 1h es claramente bajista, lo que respalda una posición corta, pero la tendencia de 4h es mixta y la convicción sigue siendo moderada.
¿Cuál es tu nivel si no estás en corto?
La mayoría de los traders todavía espera un rebote.
🔴 CORTO $BTW /USDT: se espera que el precio BAJE
Sesgo: CORTO · Inclinación
Entrada: 1.5031280 – 1.5216720
TP1: 1.3750850 (-9.1%)
TP2: 1.2835417 (-15.1%)
TP3: 1.1462268 (-24.2%)
SL: 1.6954866 (+12.1%)
Plan: entrar solo dentro de la zona, cerrar el 50% en TP1, el 25% en TP2, el 25% en TP3 y mover el stop al precio de entrada después de TP1.
Nota: convicción moderada; mantén una posición pequeña.
¿Por qué CORTO? Lo que comprobé: 4/11 están de acuerdo, 0 en contra.
• Tendencia bajista en 1h (por debajo de EMA50 y EMA200)
• Los vendedores están impulsando el movimiento (ADX de 15m: 23.0)
• Los vendedores tienen el impulso (RSI de 1h: 35.1)
Atención: La idea es errónea si el precio alcanza el stop en 1.6954866
Lectura neta: La tendencia de 1h es claramente bajista, lo que respalda una posición corta, pero la tendencia de 4h es mixta y la convicción sigue siendo moderada.
¿Cuál es tu nivel si no estás en corto?
🔴 CORTO $BTW /USDT: se espera que el precio BAJE
Sesgo: CORTO · Inclinación
Entrada: 1.5031280 – 1.5216720
TP1: 1.3750850 (-9.1%)
TP2: 1.2835417 (-15.1%)
TP3: 1.1462268 (-24.2%)
SL: 1.6954866 (+12.1%)
Plan: entrar solo dentro de la zona, cerrar el 50% en TP1, el 25% en TP2, el 25% en TP3 y mover el stop al precio de entrada después de TP1.
Nota: convicción moderada; mantén una posición pequeña.
¿Por qué CORTO? Lo que comprobé: 4/11 están de acuerdo, 0 en contra.
• Tendencia bajista en 1h (por debajo de EMA50 y EMA200)
• Los vendedores están impulsando el movimiento (ADX de 15m: 23.0)
• Los vendedores tienen el impulso (RSI de 1h: 35.1)
Atención: La idea es errónea si el precio alcanza el stop en 1.6954866
Lectura neta: La tendencia de 1h es claramente bajista, lo que respalda una posición corta, pero la tendencia de 4h es mixta y la convicción sigue siendo moderada.
¿Cuál es tu nivel si no estás en corto?
22
·
--
Bajista
LAB no es un rebote seguro pese al reciente repunte.
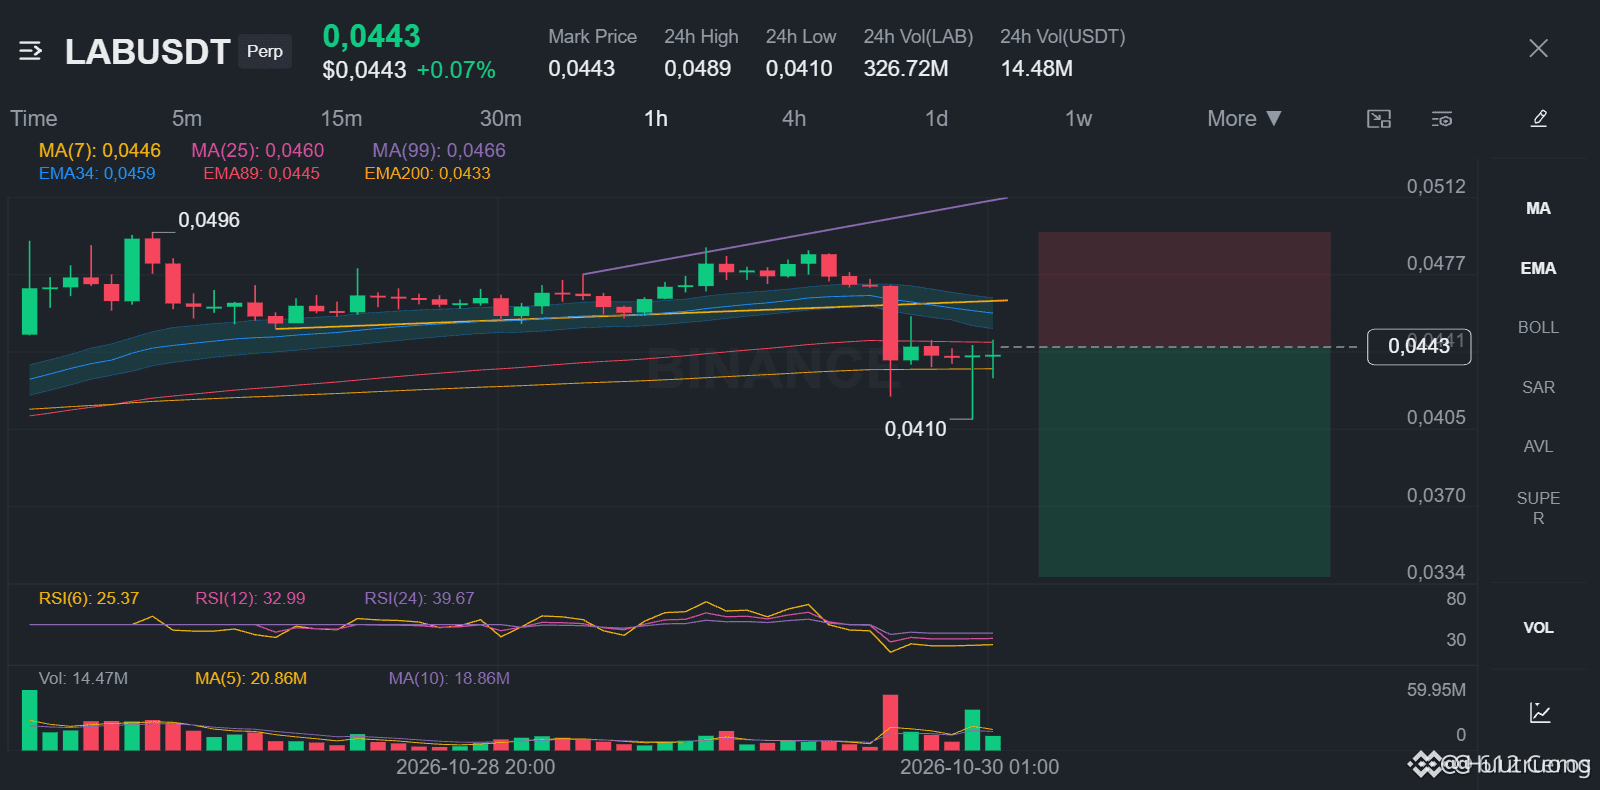
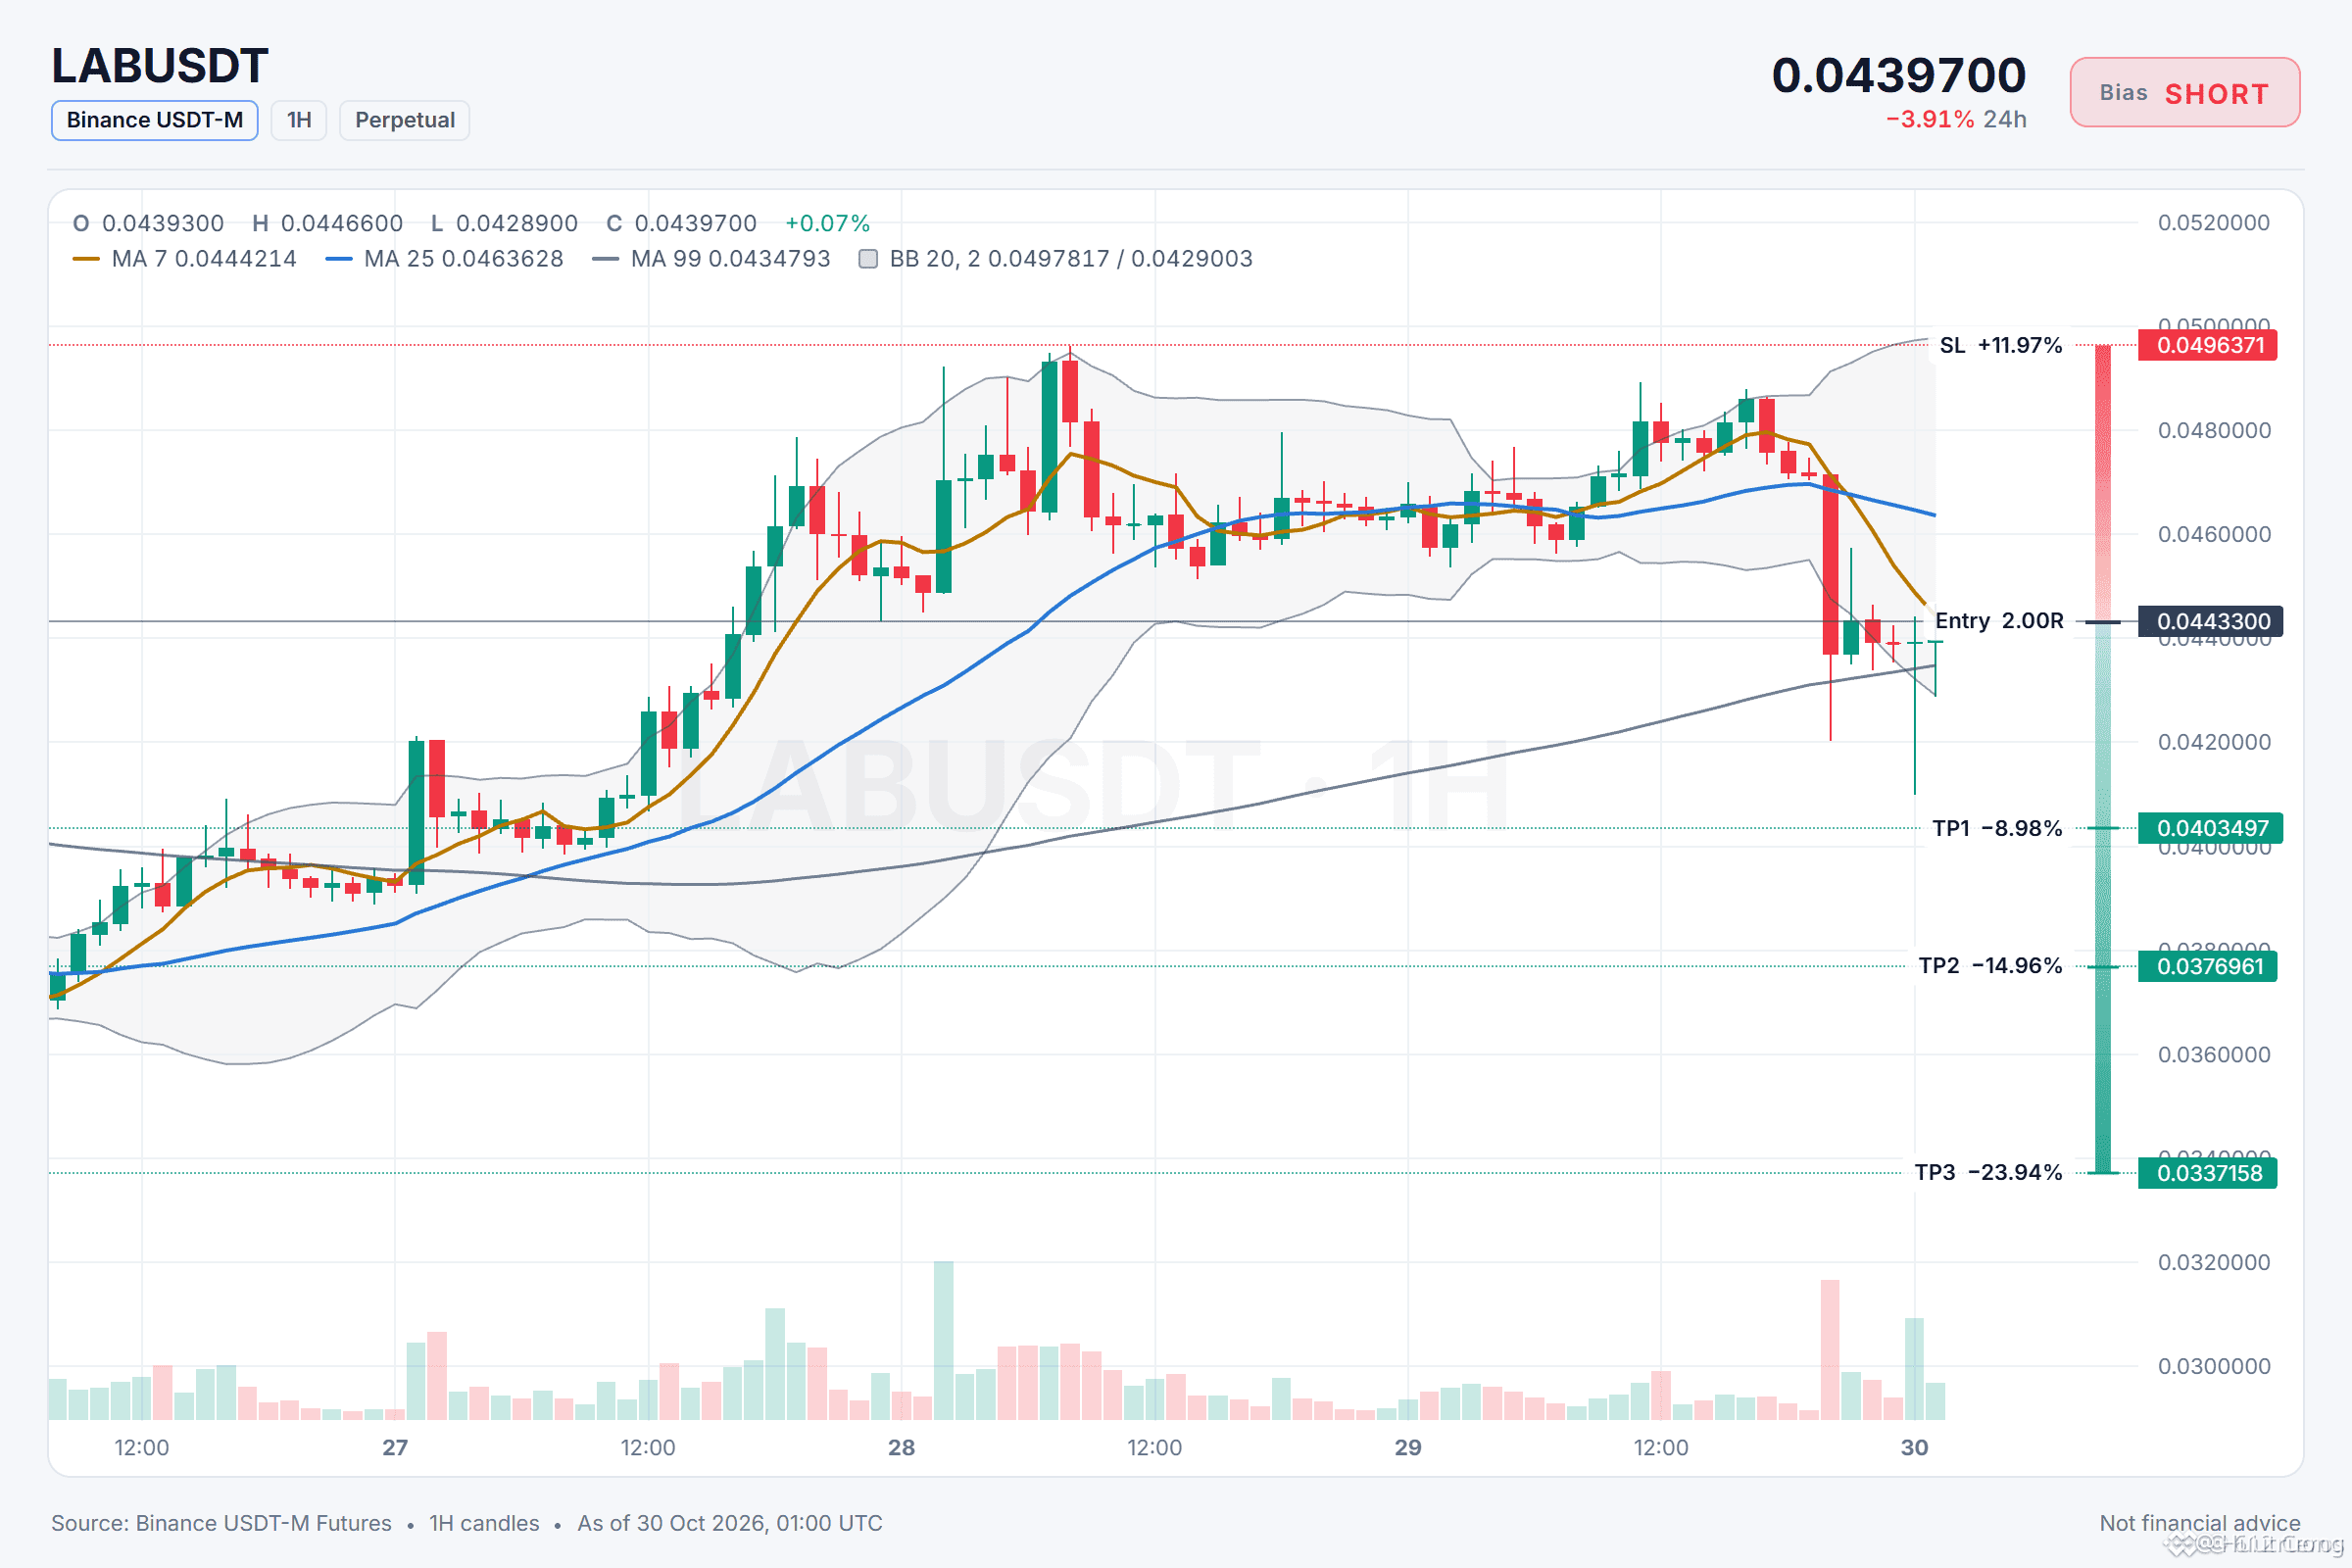
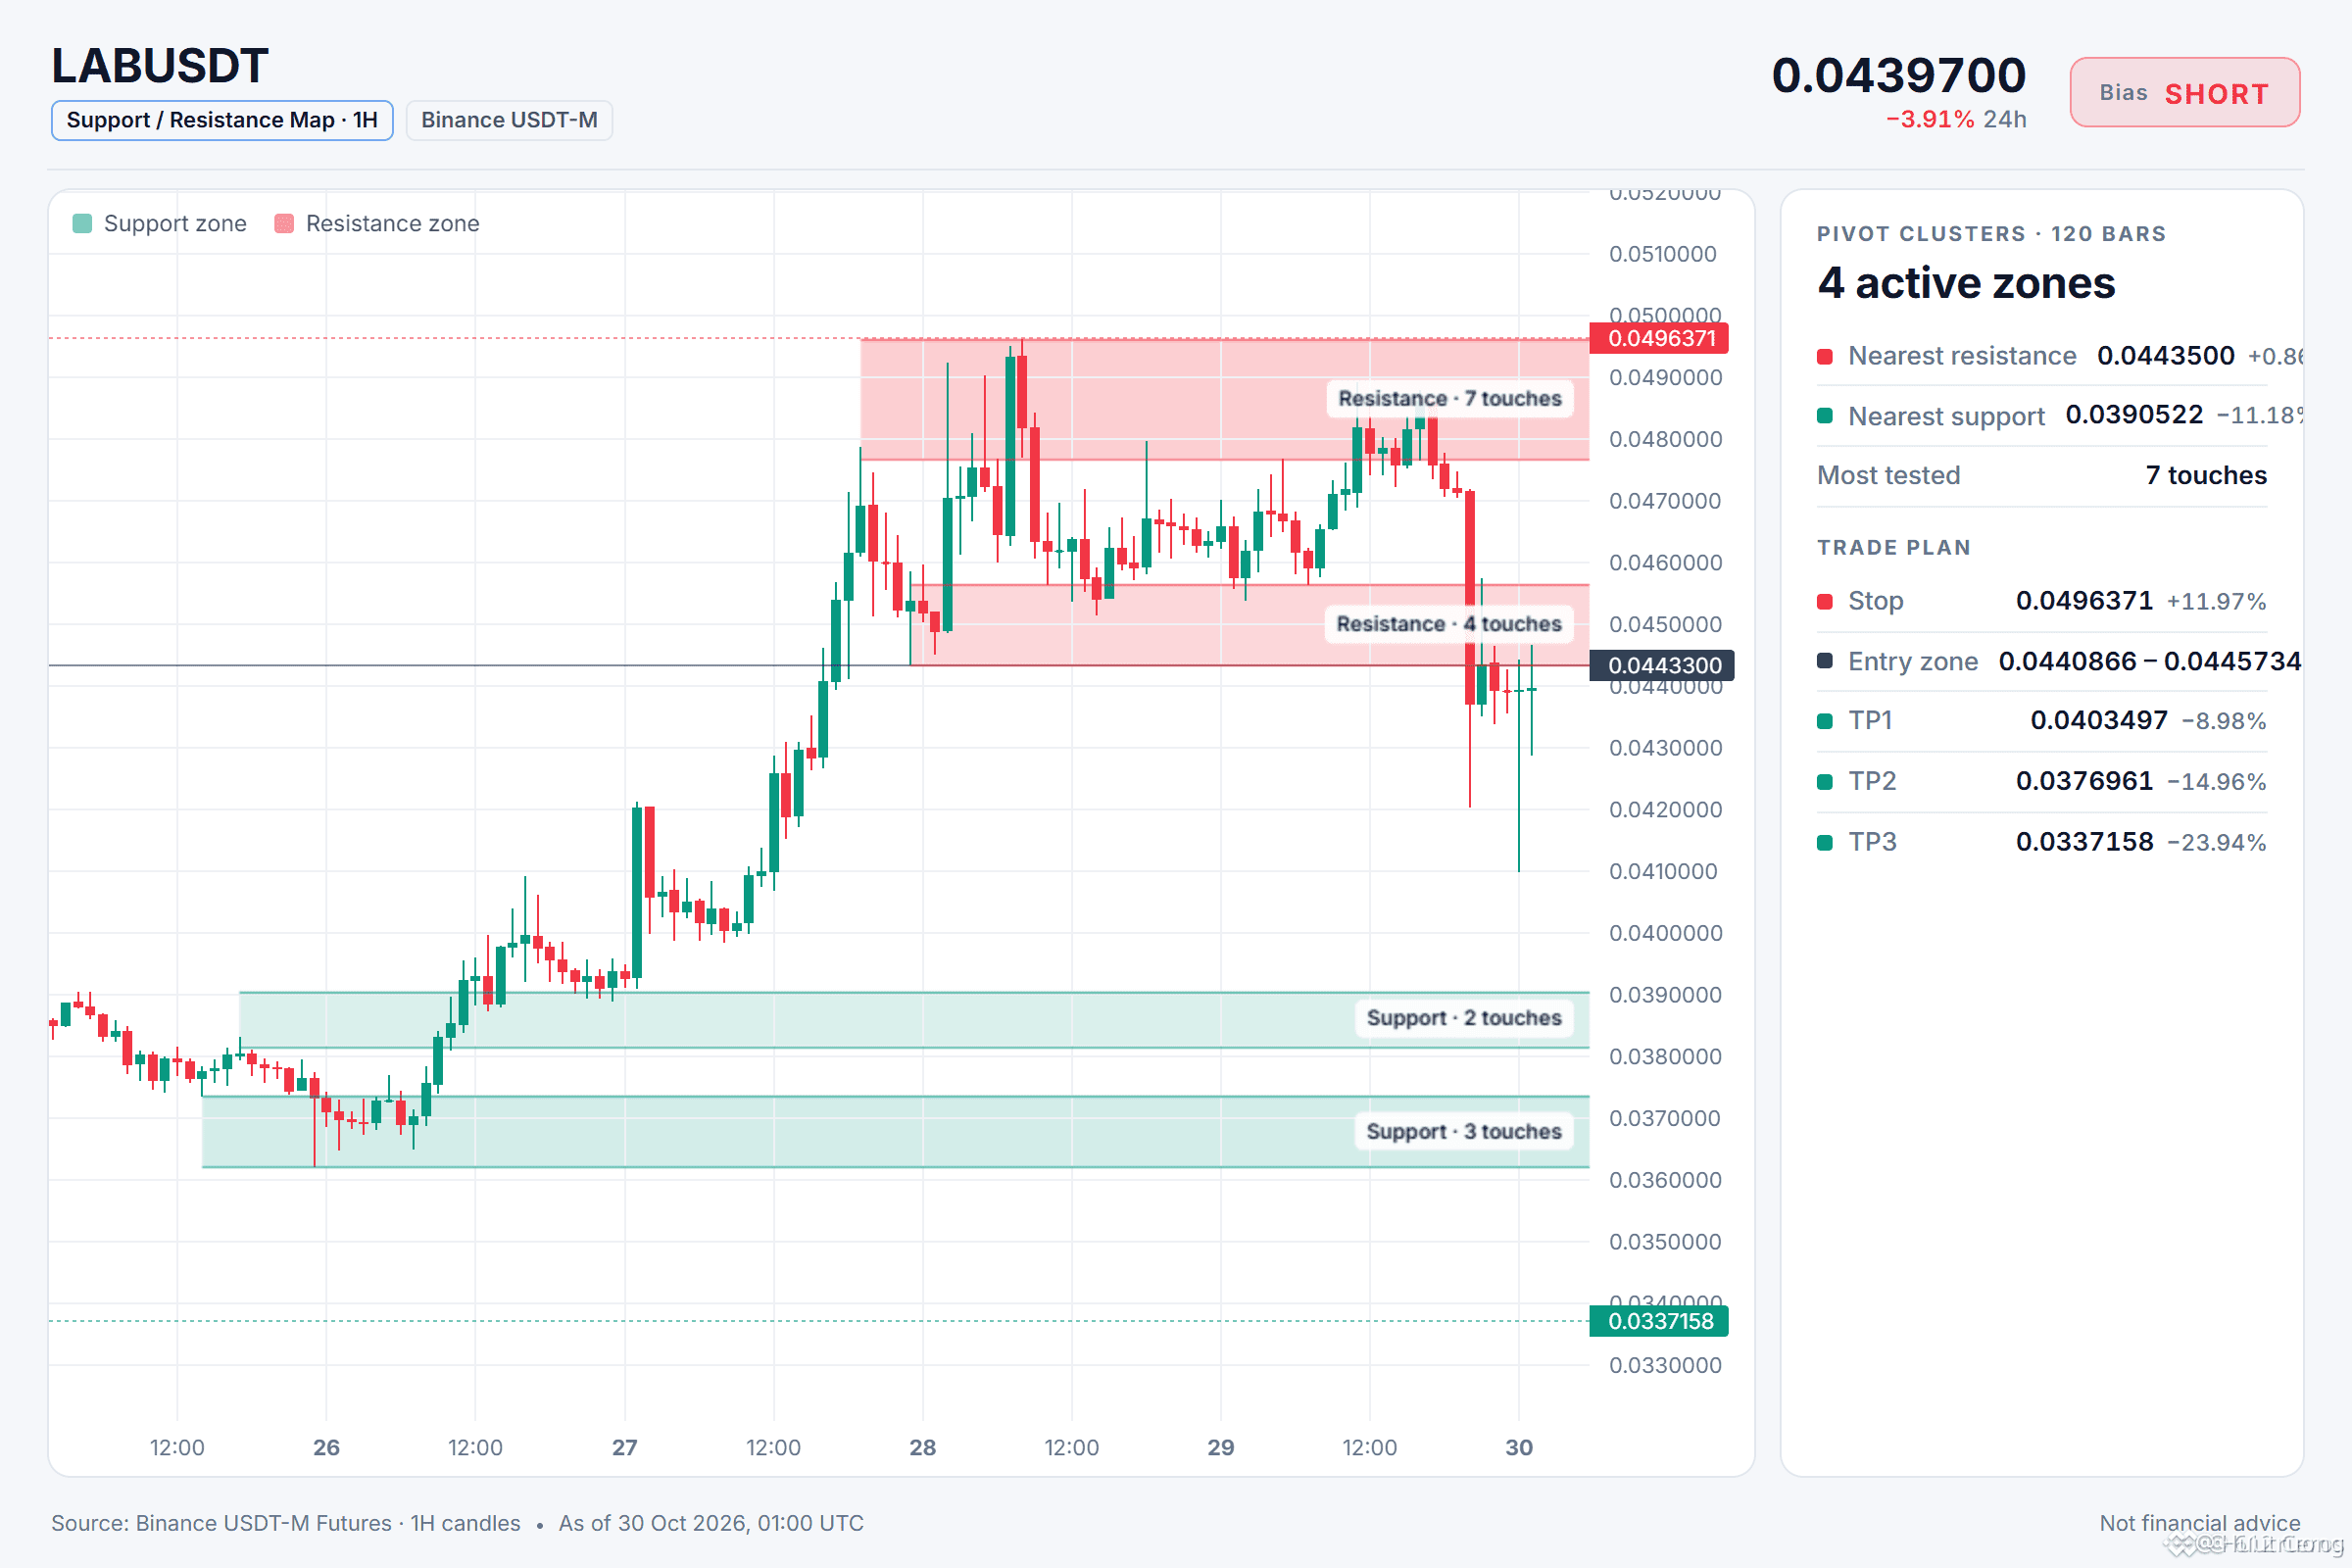
🔴 CORTO $LAB /USDT: se espera que el precio BAJE
Sesgo: CORTO · Tendencia
Entrada: 0.0440866 – 0.0445734
TP1: 0.0403497 (-9.0%)
TP2: 0.0376961 (-15.0%)
TP3: 0.0337158 (-23.9%)
SL: 0.0496371 (+12.0%)
Plan: entra solo dentro de la zona, cierra el 50% en TP1, el 25% en TP2, el 25% en TP3 y mueve el stop al precio de entrada después de TP1.
Nota: convicción moderada; mantén un tamaño pequeño.
¿Por qué CORTO? 4/12 señales coinciden, 0 están en contra.
• Tendencia diaria bajista (por debajo de EMA50 y EMA200)
• Los vendedores impulsan el movimiento (ADX de 15 min: 45.7)
• BTC está cayendo y esta moneda lo sigue (correlación: 0.71)
LAB en 3 puntos:
1. La tendencia diaria es bajista; el precio está por debajo de las medias móviles clave en el gráfico de largo plazo.
2. El RSI de 1 h está en 35.6, lo que significa que los vendedores están impulsando el momentum en este momento.
3. Una subida por encima de 0.0445734 invalidaría la configuración y obligaría a reconsiderarla.
¿Dónde vas a tomar ganancias si estás en corto aquí?
LAB no es un rebote seguro pese al reciente repunte.
🔴 CORTO $LAB /USDT: se espera que el precio BAJE
Sesgo: CORTO · Tendencia
Entrada: 0.0440866 – 0.0445734
TP1: 0.0403497 (-9.0%)
TP2: 0.0376961 (-15.0%)
TP3: 0.0337158 (-23.9%)
SL: 0.0496371 (+12.0%)
Plan: entra solo dentro de la zona, cierra el 50% en TP1, el 25% en TP2, el 25% en TP3 y mueve el stop al precio de entrada después de TP1.
Nota: convicción moderada; mantén un tamaño pequeño.
¿Por qué CORTO? 4/12 señales coinciden, 0 están en contra.
• Tendencia diaria bajista (por debajo de EMA50 y EMA200)
• Los vendedores impulsan el movimiento (ADX de 15 min: 45.7)
• BTC está cayendo y esta moneda lo sigue (correlación: 0.71)
LAB en 3 puntos:
1. La tendencia diaria es bajista; el precio está por debajo de las medias móviles clave en el gráfico de largo plazo.
2. El RSI de 1 h está en 35.6, lo que significa que los vendedores están impulsando el momentum en este momento.
3. Una subida por encima de 0.0445734 invalidaría la configuración y obligaría a reconsiderarla.
¿Dónde vas a tomar ganancias si estás en corto aquí?
🔴 CORTO $LAB /USDT: se espera que el precio BAJE
Sesgo: CORTO · Tendencia
Entrada: 0.0440866 – 0.0445734
TP1: 0.0403497 (-9.0%)
TP2: 0.0376961 (-15.0%)
TP3: 0.0337158 (-23.9%)
SL: 0.0496371 (+12.0%)
Plan: entra solo dentro de la zona, cierra el 50% en TP1, el 25% en TP2, el 25% en TP3 y mueve el stop al precio de entrada después de TP1.
Nota: convicción moderada; mantén un tamaño pequeño.
¿Por qué CORTO? 4/12 señales coinciden, 0 están en contra.
• Tendencia diaria bajista (por debajo de EMA50 y EMA200)
• Los vendedores impulsan el movimiento (ADX de 15 min: 45.7)
• BTC está cayendo y esta moneda lo sigue (correlación: 0.71)
LAB en 3 puntos:
1. La tendencia diaria es bajista; el precio está por debajo de las medias móviles clave en el gráfico de largo plazo.
2. El RSI de 1 h está en 35.6, lo que significa que los vendedores están impulsando el momentum en este momento.
3. Una subida por encima de 0.0445734 invalidaría la configuración y obligaría a reconsiderarla.
¿Dónde vas a tomar ganancias si estás en corto aquí?
12
Inicia sesión para explorar más contenidos
Únete a usuarios globales de criptomonedas en Binance Square
⚡️ Obtén información útil y actualizada sobre criptos.
💬 Avalado por el mayor exchange de criptomonedas en el mundo.
👍 Descubre perspectivas reales de creadores verificados.
Email/número de teléfono
Temas populares
SuspectedNorthKoreaAttacksAccountForNearly89%OfCryptoHackLosses
167 vistas
12 están debatiendo
🚨 LA ECUACIÓN DEL EXPLOIT: 89 % DE DOMINIO 🚨
Crypto With Faisal
·1 me gusta
·93 vistas
OpenAICutsFundraisingTargetBy$10B
93 vistas
28 están debatiendo
ASICHasReceivedNoPredictionMarketApplications
4,761 vistas
177 están debatiendo