

CryptoQuant Quicktake
9.3k Publicaciones

CryptoQuant Quicktake
 Verificado Plus de Binance Square
Denunciar
Bloquear usuario
CryptoQuant.com - Leading On-chain Data/Analytics Provider
0 Siguiendo
25.2K+ Seguidores
27.4K+ Me gusta
Publicaciones
Artículo
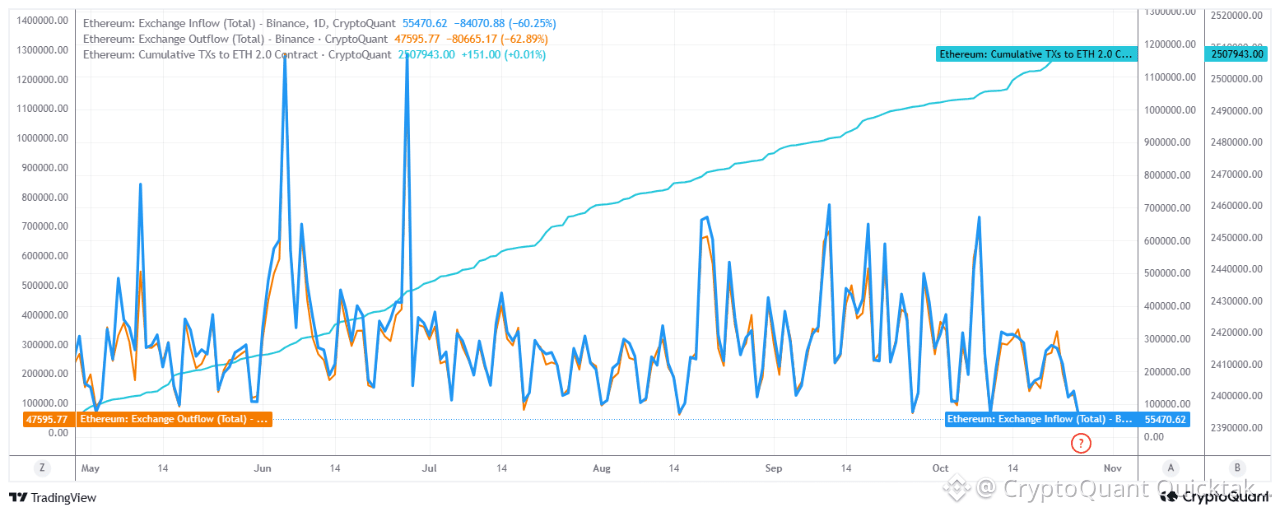
ETHEREUM: las entradas a Binance podrían ser una preparación ante la decisión de la FEDRecientemente, se registraron entradas de aproximadamente 55.471 ETH a Binance y salidas de 47.596 ETH. En otras palabras, las entradas netas de 7.875 ETH superaron las salidas. Esto significa que ese día aumentó la cantidad de ETH disponible para la venta en Binance y que la presión vendedora a corto plazo pudo haber subido ligeramente. La reciente tendencia bajista del precio también lo confirma.
La reciente disminución de ambos flujos sugiere que la actividad de negociación y transferencia podría haberse calmado.
El número acumulado de transacciones al contrato de depósito de Ethereum 2.0 sigue aumentando de manera constante. Aunque no es un indicador directo de la demanda de ETH, sugiere que el uso activo de la red es prometedor.
ETHEREUM: las entradas a Binance podrían ser una preparación ante la decisión de la FED
Recientemente, se registraron entradas de aproximadamente 55.471 ETH a Binance y salidas de 47.596 ETH. En otras palabras, las entradas netas de 7.875 ETH superaron las salidas. Esto significa que ese día aumentó la cantidad de ETH disponible para la venta en Binance y que la presión vendedora a corto plazo pudo haber subido ligeramente. La reciente tendencia bajista del precio también lo confirma.
La reciente disminución de ambos flujos sugiere que la actividad de negociación y transferencia podría haberse calmado.
El número acumulado de transacciones al contrato de depósito de Ethereum 2.0 sigue aumentando de manera constante. Aunque no es un indicador directo de la demanda de ETH, sugiere que el uso activo de la red es prometedor.
La reciente disminución de ambos flujos sugiere que la actividad de negociación y transferencia podría haberse calmado.
El número acumulado de transacciones al contrato de depósito de Ethereum 2.0 sigue aumentando de manera constante. Aunque no es un indicador directo de la demanda de ETH, sugiere que el uso activo de la red es prometedor.
113
Artículo
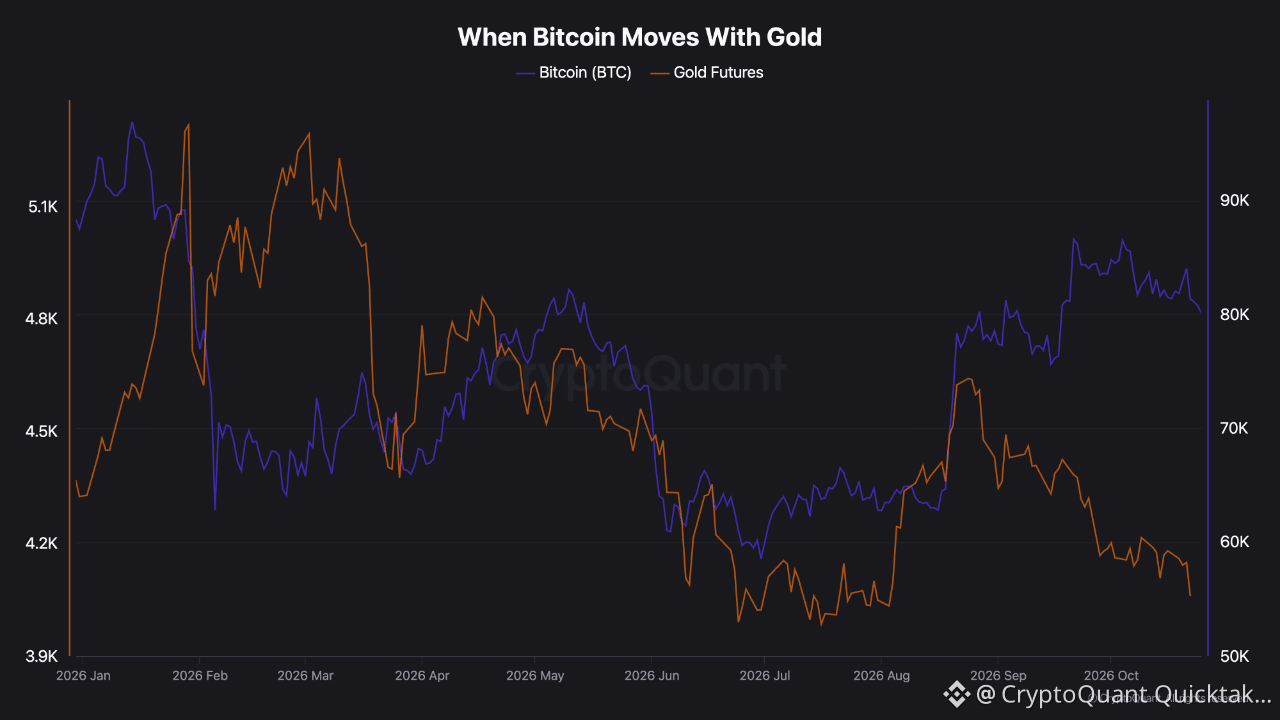
Cuando el bitcoin se mueve junto con el oroEl BTC y el oro se han movido en la misma dirección durante varios periodos de este año, entre ellos desde finales de marzo hasta mediados de abril y desde mayo hasta junio.
Ahora, en octubre, volvemos a observar un patrón similar.
Es importante para la gestión del riesgo saber si esto es temporal o si continuará durante los próximos meses.
Si el BTC y el oro siguen moviéndose en la misma dirección, mantener ambos podría ofrecer menos protección durante una liquidación en el mercado, cuando los dos activos podrían verse presionados al mismo tiempo.
Si este patrón continúa, quizá tengamos que ajustar nuestra exposición a ambos activos antes de la próxima liquidación en el mercado.
Cuando el bitcoin se mueve junto con el oro
El BTC y el oro se han movido en la misma dirección durante varios periodos de este año, entre ellos desde finales de marzo hasta mediados de abril y desde mayo hasta junio.
Ahora, en octubre, volvemos a observar un patrón similar.
Es importante para la gestión del riesgo saber si esto es temporal o si continuará durante los próximos meses.
Si el BTC y el oro siguen moviéndose en la misma dirección, mantener ambos podría ofrecer menos protección durante una liquidación en el mercado, cuando los dos activos podrían verse presionados al mismo tiempo.
Si este patrón continúa, quizá tengamos que ajustar nuestra exposición a ambos activos antes de la próxima liquidación en el mercado.
Ahora, en octubre, volvemos a observar un patrón similar.
Es importante para la gestión del riesgo saber si esto es temporal o si continuará durante los próximos meses.
Si el BTC y el oro siguen moviéndose en la misma dirección, mantener ambos podría ofrecer menos protección durante una liquidación en el mercado, cuando los dos activos podrían verse presionados al mismo tiempo.
Si este patrón continúa, quizá tengamos que ajustar nuestra exposición a ambos activos antes de la próxima liquidación en el mercado.
143
Artículo
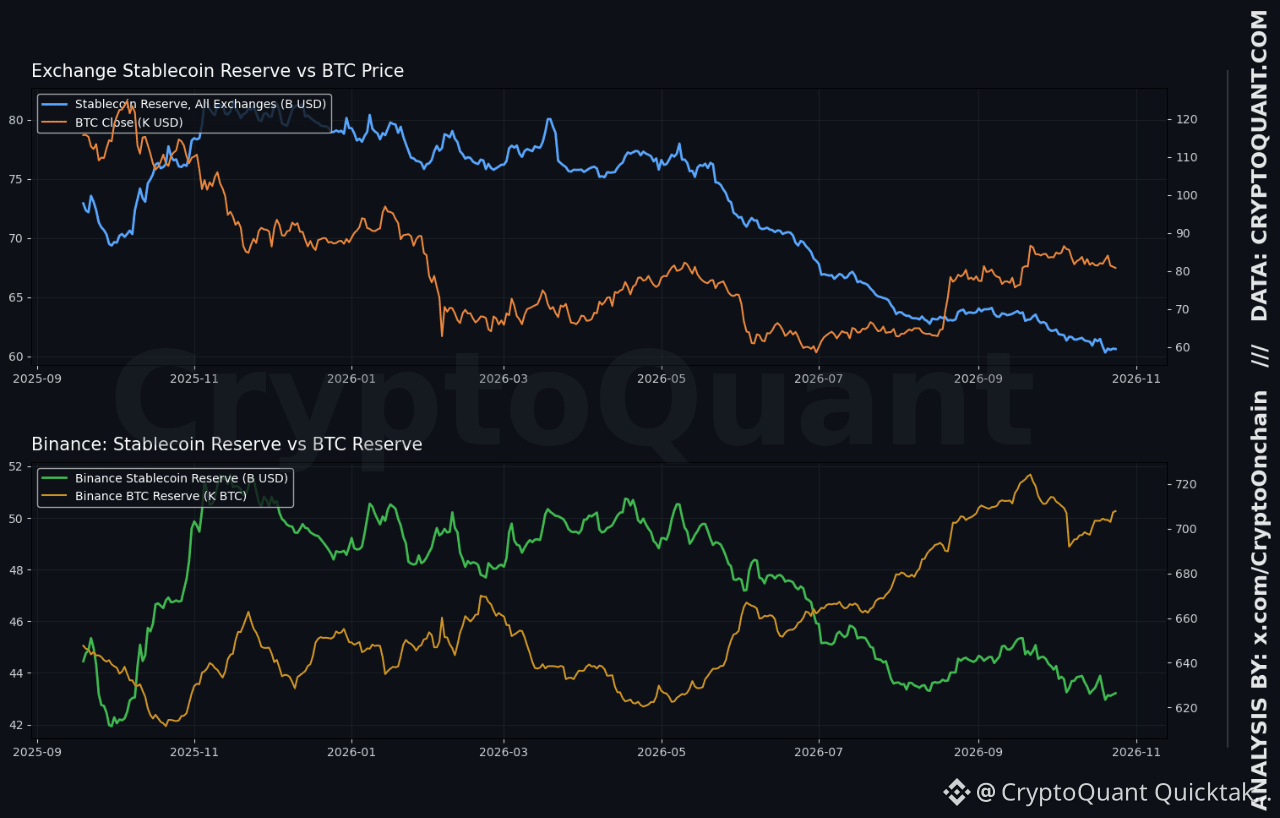
Las reservas de monedas estables en exchanges caen a 60,6 mil millones de dólares, su mínimo en 12 mesesAl 24 de octubre, las reservas de monedas estables en todos los exchanges se situaban en 60,62 mil millones de dólares, en el percentil 1 del último año, es decir, en su nivel más bajo de los últimos doce meses. Binance tenía 43,21 mil millones de dólares, en el percentil 2. BTC cerró en 80,8 mil dólares, en el percentil 66 de su rango de un año.
Los flujos netos de monedas estables fueron negativos en todos los exchanges: -34,2 millones de dólares en el día y un promedio de -93,9 millones de dólares en 7 días. Binance fue la excepción durante la jornada, con una entrada de 48,2 millones de dólares, aunque su promedio de 7 días fue de -61,2 millones de dólares. Una entrada en un solo día frente a una tendencia semanal de salidas hace que la señal sea mixta, en lugar de indicar claramente una dirección.
Las reservas de monedas estables en exchanges caen a 60,6 mil millones de dólares, su mínimo en 12 meses
Al 24 de octubre, las reservas de monedas estables en todos los exchanges se situaban en 60,62 mil millones de dólares, en el percentil 1 del último año, es decir, en su nivel más bajo de los últimos doce meses. Binance tenía 43,21 mil millones de dólares, en el percentil 2. BTC cerró en 80,8 mil dólares, en el percentil 66 de su rango de un año.
Los flujos netos de monedas estables fueron negativos en todos los exchanges: -34,2 millones de dólares en el día y un promedio de -93,9 millones de dólares en 7 días. Binance fue la excepción durante la jornada, con una entrada de 48,2 millones de dólares, aunque su promedio de 7 días fue de -61,2 millones de dólares. Una entrada en un solo día frente a una tendencia semanal de salidas hace que la señal sea mixta, en lugar de indicar claramente una dirección.
Los flujos netos de monedas estables fueron negativos en todos los exchanges: -34,2 millones de dólares en el día y un promedio de -93,9 millones de dólares en 7 días. Binance fue la excepción durante la jornada, con una entrada de 48,2 millones de dólares, aunque su promedio de 7 días fue de -61,2 millones de dólares. Una entrada en un solo día frente a una tendencia semanal de salidas hace que la señal sea mixta, en lugar de indicar claramente una dirección.
22
Artículo
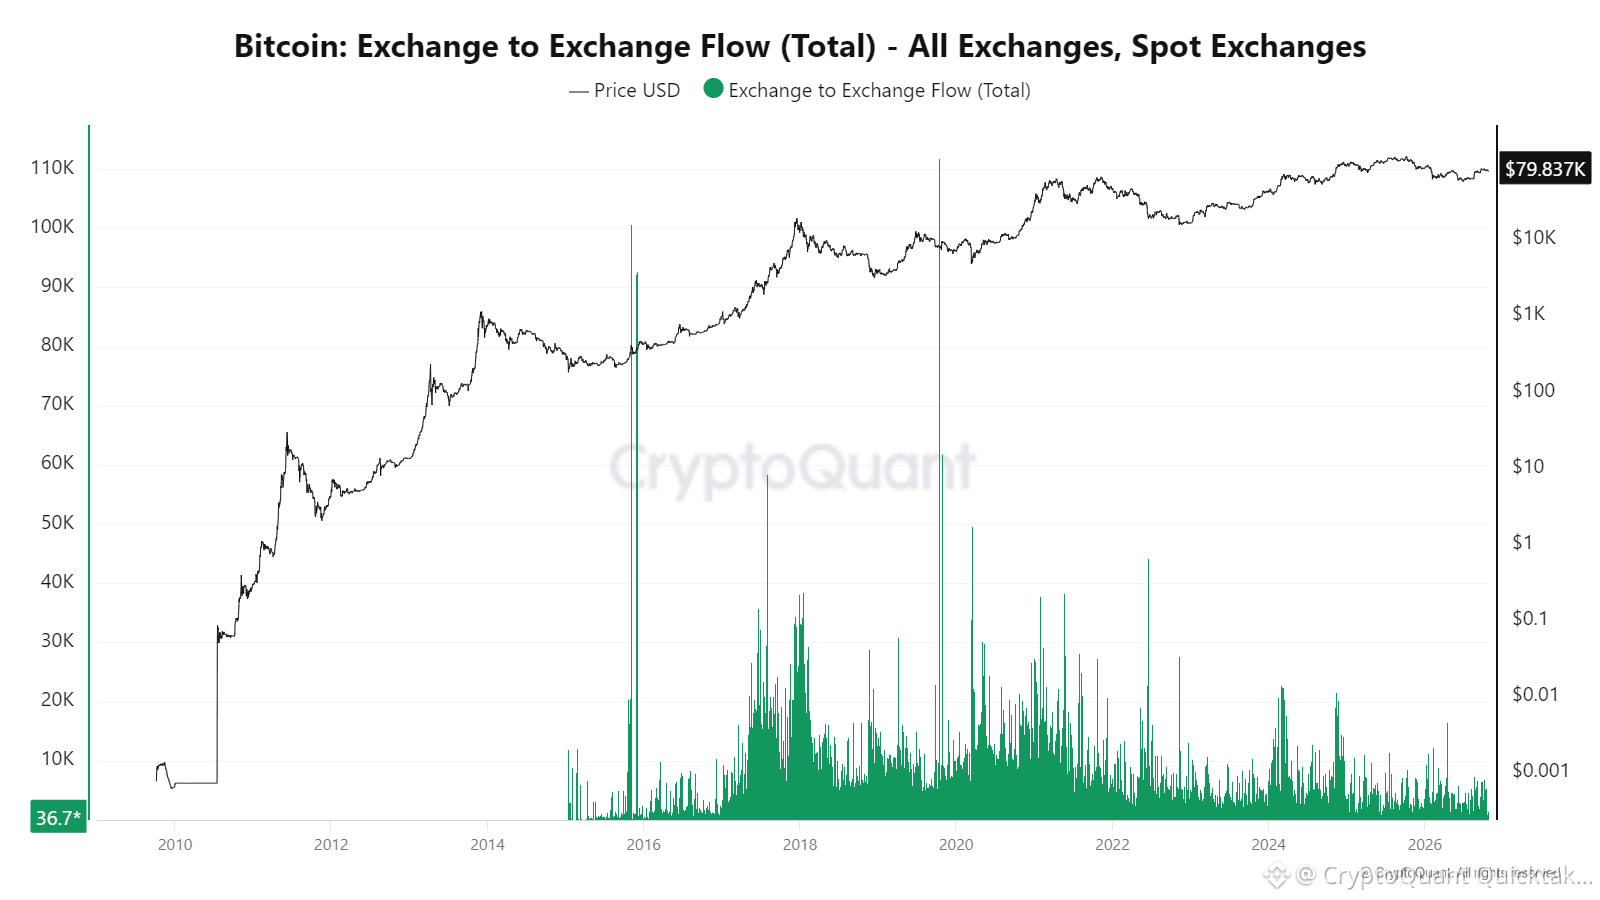
Los flujos de Bitcoin entre exchanges se han calmado, y es fácil no darse cuentaEn ciclos anteriores, las monedas se movían constantemente entre exchanges, con picos que alcanzaban decenas de miles de BTC. Hoy las barras son mucho más bajas, incluso con el precio rondando los 79,8 mil dólares.
Lo que me llama la atención es el contraste. El precio sigue alto en relación con su tendencia a largo plazo, pero la infraestructura subyacente parece más tranquila que en ciclos anteriores. Los flujos entre exchanges se deben sobre todo a traders y creadores de mercado que mueven monedas para aprovechar oportunidades de arbitraje, aportar liquidez y reequilibrar sus posiciones. Un menor movimiento puede significar menos actividad frenética entre plataformas.
Los flujos de Bitcoin entre exchanges se han calmado, y es fácil no darse cuenta
En ciclos anteriores, las monedas se movían constantemente entre exchanges, con picos que alcanzaban decenas de miles de BTC. Hoy las barras son mucho más bajas, incluso con el precio rondando los 79,8 mil dólares.
Lo que me llama la atención es el contraste. El precio sigue alto en relación con su tendencia a largo plazo, pero la infraestructura subyacente parece más tranquila que en ciclos anteriores. Los flujos entre exchanges se deben sobre todo a traders y creadores de mercado que mueven monedas para aprovechar oportunidades de arbitraje, aportar liquidez y reequilibrar sus posiciones. Un menor movimiento puede significar menos actividad frenética entre plataformas.
Lo que me llama la atención es el contraste. El precio sigue alto en relación con su tendencia a largo plazo, pero la infraestructura subyacente parece más tranquila que en ciclos anteriores. Los flujos entre exchanges se deben sobre todo a traders y creadores de mercado que mueven monedas para aprovechar oportunidades de arbitraje, aportar liquidez y reequilibrar sus posiciones. Un menor movimiento puede significar menos actividad frenética entre plataformas.
220
Artículo
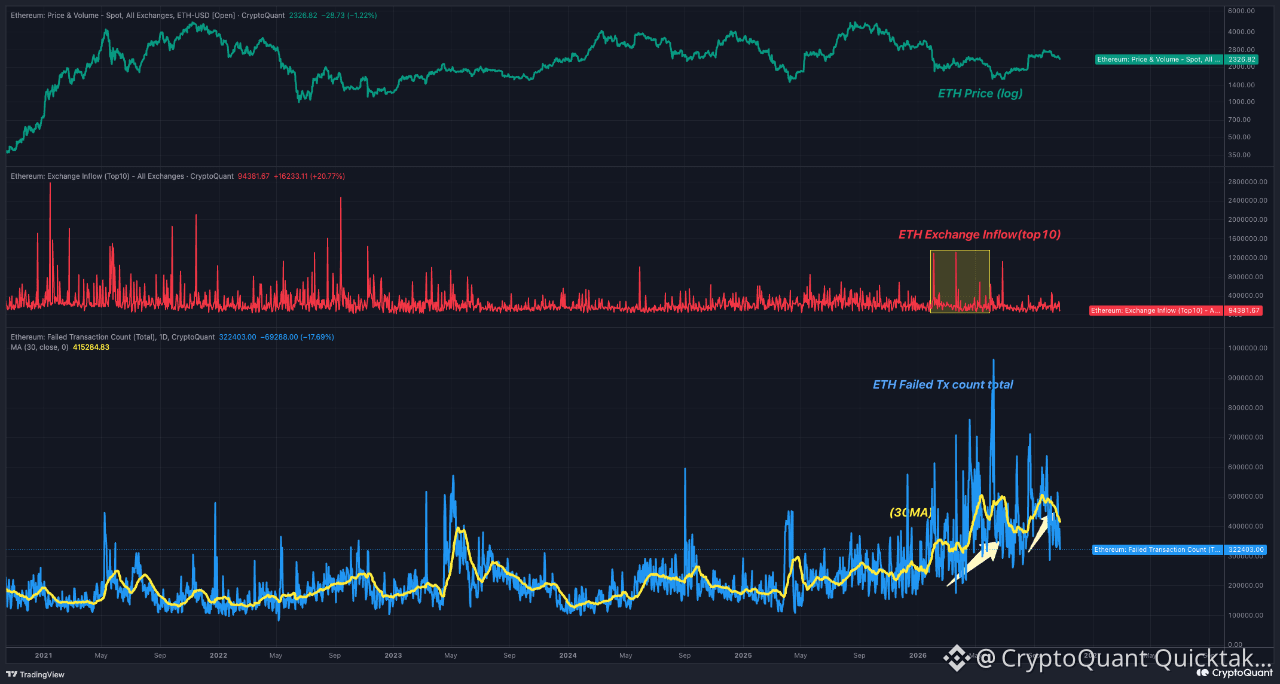
La actividad on-chain de Ethereum se enfría: ¿está rotando el capital hacia la narrativa de la IA?El impulso on-chain de Ethereum parece estar perdiendo fuerza tras un prolongado periodo de fuerte congestión. La media móvil de 30 días de las transacciones fallidas —a menudo un indicador de fricción intensa y de la efervescencia especulativa de la red— ha caído bruscamente desde su máximo reciente, mientras que las entradas desde los principales exchanges siguen siendo en gran medida moderadas. En lugar de señalar un deterioro estructural, esta pausa sugiere que quizá el capital simplemente se esté tomando un respiro; dado que el apetito por el riesgo y la liquidez están siendo absorbidos cada vez más por la actual tendencia de la IA, los participantes podrían estar manteniendo fondos disponibles al margen hasta que vuelva a surgir una narrativa más clara en la capa base.
La actividad on-chain de Ethereum se enfría: ¿está rotando el capital hacia la narrativa de la IA?
El impulso on-chain de Ethereum parece estar perdiendo fuerza tras un prolongado periodo de fuerte congestión. La media móvil de 30 días de las transacciones fallidas —a menudo un indicador de fricción intensa y de la efervescencia especulativa de la red— ha caído bruscamente desde su máximo reciente, mientras que las entradas desde los principales exchanges siguen siendo en gran medida moderadas. En lugar de señalar un deterioro estructural, esta pausa sugiere que quizá el capital simplemente se esté tomando un respiro; dado que el apetito por el riesgo y la liquidez están siendo absorbidos cada vez más por la actual tendencia de la IA, los participantes podrían estar manteniendo fondos disponibles al margen hasta que vuelva a surgir una narrativa más clara en la capa base.
105
Artículo
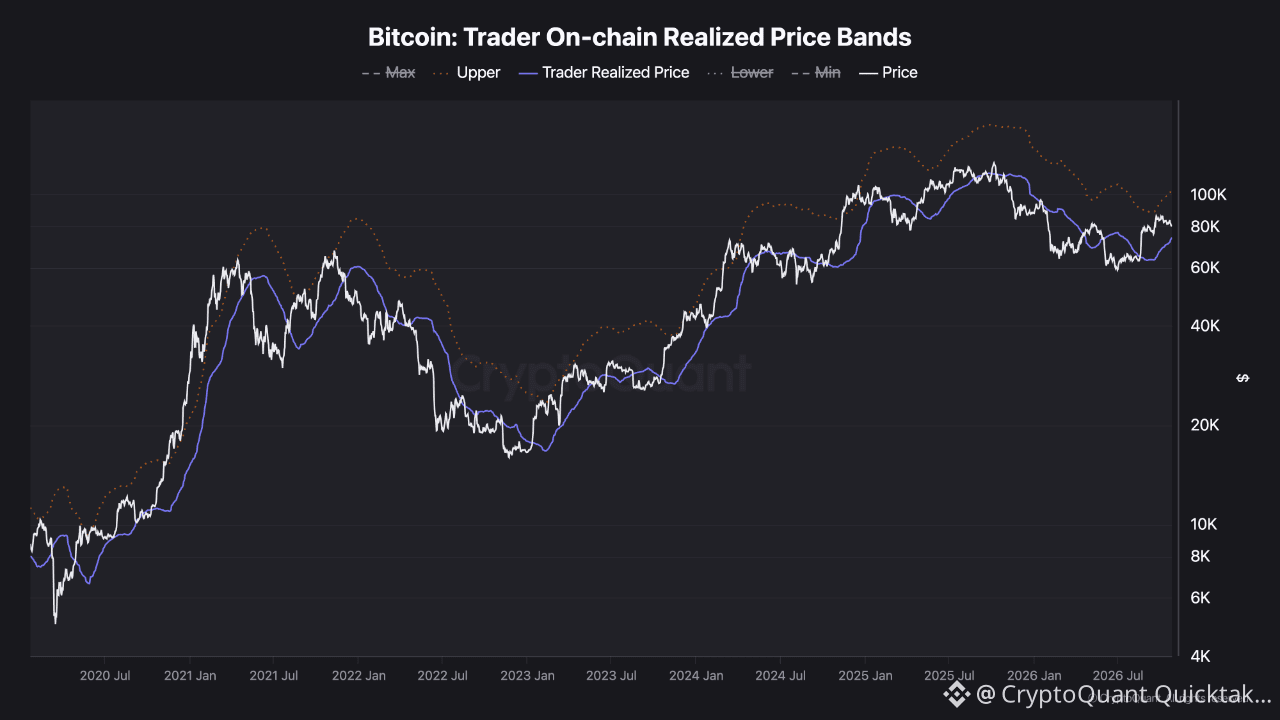
El precio realizado de los traders vuelve a subir: soporte clave si BTC corrigeEl precio realizado on-chain de los traders refleja el precio promedio al que se adquirieron los BTC que se movieron por última vez hace entre 1 y 3 meses; en la práctica, representa el costo de adquisición de los participantes relativamente recientes del mercado.
La estructura actual es interesante.
BTC cotiza en torno a la zona baja de los 80.000 dólares, mientras que el precio realizado de los traders ha subido hasta la zona media de los 70.000 dólares.
Esto significa que el precio sigue cotizando por encima del costo promedio de adquisición de los traders recientes.
Históricamente, durante las fases alcistas, este precio realizado ha actuado a menudo como soporte cuando BTC corregía hacia ese nivel. Sin embargo, cuando el precio se mantenía por debajo, ese mismo nivel podía convertirse en resistencia, ya que los traders en pérdidas vendían cerca de su punto de equilibrio.
El precio realizado de los traders vuelve a subir: soporte clave si BTC corrige
El precio realizado on-chain de los traders refleja el precio promedio al que se adquirieron los BTC que se movieron por última vez hace entre 1 y 3 meses; en la práctica, representa el costo de adquisición de los participantes relativamente recientes del mercado.
La estructura actual es interesante.
BTC cotiza en torno a la zona baja de los 80.000 dólares, mientras que el precio realizado de los traders ha subido hasta la zona media de los 70.000 dólares.
Esto significa que el precio sigue cotizando por encima del costo promedio de adquisición de los traders recientes.
Históricamente, durante las fases alcistas, este precio realizado ha actuado a menudo como soporte cuando BTC corregía hacia ese nivel. Sin embargo, cuando el precio se mantenía por debajo, ese mismo nivel podía convertirse en resistencia, ya que los traders en pérdidas vendían cerca de su punto de equilibrio.
La estructura actual es interesante.
BTC cotiza en torno a la zona baja de los 80.000 dólares, mientras que el precio realizado de los traders ha subido hasta la zona media de los 70.000 dólares.
Esto significa que el precio sigue cotizando por encima del costo promedio de adquisición de los traders recientes.
Históricamente, durante las fases alcistas, este precio realizado ha actuado a menudo como soporte cuando BTC corregía hacia ese nivel. Sin embargo, cuando el precio se mantenía por debajo, ese mismo nivel podía convertirse en resistencia, ya que los traders en pérdidas vendían cerca de su punto de equilibrio.
162
Artículo
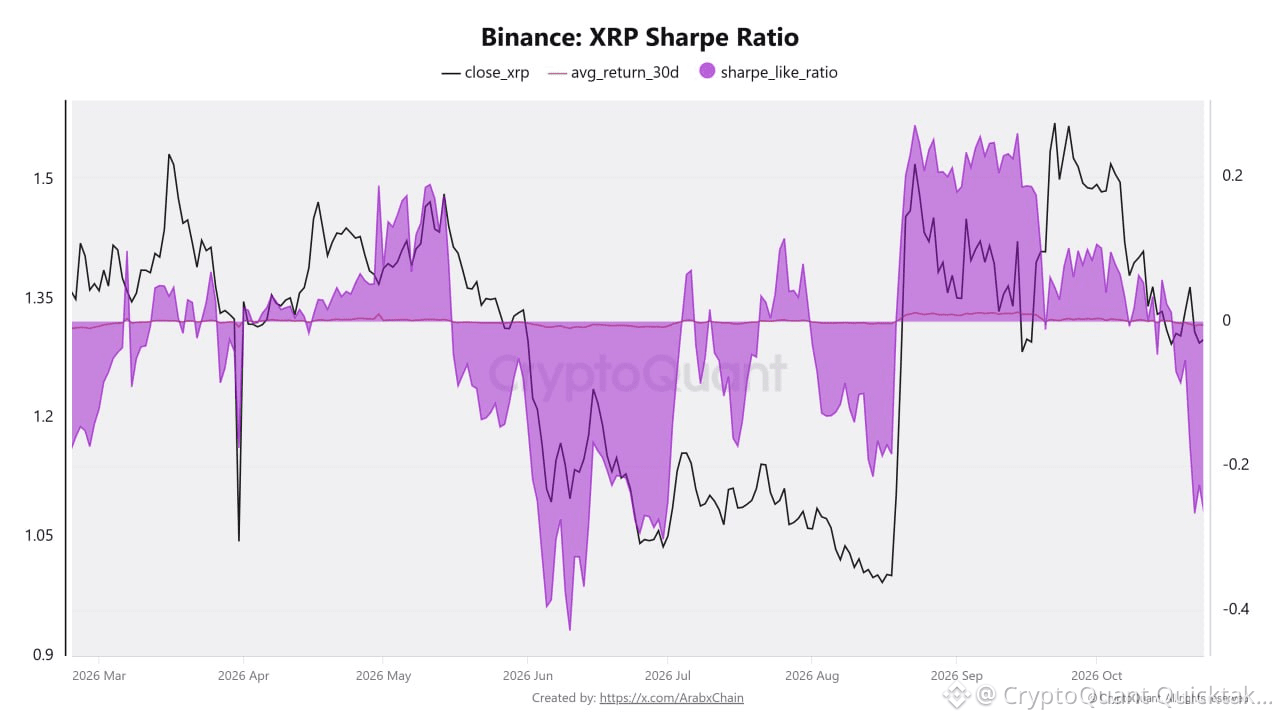
El ratio similar al de Sharpe de XRP en Binance cae a su nivel más bajo en cuatro mesesEl ratio similar al de Sharpe de XRP en Binance ha caído hasta aproximadamente -0.2641, su nivel más bajo en cuatro meses. Este descenso coincide con una caída del precio de XRP hasta alrededor de 1,29 $, lo que refleja un deterioro de la rentabilidad ajustada al riesgo durante el período reciente.
El descenso del ratio similar al de Sharpe de XRP en Binance apunta a un empeoramiento de la rentabilidad ajustada al riesgo. Esto sugiere que los rendimientos generados durante el período analizado se han vuelto menos atractivos en relación con el nivel de riesgo y volatilidad implicados. Un valor negativo de aproximadamente -0.2641 indica que los rendimientos han quedado por debajo del índice de referencia utilizado en el cálculo, lo que podría reflejar condiciones de trading menos favorables y una mayor incertidumbre en el mercado. Aunque alcanzar el nivel más bajo en cuatro meses señala una debilidad persistente en el rendimiento ajustado al riesgo, no significa necesariamente que el precio de XRP vaya a seguir cayendo.
El ratio similar al de Sharpe de XRP en Binance cae a su nivel más bajo en cuatro meses
El ratio similar al de Sharpe de XRP en Binance ha caído hasta aproximadamente -0.2641, su nivel más bajo en cuatro meses. Este descenso coincide con una caída del precio de XRP hasta alrededor de 1,29 $, lo que refleja un deterioro de la rentabilidad ajustada al riesgo durante el período reciente.
El descenso del ratio similar al de Sharpe de XRP en Binance apunta a un empeoramiento de la rentabilidad ajustada al riesgo. Esto sugiere que los rendimientos generados durante el período analizado se han vuelto menos atractivos en relación con el nivel de riesgo y volatilidad implicados. Un valor negativo de aproximadamente -0.2641 indica que los rendimientos han quedado por debajo del índice de referencia utilizado en el cálculo, lo que podría reflejar condiciones de trading menos favorables y una mayor incertidumbre en el mercado. Aunque alcanzar el nivel más bajo en cuatro meses señala una debilidad persistente en el rendimiento ajustado al riesgo, no significa necesariamente que el precio de XRP vaya a seguir cayendo.
El descenso del ratio similar al de Sharpe de XRP en Binance apunta a un empeoramiento de la rentabilidad ajustada al riesgo. Esto sugiere que los rendimientos generados durante el período analizado se han vuelto menos atractivos en relación con el nivel de riesgo y volatilidad implicados. Un valor negativo de aproximadamente -0.2641 indica que los rendimientos han quedado por debajo del índice de referencia utilizado en el cálculo, lo que podría reflejar condiciones de trading menos favorables y una mayor incertidumbre en el mercado. Aunque alcanzar el nivel más bajo en cuatro meses señala una debilidad persistente en el rendimiento ajustado al riesgo, no significa necesariamente que el precio de XRP vaya a seguir cayendo.
155
Verificado
Artículo
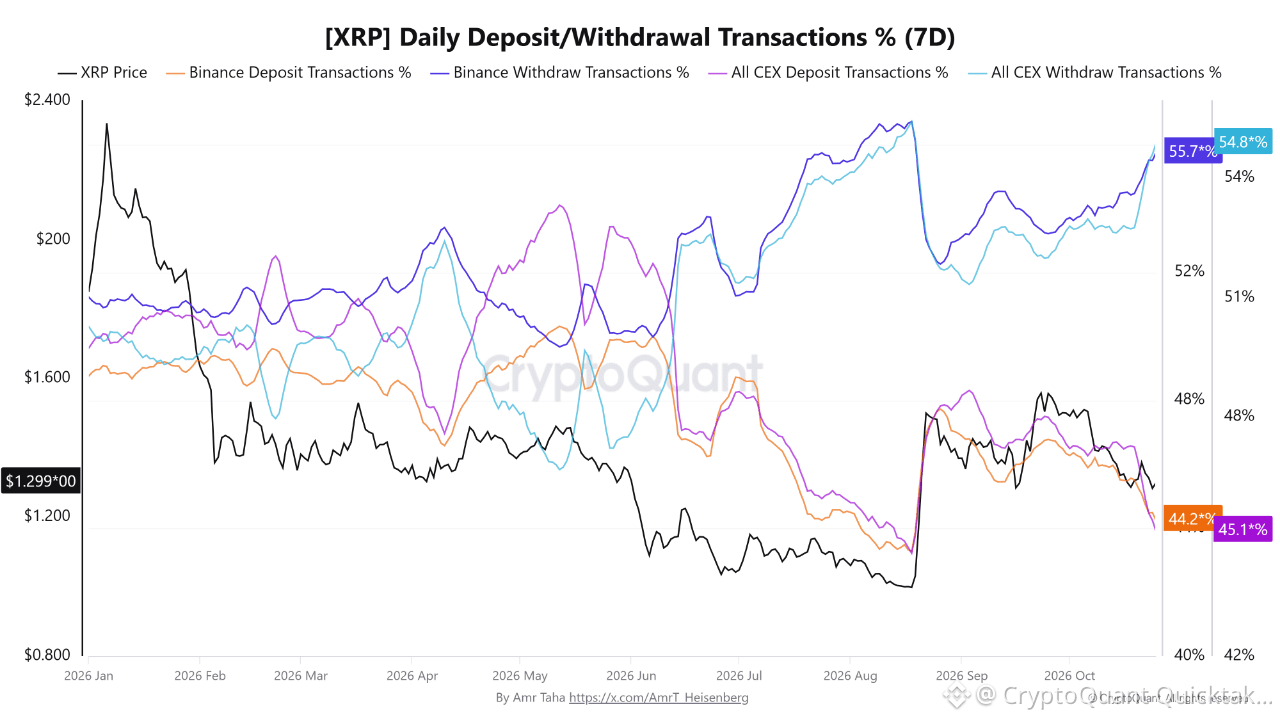
Antes de la decisión de la Fed, los retiros de XRP alcanzan su mayor proporción desde el 18 de agosto, mientras los depósitos se acercan a mínimosLa proporción de transacciones de retiro de XRP se acerca a sus máximos de agosto, mientras que la proporción de depósitos tanto en Binance como en todos los CEX se aproxima a sus niveles más bajos desde el 18 de agosto, justo antes de la decisión de la Reserva Federal sobre las tasas del 28 de octubre.
El 25 de octubre, los retiros representaron el 55,75 % de las transacciones de depósito/retiro de XRP en Binance y el 54,85 % en todos los CEX, apenas 1 y 0,55 puntos porcentuales por debajo de sus cifras del 18 de agosto: 56,75 % y 55,4 %, respectivamente.
En cambio, la proporción de depósitos de Binance cayó al 44,25 %, cerca del mínimo del 43,25 % registrado el 18 de agosto.
Antes de la decisión de la Fed, los retiros de XRP alcanzan su mayor proporción desde el 18 de agosto, mientras los depósitos se acercan a mínimos
La proporción de transacciones de retiro de XRP se acerca a sus máximos de agosto, mientras que la proporción de depósitos tanto en Binance como en todos los CEX se aproxima a sus niveles más bajos desde el 18 de agosto, justo antes de la decisión de la Reserva Federal sobre las tasas del 28 de octubre.
El 25 de octubre, los retiros representaron el 55,75 % de las transacciones de depósito/retiro de XRP en Binance y el 54,85 % en todos los CEX, apenas 1 y 0,55 puntos porcentuales por debajo de sus cifras del 18 de agosto: 56,75 % y 55,4 %, respectivamente.
En cambio, la proporción de depósitos de Binance cayó al 44,25 %, cerca del mínimo del 43,25 % registrado el 18 de agosto.
El 25 de octubre, los retiros representaron el 55,75 % de las transacciones de depósito/retiro de XRP en Binance y el 54,85 % en todos los CEX, apenas 1 y 0,55 puntos porcentuales por debajo de sus cifras del 18 de agosto: 56,75 % y 55,4 %, respectivamente.
En cambio, la proporción de depósitos de Binance cayó al 44,25 %, cerca del mínimo del 43,25 % registrado el 18 de agosto.
194
Artículo
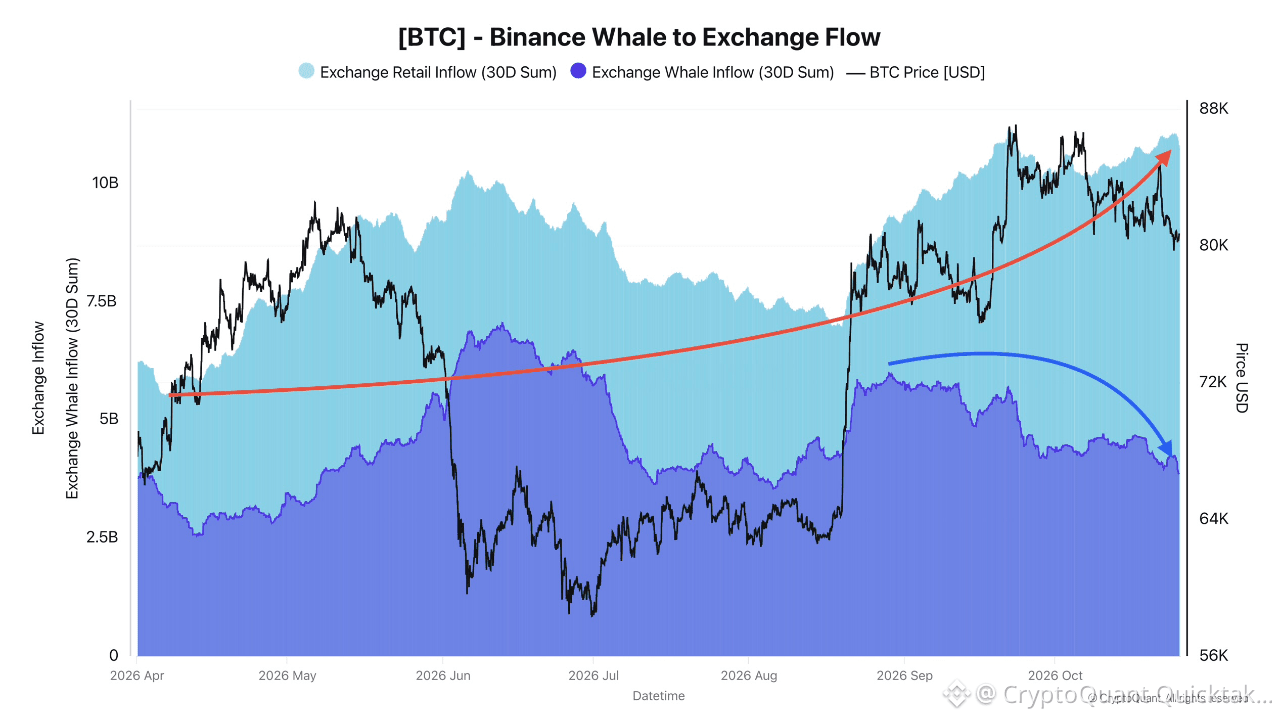
Las entradas de inversores minoristas alcanzan su máximo en 6 meses mientras BTC se mantiene en 80 000 $El análisis de los flujos de BTC muestra que las ballenas y los inversores minoristas están actuando de maneras radicalmente opuestas en este momento.
Esto no es nuevo: se sabe que los inversores minoristas son más emocionales, más inestables y reaccionan más a los movimientos del mercado que las ballenas. Pero la brecha que vemos hoy es particularmente amplia.
En el segmento minorista, las entradas están aumentando con fuerza en Binance. Con Bitcoin manteniéndose por encima de los 80 000 $ desde hace varias semanas, los depósitos de los pequeños inversores han alcanzado su nivel más alto en 6 meses. En términos de suma de 30 días, han pasado de 5,5 mil millones de dólares a 10,75 mil millones, casi duplicándose en muy poco tiempo.
Las entradas de inversores minoristas alcanzan su máximo en 6 meses mientras BTC se mantiene en 80 000 $
El análisis de los flujos de BTC muestra que las ballenas y los inversores minoristas están actuando de maneras radicalmente opuestas en este momento.
Esto no es nuevo: se sabe que los inversores minoristas son más emocionales, más inestables y reaccionan más a los movimientos del mercado que las ballenas. Pero la brecha que vemos hoy es particularmente amplia.
En el segmento minorista, las entradas están aumentando con fuerza en Binance. Con Bitcoin manteniéndose por encima de los 80 000 $ desde hace varias semanas, los depósitos de los pequeños inversores han alcanzado su nivel más alto en 6 meses. En términos de suma de 30 días, han pasado de 5,5 mil millones de dólares a 10,75 mil millones, casi duplicándose en muy poco tiempo.
Esto no es nuevo: se sabe que los inversores minoristas son más emocionales, más inestables y reaccionan más a los movimientos del mercado que las ballenas. Pero la brecha que vemos hoy es particularmente amplia.
En el segmento minorista, las entradas están aumentando con fuerza en Binance. Con Bitcoin manteniéndose por encima de los 80 000 $ desde hace varias semanas, los depósitos de los pequeños inversores han alcanzado su nivel más alto en 6 meses. En términos de suma de 30 días, han pasado de 5,5 mil millones de dólares a 10,75 mil millones, casi duplicándose en muy poco tiempo.
1
341
Artículo
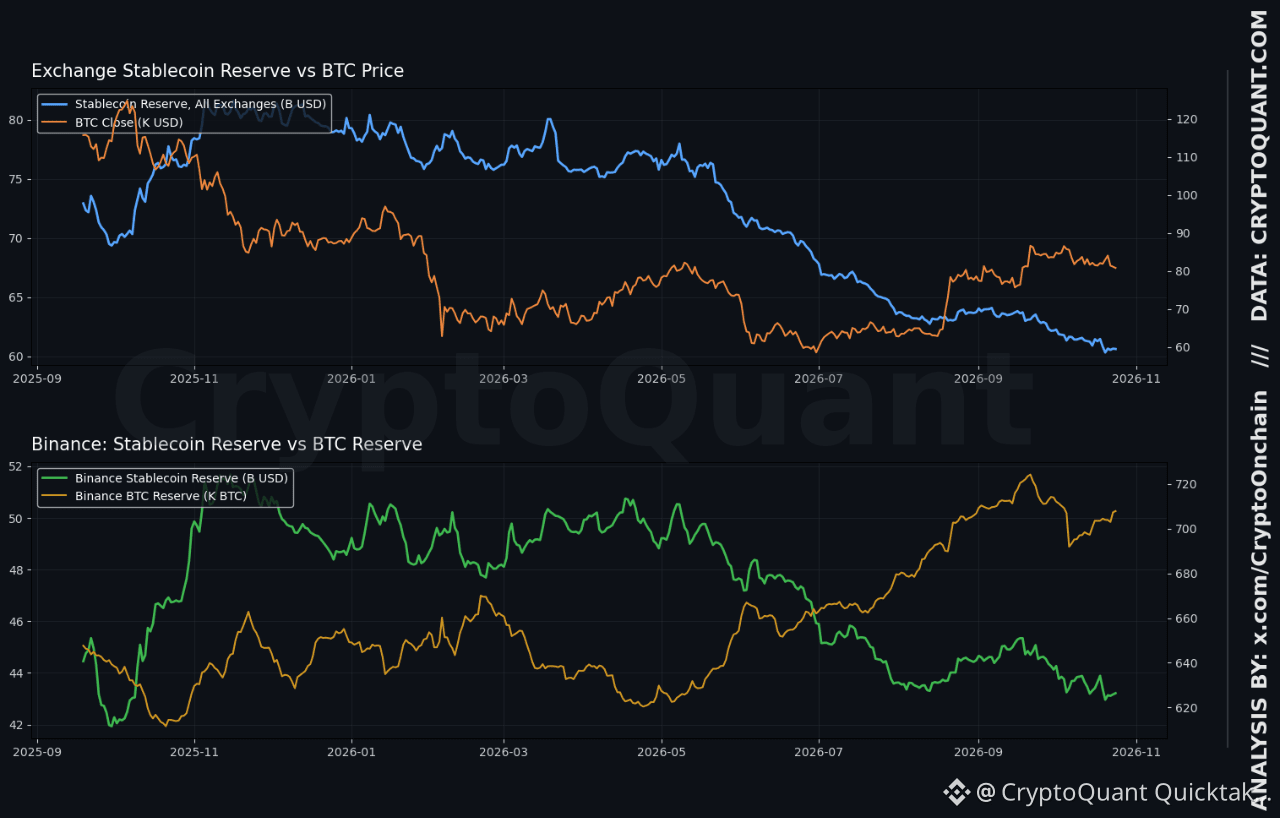
Reservas de stablecoins en exchanges en 60.6B, mínimo de 12 mesesLas reservas de stablecoins en todos los exchanges eran de 60.62B el 24 de octubre, en el percentil 1 del último año.
Las reservas de stablecoins de Binance eran de 43.21B el 24 de octubre, en el percentil 2.
BTC cerró en 80.8K el 24 de octubre, en el percentil 66 del último año.
Notas de datos: 50 columnas estaban obsoletas y se excluyeron, y el módulo macro no se cargó. No se publicaron las métricas con denominadores bajos.
Contexto macro: [Insertar aquí el evento de IPC/IPP/tasas/DXY de esta semana. El módulo macro falló, así que no se verificó.]
Observación → Contexto: El flujo neto de stablecoins en todos los exchanges fue de -34.2M el 24 de octubre, y el promedio de 7 días fue de -93.9M. El flujo neto de stablecoins en Binance fue de +48.2M durante el día, frente a un promedio de 7 días de -61.2M. La reserva de BTC de Binance era de 707.9K, en el percentil 88, mientras que la de Coinbase era de 848.1K, en el percentil 4. El índice Coinbase Premium fue de -0.1465, en el percentil 13.
Reservas de stablecoins en exchanges en 60.6B, mínimo de 12 meses
Las reservas de stablecoins en todos los exchanges eran de 60.62B el 24 de octubre, en el percentil 1 del último año.
Las reservas de stablecoins de Binance eran de 43.21B el 24 de octubre, en el percentil 2.
BTC cerró en 80.8K el 24 de octubre, en el percentil 66 del último año.
Notas de datos: 50 columnas estaban obsoletas y se excluyeron, y el módulo macro no se cargó. No se publicaron las métricas con denominadores bajos.
Contexto macro: [Insertar aquí el evento de IPC/IPP/tasas/DXY de esta semana. El módulo macro falló, así que no se verificó.]
Observación → Contexto: El flujo neto de stablecoins en todos los exchanges fue de -34.2M el 24 de octubre, y el promedio de 7 días fue de -93.9M. El flujo neto de stablecoins en Binance fue de +48.2M durante el día, frente a un promedio de 7 días de -61.2M. La reserva de BTC de Binance era de 707.9K, en el percentil 88, mientras que la de Coinbase era de 848.1K, en el percentil 4. El índice Coinbase Premium fue de -0.1465, en el percentil 13.
Las reservas de stablecoins de Binance eran de 43.21B el 24 de octubre, en el percentil 2.
BTC cerró en 80.8K el 24 de octubre, en el percentil 66 del último año.
Notas de datos: 50 columnas estaban obsoletas y se excluyeron, y el módulo macro no se cargó. No se publicaron las métricas con denominadores bajos.
Contexto macro: [Insertar aquí el evento de IPC/IPP/tasas/DXY de esta semana. El módulo macro falló, así que no se verificó.]
Observación → Contexto: El flujo neto de stablecoins en todos los exchanges fue de -34.2M el 24 de octubre, y el promedio de 7 días fue de -93.9M. El flujo neto de stablecoins en Binance fue de +48.2M durante el día, frente a un promedio de 7 días de -61.2M. La reserva de BTC de Binance era de 707.9K, en el percentil 88, mientras que la de Coinbase era de 848.1K, en el percentil 4. El índice Coinbase Premium fue de -0.1465, en el percentil 13.
1
224
Artículo
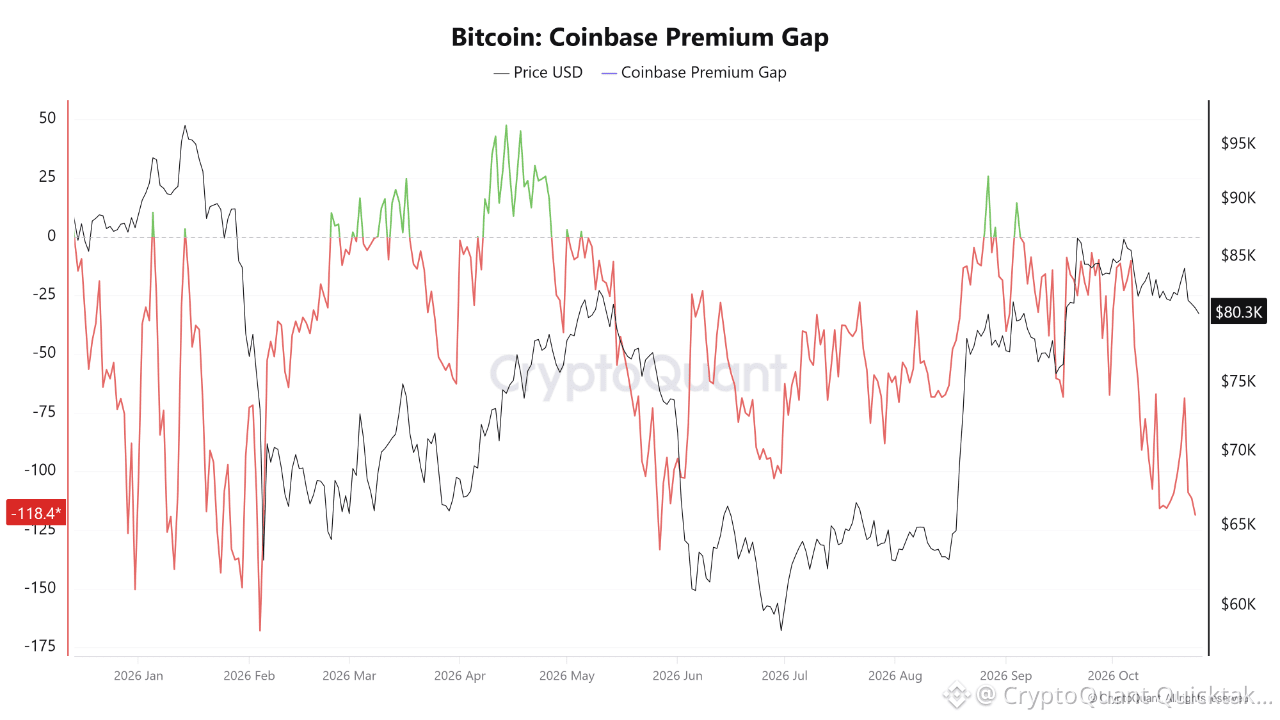
La brecha Coinbase Premium Gap de Bitcoin cae a su nivel más bajo en cinco meses, señal de una menor demanda en EE. UU.El indicador Coinbase Premium Gap registró un valor negativo de -$118.49, coincidiendo con una cotización de Bitcoin de aproximadamente $80,000, su nivel más bajo en cinco meses. Esta lectura refleja un precio de Bitcoin más bajo en Coinbase que en Binance, lo que indica una brecha de precios negativa cada vez mayor entre ambos exchanges.
El indicador mide la diferencia absoluta de precio entre un activo en Coinbase Pro, donde se negocia frente al dólar estadounidense (USD), y su precio en Binance, donde se negocia frente a la stablecoin USDT. Expresa esta diferencia en dólares, no como porcentaje. Cuando la lectura es positiva y la brecha se amplía, Bitcoin cotiza más alto en Coinbase que en Binance, lo que podría reflejar una mayor demanda relativa por parte de los participantes del mercado con sede en EE. UU., incluidos inversores institucionales y operadores que utilizan mercados denominados en USD.
La brecha Coinbase Premium Gap de Bitcoin cae a su nivel más bajo en cinco meses, señal de una menor demanda en EE. UU.
El indicador Coinbase Premium Gap registró un valor negativo de -$118.49, coincidiendo con una cotización de Bitcoin de aproximadamente $80,000, su nivel más bajo en cinco meses. Esta lectura refleja un precio de Bitcoin más bajo en Coinbase que en Binance, lo que indica una brecha de precios negativa cada vez mayor entre ambos exchanges.
El indicador mide la diferencia absoluta de precio entre un activo en Coinbase Pro, donde se negocia frente al dólar estadounidense (USD), y su precio en Binance, donde se negocia frente a la stablecoin USDT. Expresa esta diferencia en dólares, no como porcentaje. Cuando la lectura es positiva y la brecha se amplía, Bitcoin cotiza más alto en Coinbase que en Binance, lo que podría reflejar una mayor demanda relativa por parte de los participantes del mercado con sede en EE. UU., incluidos inversores institucionales y operadores que utilizan mercados denominados en USD.
El indicador mide la diferencia absoluta de precio entre un activo en Coinbase Pro, donde se negocia frente al dólar estadounidense (USD), y su precio en Binance, donde se negocia frente a la stablecoin USDT. Expresa esta diferencia en dólares, no como porcentaje. Cuando la lectura es positiva y la brecha se amplía, Bitcoin cotiza más alto en Coinbase que en Binance, lo que podría reflejar una mayor demanda relativa por parte de los participantes del mercado con sede en EE. UU., incluidos inversores institucionales y operadores que utilizan mercados denominados en USD.
1
141
Artículo
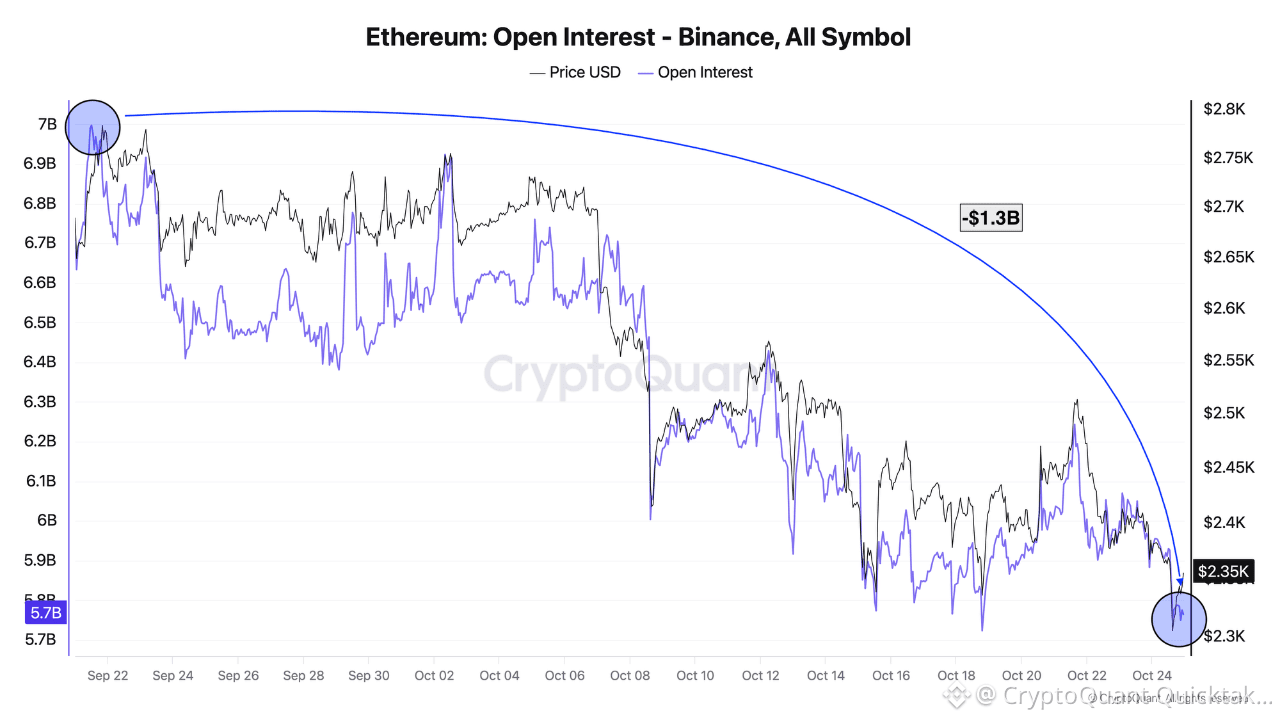
Ethereum pierde 54.000 millones de dólares en capitalización de mercado mientras el interés abierto cae a 11.500 millonesEn las últimas tres semanas, las altcoins, y Ethereum en particular, han registrado un rendimiento mayormente negativo. ETH ha corregido alrededor de un 15 % durante este período, lo que supone una pérdida de 54.000 millones de dólares en capitalización de mercado.
Esta tendencia es especialmente visible en los derivados: el interés abierto de ETH en Binance ha perdido 1.300 millones de dólares en un mes, casi un 20 %, y ha vuelto a situarse en 5.700 millones de dólares.
En todos los exchanges, el interés abierto total ha caído hasta los 11.500 millones de dólares. En un período de 30 días, otras plataformas también han registrado fuertes caídas: Gate, 995 millones de dólares; HTX, 857 millones; y Bybit, 310 millones.
Ethereum pierde 54.000 millones de dólares en capitalización de mercado mientras el interés abierto cae a 11.500 millones
En las últimas tres semanas, las altcoins, y Ethereum en particular, han registrado un rendimiento mayormente negativo. ETH ha corregido alrededor de un 15 % durante este período, lo que supone una pérdida de 54.000 millones de dólares en capitalización de mercado.
Esta tendencia es especialmente visible en los derivados: el interés abierto de ETH en Binance ha perdido 1.300 millones de dólares en un mes, casi un 20 %, y ha vuelto a situarse en 5.700 millones de dólares.
En todos los exchanges, el interés abierto total ha caído hasta los 11.500 millones de dólares. En un período de 30 días, otras plataformas también han registrado fuertes caídas: Gate, 995 millones de dólares; HTX, 857 millones; y Bybit, 310 millones.
Esta tendencia es especialmente visible en los derivados: el interés abierto de ETH en Binance ha perdido 1.300 millones de dólares en un mes, casi un 20 %, y ha vuelto a situarse en 5.700 millones de dólares.
En todos los exchanges, el interés abierto total ha caído hasta los 11.500 millones de dólares. En un período de 30 días, otras plataformas también han registrado fuertes caídas: Gate, 995 millones de dólares; HTX, 857 millones; y Bybit, 310 millones.
1
162
Artículo
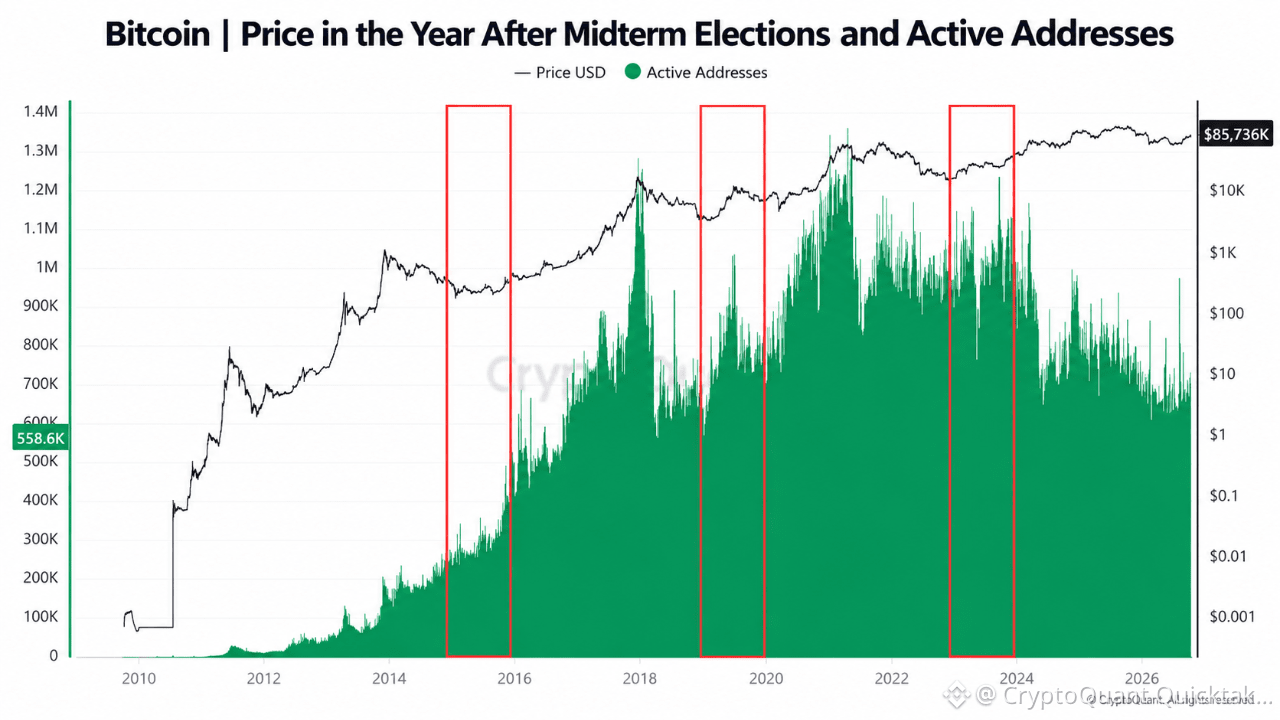
Elecciones de mitad de mandato de EE. UU. en 9 días: ¿Qué pasará con Bitcoin? Encuestas y la batalla por los 80.000 dólaresLas elecciones de mitad de mandato de EE. UU. están previstas para el 3 de noviembre, dentro de apenas nueve días. Se disputarán los 435 escaños de la Cámara de Representantes y 35 del Senado. Los resultados podrían redefinir los dos últimos años del mandato del presidente Trump e influir en los mercados financieros.
Una encuesta de Reuters/Ipsos realizada en octubre mostró que los demócratas aventajaban a los republicanos en las preferencias de voto para el Congreso, con un 47% frente a un 35%, mientras que la aprobación de Trump se situaba en el 31%. Sin embargo, las encuestas nacionales no predicen directamente cuántos escaños se ganarán en cada distrito.
La regulación de las criptomonedas es otro tema. El avance de la Ley CLARITY se estancó en el Senado en septiembre. El nuevo Congreso podría influir en el ritmo y el contenido de la legislación sobre activos digitales, independientemente del partido que lo controle.
Elecciones de mitad de mandato de EE. UU. en 9 días: ¿Qué pasará con Bitcoin? Encuestas y la batalla por los 80.000 dólares
Las elecciones de mitad de mandato de EE. UU. están previstas para el 3 de noviembre, dentro de apenas nueve días. Se disputarán los 435 escaños de la Cámara de Representantes y 35 del Senado. Los resultados podrían redefinir los dos últimos años del mandato del presidente Trump e influir en los mercados financieros.
Una encuesta de Reuters/Ipsos realizada en octubre mostró que los demócratas aventajaban a los republicanos en las preferencias de voto para el Congreso, con un 47% frente a un 35%, mientras que la aprobación de Trump se situaba en el 31%. Sin embargo, las encuestas nacionales no predicen directamente cuántos escaños se ganarán en cada distrito.
La regulación de las criptomonedas es otro tema. El avance de la Ley CLARITY se estancó en el Senado en septiembre. El nuevo Congreso podría influir en el ritmo y el contenido de la legislación sobre activos digitales, independientemente del partido que lo controle.
Una encuesta de Reuters/Ipsos realizada en octubre mostró que los demócratas aventajaban a los republicanos en las preferencias de voto para el Congreso, con un 47% frente a un 35%, mientras que la aprobación de Trump se situaba en el 31%. Sin embargo, las encuestas nacionales no predicen directamente cuántos escaños se ganarán en cada distrito.
La regulación de las criptomonedas es otro tema. El avance de la Ley CLARITY se estancó en el Senado en septiembre. El nuevo Congreso podría influir en el ritmo y el contenido de la legislación sobre activos digitales, independientemente del partido que lo controle.
290
Artículo
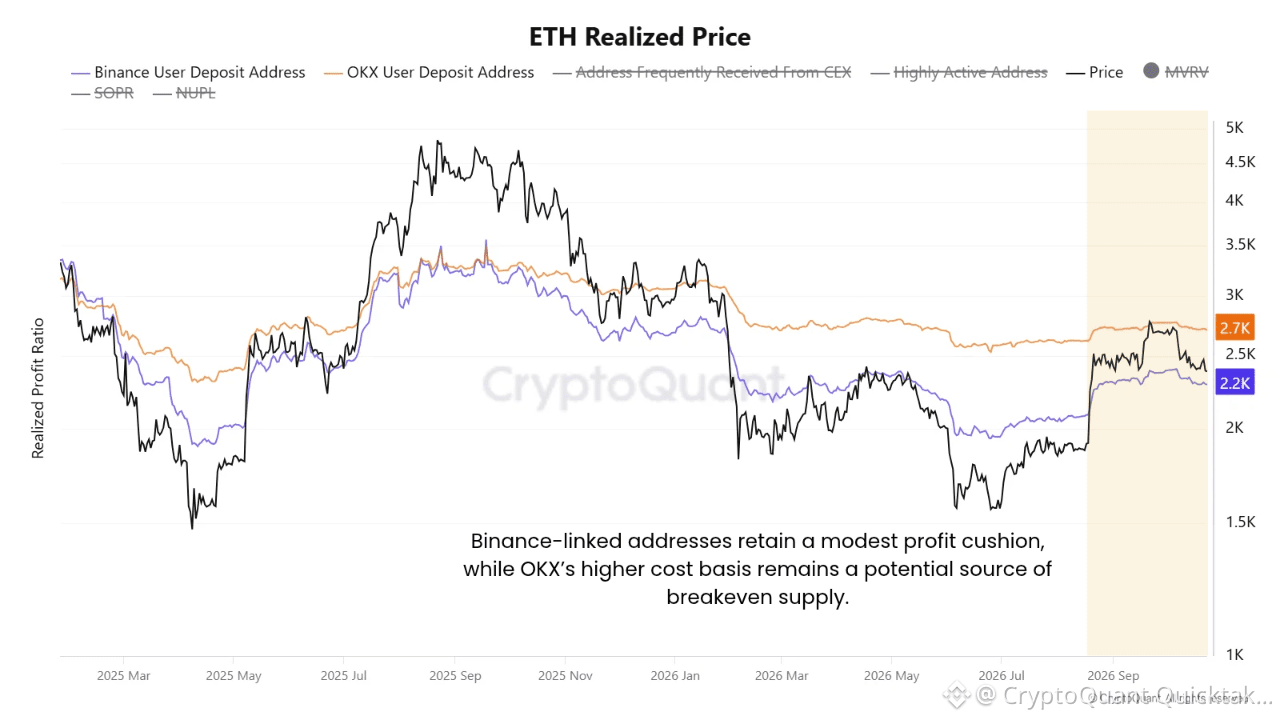
ETH entre el margen de ganancias de Binance y la posible oferta de salida de OKXLa recuperación de Ethereum ha restablecido la rentabilidad de forma desigual entre los grupos vinculados a exchanges, dejando el precio entre dos niveles distintos de costo base.
El precio realizado de las direcciones de depósito de usuarios de Binance se sitúa cerca de los $2,200, frente a los aproximadamente $2,700 de OKX. Con ETH cotizando alrededor de $2,350–$2,400 en el gráfico, el grupo vinculado a Binance conserva un modesto margen de ganancias agregado, mientras que el grupo vinculado a OKX sigue en pérdidas.
Esta brecha de $500 revela distintos incentivos detrás de un mismo movimiento de precios. Una caída hacia los $2,200 erosionaría la rentabilidad restante del grupo vinculado a Binance. Una recuperación hacia los $2,700 acercaría al grupo vinculado a OKX al punto de equilibrio y podría dar a los titulares la oportunidad de reducir su exposición tras pasar un tiempo en pérdidas.
ETH entre el margen de ganancias de Binance y la posible oferta de salida de OKX
La recuperación de Ethereum ha restablecido la rentabilidad de forma desigual entre los grupos vinculados a exchanges, dejando el precio entre dos niveles distintos de costo base.
El precio realizado de las direcciones de depósito de usuarios de Binance se sitúa cerca de los $2,200, frente a los aproximadamente $2,700 de OKX. Con ETH cotizando alrededor de $2,350–$2,400 en el gráfico, el grupo vinculado a Binance conserva un modesto margen de ganancias agregado, mientras que el grupo vinculado a OKX sigue en pérdidas.
Esta brecha de $500 revela distintos incentivos detrás de un mismo movimiento de precios. Una caída hacia los $2,200 erosionaría la rentabilidad restante del grupo vinculado a Binance. Una recuperación hacia los $2,700 acercaría al grupo vinculado a OKX al punto de equilibrio y podría dar a los titulares la oportunidad de reducir su exposición tras pasar un tiempo en pérdidas.
El precio realizado de las direcciones de depósito de usuarios de Binance se sitúa cerca de los $2,200, frente a los aproximadamente $2,700 de OKX. Con ETH cotizando alrededor de $2,350–$2,400 en el gráfico, el grupo vinculado a Binance conserva un modesto margen de ganancias agregado, mientras que el grupo vinculado a OKX sigue en pérdidas.
Esta brecha de $500 revela distintos incentivos detrás de un mismo movimiento de precios. Una caída hacia los $2,200 erosionaría la rentabilidad restante del grupo vinculado a Binance. Una recuperación hacia los $2,700 acercaría al grupo vinculado a OKX al punto de equilibrio y podría dar a los titulares la oportunidad de reducir su exposición tras pasar un tiempo en pérdidas.
1
1.3k
Artículo
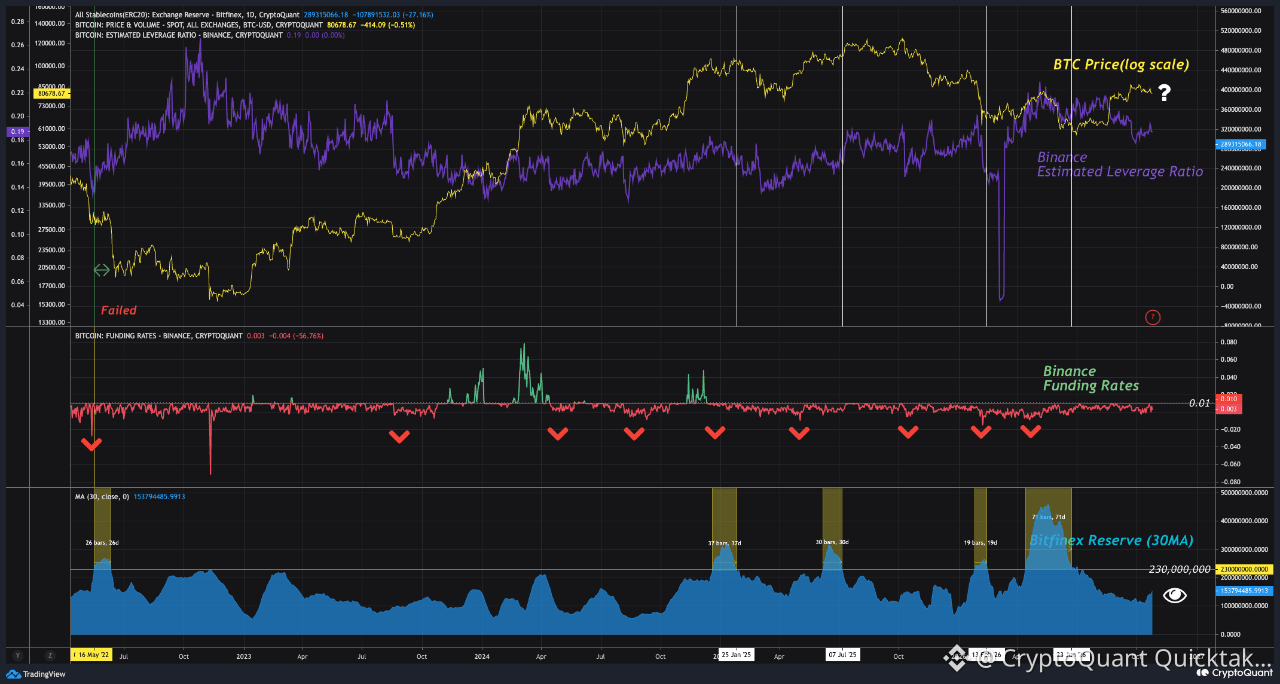
Reservas de Bitfinex deprimidas: ¿prolongación de la tendencia o falta de convicción?Las reservas de stablecoins en Bitfinex siguen deprimidas, muy por debajo de los umbrales críticos del pasado, lo que apunta a un entorno en el que la participación activa del mercado se ha desvanecido silenciosamente. Con los niveles de apalancamiento mayormente contenidos y las tasas de financiación cerca de la neutralidad, la acción del precio carece de la espuma especulativa que suele observarse en los principales puntos de agotamiento del ciclo. Esta ausencia de un interés minorista agresivo sugiere que la tendencia general quizá aún tenga margen para seguir avanzando, aunque en un mercado tan vacío cualquier cambio repentino en la liquidez podría provocar fácilmente movimientos erráticos antes de que surja una dirección clara.
Reservas de Bitfinex deprimidas: ¿prolongación de la tendencia o falta de convicción?
Las reservas de stablecoins en Bitfinex siguen deprimidas, muy por debajo de los umbrales críticos del pasado, lo que apunta a un entorno en el que la participación activa del mercado se ha desvanecido silenciosamente. Con los niveles de apalancamiento mayormente contenidos y las tasas de financiación cerca de la neutralidad, la acción del precio carece de la espuma especulativa que suele observarse en los principales puntos de agotamiento del ciclo. Esta ausencia de un interés minorista agresivo sugiere que la tendencia general quizá aún tenga margen para seguir avanzando, aunque en un mercado tan vacío cualquier cambio repentino en la liquidez podría provocar fácilmente movimientos erráticos antes de que surja una dirección clara.
270
Artículo
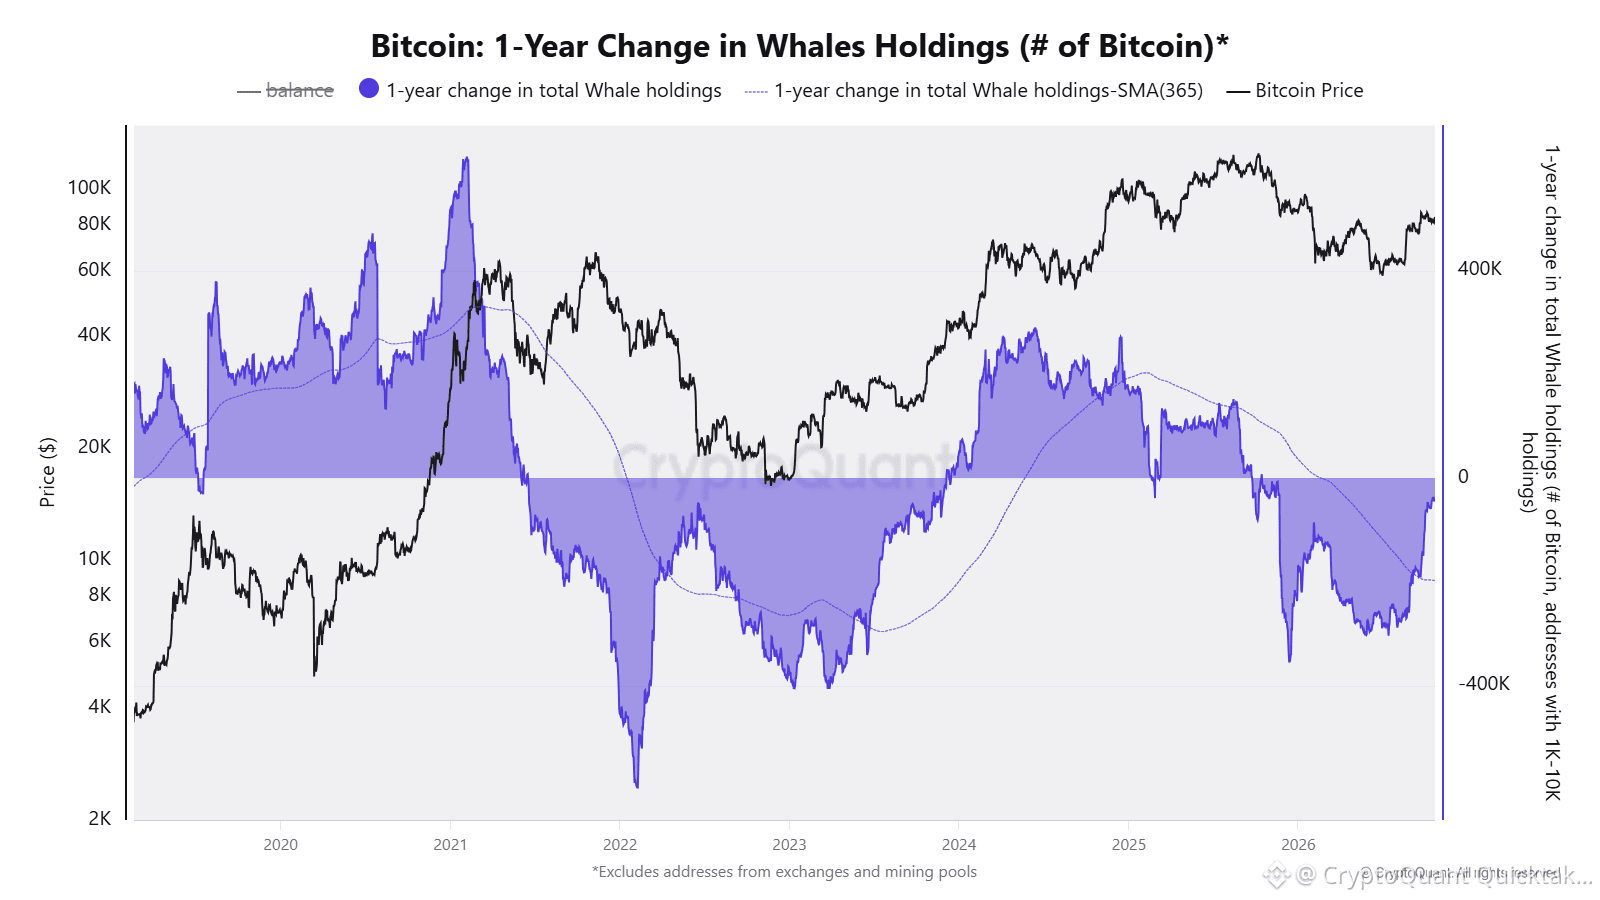
Las ballenas de Bitcoin terminaron de vender en julio y ahora están aumentando rápidamente sus tenencias.El indicador de variación interanual de las tenencias de $BTC de las ballenas se acerca a terreno positivo.
La acumulación de las ballenas se está acelerando y la variación interanual de sus tenencias se aproxima a un cambio hacia terreno positivo.
La presión vendedora de las ballenas terminó en julio, y la variación de sus tenencias de $BTC ha subido rápidamente de -282 mil al nivel actual de -39 mil.
En menos de tres meses, las ballenas de $BTC han realizado compras netas de 243 mil $BTC.
Escrito por CW8900
Las ballenas de Bitcoin terminaron de vender en julio y ahora están aumentando rápidamente sus tenencias.
El indicador de variación interanual de las tenencias de $BTC de las ballenas se acerca a terreno positivo.
La acumulación de las ballenas se está acelerando y la variación interanual de sus tenencias se aproxima a un cambio hacia terreno positivo.
La presión vendedora de las ballenas terminó en julio, y la variación de sus tenencias de $BTC ha subido rápidamente de -282 mil al nivel actual de -39 mil.
En menos de tres meses, las ballenas de $BTC han realizado compras netas de 243 mil $BTC.
Escrito por CW8900
La acumulación de las ballenas se está acelerando y la variación interanual de sus tenencias se aproxima a un cambio hacia terreno positivo.
La presión vendedora de las ballenas terminó en julio, y la variación de sus tenencias de $BTC ha subido rápidamente de -282 mil al nivel actual de -39 mil.
En menos de tres meses, las ballenas de $BTC han realizado compras netas de 243 mil $BTC.
Escrito por CW8900
1
313
Artículo
Bitcoin por debajo de los 80.000 $: niveles bajistas y escenarios de rebote según CryptoQuantEl nivel de los 80.000 $ de Bitcoin es una prueba clave en medio del aumento de los rendimientos en EE. UU., los precios del petróleo y la incertidumbre sobre la Fed. Sin embargo, lo que más importa es quién compra y quién vende si BTC lo supera.
El informe de CryptoQuant del 13 de octubre situó la media móvil de 365 días cerca de los 80.000 $ y la media de 200 días alrededor de los 71.000 $. Su Índice Bull Score se ubicó en 80, lo que indica que persistían las señales alcistas.
Escenario 1 — Ruptura breve y posterior rebote.
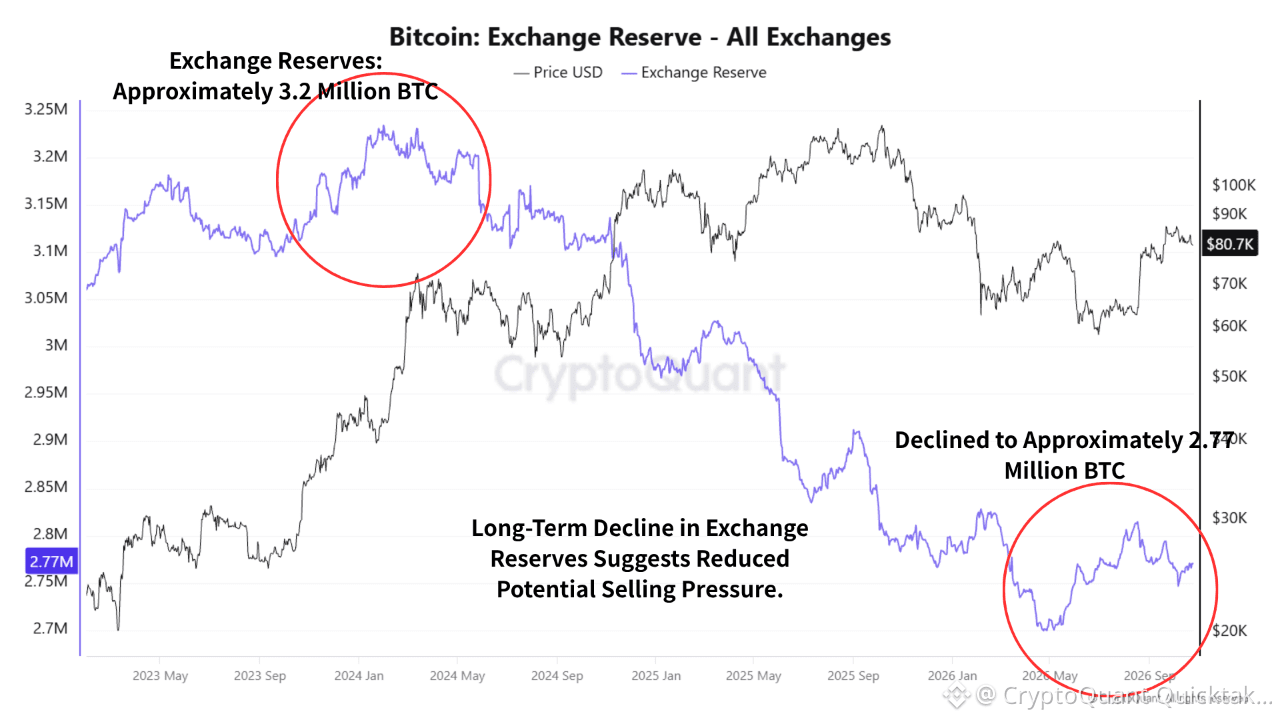
Las reservas en exchanges han disminuido con el tiempo, lo que sugiere que hay menos BTC fácilmente disponibles para la venta. Algunas ballenas han acumulado. Si se liquidan las posiciones largas apalancadas, pero se mantiene la demanda al contado, BTC podría recuperar los 80.000 $ y poner a prueba los 83.000–85.000 $.
Bitcoin por debajo de los 80.000 $: niveles bajistas y escenarios de rebote según CryptoQuant
El nivel de los 80.000 $ de Bitcoin es una prueba clave en medio del aumento de los rendimientos en EE. UU., los precios del petróleo y la incertidumbre sobre la Fed. Sin embargo, lo que más importa es quién compra y quién vende si BTC lo supera.
El informe de CryptoQuant del 13 de octubre situó la media móvil de 365 días cerca de los 80.000 $ y la media de 200 días alrededor de los 71.000 $. Su Índice Bull Score se ubicó en 80, lo que indica que persistían las señales alcistas.
Escenario 1 — Ruptura breve y posterior rebote.
Las reservas en exchanges han disminuido con el tiempo, lo que sugiere que hay menos BTC fácilmente disponibles para la venta. Algunas ballenas han acumulado. Si se liquidan las posiciones largas apalancadas, pero se mantiene la demanda al contado, BTC podría recuperar los 80.000 $ y poner a prueba los 83.000–85.000 $.
El informe de CryptoQuant del 13 de octubre situó la media móvil de 365 días cerca de los 80.000 $ y la media de 200 días alrededor de los 71.000 $. Su Índice Bull Score se ubicó en 80, lo que indica que persistían las señales alcistas.
Escenario 1 — Ruptura breve y posterior rebote.
Las reservas en exchanges han disminuido con el tiempo, lo que sugiere que hay menos BTC fácilmente disponibles para la venta. Algunas ballenas han acumulado. Si se liquidan las posiciones largas apalancadas, pero se mantiene la demanda al contado, BTC podría recuperar los 80.000 $ y poner a prueba los 83.000–85.000 $.
1
436
Artículo
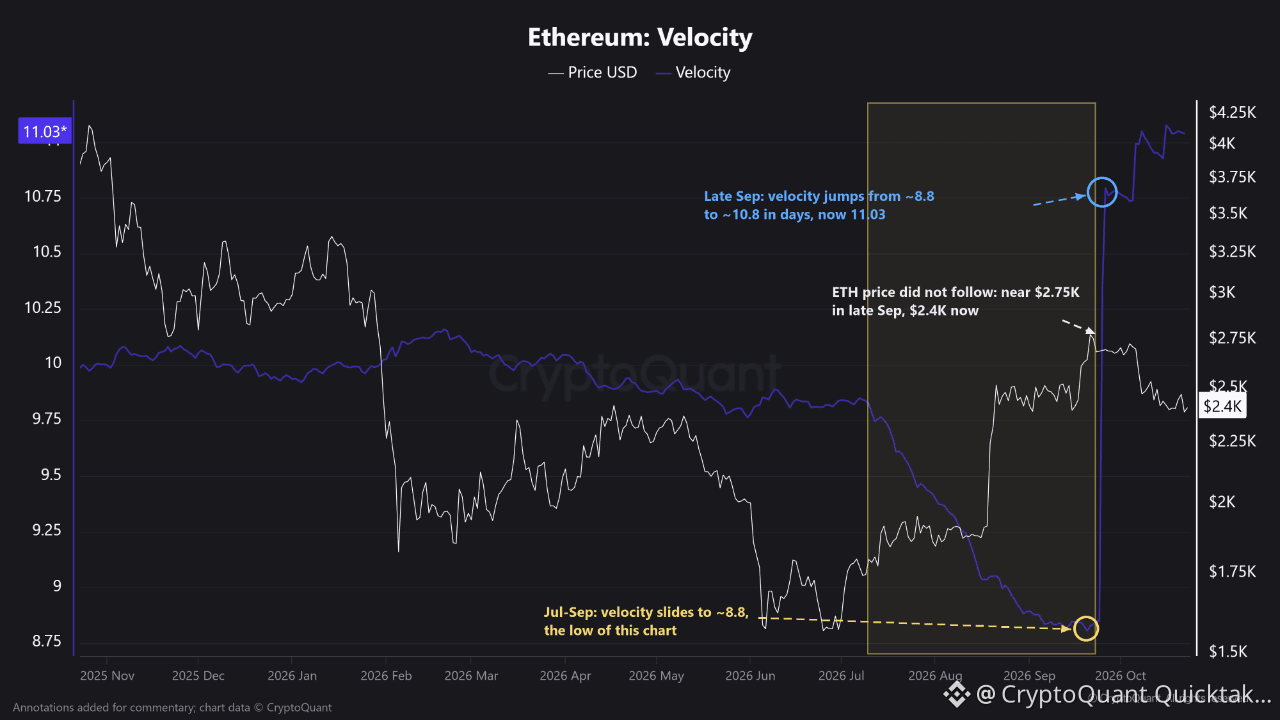
Velocidad de ETH: un cambio de nivel en la ventana de un año, sin continuidad en el precioLa velocidad de Ethereum (CryptoQuant, diaria) se calcula a partir del volumen de transferencias en cadena de ETH durante el último año, en relación con la oferta. Como el numerador es una suma móvil de un año, la métrica suele cambiar lentamente. Las variaciones diarias son pequeñas, ya que se añade cada día nuevo mientras que sale de la ventana el día de hace un año.
Por eso destaca el movimiento reciente.
- Noviembre de 2025 - mediados de julio de 2026: la velocidad se mantuvo entre aproximadamente 9,8 y 10,1.
- Mediados de julio - finales de septiembre: descenso constante hasta alrededor de 8,8, el mínimo del período. Los días más recientes registraron un volumen de transferencias mucho menor que los días que salían de la ventana.
Velocidad de ETH: un cambio de nivel en la ventana de un año, sin continuidad en el precio
La velocidad de Ethereum (CryptoQuant, diaria) se calcula a partir del volumen de transferencias en cadena de ETH durante el último año, en relación con la oferta. Como el numerador es una suma móvil de un año, la métrica suele cambiar lentamente. Las variaciones diarias son pequeñas, ya que se añade cada día nuevo mientras que sale de la ventana el día de hace un año.
Por eso destaca el movimiento reciente.
- Noviembre de 2025 - mediados de julio de 2026: la velocidad se mantuvo entre aproximadamente 9,8 y 10,1.
- Mediados de julio - finales de septiembre: descenso constante hasta alrededor de 8,8, el mínimo del período. Los días más recientes registraron un volumen de transferencias mucho menor que los días que salían de la ventana.
Por eso destaca el movimiento reciente.
- Noviembre de 2025 - mediados de julio de 2026: la velocidad se mantuvo entre aproximadamente 9,8 y 10,1.
- Mediados de julio - finales de septiembre: descenso constante hasta alrededor de 8,8, el mínimo del período. Los días más recientes registraron un volumen de transferencias mucho menor que los días que salían de la ventana.
187
Artículo
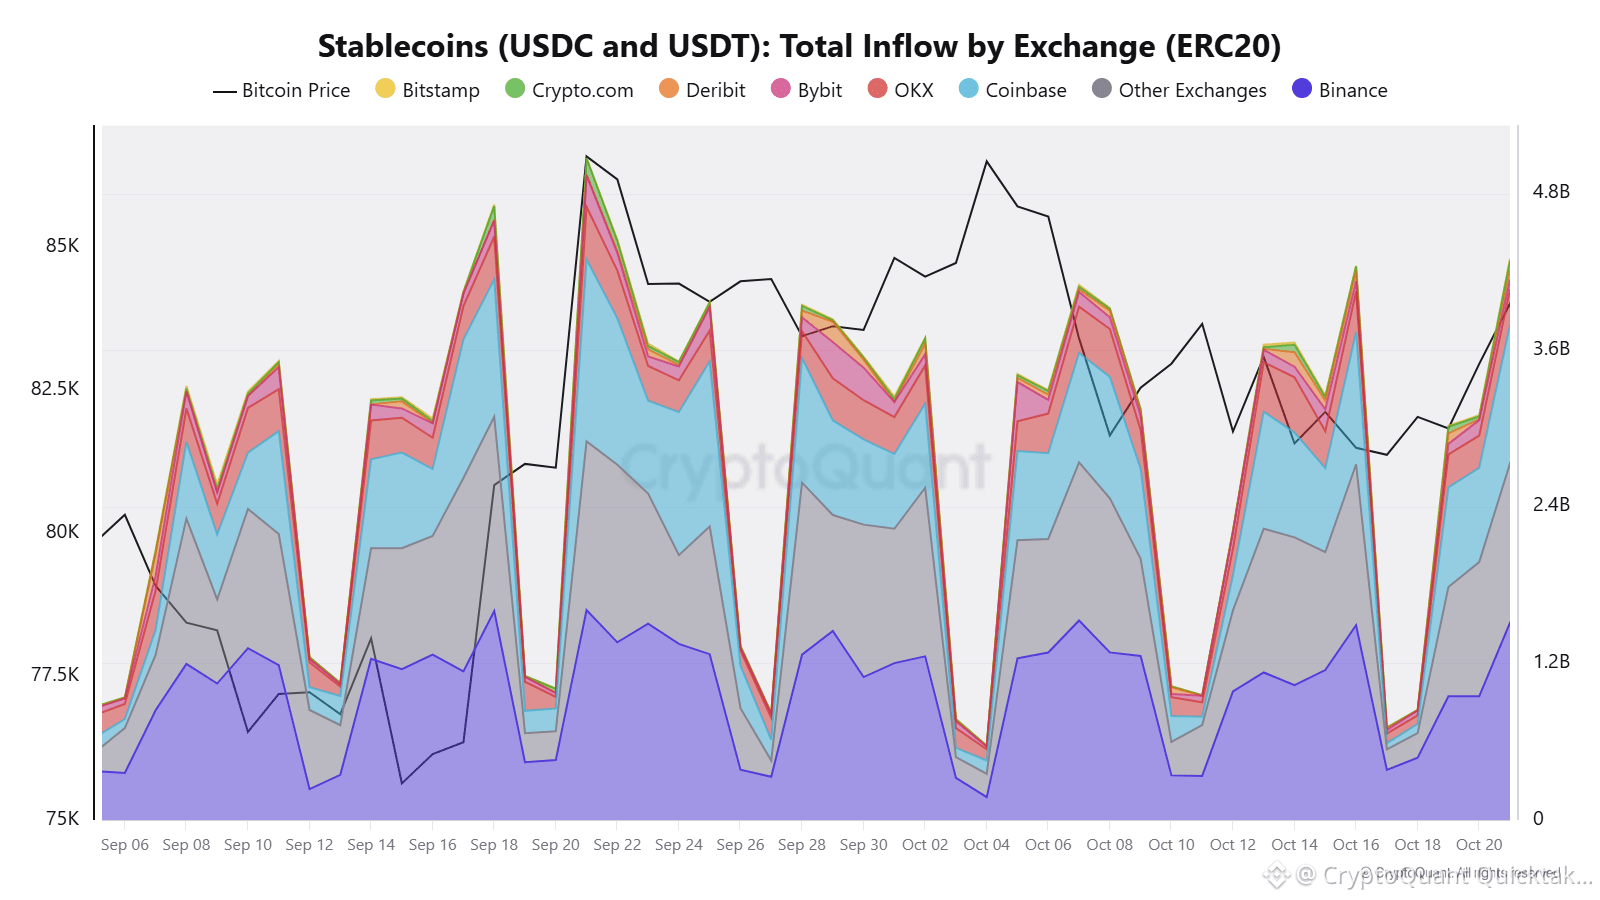
Las entradas de stablecoins a Binance se mantienen sólidas, y las entradas de fondos a otros exchanges también empiezan a repuntar...La entrada de stablecoins a los exchanges indica una entrada de fondos.
Por lo general, los períodos de impulso alcista del mercado van acompañados de un aumento significativo en las entradas de stablecoins.
A medida que $BTC subió del rango de 62.000 a 80.000 dólares, las entradas diarias de stablecoins a Binance alcanzaron los 1.600 millones de dólares. Durante el mismo período, las entradas de stablecoins a Coinbase también aumentaron hasta situarse entre 1.000 y 1.400 millones de dólares.
El aumento de $BTC se produjo junto con esta sólida entrada de fondos.
Sin embargo, después de eso, las entradas de stablecoins a otros exchanges cayeron significativamente. En cambio, Binance mantuvo una entrada promedio de 1,2 mil millones de dólares, destacándose como el único exchange que sostuvo un flujo sólido de fondos.
Las entradas de stablecoins a Binance se mantienen sólidas, y las entradas de fondos a otros exchanges también empiezan a repuntar...
La entrada de stablecoins a los exchanges indica una entrada de fondos.
Por lo general, los períodos de impulso alcista del mercado van acompañados de un aumento significativo en las entradas de stablecoins.
A medida que $BTC subió del rango de 62.000 a 80.000 dólares, las entradas diarias de stablecoins a Binance alcanzaron los 1.600 millones de dólares. Durante el mismo período, las entradas de stablecoins a Coinbase también aumentaron hasta situarse entre 1.000 y 1.400 millones de dólares.
El aumento de $BTC se produjo junto con esta sólida entrada de fondos.
Sin embargo, después de eso, las entradas de stablecoins a otros exchanges cayeron significativamente. En cambio, Binance mantuvo una entrada promedio de 1,2 mil millones de dólares, destacándose como el único exchange que sostuvo un flujo sólido de fondos.
Por lo general, los períodos de impulso alcista del mercado van acompañados de un aumento significativo en las entradas de stablecoins.
A medida que $BTC subió del rango de 62.000 a 80.000 dólares, las entradas diarias de stablecoins a Binance alcanzaron los 1.600 millones de dólares. Durante el mismo período, las entradas de stablecoins a Coinbase también aumentaron hasta situarse entre 1.000 y 1.400 millones de dólares.
El aumento de $BTC se produjo junto con esta sólida entrada de fondos.
Sin embargo, después de eso, las entradas de stablecoins a otros exchanges cayeron significativamente. En cambio, Binance mantuvo una entrada promedio de 1,2 mil millones de dólares, destacándose como el único exchange que sostuvo un flujo sólido de fondos.
1
135
Artículo
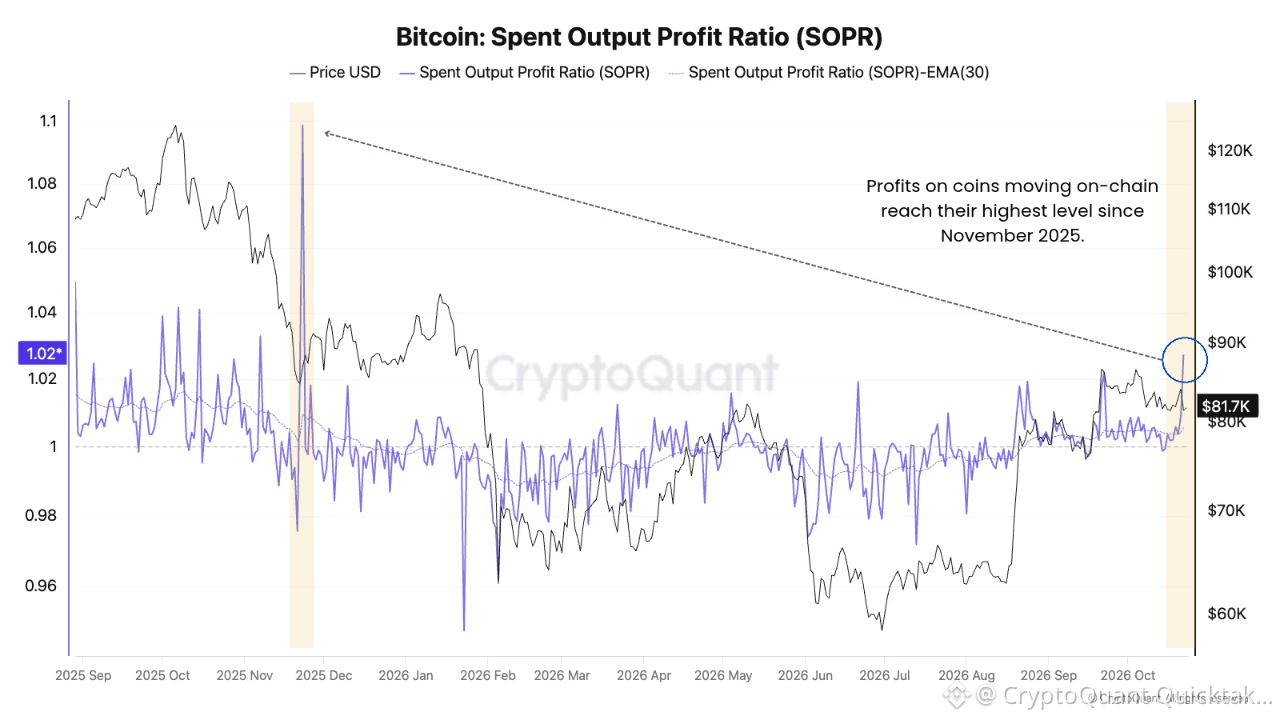
El aumento de las ganancias realizadas pone en el foco la recuperación de BitcoinEl SOPR de Bitcoin ha superado 1,02, lo que parece marcar su lectura más alta desde noviembre de 2025, durante la caída inicial desde el máximo histórico. El pico anterior fue considerablemente mayor, por lo que la comparación se refiere al momento y a lo inusual del fenómeno, no a una intensidad equivalente.
El SOPR compara el valor en USD de las monedas gastadas con su valor cuando se crearon sus salidas. Por encima de 1, esas monedas se mueven con ganancias agregadas. Una lectura cercana a 1,02 implica una ganancia de aproximadamente el 2 % con respecto a su base de costo registrada, no que el 2 % de los tenedores esté vendiendo.
El aumento de las ganancias realizadas pone en el foco la recuperación de Bitcoin
El SOPR de Bitcoin ha superado 1,02, lo que parece marcar su lectura más alta desde noviembre de 2025, durante la caída inicial desde el máximo histórico. El pico anterior fue considerablemente mayor, por lo que la comparación se refiere al momento y a lo inusual del fenómeno, no a una intensidad equivalente.
El SOPR compara el valor en USD de las monedas gastadas con su valor cuando se crearon sus salidas. Por encima de 1, esas monedas se mueven con ganancias agregadas. Una lectura cercana a 1,02 implica una ganancia de aproximadamente el 2 % con respecto a su base de costo registrada, no que el 2 % de los tenedores esté vendiendo.
El SOPR compara el valor en USD de las monedas gastadas con su valor cuando se crearon sus salidas. Por encima de 1, esas monedas se mueven con ganancias agregadas. Una lectura cercana a 1,02 implica una ganancia de aproximadamente el 2 % con respecto a su base de costo registrada, no que el 2 % de los tenedores esté vendiendo.
137
Inicia sesión para explorar más contenidos
Únete a usuarios globales de criptomonedas en Binance Square
⚡️ Obtén información útil y actualizada sobre criptos.
💬 Avalado por el mayor exchange de criptomonedas en el mundo.
👍 Descubre perspectivas reales de creadores verificados.
Email/número de teléfono
Temas populares
BinancePick
2.7M vistas
144,727 están debatiendo
¡Únete a #TemporadaDeResultados: predice resultados en Binance Pick y comparte tu opinión en Binance Square!
Binance Square Official
·402 me gusta
·339.6k vistas
EarningsSeason
5M vistas
24,804 están debatiendo
SouthKoreaReportedlyWeighsFourthCryptoTaxDelay
4,592 vistas
172 están debatiendo