

CLYTHERONIX 1
188 Publicaciones

CLYTHERONIX 1
Denunciar
Bloquear usuario
Smarter Plays, Sharper Insights 𓃦
0 Siguiendo
1 Seguidores
7 Me gusta
Publicaciones
Ver traducción
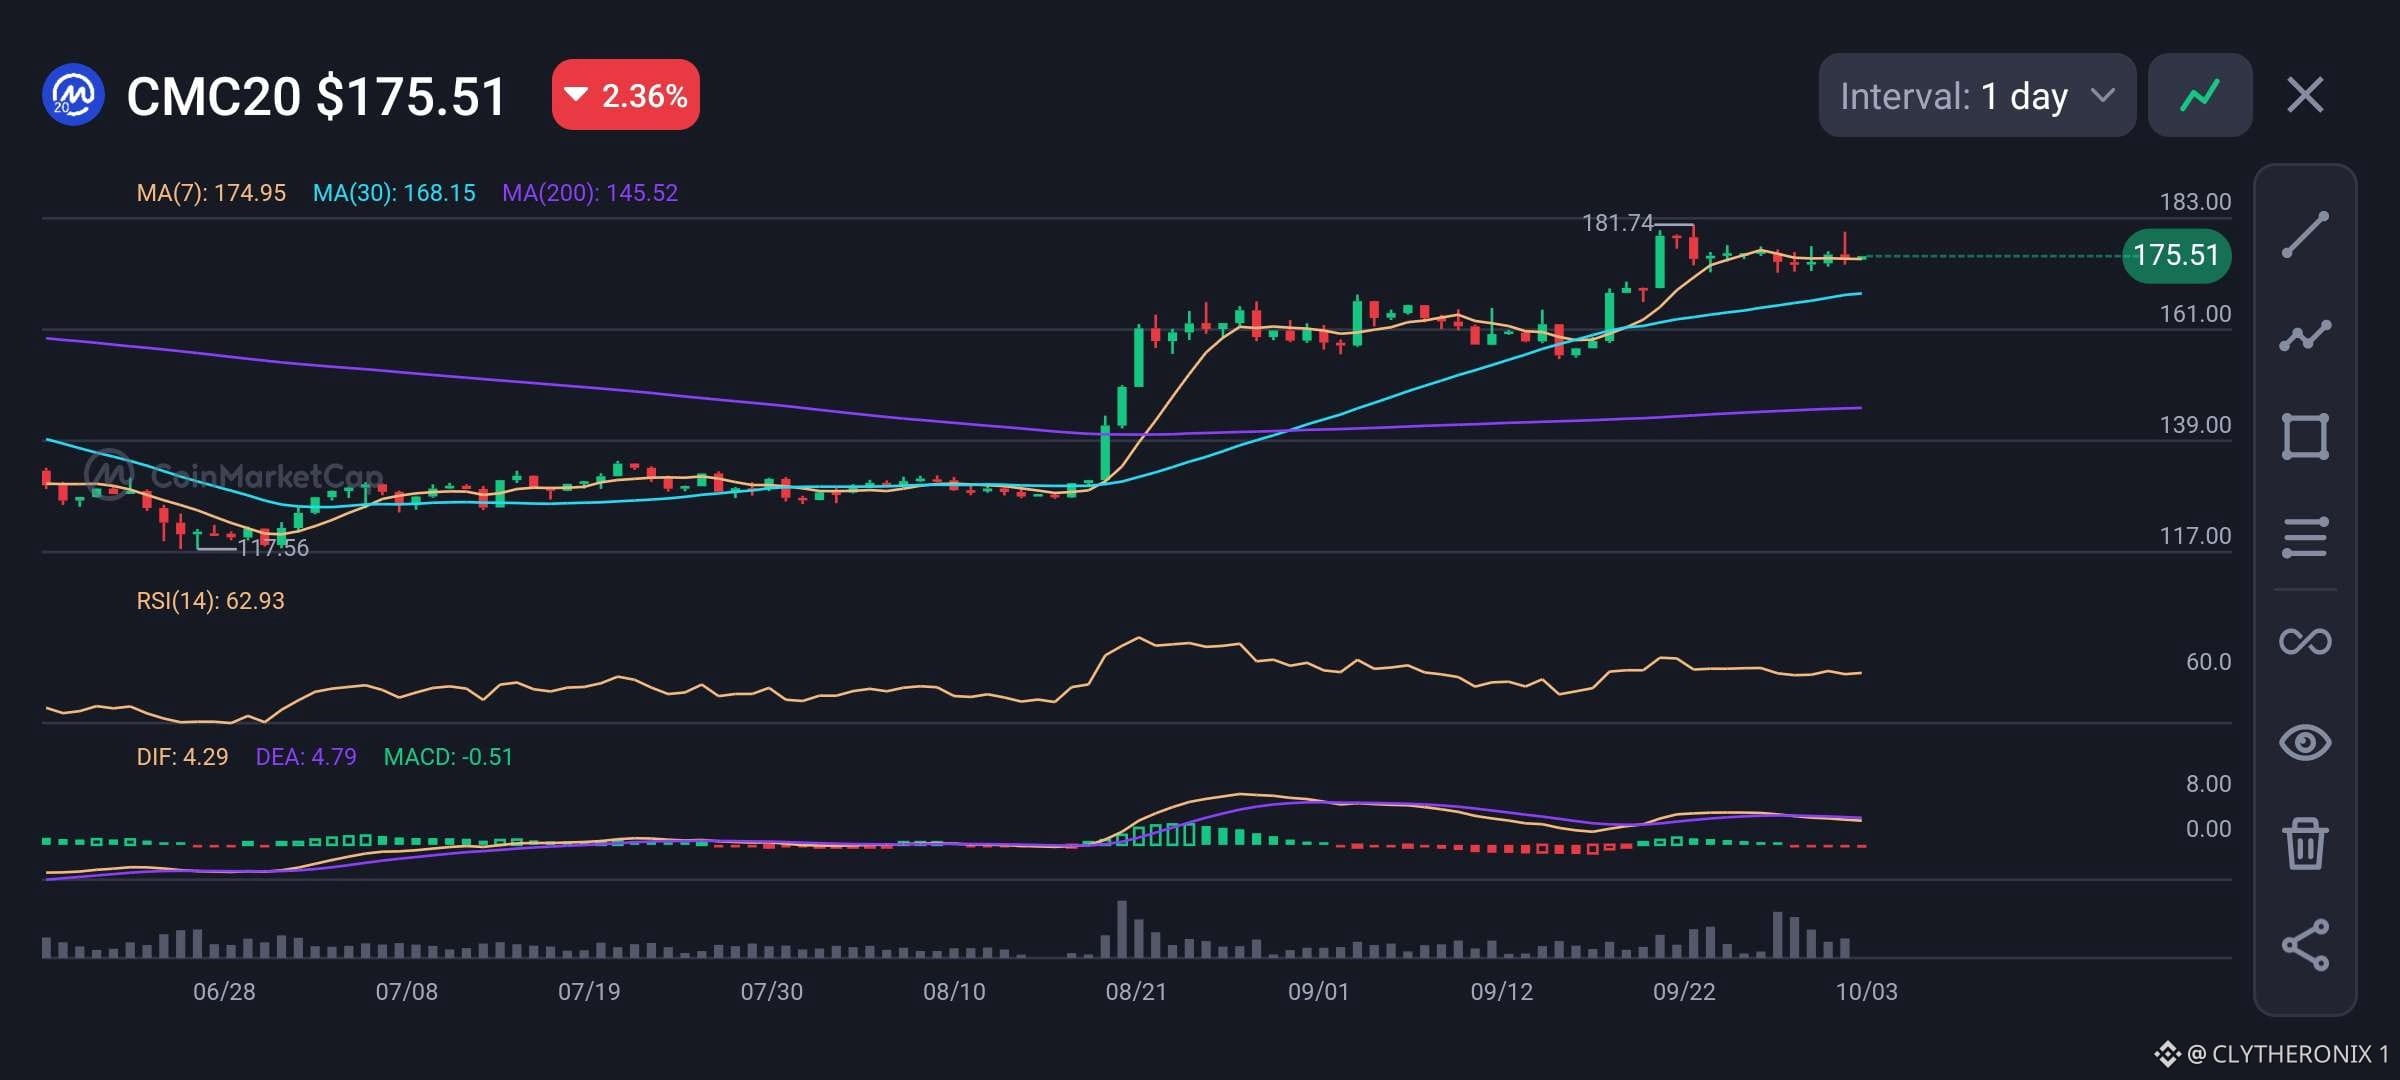
CMC20 CONSOLIDATES NEAR $175.51 AFTER MULTI-MONTH RALLY.
I observed CMC20 pulling back -2.36% to $175.51 after hitting a local high of $181.74 on BNB Smart Chain.
On-chain data from DEXTools shows over $1.74M in pool liquidity and $524K in 24h trading volume, indicating deep DEX liquidity is comfortably absorbing current profit-taking.
• Price: $175.51
• 24h change: -2.36%
• MA(7): $174.95
• MA(30): $168.15
• MA(200): $145.52
• RSI(14): 62.93
• MACD: -0.51 (Neutral)
In my view, $CMC20 remains in a solid macro uptrend, holding above its short-term MA(7) ($174.95), MA(30) ($168.15), and long-term MA(200) ($145.52).
An RSI of 62.93 reflects strong momentum without being overbought, while a neutral MACD indicates minor consolidation.
Key support rests at $174.95, while overhead resistance remains at $181.74.
The chart indicates that $CMC20 is in a healthy consolidation phase, meaning traders should watch for a breakout above $181.74 or a supportive bounce off $174.95.
Disclaimer: This analysis reflects my personal research and is not financial advice.
CMC20 CONSOLIDATES NEAR $175.51 AFTER MULTI-MONTH RALLY.
I observed CMC20 pulling back -2.36% to $175.51 after hitting a local high of $181.74 on BNB Smart Chain.
On-chain data from DEXTools shows over $1.74M in pool liquidity and $524K in 24h trading volume, indicating deep DEX liquidity is comfortably absorbing current profit-taking.
• Price: $175.51
• 24h change: -2.36%
• MA(7): $174.95
• MA(30): $168.15
• MA(200): $145.52
• RSI(14): 62.93
• MACD: -0.51 (Neutral)
In my view, $CMC20 remains in a solid macro uptrend, holding above its short-term MA(7) ($174.95), MA(30) ($168.15), and long-term MA(200) ($145.52).
An RSI of 62.93 reflects strong momentum without being overbought, while a neutral MACD indicates minor consolidation.
Key support rests at $174.95, while overhead resistance remains at $181.74.
The chart indicates that $CMC20 is in a healthy consolidation phase, meaning traders should watch for a breakout above $181.74 or a supportive bounce off $174.95.
Disclaimer: This analysis reflects my personal research and is not financial advice.
I observed CMC20 pulling back -2.36% to $175.51 after hitting a local high of $181.74 on BNB Smart Chain.
On-chain data from DEXTools shows over $1.74M in pool liquidity and $524K in 24h trading volume, indicating deep DEX liquidity is comfortably absorbing current profit-taking.
• Price: $175.51
• 24h change: -2.36%
• MA(7): $174.95
• MA(30): $168.15
• MA(200): $145.52
• RSI(14): 62.93
• MACD: -0.51 (Neutral)
In my view, $CMC20 remains in a solid macro uptrend, holding above its short-term MA(7) ($174.95), MA(30) ($168.15), and long-term MA(200) ($145.52).
An RSI of 62.93 reflects strong momentum without being overbought, while a neutral MACD indicates minor consolidation.
Key support rests at $174.95, while overhead resistance remains at $181.74.
The chart indicates that $CMC20 is in a healthy consolidation phase, meaning traders should watch for a breakout above $181.74 or a supportive bounce off $174.95.
Disclaimer: This analysis reflects my personal research and is not financial advice.
51
Ver traducción
Weak Jobs Data Drops Fed Hike Odds to 17% as Bitcoin Targets Citi's $113K Call
I observe Bitcoin down -1.98% despite macroeconomic shifts working in favour of digital assets. Weak U.S. labour market data has caused Federal Reserve rate-hike expectations to sink to just 17%.
In my view, an easing monetary policy environment provides fundamental tailwinds for $BTC, supporting Citi's long-term target of $113K.
• 24h change: -1.98%
• MACD: Neutral
From a technical perspective, despite short-term pullback pressure pushing price down -1.98%, the broader macro liquidity thesis remains intact.
Absorbing local selling and holding key support will be crucial to sustain upward trajectory toward Citi's $113K projection.
The data indicates traders should monitor interest rate policy developments and support retention before positioning for continuation toward higher target levels.
Disclaimer: This analysis reflects my personal opinion and is not financial advice.
#Macro Insights#
Weak Jobs Data Drops Fed Hike Odds to 17% as Bitcoin Targets Citi's $113K Call
I observe Bitcoin down -1.98% despite macroeconomic shifts working in favour of digital assets. Weak U.S. labour market data has caused Federal Reserve rate-hike expectations to sink to just 17%.
In my view, an easing monetary policy environment provides fundamental tailwinds for $BTC, supporting Citi's long-term target of $113K.
• 24h change: -1.98%
• MACD: Neutral
From a technical perspective, despite short-term pullback pressure pushing price down -1.98%, the broader macro liquidity thesis remains intact.
Absorbing local selling and holding key support will be crucial to sustain upward trajectory toward Citi's $113K projection.
The data indicates traders should monitor interest rate policy developments and support retention before positioning for continuation toward higher target levels.
Disclaimer: This analysis reflects my personal opinion and is not financial advice.
#Macro Insights#
I observe Bitcoin down -1.98% despite macroeconomic shifts working in favour of digital assets. Weak U.S. labour market data has caused Federal Reserve rate-hike expectations to sink to just 17%.
In my view, an easing monetary policy environment provides fundamental tailwinds for $BTC, supporting Citi's long-term target of $113K.
• 24h change: -1.98%
• MACD: Neutral
From a technical perspective, despite short-term pullback pressure pushing price down -1.98%, the broader macro liquidity thesis remains intact.
Absorbing local selling and holding key support will be crucial to sustain upward trajectory toward Citi's $113K projection.
The data indicates traders should monitor interest rate policy developments and support retention before positioning for continuation toward higher target levels.
Disclaimer: This analysis reflects my personal opinion and is not financial advice.
#Macro Insights#
79
Ver traducción
The interesting part here is that the first line of pain may not be the ETF buyers. Leveraged longs are much more fragile because they can be forcefully liquidated as $BTC moves lower.
If $83K gives way, those longs could become the first source of selling pressure. Then, $82.5K becomes important.
A move toward $81K would put many recent ETF buyers below their estimated cost basis, and that is where psychology starts changing.
The market may look cleaner with lower OI and neutral funding, but spot holders can still create selling pressure if support keeps breaking.
For me, $83K to $80K is the real test. Lose that zone, and the Q4 narrative gets a lot more complicated.
The interesting part here is that the first line of pain may not be the ETF buyers. Leveraged longs are much more fragile because they can be forcefully liquidated as $BTC moves lower.
If $83K gives way, those longs could become the first source of selling pressure. Then, $82.5K becomes important.
A move toward $81K would put many recent ETF buyers below their estimated cost basis, and that is where psychology starts changing.
The market may look cleaner with lower OI and neutral funding, but spot holders can still create selling pressure if support keeps breaking.
For me, $83K to $80K is the real test. Lose that zone, and the Q4 narrative gets a lot more complicated.
If $83K gives way, those longs could become the first source of selling pressure. Then, $82.5K becomes important.
A move toward $81K would put many recent ETF buyers below their estimated cost basis, and that is where psychology starts changing.
The market may look cleaner with lower OI and neutral funding, but spot holders can still create selling pressure if support keeps breaking.
For me, $83K to $80K is the real test. Lose that zone, and the Q4 narrative gets a lot more complicated.
28
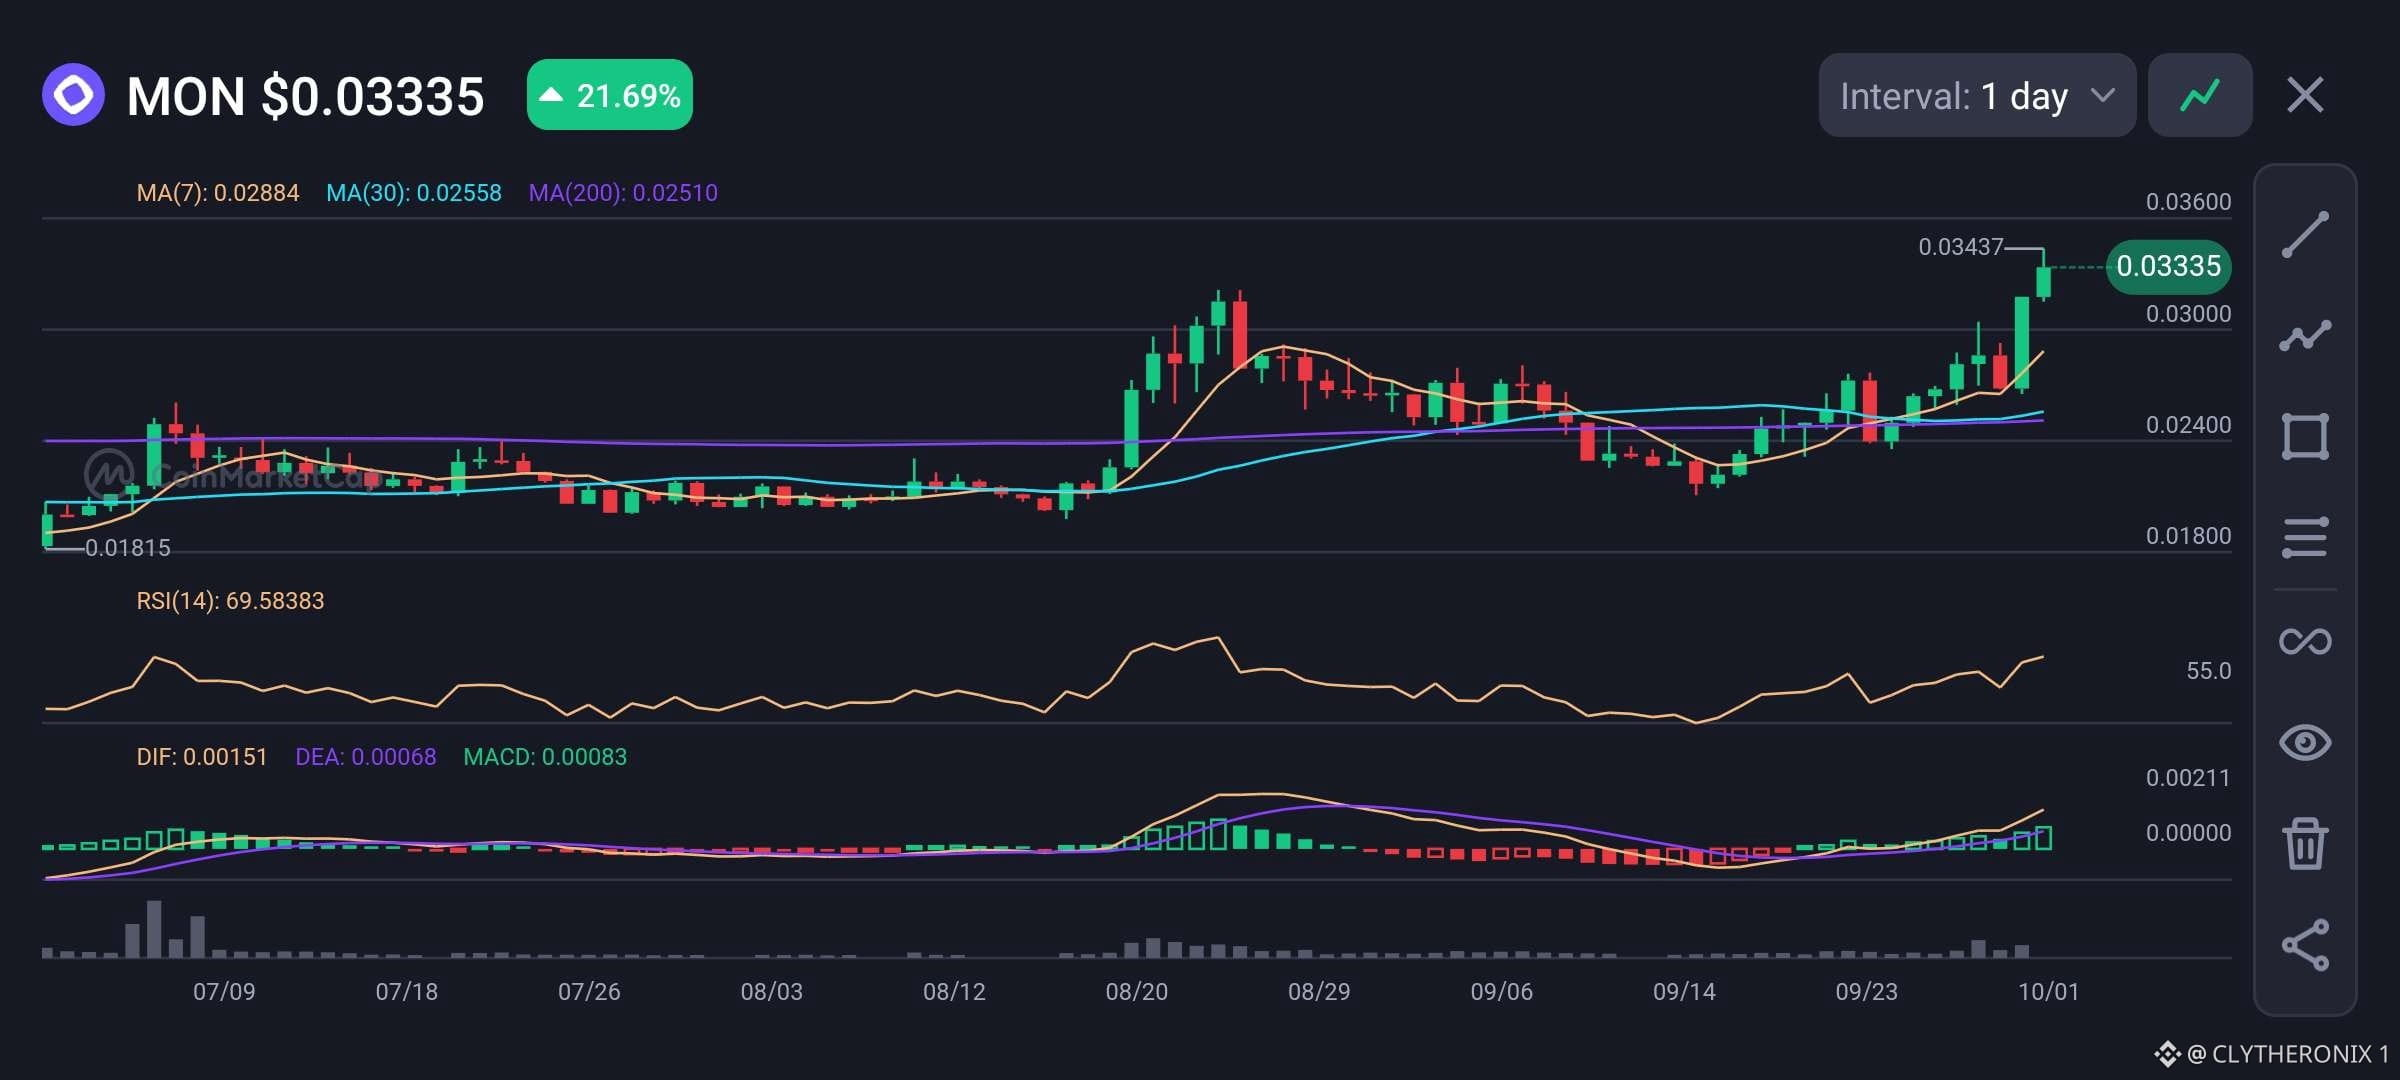
BOMBAS MONAD 21.69% EN DESBLOQUEO ALCISTA.
Observo a $MON rompiendo con fuerza en el gráfico diario, con un aumento de +21.69% hasta $0.03335.
El incremento del volumen de operaciones en las pools de liquidez de DEXTools en Solana está impulsando el precio por encima de niveles de consolidación de varios meses.
• Precio: $0.03335
• Cambio 24h: +21.69%
• MA(7): $0.02884
• MA(30): $0.02558
• MA(200): $0.02510
• RSI(14): 69.58
• MACD: 0.00083 (Alcista)
Mirando esto ahora, $MON muestra una fuerte alineación técnica, ya que el precio se mantiene bien por encima de la MA(7), la MA(30) y la MA(200).
Un RSI de 69.58 refleja una presión compradora sólida acercándose a territorio de sobrecompra, mientras que un MACD positivo en expansión respalda la continuación hacia el máximo local de $0.03437.
El soporte clave está en $0.02884.
El gráfico indica que $MON se encuentra en una fase de expansión poderosa, lo que sugiere a los traders estar atentos a un cierre sostenido por encima de $0.03437 para una continuación mayor o a una reevaluación saludable del soporte en $0.02884.
Descargo de responsabilidad: este análisis refleja mi investigación personal y no es asesoramiento financiero.
#Macro Insights#
BOMBAS MONAD 21.69% EN DESBLOQUEO ALCISTA.
Observo a $MON rompiendo con fuerza en el gráfico diario, con un aumento de +21.69% hasta $0.03335.
El incremento del volumen de operaciones en las pools de liquidez de DEXTools en Solana está impulsando el precio por encima de niveles de consolidación de varios meses.
• Precio: $0.03335
• Cambio 24h: +21.69%
• MA(7): $0.02884
• MA(30): $0.02558
• MA(200): $0.02510
• RSI(14): 69.58
• MACD: 0.00083 (Alcista)
Mirando esto ahora, $MON muestra una fuerte alineación técnica, ya que el precio se mantiene bien por encima de la MA(7), la MA(30) y la MA(200).
Un RSI de 69.58 refleja una presión compradora sólida acercándose a territorio de sobrecompra, mientras que un MACD positivo en expansión respalda la continuación hacia el máximo local de $0.03437.
El soporte clave está en $0.02884.
El gráfico indica que $MON se encuentra en una fase de expansión poderosa, lo que sugiere a los traders estar atentos a un cierre sostenido por encima de $0.03437 para una continuación mayor o a una reevaluación saludable del soporte en $0.02884.
Descargo de responsabilidad: este análisis refleja mi investigación personal y no es asesoramiento financiero.
#Macro Insights#
Observo a $MON rompiendo con fuerza en el gráfico diario, con un aumento de +21.69% hasta $0.03335.
El incremento del volumen de operaciones en las pools de liquidez de DEXTools en Solana está impulsando el precio por encima de niveles de consolidación de varios meses.
• Precio: $0.03335
• Cambio 24h: +21.69%
• MA(7): $0.02884
• MA(30): $0.02558
• MA(200): $0.02510
• RSI(14): 69.58
• MACD: 0.00083 (Alcista)
Mirando esto ahora, $MON muestra una fuerte alineación técnica, ya que el precio se mantiene bien por encima de la MA(7), la MA(30) y la MA(200).
Un RSI de 69.58 refleja una presión compradora sólida acercándose a territorio de sobrecompra, mientras que un MACD positivo en expansión respalda la continuación hacia el máximo local de $0.03437.
El soporte clave está en $0.02884.
El gráfico indica que $MON se encuentra en una fase de expansión poderosa, lo que sugiere a los traders estar atentos a un cierre sostenido por encima de $0.03437 para una continuación mayor o a una reevaluación saludable del soporte en $0.02884.
Descargo de responsabilidad: este análisis refleja mi investigación personal y no es asesoramiento financiero.
#Macro Insights#
41
¿LA HISTORIA FAVORECE A OCTUBRE, PERO ES SUFICIENTE?
Bitcoin ha cerrado octubre en positivo en 10 de los últimos 13 años, con un rendimiento promedio de octubre de aproximadamente el 19.1%.
Pero los datos también muestran por qué la estacionalidad debe tratarse como contexto, no como una señal.
Octubre de 2014 cayó un 11.6%, 2018 cayó un 4.7% y, incluso, el más reciente octubre de 2025 terminó en negativo con un -3.9%.
$BTC entra en octubre de 2026 alrededor de $83.6K, después de cotizar por encima de $85K más temprano hoy. La reciente subida también ha perdido algo de impulso, con el aumento de los rendimientos de los bonos del Tesoro y la demanda spot más lenta como factores a vigilar.
Entonces, ¿es suficiente la historia para confiar en otro “Uptober”?
No por sí sola. El patrón histórico es interesante, pero la estructura del mercado, la liquidez, los flujos de los ETF, las condiciones macroeconómicas y la demanda determinarán si octubre de 2026 repite el patrón.
La historia nos da un punto de referencia. La acción del precio tiene que confirmarlo.
#BTC Price Analysis#
¿LA HISTORIA FAVORECE A OCTUBRE, PERO ES SUFICIENTE?
Bitcoin ha cerrado octubre en positivo en 10 de los últimos 13 años, con un rendimiento promedio de octubre de aproximadamente el 19.1%.
Pero los datos también muestran por qué la estacionalidad debe tratarse como contexto, no como una señal.
Octubre de 2014 cayó un 11.6%, 2018 cayó un 4.7% y, incluso, el más reciente octubre de 2025 terminó en negativo con un -3.9%.
$BTC entra en octubre de 2026 alrededor de $83.6K, después de cotizar por encima de $85K más temprano hoy. La reciente subida también ha perdido algo de impulso, con el aumento de los rendimientos de los bonos del Tesoro y la demanda spot más lenta como factores a vigilar.
Entonces, ¿es suficiente la historia para confiar en otro “Uptober”?
No por sí sola. El patrón histórico es interesante, pero la estructura del mercado, la liquidez, los flujos de los ETF, las condiciones macroeconómicas y la demanda determinarán si octubre de 2026 repite el patrón.
La historia nos da un punto de referencia. La acción del precio tiene que confirmarlo.
#BTC Price Analysis#
Bitcoin ha cerrado octubre en positivo en 10 de los últimos 13 años, con un rendimiento promedio de octubre de aproximadamente el 19.1%.
Pero los datos también muestran por qué la estacionalidad debe tratarse como contexto, no como una señal.
Octubre de 2014 cayó un 11.6%, 2018 cayó un 4.7% y, incluso, el más reciente octubre de 2025 terminó en negativo con un -3.9%.
$BTC entra en octubre de 2026 alrededor de $83.6K, después de cotizar por encima de $85K más temprano hoy. La reciente subida también ha perdido algo de impulso, con el aumento de los rendimientos de los bonos del Tesoro y la demanda spot más lenta como factores a vigilar.
Entonces, ¿es suficiente la historia para confiar en otro “Uptober”?
No por sí sola. El patrón histórico es interesante, pero la estructura del mercado, la liquidez, los flujos de los ETF, las condiciones macroeconómicas y la demanda determinarán si octubre de 2026 repite el patrón.
La historia nos da un punto de referencia. La acción del precio tiene que confirmarlo.
#BTC Price Analysis#

64
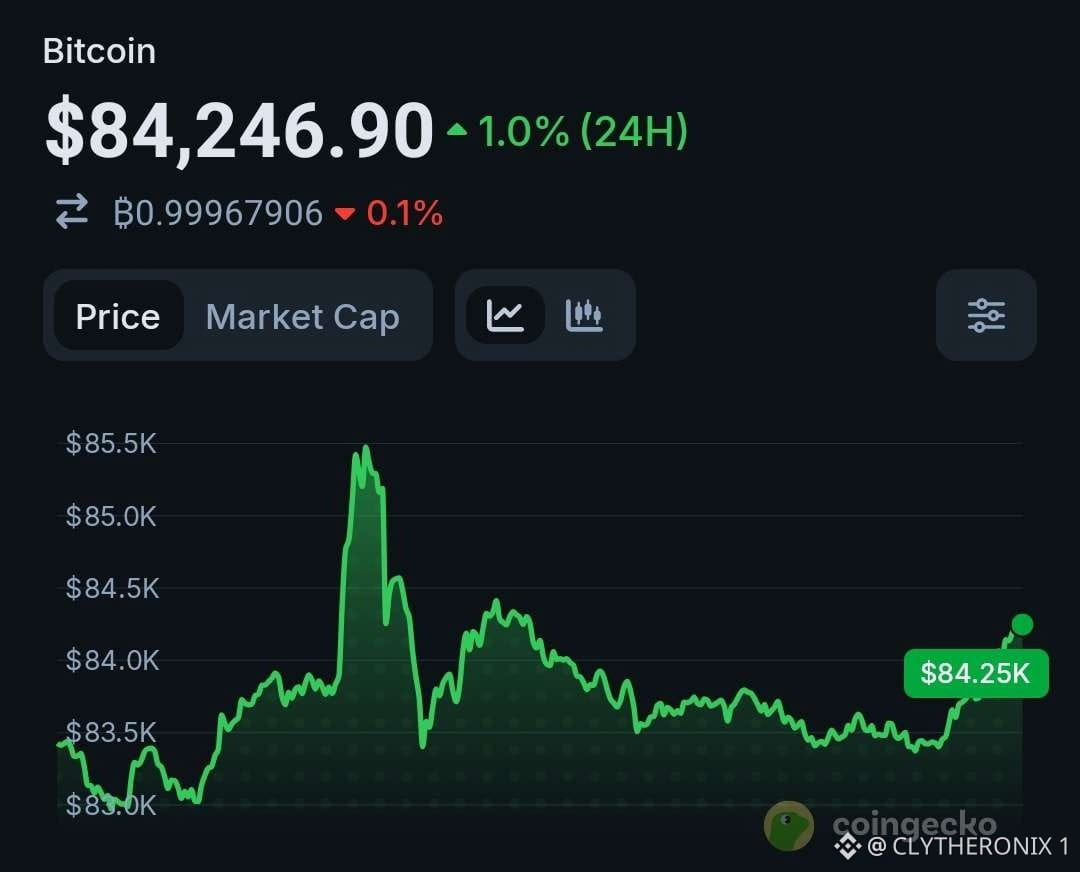
Bitcoin cierra el tercer trimestre con una subida del 42,7% pese a un giro en el cálculo del PCE subyacente:
Observo que Bitcoin ( $BTC) cierra septiembre con una subida del 6,4% para cerrar con una sólida ganancia del 42,7% en el Q3.
Aunque una publicación más baja del PCE subyacente redujo las probabilidades de alza de tasas de la Fed al 38%, parte de esos datos suaves se debió a un cambio en la metodología estadística que recortó 0,2 puntos porcentuales de las métricas de inflación.
El sentimiento de la comunidad sigue siendo alcista en un 58%, incluso cuando el repunte de los rendimientos de los bonos del Tesoro de EE. UU. hizo que el precio devolviera las ganancias iniciales del rally.
• Precio: $84,220.6
• Cambio 24h: +0,14%
• MACD: Neutral
En mi opinión, $BTC muestra una solidez estructural subyacente a pesar de los vientos en contra macro.
Defender la zona de $84,000 es esencial para que los compradores mantengan el impulso a largo plazo antes de intentar una ruptura hacia una resistencia más alta.
Los datos indican que los traders deberían tener paciencia y vigilar los cambios en los rendimientos macroeconómicos mientras el precio consolida cerca de $84,200.
Aviso legal: Este análisis refleja mi investigación personal y no constituye asesoramiento financiero.
#BTC Price Analysis#
Bitcoin cierra el tercer trimestre con una subida del 42,7% pese a un giro en el cálculo del PCE subyacente:
Observo que Bitcoin ( $BTC) cierra septiembre con una subida del 6,4% para cerrar con una sólida ganancia del 42,7% en el Q3.
Aunque una publicación más baja del PCE subyacente redujo las probabilidades de alza de tasas de la Fed al 38%, parte de esos datos suaves se debió a un cambio en la metodología estadística que recortó 0,2 puntos porcentuales de las métricas de inflación.
El sentimiento de la comunidad sigue siendo alcista en un 58%, incluso cuando el repunte de los rendimientos de los bonos del Tesoro de EE. UU. hizo que el precio devolviera las ganancias iniciales del rally.
• Precio: $84,220.6
• Cambio 24h: +0,14%
• MACD: Neutral
En mi opinión, $BTC muestra una solidez estructural subyacente a pesar de los vientos en contra macro.
Defender la zona de $84,000 es esencial para que los compradores mantengan el impulso a largo plazo antes de intentar una ruptura hacia una resistencia más alta.
Los datos indican que los traders deberían tener paciencia y vigilar los cambios en los rendimientos macroeconómicos mientras el precio consolida cerca de $84,200.
Aviso legal: Este análisis refleja mi investigación personal y no constituye asesoramiento financiero.
#BTC Price Analysis#
Observo que Bitcoin ( $BTC) cierra septiembre con una subida del 6,4% para cerrar con una sólida ganancia del 42,7% en el Q3.
Aunque una publicación más baja del PCE subyacente redujo las probabilidades de alza de tasas de la Fed al 38%, parte de esos datos suaves se debió a un cambio en la metodología estadística que recortó 0,2 puntos porcentuales de las métricas de inflación.
El sentimiento de la comunidad sigue siendo alcista en un 58%, incluso cuando el repunte de los rendimientos de los bonos del Tesoro de EE. UU. hizo que el precio devolviera las ganancias iniciales del rally.
• Precio: $84,220.6
• Cambio 24h: +0,14%
• MACD: Neutral
En mi opinión, $BTC muestra una solidez estructural subyacente a pesar de los vientos en contra macro.
Defender la zona de $84,000 es esencial para que los compradores mantengan el impulso a largo plazo antes de intentar una ruptura hacia una resistencia más alta.
Los datos indican que los traders deberían tener paciencia y vigilar los cambios en los rendimientos macroeconómicos mientras el precio consolida cerca de $84,200.
Aviso legal: Este análisis refleja mi investigación personal y no constituye asesoramiento financiero.
#BTC Price Analysis#
75
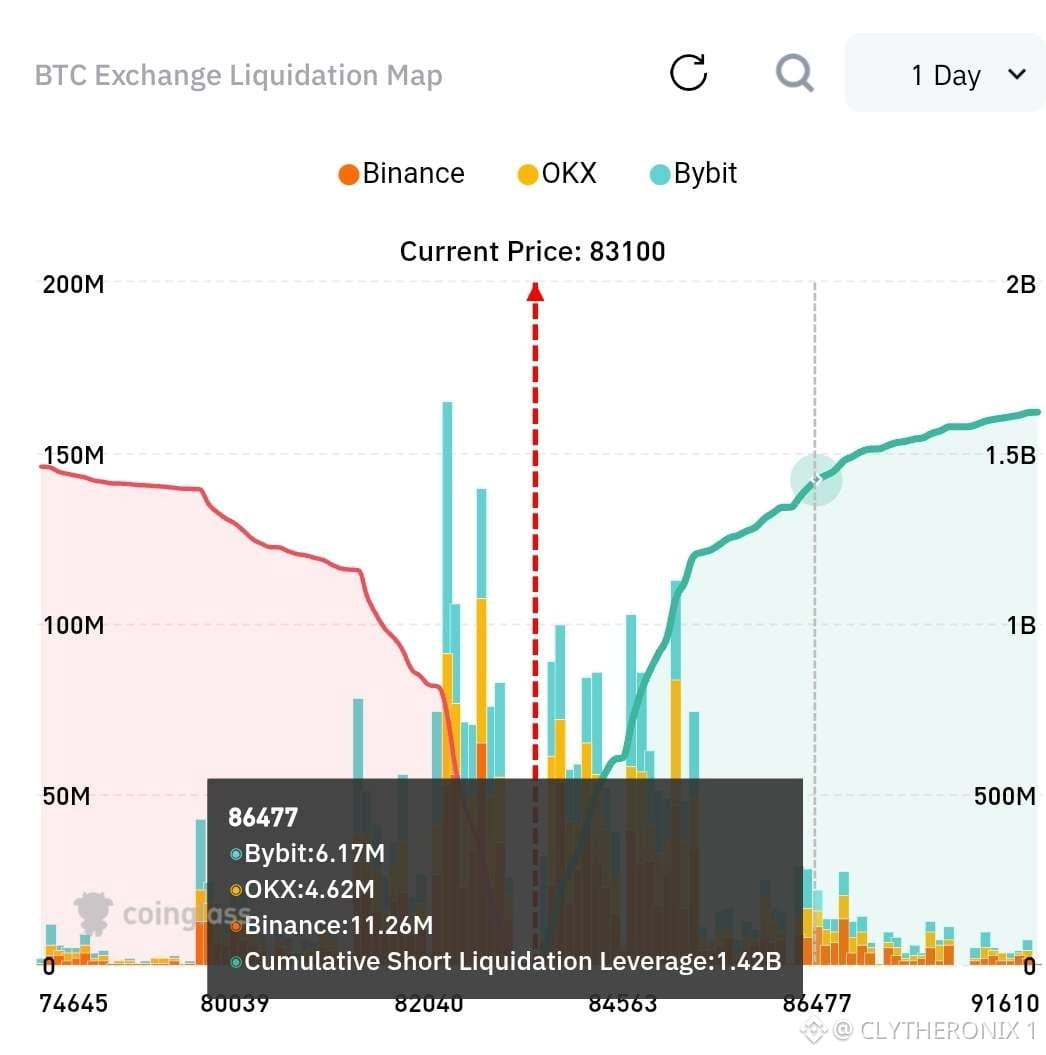
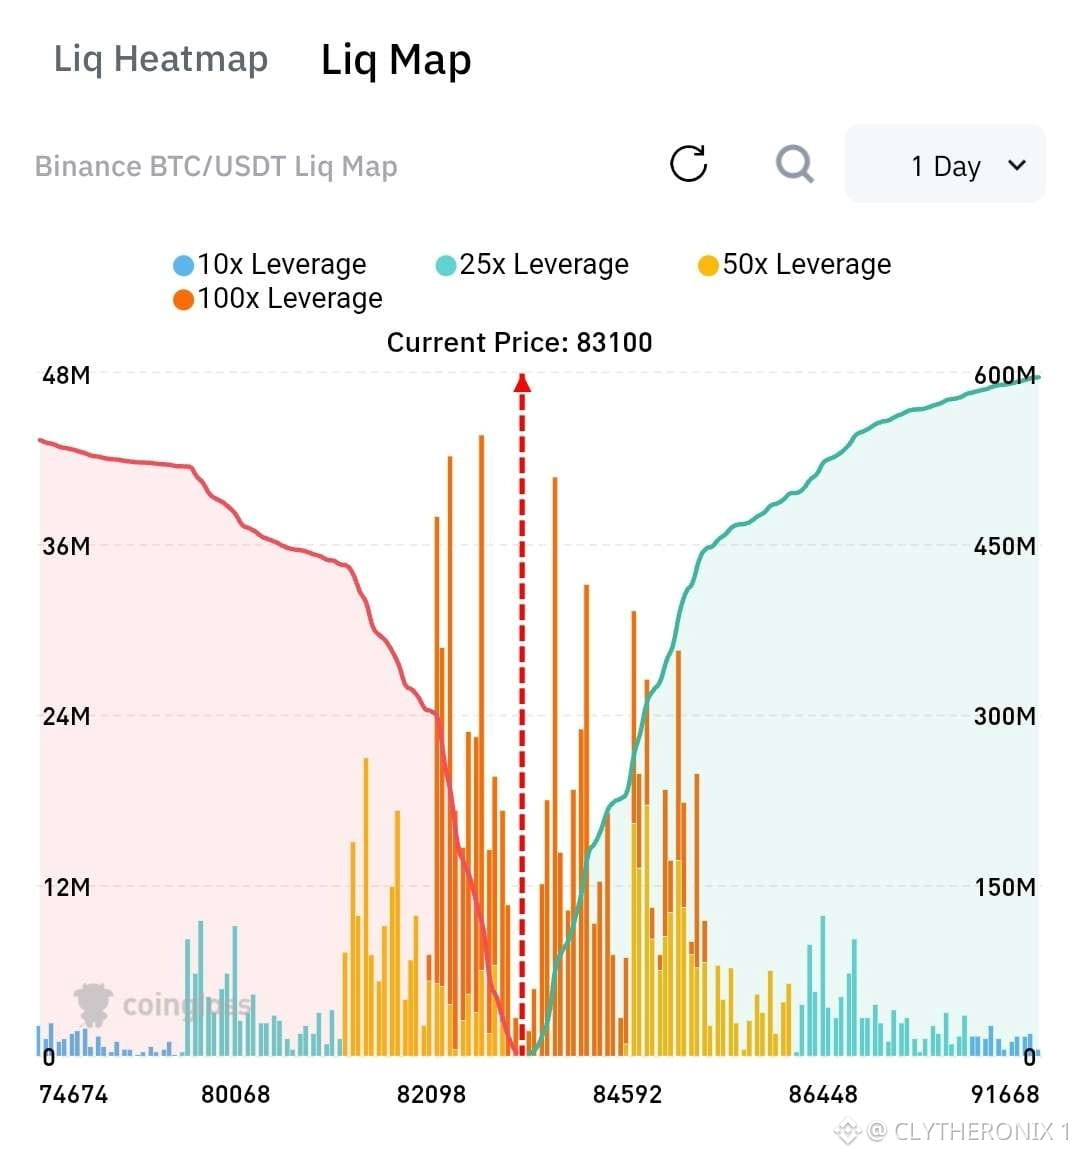
MAPA DE LIQUIDACIONES DE BITCOIN: Riesgo de squeeze alcista de $1.42B por encima de $86K
Observé $BTC atrapado en una zona de apalancamiento ajustada de 100x en $83,100.
Los datos de CoinGlass en Binance, OKX y Bybit muestran fuertes liquidaciones entre $82,098 y $84,592.
En mi opinión, la liquidez favorece una búsqueda alcista. Empujar por encima de $84,592 podría activar un squeeze hacia $86,477, donde el apalancamiento corto acumulado alcanza $1.42B. La liquidez larga a la baja se sitúa en $82,098.
La resistencia clave es $84,600 y $86,500; el soporte está en $82,100.
El gráfico indica que los traders deberían vigilar una barrida de liquidez alcista hacia $86,477, apuntando a shorts con alto apalancamiento.
Aviso legal: Investigación personal, no asesoramiento financiero.
#Análisis del precio de BTC#
MAPA DE LIQUIDACIONES DE BITCOIN: Riesgo de squeeze alcista de $1.42B por encima de $86K
Observé $BTC atrapado en una zona de apalancamiento ajustada de 100x en $83,100.
Los datos de CoinGlass en Binance, OKX y Bybit muestran fuertes liquidaciones entre $82,098 y $84,592.
En mi opinión, la liquidez favorece una búsqueda alcista. Empujar por encima de $84,592 podría activar un squeeze hacia $86,477, donde el apalancamiento corto acumulado alcanza $1.42B. La liquidez larga a la baja se sitúa en $82,098.
La resistencia clave es $84,600 y $86,500; el soporte está en $82,100.
El gráfico indica que los traders deberían vigilar una barrida de liquidez alcista hacia $86,477, apuntando a shorts con alto apalancamiento.
Aviso legal: Investigación personal, no asesoramiento financiero.
#Análisis del precio de BTC#
Observé $BTC atrapado en una zona de apalancamiento ajustada de 100x en $83,100.
Los datos de CoinGlass en Binance, OKX y Bybit muestran fuertes liquidaciones entre $82,098 y $84,592.
En mi opinión, la liquidez favorece una búsqueda alcista. Empujar por encima de $84,592 podría activar un squeeze hacia $86,477, donde el apalancamiento corto acumulado alcanza $1.42B. La liquidez larga a la baja se sitúa en $82,098.
La resistencia clave es $84,600 y $86,500; el soporte está en $82,100.
El gráfico indica que los traders deberían vigilar una barrida de liquidez alcista hacia $86,477, apuntando a shorts con alto apalancamiento.
Aviso legal: Investigación personal, no asesoramiento financiero.
#Análisis del precio de BTC#
53
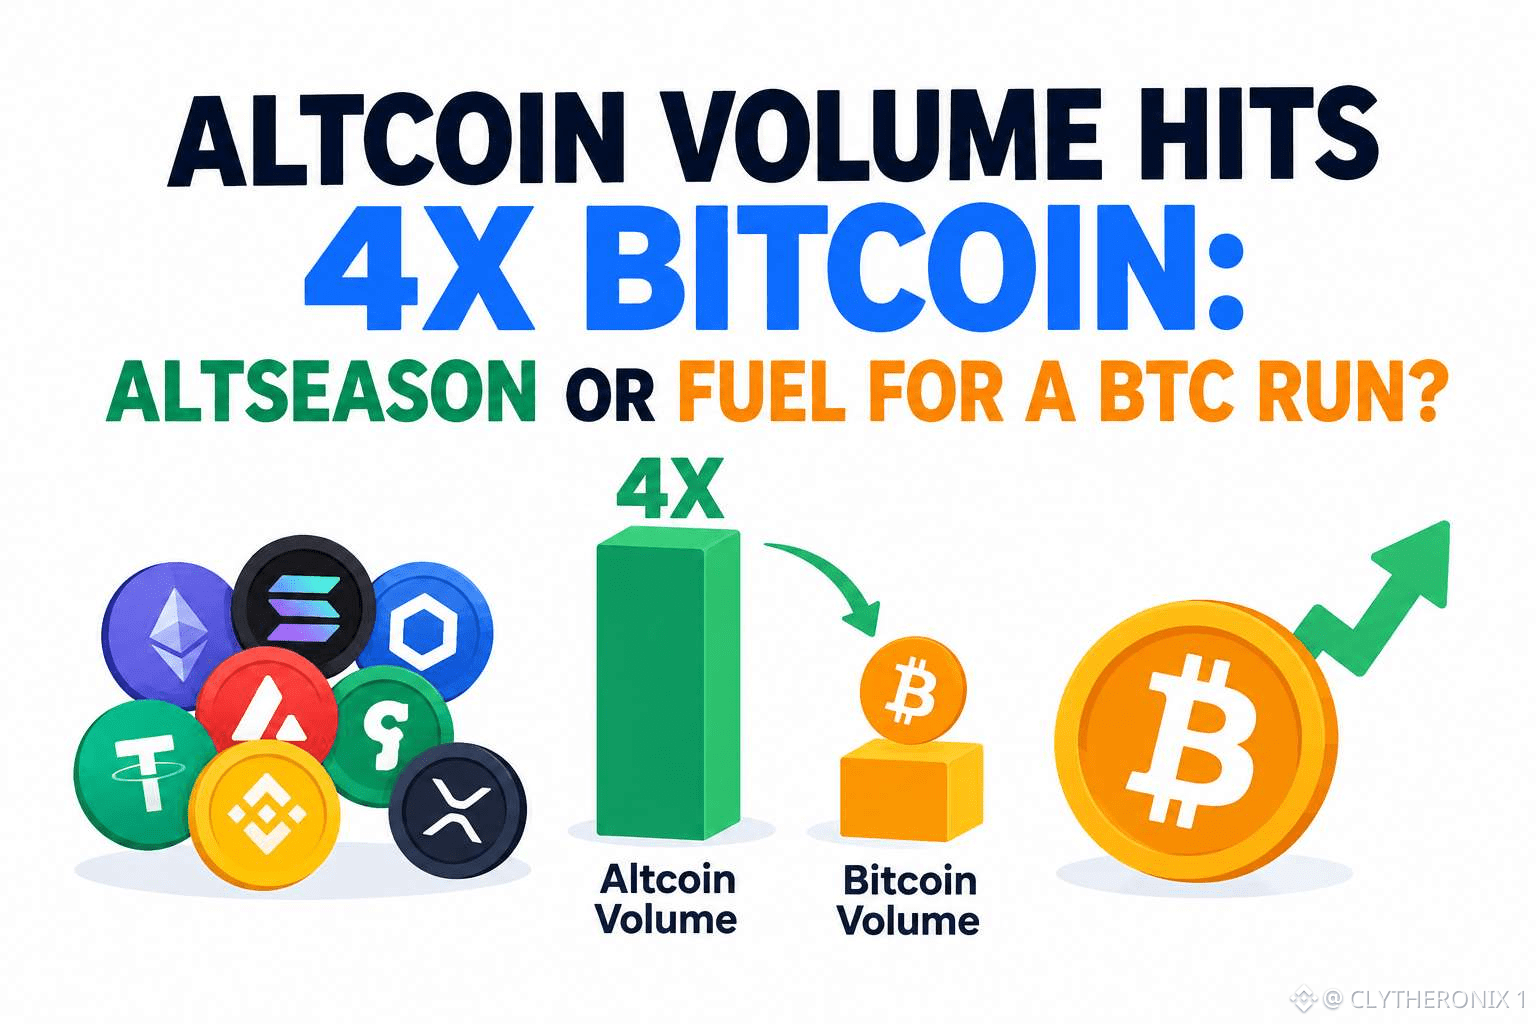
El volumen de operaciones spot de altcoins ha aumentado hasta casi 4 veces el de Bitcoin, alcanzando su mayor ratio desde septiembre de 2025. Glassnode también informa que el 72,5% de las altcoins rastreadas ha superado a BTC, subiendo con fuerza desde el 39% durante agosto.
Esto parece una rotación de capital, pero no confirma automáticamente un altseason. El índice de temporada de altcoins actual es 53, todavía por debajo del umbral de 75 que se utiliza para definir una amplia temporada alcista de altcoins.
Hay otra cara de esto. Glassnode dice que estallidos similares de toma de riesgo agresiva en altcoins a menudo han aparecido alrededor de máximos locales de Bitcoin. BTC también cotiza por debajo de su reciente máximo de ~87K, mientras que las entradas a ETFs se han desacelerado en las sesiones recientes.
Así que la pregunta real es si el volumen de altcoins está ampliando la subida del mercado cripto o si solo está rotando beneficios antes de otro movimiento de $BTC.
Por ahora, el volumen confirma el aumento de la aversión al riesgo. La siguiente señal es si Bitcoin mantiene su rango mientras las altcoins siguen ganando amplitud.
#BTC Price Analysis#
El volumen de operaciones spot de altcoins ha aumentado hasta casi 4 veces el de Bitcoin, alcanzando su mayor ratio desde septiembre de 2025. Glassnode también informa que el 72,5% de las altcoins rastreadas ha superado a BTC, subiendo con fuerza desde el 39% durante agosto.
Esto parece una rotación de capital, pero no confirma automáticamente un altseason. El índice de temporada de altcoins actual es 53, todavía por debajo del umbral de 75 que se utiliza para definir una amplia temporada alcista de altcoins.
Hay otra cara de esto. Glassnode dice que estallidos similares de toma de riesgo agresiva en altcoins a menudo han aparecido alrededor de máximos locales de Bitcoin. BTC también cotiza por debajo de su reciente máximo de ~87K, mientras que las entradas a ETFs se han desacelerado en las sesiones recientes.
Así que la pregunta real es si el volumen de altcoins está ampliando la subida del mercado cripto o si solo está rotando beneficios antes de otro movimiento de $BTC.
Por ahora, el volumen confirma el aumento de la aversión al riesgo. La siguiente señal es si Bitcoin mantiene su rango mientras las altcoins siguen ganando amplitud.
#BTC Price Analysis#
Esto parece una rotación de capital, pero no confirma automáticamente un altseason. El índice de temporada de altcoins actual es 53, todavía por debajo del umbral de 75 que se utiliza para definir una amplia temporada alcista de altcoins.
Hay otra cara de esto. Glassnode dice que estallidos similares de toma de riesgo agresiva en altcoins a menudo han aparecido alrededor de máximos locales de Bitcoin. BTC también cotiza por debajo de su reciente máximo de ~87K, mientras que las entradas a ETFs se han desacelerado en las sesiones recientes.
Así que la pregunta real es si el volumen de altcoins está ampliando la subida del mercado cripto o si solo está rotando beneficios antes de otro movimiento de $BTC.
Por ahora, el volumen confirma el aumento de la aversión al riesgo. La siguiente señal es si Bitcoin mantiene su rango mientras las altcoins siguen ganando amplitud.
#BTC Price Analysis#
50
EL HACK DE BITGET DEMUESTRA QUE LA SEGURIDAD NO TERMINA CON LAS CLAVES PRIVADAS
El hack de Bitget es un recordatorio de que la seguridad cripto es mucho más que simplemente proteger las claves privadas.
El 24 de septiembre, los atacantes movieron aproximadamente $387,5M desde la infraestructura del exchange de Bitget.
Bitget afirma que sus claves privadas no fueron comprometidas. En su lugar, el atacante explotó una vulnerabilidad de backend y eludió los controles de seguridad para autorizar transferencias fraudulentas.
La parte más interesante llegó después del robo.
El atacante ha continuado moviendo fondos entre cadenas. El 28 de septiembre, aproximadamente 2.390 $ETH, con un valor cercano a $6,3M, se convirtieron en 75,2 $BTC a través de THORChain, a pesar de que Bitget pidió al protocolo que bloqueara las direcciones asociadas con el hack.
Al mismo tiempo, $NEAR Intents informó que detectó más de $50M en flujos intentados vinculados al atacante, y que su sistema de seguridad bloqueó la mayor parte de la actividad. Aproximadamente $503K se congelaron durante la ejecución, mientras que según se informa cerca de $166K pasaron.
Esto deja una lección importante para los usuarios de cripto: la descentralización, la infraestructura sin permisos y la seguridad no son lo mismo.
Un protocolo puede ser sin permisos y aun así contar con mecanismos de seguridad. Pero en el momento en que los fondos robados se mueven entre múltiples cadenas, exchanges, puentes y protocolos de intercambio, la responsabilidad se vuelve mucho más difícil de definir.
Para los usuarios, la lección es simple: no juzgues la seguridad de una plataforma solo por si usa billeteras frías o protege las claves privadas.
Observa todo el sistema, incluida la infraestructura de backend, los controles de autorización, los procedimientos de retiro, el monitoreo y qué tan rápido se pueden detectar y contener las transacciones sospechosas.
Cripto le da a los usuarios un control sin precedentes sobre los activos, pero eso también significa que la arquitectura de seguridad detrás de cada transacción importa.
El incidente de Bitget muestra exactamente por qué.
EL HACK DE BITGET DEMUESTRA QUE LA SEGURIDAD NO TERMINA CON LAS CLAVES PRIVADAS
El hack de Bitget es un recordatorio de que la seguridad cripto es mucho más que simplemente proteger las claves privadas.
El 24 de septiembre, los atacantes movieron aproximadamente $387,5M desde la infraestructura del exchange de Bitget.
Bitget afirma que sus claves privadas no fueron comprometidas. En su lugar, el atacante explotó una vulnerabilidad de backend y eludió los controles de seguridad para autorizar transferencias fraudulentas.
La parte más interesante llegó después del robo.
El atacante ha continuado moviendo fondos entre cadenas. El 28 de septiembre, aproximadamente 2.390 $ETH, con un valor cercano a $6,3M, se convirtieron en 75,2 $BTC a través de THORChain, a pesar de que Bitget pidió al protocolo que bloqueara las direcciones asociadas con el hack.
Al mismo tiempo, $NEAR Intents informó que detectó más de $50M en flujos intentados vinculados al atacante, y que su sistema de seguridad bloqueó la mayor parte de la actividad. Aproximadamente $503K se congelaron durante la ejecución, mientras que según se informa cerca de $166K pasaron.
Esto deja una lección importante para los usuarios de cripto: la descentralización, la infraestructura sin permisos y la seguridad no son lo mismo.
Un protocolo puede ser sin permisos y aun así contar con mecanismos de seguridad. Pero en el momento en que los fondos robados se mueven entre múltiples cadenas, exchanges, puentes y protocolos de intercambio, la responsabilidad se vuelve mucho más difícil de definir.
Para los usuarios, la lección es simple: no juzgues la seguridad de una plataforma solo por si usa billeteras frías o protege las claves privadas.
Observa todo el sistema, incluida la infraestructura de backend, los controles de autorización, los procedimientos de retiro, el monitoreo y qué tan rápido se pueden detectar y contener las transacciones sospechosas.
Cripto le da a los usuarios un control sin precedentes sobre los activos, pero eso también significa que la arquitectura de seguridad detrás de cada transacción importa.
El incidente de Bitget muestra exactamente por qué.
El hack de Bitget es un recordatorio de que la seguridad cripto es mucho más que simplemente proteger las claves privadas.
El 24 de septiembre, los atacantes movieron aproximadamente $387,5M desde la infraestructura del exchange de Bitget.
Bitget afirma que sus claves privadas no fueron comprometidas. En su lugar, el atacante explotó una vulnerabilidad de backend y eludió los controles de seguridad para autorizar transferencias fraudulentas.
La parte más interesante llegó después del robo.
El atacante ha continuado moviendo fondos entre cadenas. El 28 de septiembre, aproximadamente 2.390 $ETH, con un valor cercano a $6,3M, se convirtieron en 75,2 $BTC a través de THORChain, a pesar de que Bitget pidió al protocolo que bloqueara las direcciones asociadas con el hack.
Al mismo tiempo, $NEAR Intents informó que detectó más de $50M en flujos intentados vinculados al atacante, y que su sistema de seguridad bloqueó la mayor parte de la actividad. Aproximadamente $503K se congelaron durante la ejecución, mientras que según se informa cerca de $166K pasaron.
Esto deja una lección importante para los usuarios de cripto: la descentralización, la infraestructura sin permisos y la seguridad no son lo mismo.
Un protocolo puede ser sin permisos y aun así contar con mecanismos de seguridad. Pero en el momento en que los fondos robados se mueven entre múltiples cadenas, exchanges, puentes y protocolos de intercambio, la responsabilidad se vuelve mucho más difícil de definir.
Para los usuarios, la lección es simple: no juzgues la seguridad de una plataforma solo por si usa billeteras frías o protege las claves privadas.
Observa todo el sistema, incluida la infraestructura de backend, los controles de autorización, los procedimientos de retiro, el monitoreo y qué tan rápido se pueden detectar y contener las transacciones sospechosas.
Cripto le da a los usuarios un control sin precedentes sobre los activos, pero eso también significa que la arquitectura de seguridad detrás de cada transacción importa.
El incidente de Bitget muestra exactamente por qué.

54
ORO RWA: El oro tokenizado se mantiene firme mientras el precio se recupera
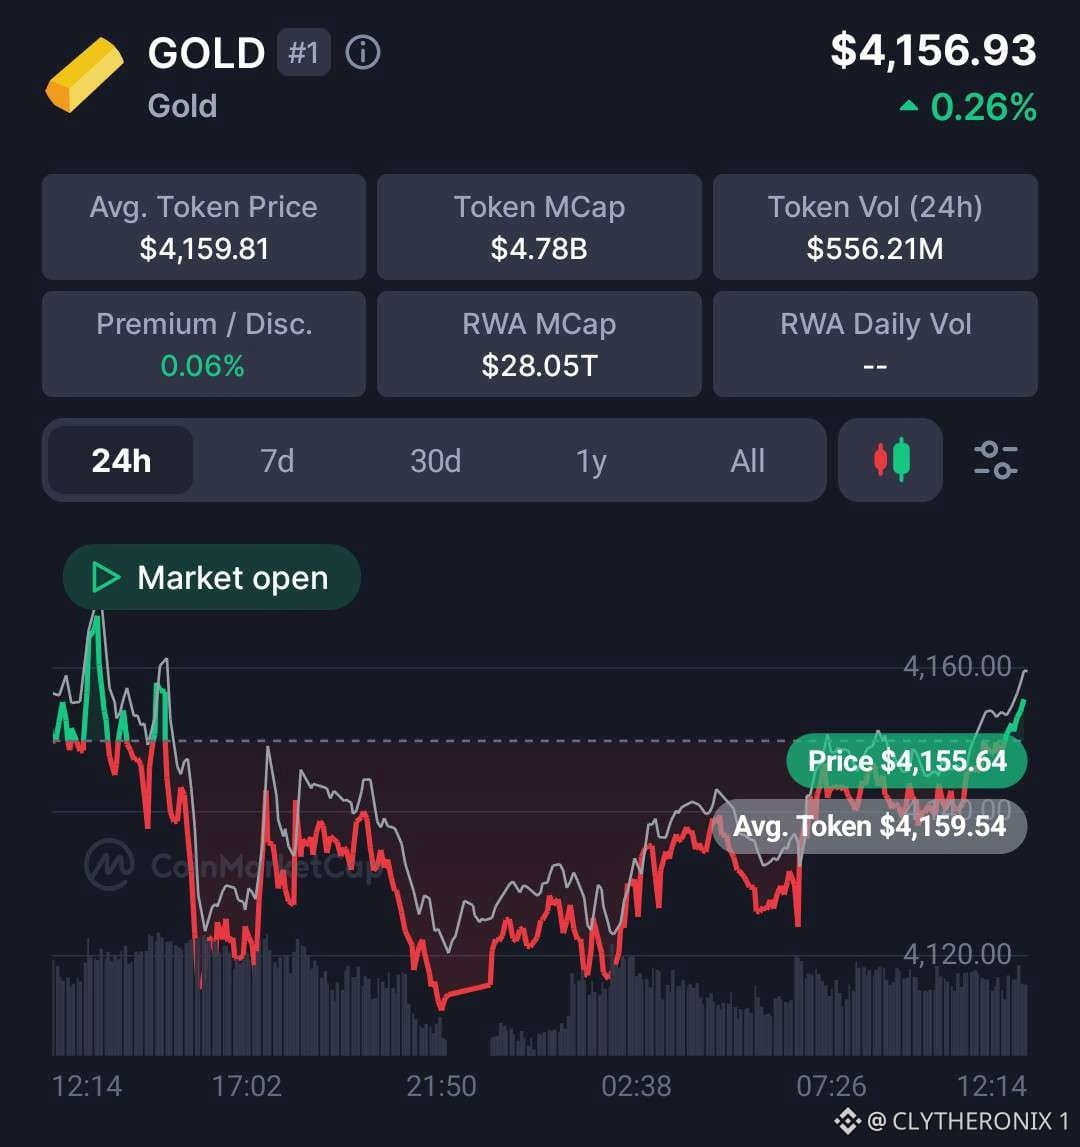
El ORO muestra un impulso positivo moderado, cotizando alrededor de $4,156.93 con una ganancia del 0.26% en 24 horas. El gráfico muestra una caída inicial seguida de una recuperación gradual, con el precio volviendo hacia el extremo superior de su rango reciente.
* Precio: $4,156.93
* Cambio 24h: +0.26%
* Precio promedio del token: $4,159.81
* Capitalización de mercado del token: $4.78B
* Volumen de tokens 24h: $556.2M
* Prima/descuento: 0.06%
* Capitalización de mercado RWA: $28.05T
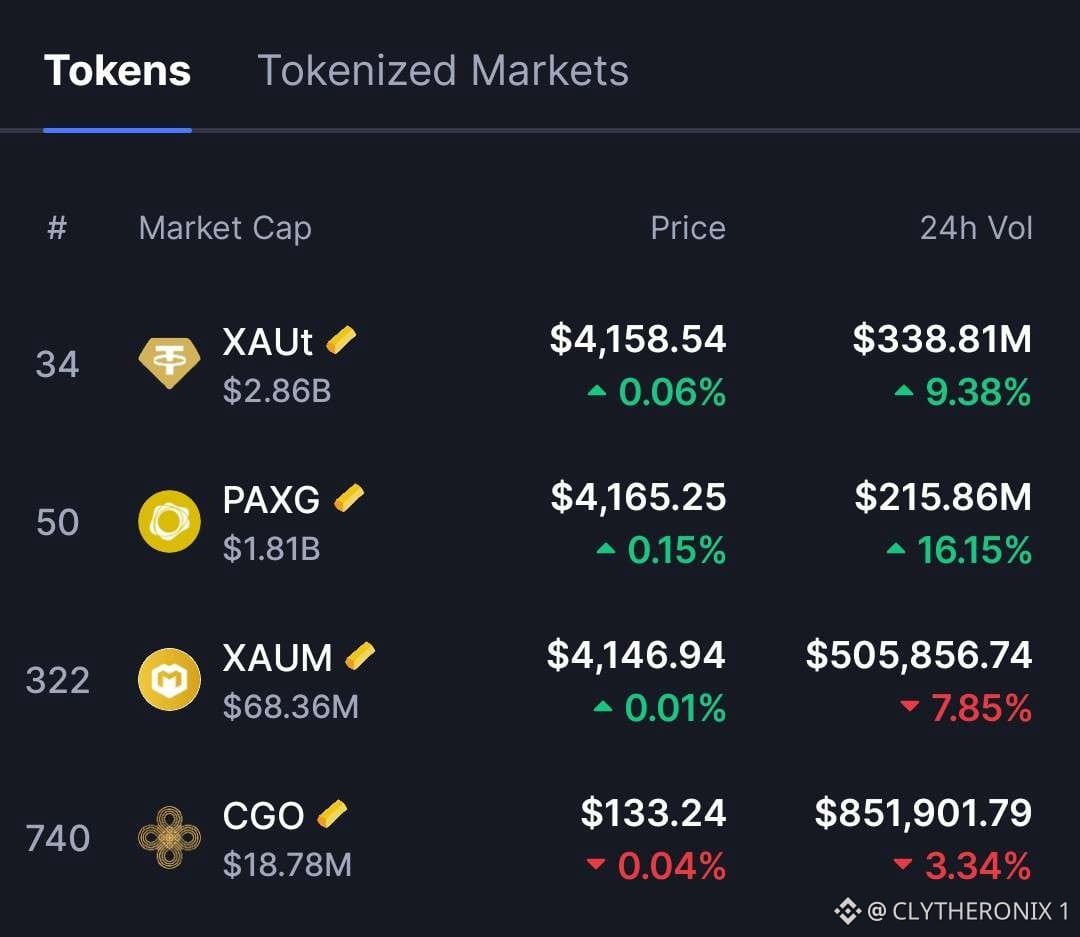
El precio de $PAXG actualmente cotiza ligeramente por debajo del precio promedio del token, lo que sugiere que la recuperación aún no ha eliminado por completo la debilidad anterior.
Sin embargo, el último movimiento alcista indica que los compradores han regresado después de la caída.
La ganancia diaria moderada apunta a un movimiento relativamente estable más que a una ruptura brusca.
El mercado de oro tokenizado también muestra una actividad sustancial, con un volumen reportado de 24 horas de $556.2M y una capitalización de mercado del token de $4.78B.
La prima/descuento del 0.06% indica que el precio del token mostrado cotiza cerca de su valor de referencia, aunque esta cifra por sí sola no determina la calidad de su respaldo subyacente ni las condiciones de redención.
La zona de $4,160 es el nivel inmediato a vigilar. Un movimiento sostenido por encima de ella podría fortalecer la recuperación a corto plazo, mientras que un rechazo podría mantener el precio moviéndose lateralmente.
A la baja, la zona de $4,120 es un área de soporte importante visible en el gráfico.
#RWA #Macro Insights#
ORO RWA: El oro tokenizado se mantiene firme mientras el precio se recupera
El ORO muestra un impulso positivo moderado, cotizando alrededor de $4,156.93 con una ganancia del 0.26% en 24 horas. El gráfico muestra una caída inicial seguida de una recuperación gradual, con el precio volviendo hacia el extremo superior de su rango reciente.
* Precio: $4,156.93
* Cambio 24h: +0.26%
* Precio promedio del token: $4,159.81
* Capitalización de mercado del token: $4.78B
* Volumen de tokens 24h: $556.2M
* Prima/descuento: 0.06%
* Capitalización de mercado RWA: $28.05T
El precio de $PAXG actualmente cotiza ligeramente por debajo del precio promedio del token, lo que sugiere que la recuperación aún no ha eliminado por completo la debilidad anterior.
Sin embargo, el último movimiento alcista indica que los compradores han regresado después de la caída.
La ganancia diaria moderada apunta a un movimiento relativamente estable más que a una ruptura brusca.
El mercado de oro tokenizado también muestra una actividad sustancial, con un volumen reportado de 24 horas de $556.2M y una capitalización de mercado del token de $4.78B.
La prima/descuento del 0.06% indica que el precio del token mostrado cotiza cerca de su valor de referencia, aunque esta cifra por sí sola no determina la calidad de su respaldo subyacente ni las condiciones de redención.
La zona de $4,160 es el nivel inmediato a vigilar. Un movimiento sostenido por encima de ella podría fortalecer la recuperación a corto plazo, mientras que un rechazo podría mantener el precio moviéndose lateralmente.
A la baja, la zona de $4,120 es un área de soporte importante visible en el gráfico.
#RWA #Macro Insights#
El ORO muestra un impulso positivo moderado, cotizando alrededor de $4,156.93 con una ganancia del 0.26% en 24 horas. El gráfico muestra una caída inicial seguida de una recuperación gradual, con el precio volviendo hacia el extremo superior de su rango reciente.
* Precio: $4,156.93
* Cambio 24h: +0.26%
* Precio promedio del token: $4,159.81
* Capitalización de mercado del token: $4.78B
* Volumen de tokens 24h: $556.2M
* Prima/descuento: 0.06%
* Capitalización de mercado RWA: $28.05T
El precio de $PAXG actualmente cotiza ligeramente por debajo del precio promedio del token, lo que sugiere que la recuperación aún no ha eliminado por completo la debilidad anterior.
Sin embargo, el último movimiento alcista indica que los compradores han regresado después de la caída.
La ganancia diaria moderada apunta a un movimiento relativamente estable más que a una ruptura brusca.
El mercado de oro tokenizado también muestra una actividad sustancial, con un volumen reportado de 24 horas de $556.2M y una capitalización de mercado del token de $4.78B.
La prima/descuento del 0.06% indica que el precio del token mostrado cotiza cerca de su valor de referencia, aunque esta cifra por sí sola no determina la calidad de su respaldo subyacente ni las condiciones de redención.
La zona de $4,160 es el nivel inmediato a vigilar. Un movimiento sostenido por encima de ella podría fortalecer la recuperación a corto plazo, mientras que un rechazo podría mantener el precio moviéndose lateralmente.
A la baja, la zona de $4,120 es un área de soporte importante visible en el gráfico.
#RWA #Macro Insights#
80
Aquí es donde la descentralización se complica. THORChain tiene un argumento sólido de que un protocolo neutral no debería decidir qué direcciones pueden realizar transacciones.
Una vez que se abre esa puerta, ¿quién decide qué se bloquea, si es $BTC, $ETH u otro activo, y qué impide que ese poder se abuse?
Pero el argumento opuesto también es válido. Si los validadores pueden detener el protocolo durante un exploit, es razonable preguntarse por qué no pueden responder cuando claramente se identifican fondos robados que se están moviendo a través de él y convirtiéndose en activos como BTC.
La respuesta necesita ser más que “descentralización”. Debe haber reglas claras, transparencia y rendición de cuentas.
De lo contrario, la neutralidad puede convertirse en una censura disfrazada o en una excusa para evitar la responsabilidad.
#Macro Insights#
Aquí es donde la descentralización se complica. THORChain tiene un argumento sólido de que un protocolo neutral no debería decidir qué direcciones pueden realizar transacciones.
Una vez que se abre esa puerta, ¿quién decide qué se bloquea, si es $BTC, $ETH u otro activo, y qué impide que ese poder se abuse?
Pero el argumento opuesto también es válido. Si los validadores pueden detener el protocolo durante un exploit, es razonable preguntarse por qué no pueden responder cuando claramente se identifican fondos robados que se están moviendo a través de él y convirtiéndose en activos como BTC.
La respuesta necesita ser más que “descentralización”. Debe haber reglas claras, transparencia y rendición de cuentas.
De lo contrario, la neutralidad puede convertirse en una censura disfrazada o en una excusa para evitar la responsabilidad.
#Macro Insights#
Una vez que se abre esa puerta, ¿quién decide qué se bloquea, si es $BTC, $ETH u otro activo, y qué impide que ese poder se abuse?
Pero el argumento opuesto también es válido. Si los validadores pueden detener el protocolo durante un exploit, es razonable preguntarse por qué no pueden responder cuando claramente se identifican fondos robados que se están moviendo a través de él y convirtiéndose en activos como BTC.
La respuesta necesita ser más que “descentralización”. Debe haber reglas claras, transparencia y rendición de cuentas.
De lo contrario, la neutralidad puede convertirse en una censura disfrazada o en una excusa para evitar la responsabilidad.
#Macro Insights#

31
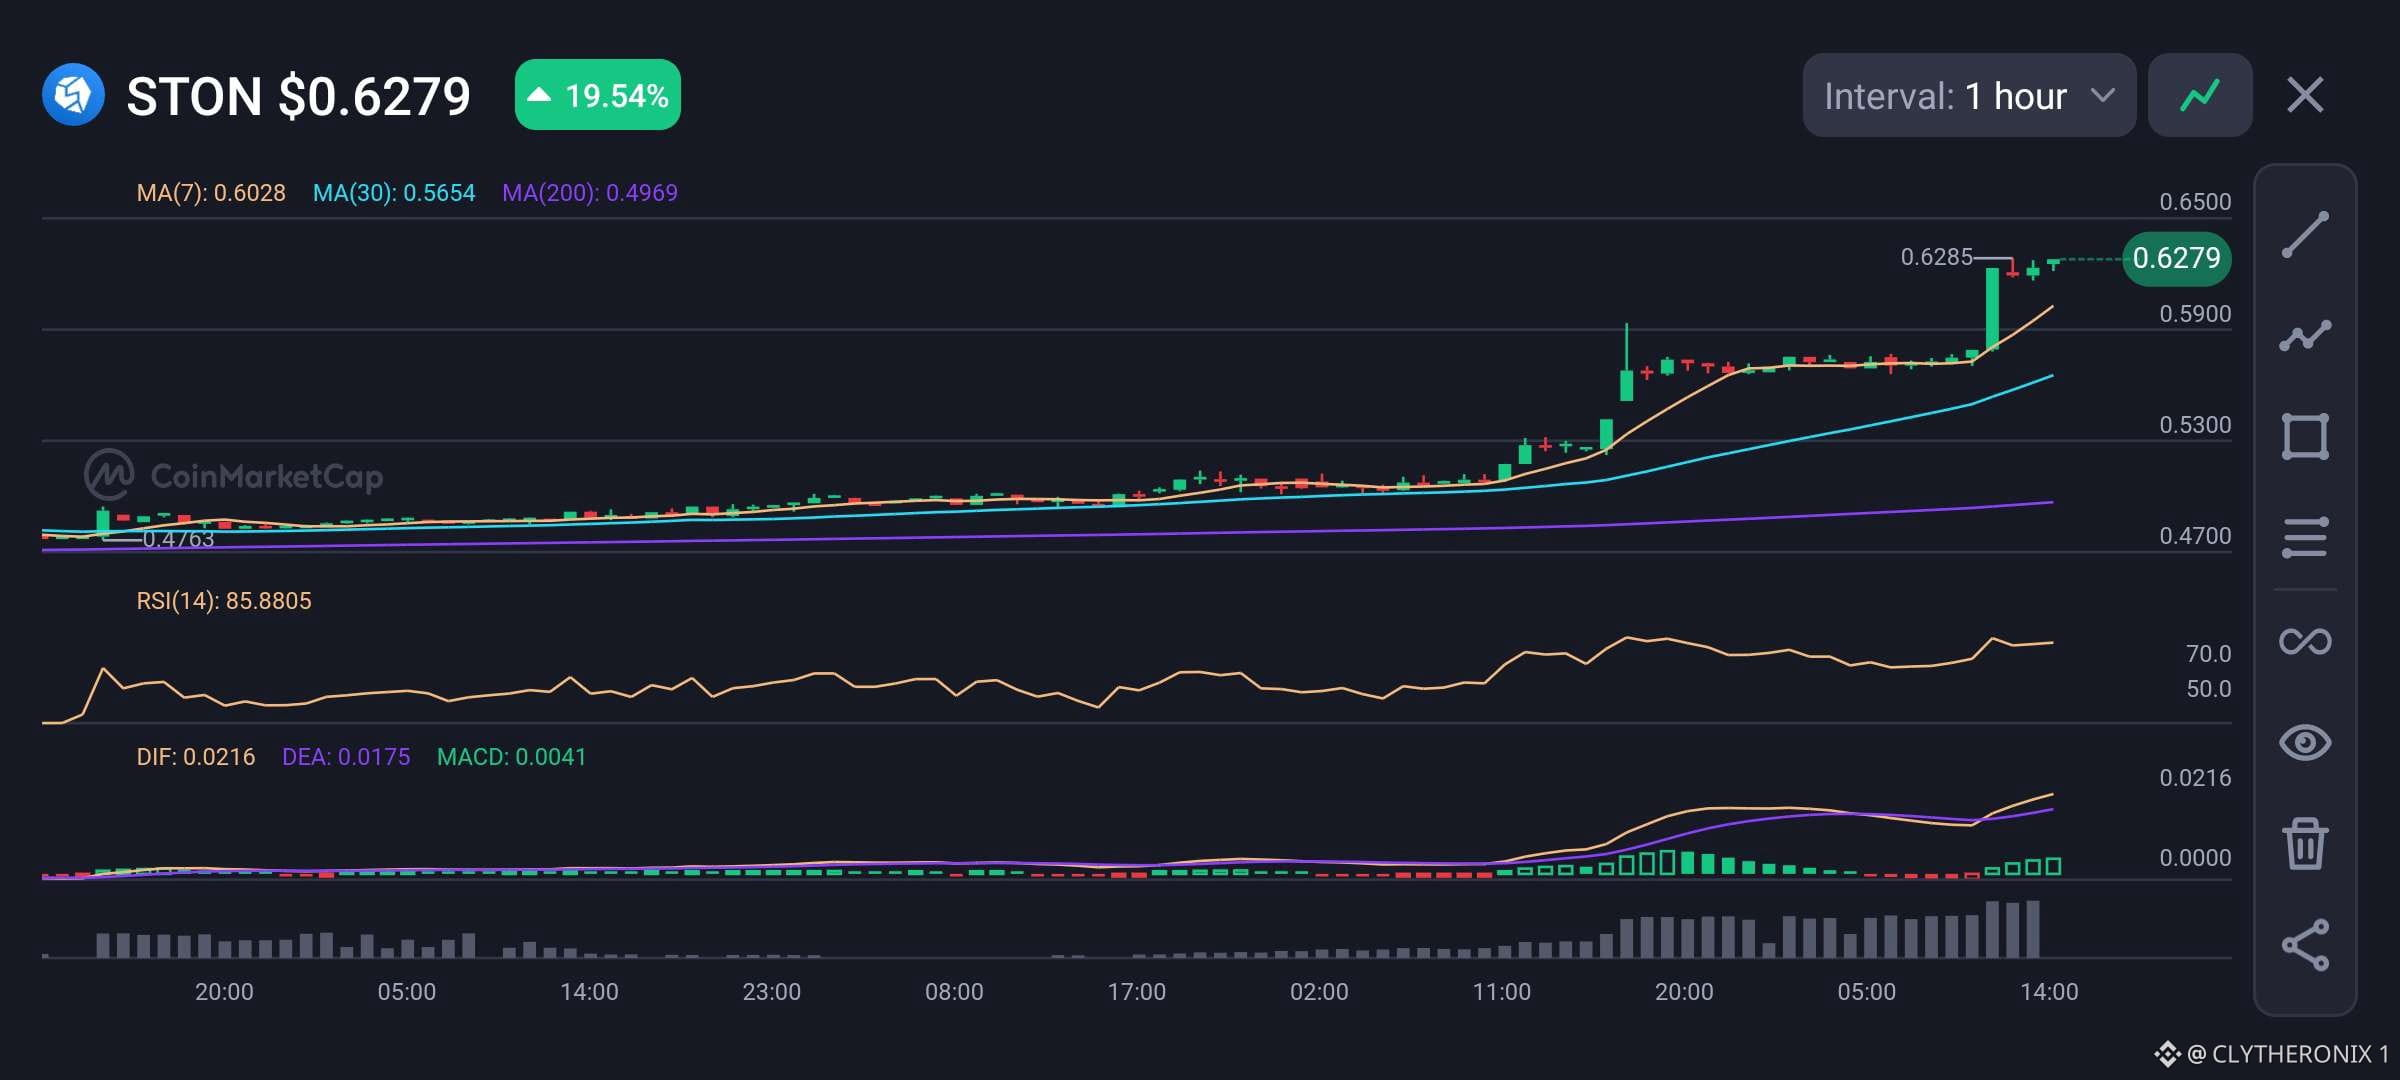
$STON ¡SE ESTÁ ROMPIENDO!
$STON ha experimentado una fuerte ruptura alcista en el gráfico de 1h, superando medias móviles clave para probar máximos locales alrededor de $0.6285.
La actividad en cadena de GeckoTerminal refleja un aumento del interés por la negociación en Stonfi (TON DEX), respaldando el fuerte pico de volumen detrás de esta rápida expansión del precio.
• Precio: $0.6279
• Cambio 24h: +19.54%
• MA(7): $0.6028
• MA(30): $0.5654
• MA(200): $0.4969
• RSI(14): 85.88
• MACD: 0.0041 (Alcista).
La estructura técnica es firmemente alcista ya que el precio cotiza muy por encima de la MA(7), la MA(30) y la MA(200). El histograma positivo del MACD confirma el impulso alcista en expansión.
Sin embargo, una lectura extremadamente alta del RSI(14) de 85.88 indica condiciones de sobrecompra, lo que sugiere una posible consolidación a corto plazo o un retroceso hacia el soporte de las medias móviles.
La resistencia clave se sitúa en $0.6300, mientras que los principales niveles de soporte están en $0.6025 y $0.5650. Mantenerse por encima de $0.6000 mantiene el potencial de continuación alcista.
Esto es trabajo de investigación, no asesoramiento financiero.
$STON ¡SE ESTÁ ROMPIENDO!
$STON ha experimentado una fuerte ruptura alcista en el gráfico de 1h, superando medias móviles clave para probar máximos locales alrededor de $0.6285.
La actividad en cadena de GeckoTerminal refleja un aumento del interés por la negociación en Stonfi (TON DEX), respaldando el fuerte pico de volumen detrás de esta rápida expansión del precio.
• Precio: $0.6279
• Cambio 24h: +19.54%
• MA(7): $0.6028
• MA(30): $0.5654
• MA(200): $0.4969
• RSI(14): 85.88
• MACD: 0.0041 (Alcista).
La estructura técnica es firmemente alcista ya que el precio cotiza muy por encima de la MA(7), la MA(30) y la MA(200). El histograma positivo del MACD confirma el impulso alcista en expansión.
Sin embargo, una lectura extremadamente alta del RSI(14) de 85.88 indica condiciones de sobrecompra, lo que sugiere una posible consolidación a corto plazo o un retroceso hacia el soporte de las medias móviles.
La resistencia clave se sitúa en $0.6300, mientras que los principales niveles de soporte están en $0.6025 y $0.5650. Mantenerse por encima de $0.6000 mantiene el potencial de continuación alcista.
Esto es trabajo de investigación, no asesoramiento financiero.
$STON ha experimentado una fuerte ruptura alcista en el gráfico de 1h, superando medias móviles clave para probar máximos locales alrededor de $0.6285.
La actividad en cadena de GeckoTerminal refleja un aumento del interés por la negociación en Stonfi (TON DEX), respaldando el fuerte pico de volumen detrás de esta rápida expansión del precio.
• Precio: $0.6279
• Cambio 24h: +19.54%
• MA(7): $0.6028
• MA(30): $0.5654
• MA(200): $0.4969
• RSI(14): 85.88
• MACD: 0.0041 (Alcista).
La estructura técnica es firmemente alcista ya que el precio cotiza muy por encima de la MA(7), la MA(30) y la MA(200). El histograma positivo del MACD confirma el impulso alcista en expansión.
Sin embargo, una lectura extremadamente alta del RSI(14) de 85.88 indica condiciones de sobrecompra, lo que sugiere una posible consolidación a corto plazo o un retroceso hacia el soporte de las medias móviles.
La resistencia clave se sitúa en $0.6300, mientras que los principales niveles de soporte están en $0.6025 y $0.5650. Mantenerse por encima de $0.6000 mantiene el potencial de continuación alcista.
Esto es trabajo de investigación, no asesoramiento financiero.
59
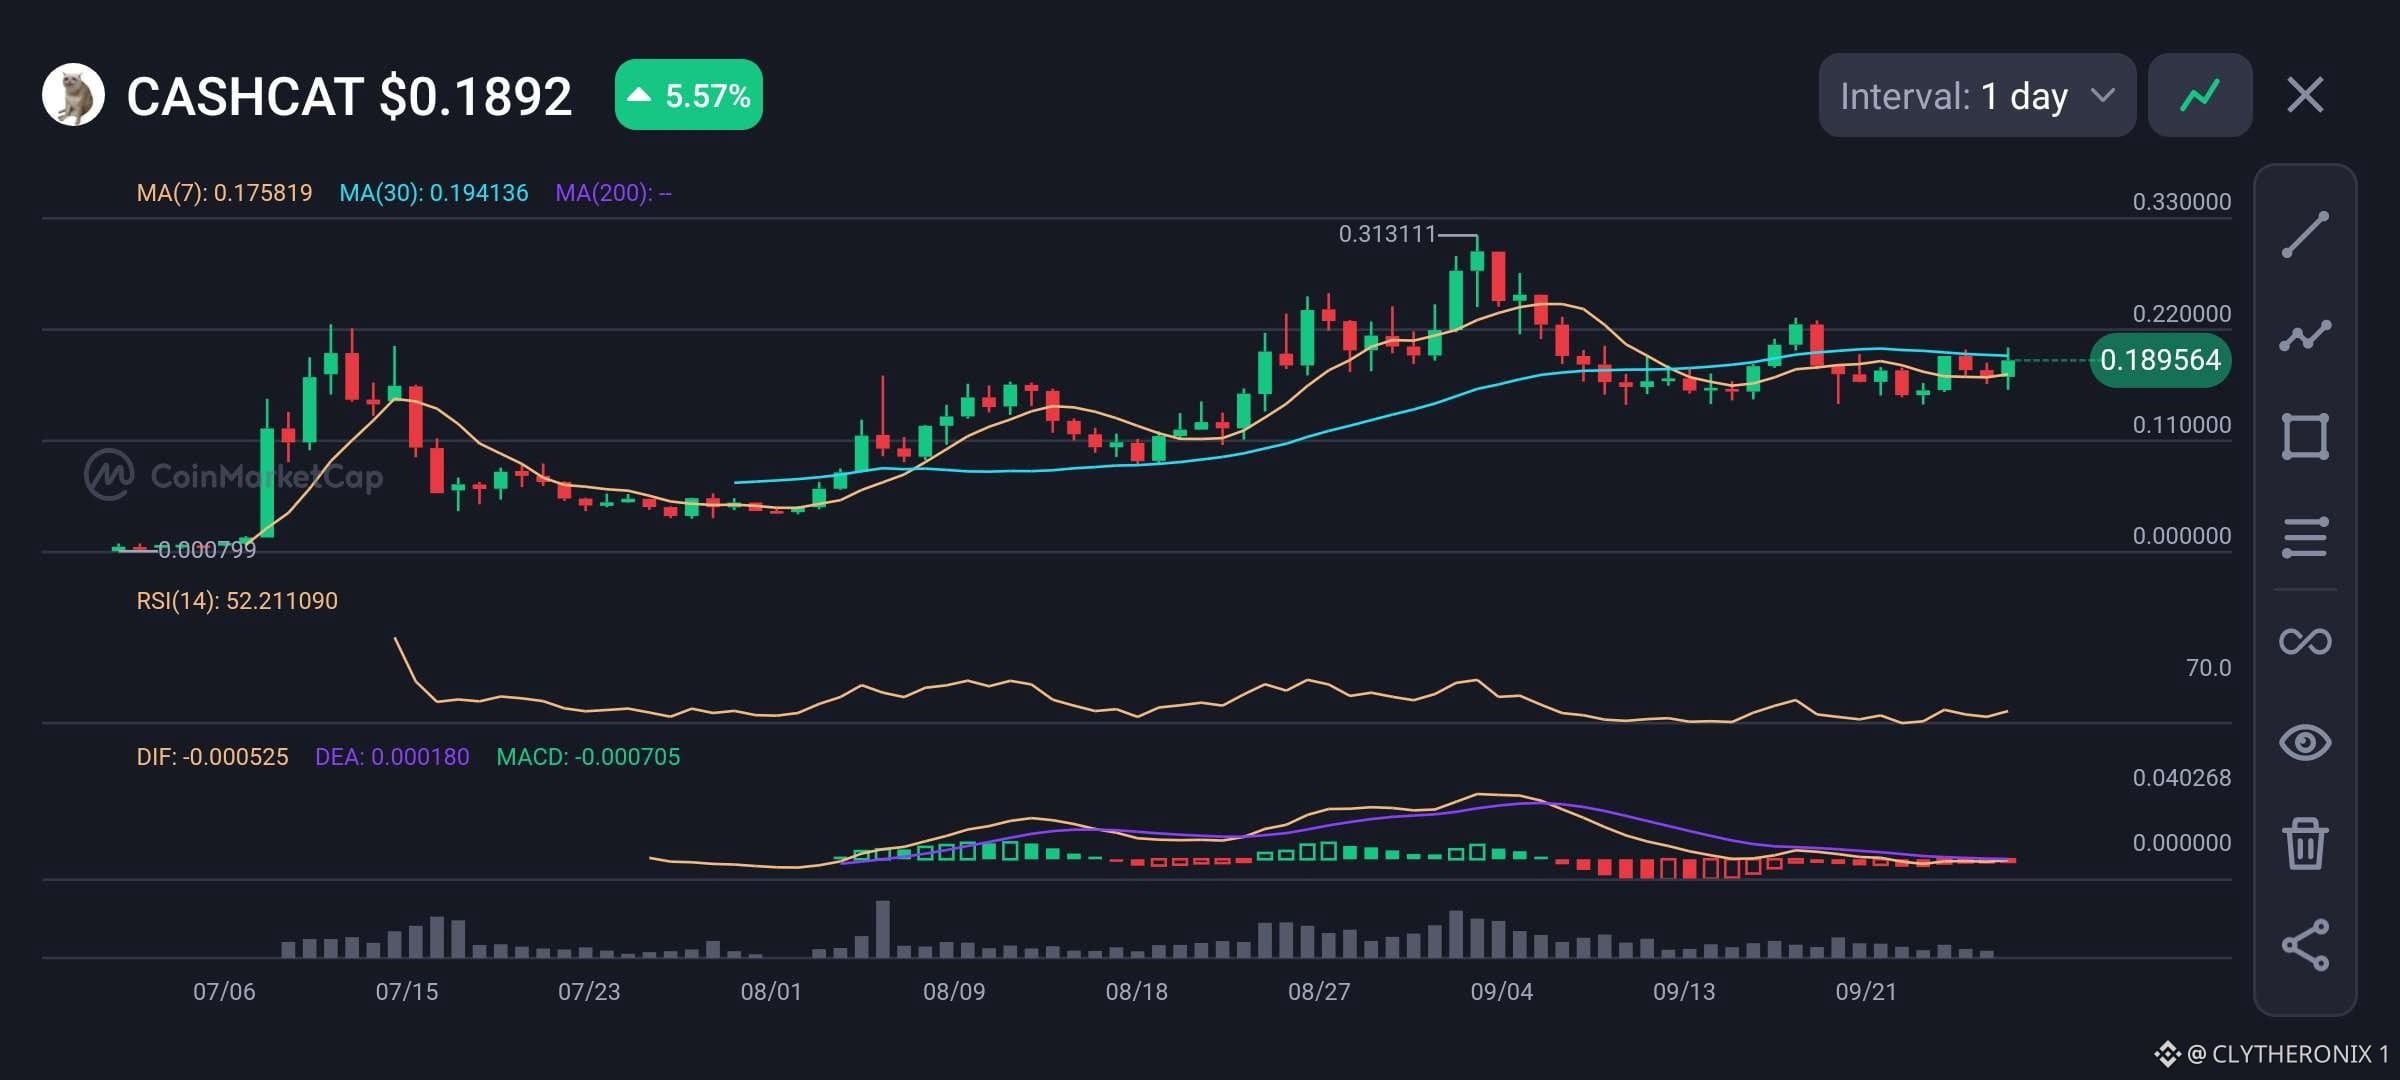
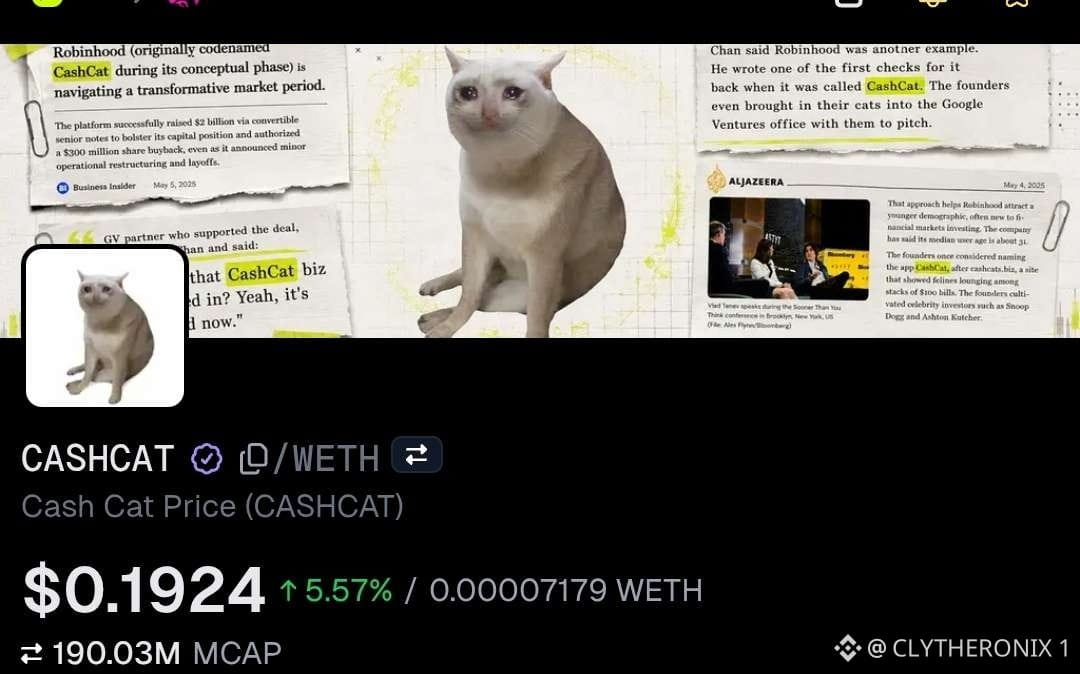
CASHCAT SE CONSOLIDA CERCA DE SOPORTE
$CASHCAT está atravesando una consolidación menor después de probar máximos locales.
Reviso los datos on-chain de GeckoTerminal y veo la liquidez de $5.76M en Uniswap V3, junto con $817.2K en volumen de 24h provenientes de 2,104 transacciones
Las ventas superan ligeramente a las compras (1,082 vs 1,022), pero una base de 112.5K titulares mantiene la estabilidad del precio.
• Precio: $0.1806
• Cambio en 24h: -2.15%
• MA(7): $0.1845
• MA(30): $0.1910
• MA(200): N/A
• RSI(14): 46.5
• MACD: Neutral
La MA(7) está por encima del precio, lo que muestra una ligera presión a la baja, mientras que un RSI de 46.5 confirma un estado de impulso neutral, y la liquidez profunda del pool absorbe la actividad de venta actual con suavidad.
Este gráfico actual indica que $CASHCAT se encuentra en una fase de consolidación neutral por debajo de sus medias móviles de corto plazo; por lo tanto, los traders deberían esperar una ruptura decisiva por encima de la resistencia de $0.2050 o una caída por debajo del soporte de $0.1600 antes de abrir cualquier nueva posición.
Este es un trabajo de investigación, no es asesoramiento financiero.
#Altcoin Season#
CASHCAT SE CONSOLIDA CERCA DE SOPORTE
$CASHCAT está atravesando una consolidación menor después de probar máximos locales.
Reviso los datos on-chain de GeckoTerminal y veo la liquidez de $5.76M en Uniswap V3, junto con $817.2K en volumen de 24h provenientes de 2,104 transacciones
Las ventas superan ligeramente a las compras (1,082 vs 1,022), pero una base de 112.5K titulares mantiene la estabilidad del precio.
• Precio: $0.1806
• Cambio en 24h: -2.15%
• MA(7): $0.1845
• MA(30): $0.1910
• MA(200): N/A
• RSI(14): 46.5
• MACD: Neutral
La MA(7) está por encima del precio, lo que muestra una ligera presión a la baja, mientras que un RSI de 46.5 confirma un estado de impulso neutral, y la liquidez profunda del pool absorbe la actividad de venta actual con suavidad.
Este gráfico actual indica que $CASHCAT se encuentra en una fase de consolidación neutral por debajo de sus medias móviles de corto plazo; por lo tanto, los traders deberían esperar una ruptura decisiva por encima de la resistencia de $0.2050 o una caída por debajo del soporte de $0.1600 antes de abrir cualquier nueva posición.
Este es un trabajo de investigación, no es asesoramiento financiero.
#Altcoin Season#
$CASHCAT está atravesando una consolidación menor después de probar máximos locales.
Reviso los datos on-chain de GeckoTerminal y veo la liquidez de $5.76M en Uniswap V3, junto con $817.2K en volumen de 24h provenientes de 2,104 transacciones
Las ventas superan ligeramente a las compras (1,082 vs 1,022), pero una base de 112.5K titulares mantiene la estabilidad del precio.
• Precio: $0.1806
• Cambio en 24h: -2.15%
• MA(7): $0.1845
• MA(30): $0.1910
• MA(200): N/A
• RSI(14): 46.5
• MACD: Neutral
La MA(7) está por encima del precio, lo que muestra una ligera presión a la baja, mientras que un RSI de 46.5 confirma un estado de impulso neutral, y la liquidez profunda del pool absorbe la actividad de venta actual con suavidad.
Este gráfico actual indica que $CASHCAT se encuentra en una fase de consolidación neutral por debajo de sus medias móviles de corto plazo; por lo tanto, los traders deberían esperar una ruptura decisiva por encima de la resistencia de $0.2050 o una caída por debajo del soporte de $0.1600 antes de abrir cualquier nueva posición.
Este es un trabajo de investigación, no es asesoramiento financiero.
#Altcoin Season#
62
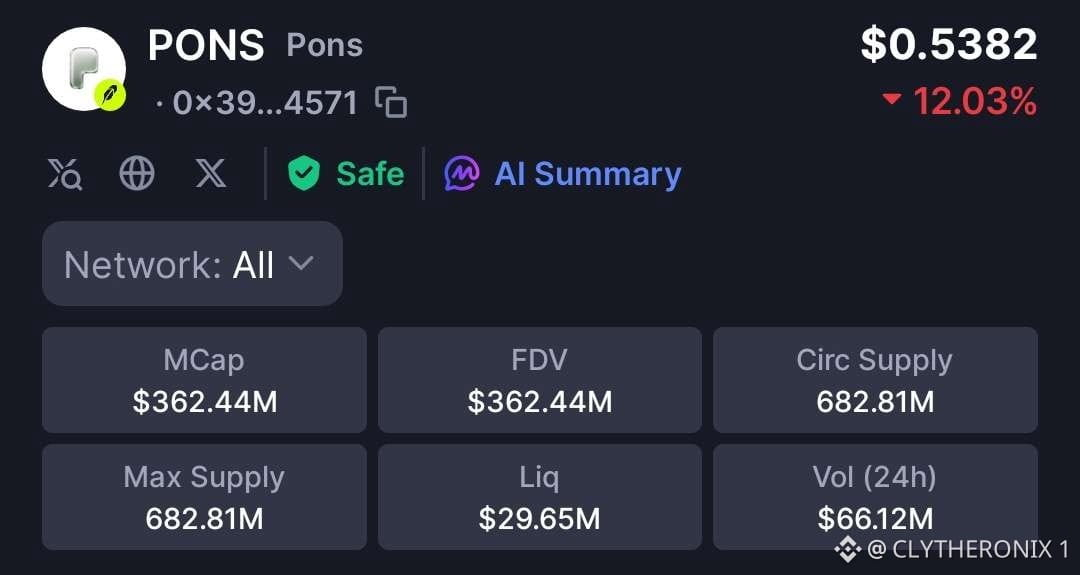
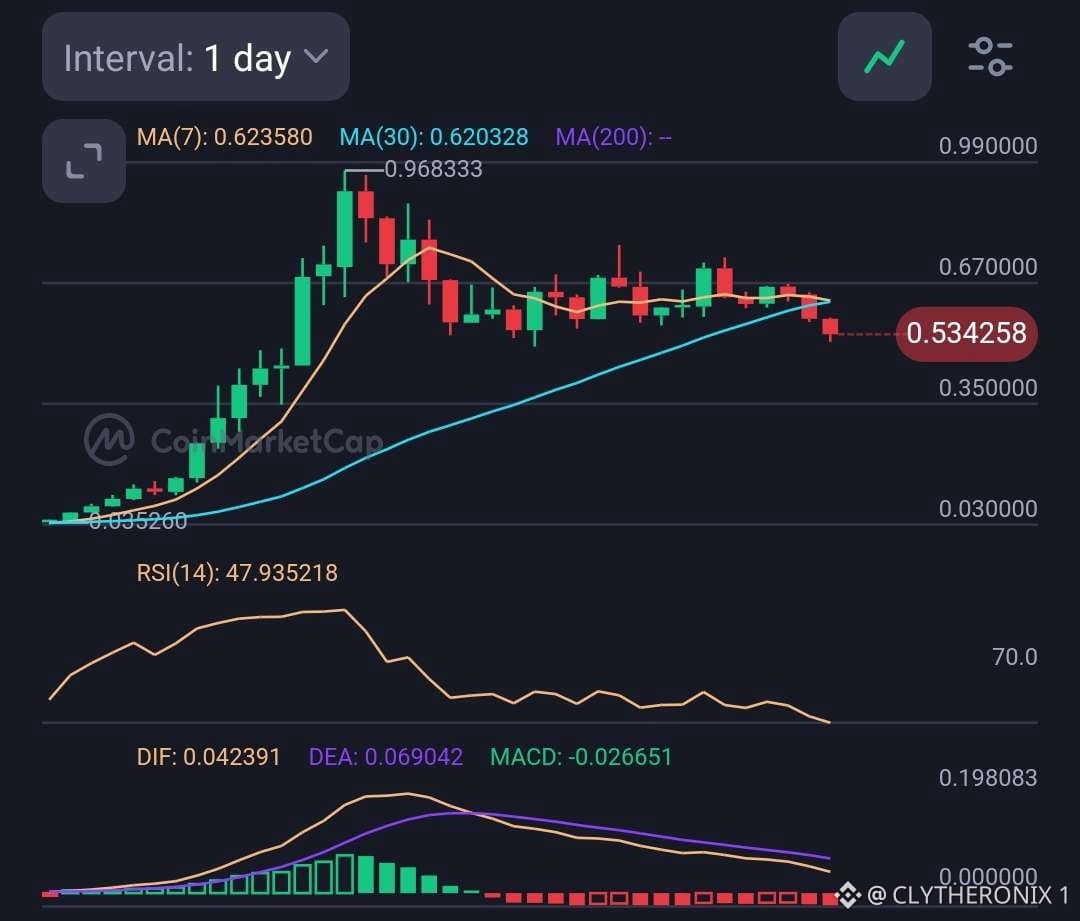
PONS muestra una fase de enfriamiento en el gráfico diario después de su rally anterior. El precio está alrededor de 0,5343 $, situándose por debajo de las medias móviles de 7 días y 30 días.
La actividad en cadena sigue siendo significativa. El principal pool de $PONS/ $WETH en Robinhood Chain ha registrado alrededor de 874K $ en volumen en 24 horas, a través de 1.796 transacciones, con liquidez de aproximadamente 4,1M $ y más de 101.000 holders. La actividad de compra y venta está relativamente equilibrada, con 886 compras frente a 910 ventas.
• Precio: 0,5343 $
• MA(7): 0,6236 $
• MA(30): 0,6203 $
• RSI(14): 47,94
• MACD: -0,0267
La estructura técnica se ha debilitado al moverse el precio por debajo de las medias a corto plazo. El RSI cerca de 48 muestra un impulso bastante equilibrado, mientras que el MACD negativo indica que todavía está presente la presión vendedora a corto plazo.
Pero al observar el gráfico de $PONS, la zona de 0,62 $ es el nivel clave que hay que recuperar. Un movimiento de regreso por encima de las medias de 7 días y 30 días podría mejorar la estructura a corto plazo, mientras que la zona de 0,50 $ sigue siendo un nivel importante si la presión vendedora continúa.
Yo personalmente no estaré operando esto en este momento. Dyor porque esto no es FA.
PONS muestra una fase de enfriamiento en el gráfico diario después de su rally anterior. El precio está alrededor de 0,5343 $, situándose por debajo de las medias móviles de 7 días y 30 días.
La actividad en cadena sigue siendo significativa. El principal pool de $PONS/ $WETH en Robinhood Chain ha registrado alrededor de 874K $ en volumen en 24 horas, a través de 1.796 transacciones, con liquidez de aproximadamente 4,1M $ y más de 101.000 holders. La actividad de compra y venta está relativamente equilibrada, con 886 compras frente a 910 ventas.
• Precio: 0,5343 $
• MA(7): 0,6236 $
• MA(30): 0,6203 $
• RSI(14): 47,94
• MACD: -0,0267
La estructura técnica se ha debilitado al moverse el precio por debajo de las medias a corto plazo. El RSI cerca de 48 muestra un impulso bastante equilibrado, mientras que el MACD negativo indica que todavía está presente la presión vendedora a corto plazo.
Pero al observar el gráfico de $PONS, la zona de 0,62 $ es el nivel clave que hay que recuperar. Un movimiento de regreso por encima de las medias de 7 días y 30 días podría mejorar la estructura a corto plazo, mientras que la zona de 0,50 $ sigue siendo un nivel importante si la presión vendedora continúa.
Yo personalmente no estaré operando esto en este momento. Dyor porque esto no es FA.
La actividad en cadena sigue siendo significativa. El principal pool de $PONS/ $WETH en Robinhood Chain ha registrado alrededor de 874K $ en volumen en 24 horas, a través de 1.796 transacciones, con liquidez de aproximadamente 4,1M $ y más de 101.000 holders. La actividad de compra y venta está relativamente equilibrada, con 886 compras frente a 910 ventas.
• Precio: 0,5343 $
• MA(7): 0,6236 $
• MA(30): 0,6203 $
• RSI(14): 47,94
• MACD: -0,0267
La estructura técnica se ha debilitado al moverse el precio por debajo de las medias a corto plazo. El RSI cerca de 48 muestra un impulso bastante equilibrado, mientras que el MACD negativo indica que todavía está presente la presión vendedora a corto plazo.
Pero al observar el gráfico de $PONS, la zona de 0,62 $ es el nivel clave que hay que recuperar. Un movimiento de regreso por encima de las medias de 7 días y 30 días podría mejorar la estructura a corto plazo, mientras que la zona de 0,50 $ sigue siendo un nivel importante si la presión vendedora continúa.
Yo personalmente no estaré operando esto en este momento. Dyor porque esto no es FA.
178
Ver traducción
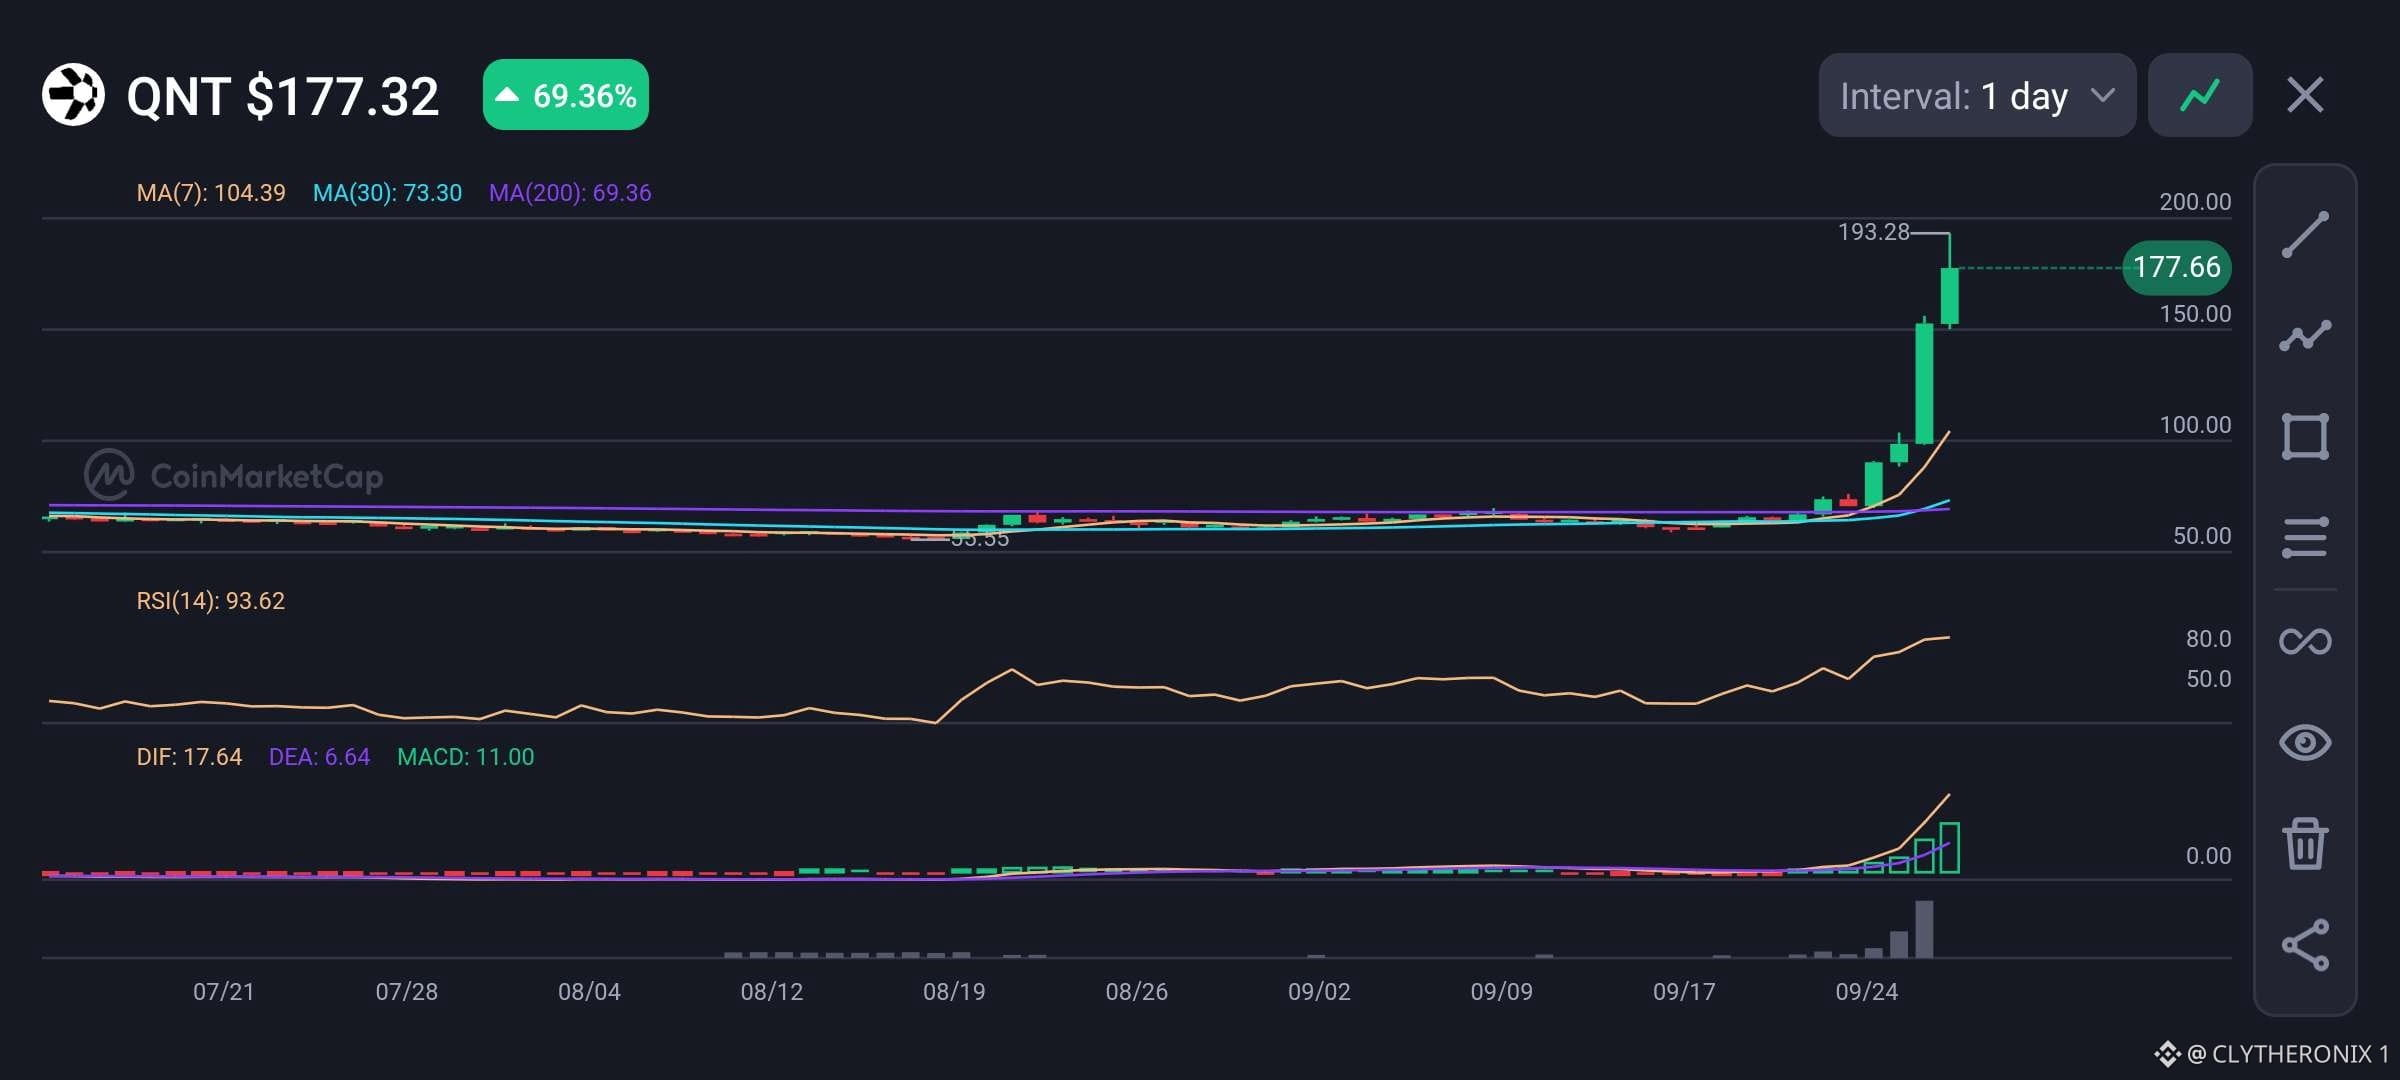
Quant is showing a powerful breakout on the daily chart, trading around $177.32 after gaining 69.36%. The move has pushed price far above its major moving averages and comes with a sharp increase in volume.
Social sentiment has also turned strongly bullish around $QNT. Recent coverage links the rally to Quant's selection by The Clearing House for its tokenized deposit initiative, while social discussions focus on institutional adoption, interoperability, and supply scarcity.
• Price: $177.32
• 24h gain: +69.36%
• MA(7): $104.39
• MA(30): $73.30
• MA(200): $69.36
• RSI(14): 93.62
• MACD: 11.00
Technically, the trend is extremely strong. Price has broken far above the 7, 30, and 200-day moving averages, while MACD is strongly positive and expanding. However, RSI at 93.62 shows extremely overbought conditions, so a period of profit taking or consolidation would not be surprising.
$QNT recent high around $193.28 is the key resistance. If momentum cools, the $150 area and then the $104 MA(7) become important levels to watch.
#Altcoin Season#
Quant is showing a powerful breakout on the daily chart, trading around $177.32 after gaining 69.36%. The move has pushed price far above its major moving averages and comes with a sharp increase in volume.
Social sentiment has also turned strongly bullish around $QNT. Recent coverage links the rally to Quant's selection by The Clearing House for its tokenized deposit initiative, while social discussions focus on institutional adoption, interoperability, and supply scarcity.
• Price: $177.32
• 24h gain: +69.36%
• MA(7): $104.39
• MA(30): $73.30
• MA(200): $69.36
• RSI(14): 93.62
• MACD: 11.00
Technically, the trend is extremely strong. Price has broken far above the 7, 30, and 200-day moving averages, while MACD is strongly positive and expanding. However, RSI at 93.62 shows extremely overbought conditions, so a period of profit taking or consolidation would not be surprising.
$QNT recent high around $193.28 is the key resistance. If momentum cools, the $150 area and then the $104 MA(7) become important levels to watch.
#Altcoin Season#
Social sentiment has also turned strongly bullish around $QNT. Recent coverage links the rally to Quant's selection by The Clearing House for its tokenized deposit initiative, while social discussions focus on institutional adoption, interoperability, and supply scarcity.
• Price: $177.32
• 24h gain: +69.36%
• MA(7): $104.39
• MA(30): $73.30
• MA(200): $69.36
• RSI(14): 93.62
• MACD: 11.00
Technically, the trend is extremely strong. Price has broken far above the 7, 30, and 200-day moving averages, while MACD is strongly positive and expanding. However, RSI at 93.62 shows extremely overbought conditions, so a period of profit taking or consolidation would not be surprising.
$QNT recent high around $193.28 is the key resistance. If momentum cools, the $150 area and then the $104 MA(7) become important levels to watch.
#Altcoin Season#
73
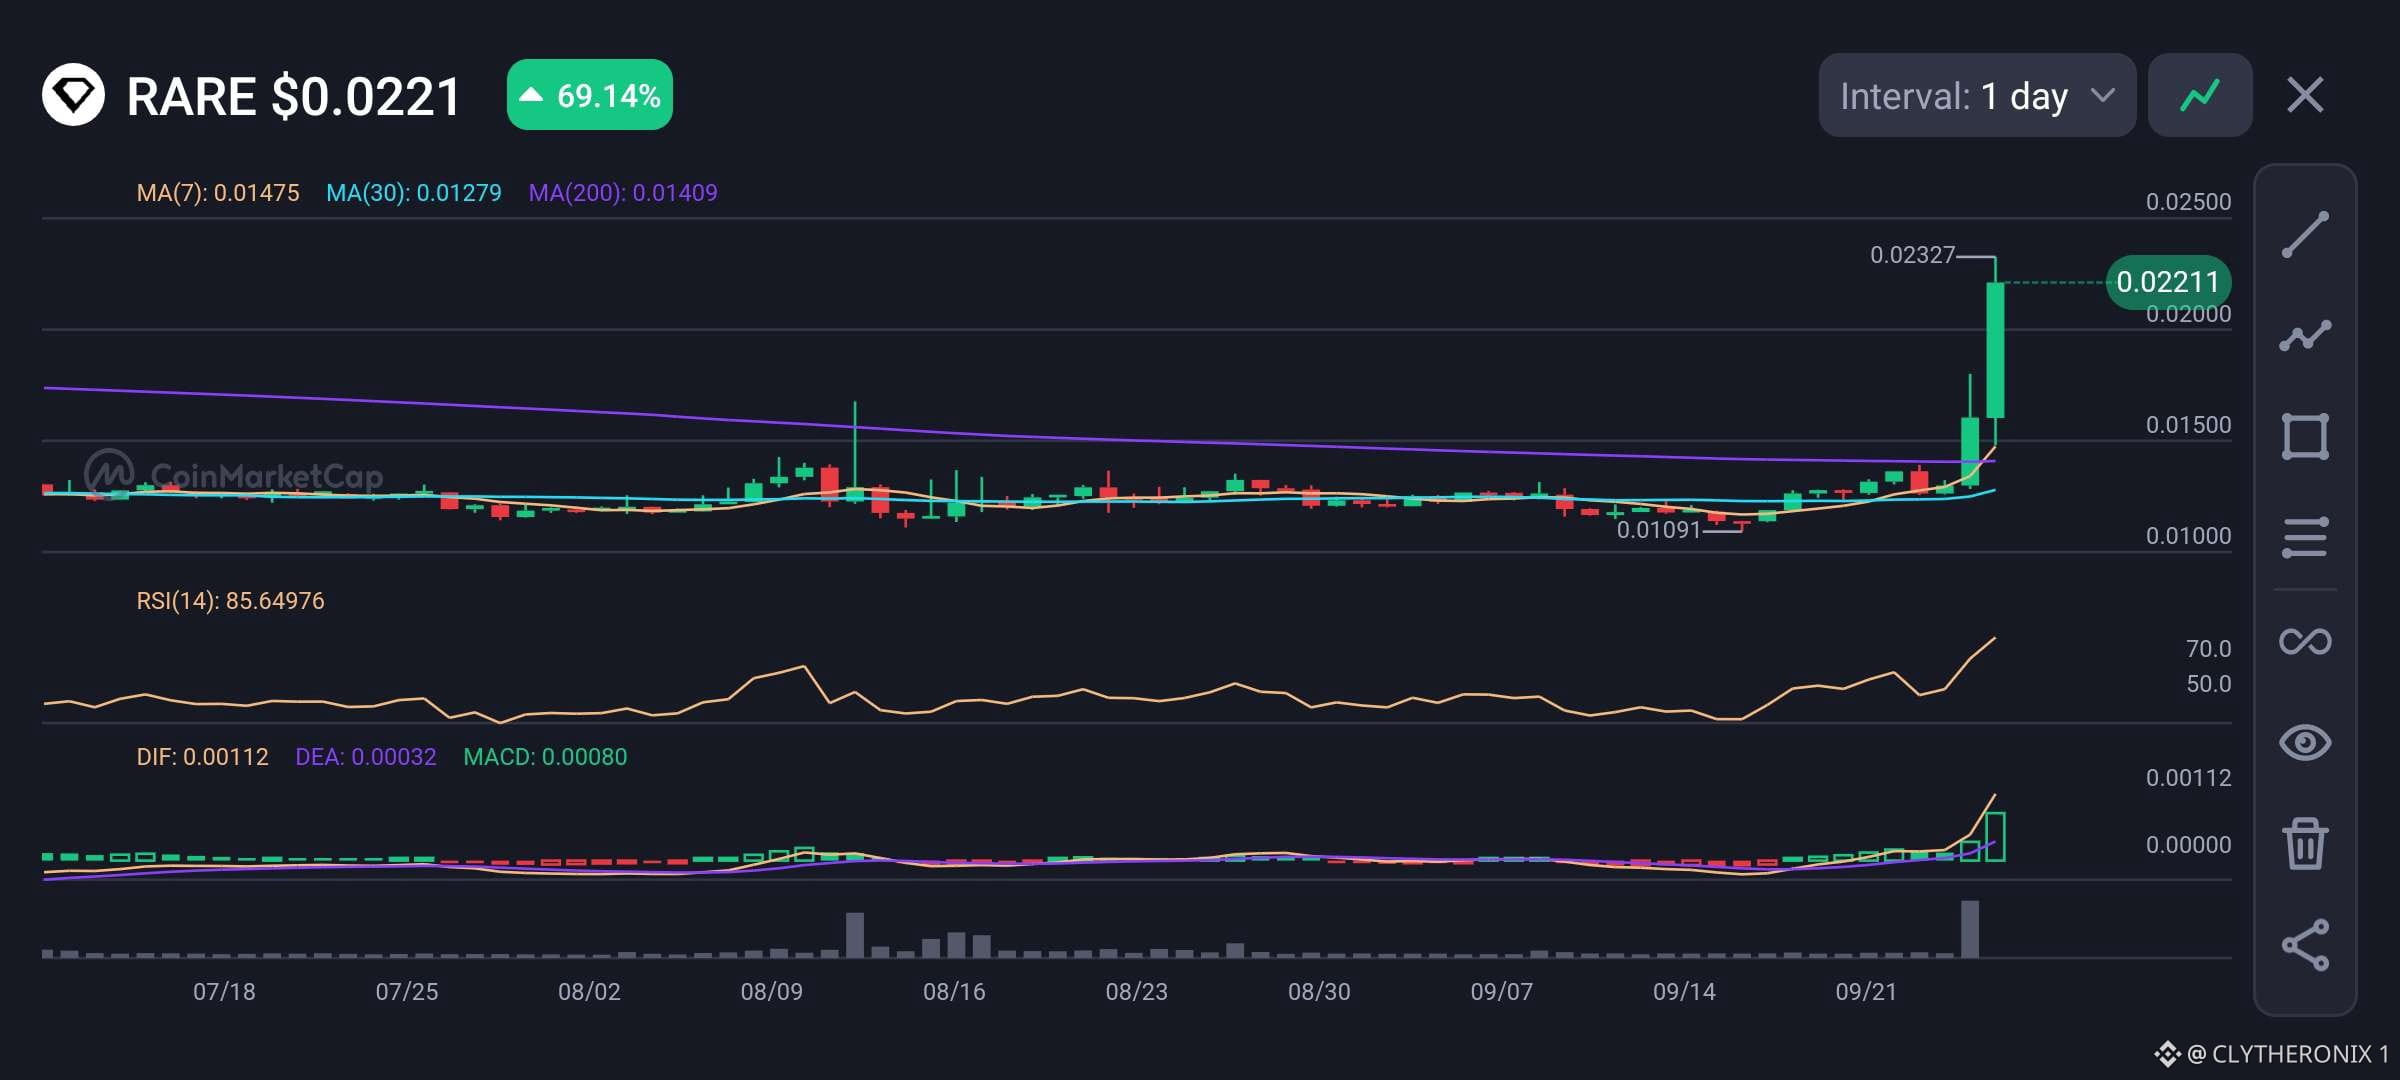
SUPERRARE muestra una ruptura importante en el gráfico diario, cotizando alrededor de $0.0221 después de ganar 69.14%.
• Precio: $0.0221
• Ganancia 24h: +69.14%
• MA(7): $0.01475
• MA(30): $0.01279
• MA(200): $0.01409
• RSI(14): 85.65
• MACD: 0.00080
El precio se ha movido con fuerza por encima de las tres medias móviles, confirmando un cambio sólido en el impulso a corto plazo. La ruptura también está respaldada por un aumento importante del volumen de operaciones, lo que sugiere una fuerte actividad de compra detrás del movimiento.
El MACD se ha vuelto con fuerza positivo y está subiendo, aportando una confirmación adicional del impulso alcista. Sin embargo, el RSI en 85.65 está muy sobrecomprado, por lo que el riesgo de toma de ganancias y un retroceso a corto plazo ahora es más elevado.
El máximo reciente alrededor de $0.02327 es la resistencia inmediata a vigilar. Si $RARE rompe y se mantiene por encima de ese nivel, el movimiento podría continuar. En el lado negativo, $0.01475 alrededor de la MA de 7 días es una zona de soporte importante si el mercado empieza a enfriarse.
#Altcoin Season#
SUPERRARE muestra una ruptura importante en el gráfico diario, cotizando alrededor de $0.0221 después de ganar 69.14%.
• Precio: $0.0221
• Ganancia 24h: +69.14%
• MA(7): $0.01475
• MA(30): $0.01279
• MA(200): $0.01409
• RSI(14): 85.65
• MACD: 0.00080
El precio se ha movido con fuerza por encima de las tres medias móviles, confirmando un cambio sólido en el impulso a corto plazo. La ruptura también está respaldada por un aumento importante del volumen de operaciones, lo que sugiere una fuerte actividad de compra detrás del movimiento.
El MACD se ha vuelto con fuerza positivo y está subiendo, aportando una confirmación adicional del impulso alcista. Sin embargo, el RSI en 85.65 está muy sobrecomprado, por lo que el riesgo de toma de ganancias y un retroceso a corto plazo ahora es más elevado.
El máximo reciente alrededor de $0.02327 es la resistencia inmediata a vigilar. Si $RARE rompe y se mantiene por encima de ese nivel, el movimiento podría continuar. En el lado negativo, $0.01475 alrededor de la MA de 7 días es una zona de soporte importante si el mercado empieza a enfriarse.
#Altcoin Season#
• Precio: $0.0221
• Ganancia 24h: +69.14%
• MA(7): $0.01475
• MA(30): $0.01279
• MA(200): $0.01409
• RSI(14): 85.65
• MACD: 0.00080
El precio se ha movido con fuerza por encima de las tres medias móviles, confirmando un cambio sólido en el impulso a corto plazo. La ruptura también está respaldada por un aumento importante del volumen de operaciones, lo que sugiere una fuerte actividad de compra detrás del movimiento.
El MACD se ha vuelto con fuerza positivo y está subiendo, aportando una confirmación adicional del impulso alcista. Sin embargo, el RSI en 85.65 está muy sobrecomprado, por lo que el riesgo de toma de ganancias y un retroceso a corto plazo ahora es más elevado.
El máximo reciente alrededor de $0.02327 es la resistencia inmediata a vigilar. Si $RARE rompe y se mantiene por encima de ese nivel, el movimiento podría continuar. En el lado negativo, $0.01475 alrededor de la MA de 7 días es una zona de soporte importante si el mercado empieza a enfriarse.
#Altcoin Season#
51
Si guardas cripto en Bitget, mereces perderla.
Pero para Bitcoin, este hack de $351M en realidad es alcista. Cada colapso de un exchange vuelca el pánico a corto plazo sobre los precios de $BTC, empujando a las manos débiles a vender. Aun así, prueba sin piedad el propósito central de Bitcoin: la autocustodia. Los exchanges centralizados son solo bancos depredadores y no regulados.
Cuando bloquean los retiros, se rompen las ilusiones del “bitcoin en papel”, y el $BTC real se transfiere a almacenamiento en frío.
Deja de llorar por fondos congelados cuando fuiste demasiado perezoso para comprar una wallet de hardware.
BTC sobrevive gracias a la criptografía, no a intermediarios parásitos.
Toma posesión de tus claves 🔑.
Si guardas cripto en Bitget, mereces perderla.
Pero para Bitcoin, este hack de $351M en realidad es alcista. Cada colapso de un exchange vuelca el pánico a corto plazo sobre los precios de $BTC, empujando a las manos débiles a vender. Aun así, prueba sin piedad el propósito central de Bitcoin: la autocustodia. Los exchanges centralizados son solo bancos depredadores y no regulados.
Cuando bloquean los retiros, se rompen las ilusiones del “bitcoin en papel”, y el $BTC real se transfiere a almacenamiento en frío.
Deja de llorar por fondos congelados cuando fuiste demasiado perezoso para comprar una wallet de hardware.
BTC sobrevive gracias a la criptografía, no a intermediarios parásitos.
Toma posesión de tus claves 🔑.
Pero para Bitcoin, este hack de $351M en realidad es alcista. Cada colapso de un exchange vuelca el pánico a corto plazo sobre los precios de $BTC, empujando a las manos débiles a vender. Aun así, prueba sin piedad el propósito central de Bitcoin: la autocustodia. Los exchanges centralizados son solo bancos depredadores y no regulados.
Cuando bloquean los retiros, se rompen las ilusiones del “bitcoin en papel”, y el $BTC real se transfiere a almacenamiento en frío.
Deja de llorar por fondos congelados cuando fuiste demasiado perezoso para comprar una wallet de hardware.
BTC sobrevive gracias a la criptografía, no a intermediarios parásitos.
Toma posesión de tus claves 🔑.
28
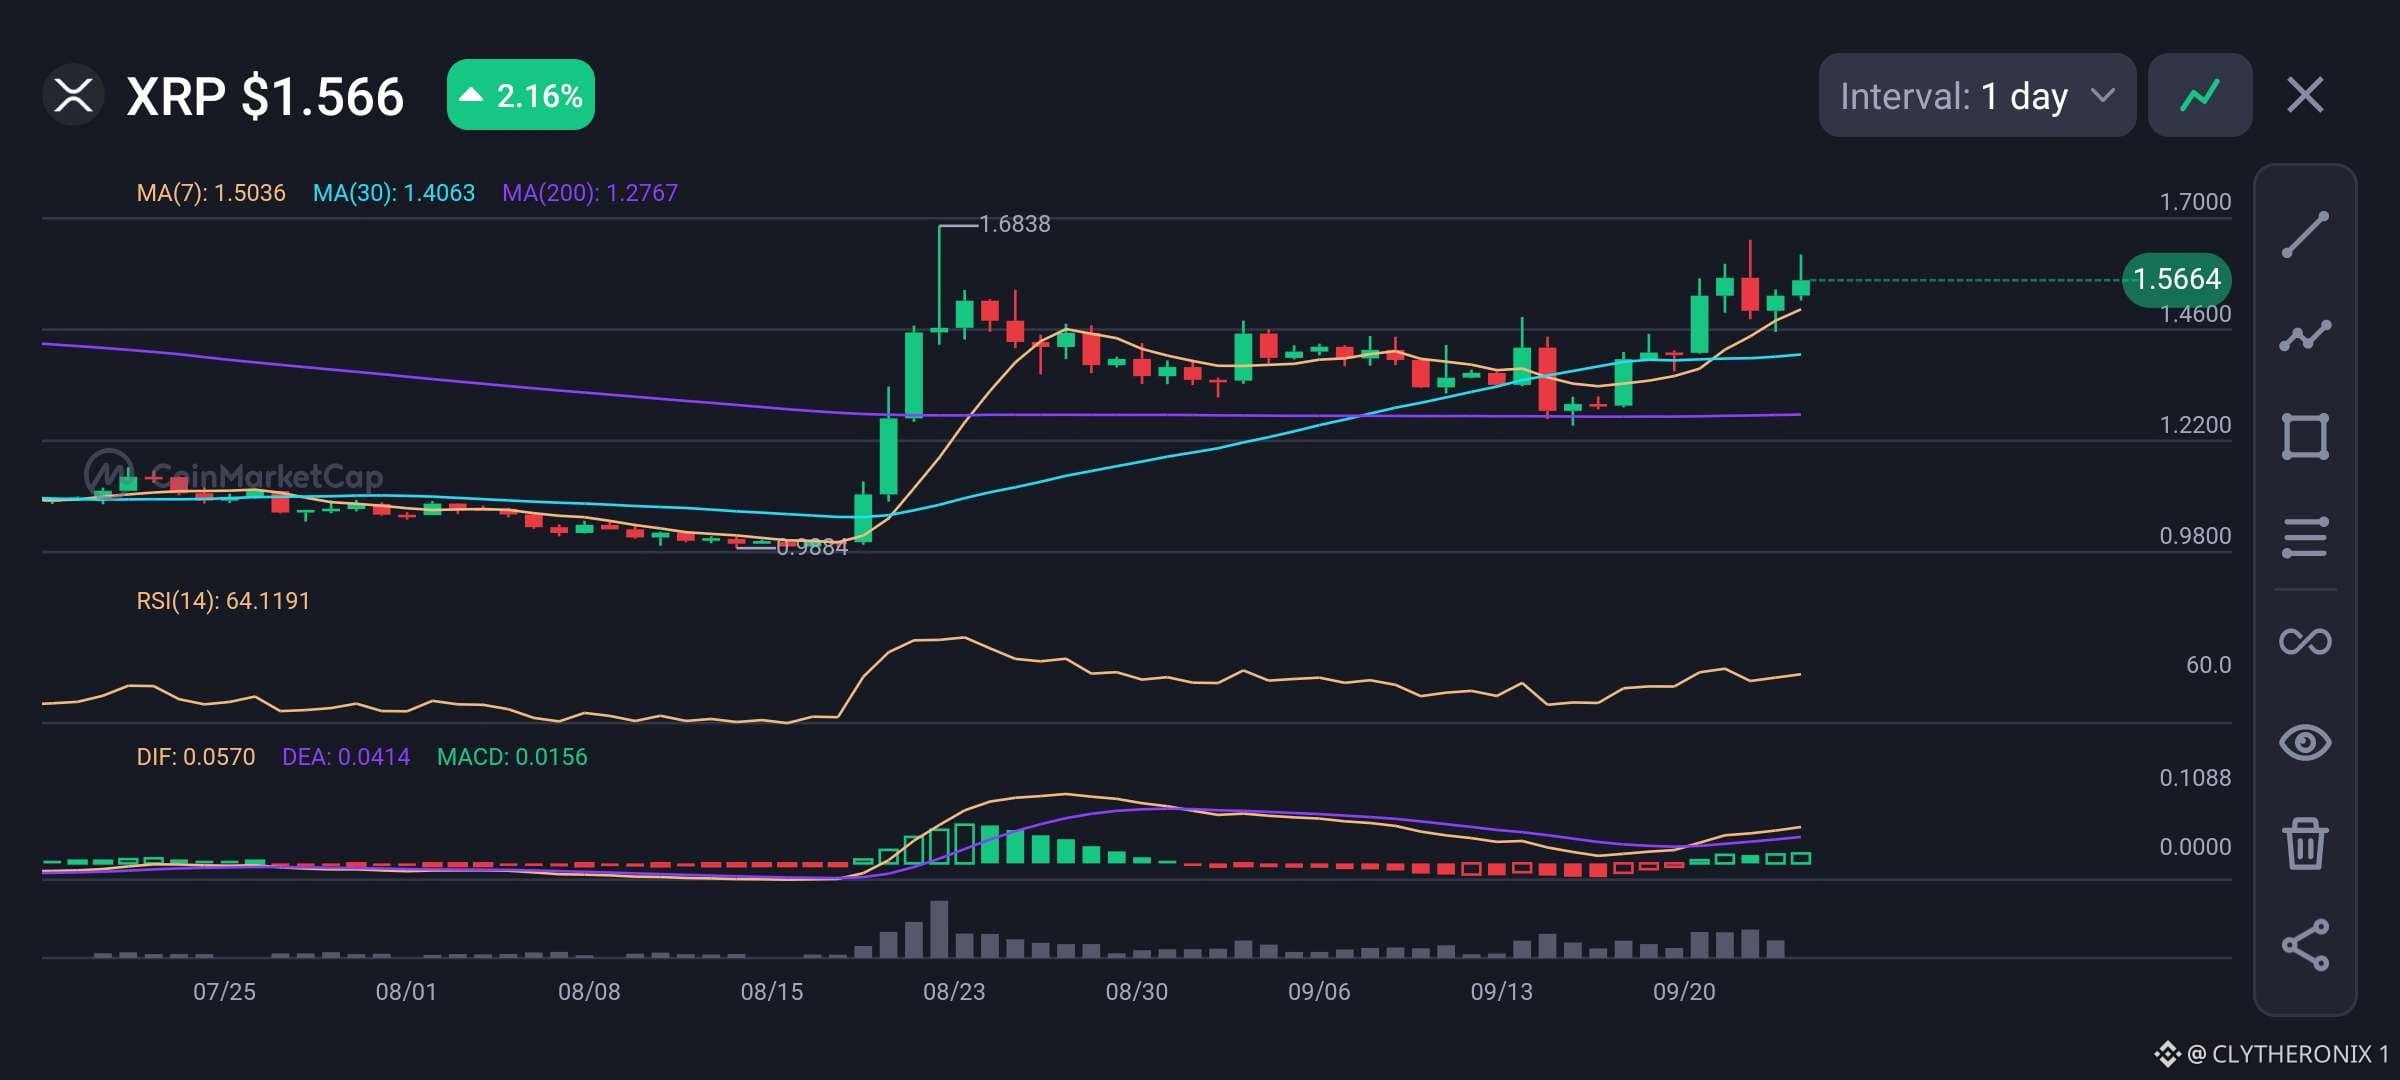
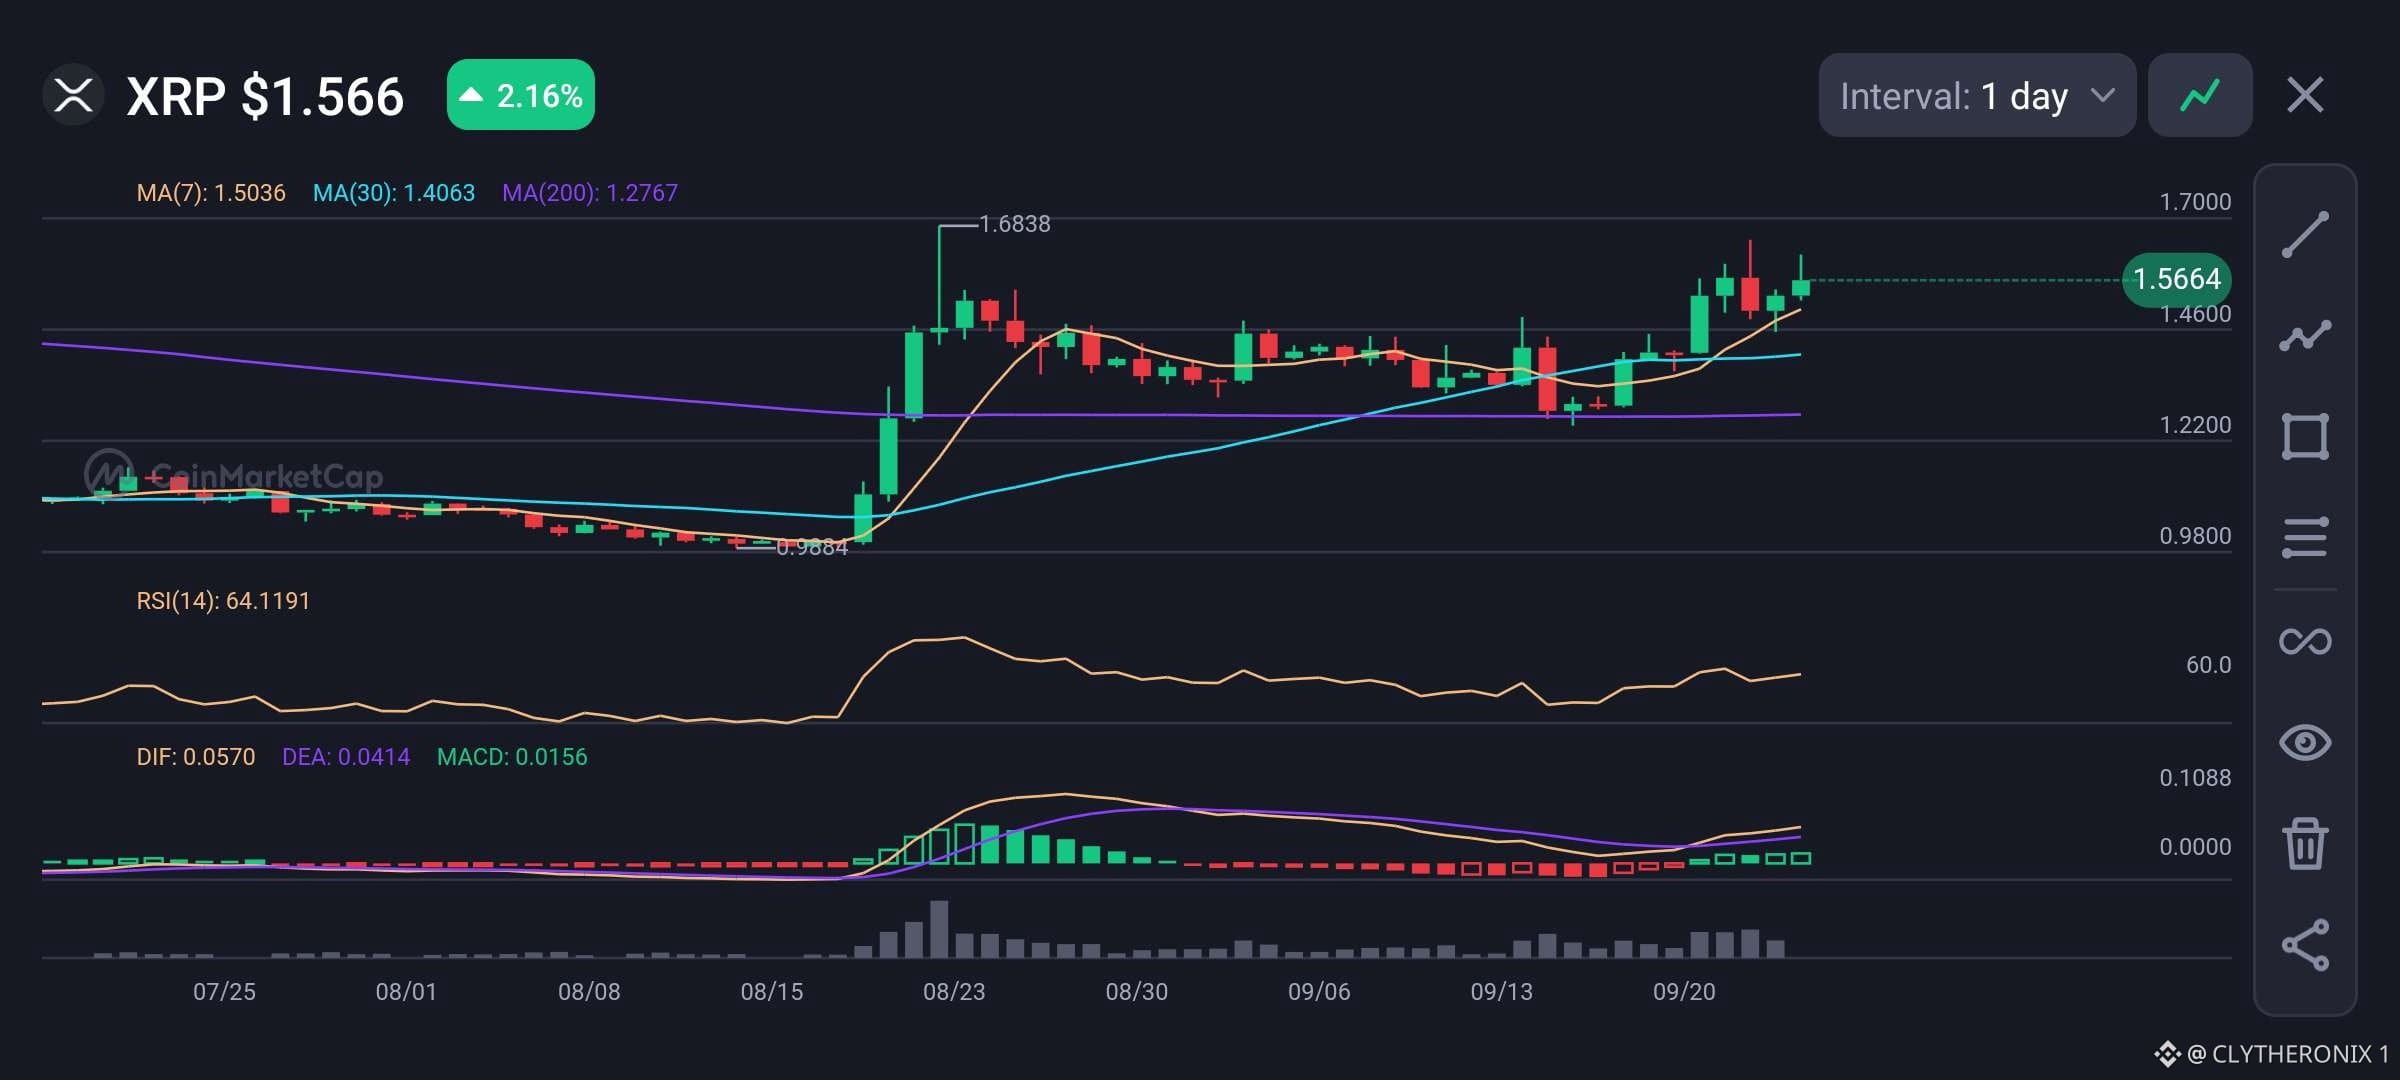
XRP cotiza actualmente a $1.566 tras una ganancia de precio del 2.16% en el gráfico diario.
La tendencia principal se mantiene con fuerza alcista, ya que el precio permanece por encima de niveles clave de soporte.
La Media Móvil de 7 días se sitúa en $1.5036, la Media Móvil de 30 días está en $1.4063 y la Media Móvil de 200 días en $1.2767.
El soporte a corto plazo está cerca de la línea de 7 días en $1.5036, mientras que la resistencia principal está en $1.6838.
El RSI de 14 períodos está en 64.12, lo que muestra un impulso de compra saludable sin llegar a niveles de sobrecompra para $XRP.
El indicador MACD sigue siendo positivo, con DIF en 0.0570 por encima de DEA en 0.0414, lo que da un valor verde de MACD de 0.0156.
Si los compradores mantienen el nivel de soporte de $1.5036, $XRP puede volver a subir hacia $1.6838. Sin embargo, si cae por debajo de este nivel, podría empujar el precio hacia abajo para probar $1.4063.
#Altcoin Season#
XRP cotiza actualmente a $1.566 tras una ganancia de precio del 2.16% en el gráfico diario.
La tendencia principal se mantiene con fuerza alcista, ya que el precio permanece por encima de niveles clave de soporte.
La Media Móvil de 7 días se sitúa en $1.5036, la Media Móvil de 30 días está en $1.4063 y la Media Móvil de 200 días en $1.2767.
El soporte a corto plazo está cerca de la línea de 7 días en $1.5036, mientras que la resistencia principal está en $1.6838.
El RSI de 14 períodos está en 64.12, lo que muestra un impulso de compra saludable sin llegar a niveles de sobrecompra para $XRP.
El indicador MACD sigue siendo positivo, con DIF en 0.0570 por encima de DEA en 0.0414, lo que da un valor verde de MACD de 0.0156.
Si los compradores mantienen el nivel de soporte de $1.5036, $XRP puede volver a subir hacia $1.6838. Sin embargo, si cae por debajo de este nivel, podría empujar el precio hacia abajo para probar $1.4063.
#Altcoin Season#
La tendencia principal se mantiene con fuerza alcista, ya que el precio permanece por encima de niveles clave de soporte.
La Media Móvil de 7 días se sitúa en $1.5036, la Media Móvil de 30 días está en $1.4063 y la Media Móvil de 200 días en $1.2767.
El soporte a corto plazo está cerca de la línea de 7 días en $1.5036, mientras que la resistencia principal está en $1.6838.
El RSI de 14 períodos está en 64.12, lo que muestra un impulso de compra saludable sin llegar a niveles de sobrecompra para $XRP.
El indicador MACD sigue siendo positivo, con DIF en 0.0570 por encima de DEA en 0.0414, lo que da un valor verde de MACD de 0.0156.
Si los compradores mantienen el nivel de soporte de $1.5036, $XRP puede volver a subir hacia $1.6838. Sin embargo, si cae por debajo de este nivel, podría empujar el precio hacia abajo para probar $1.4063.
#Altcoin Season#
39
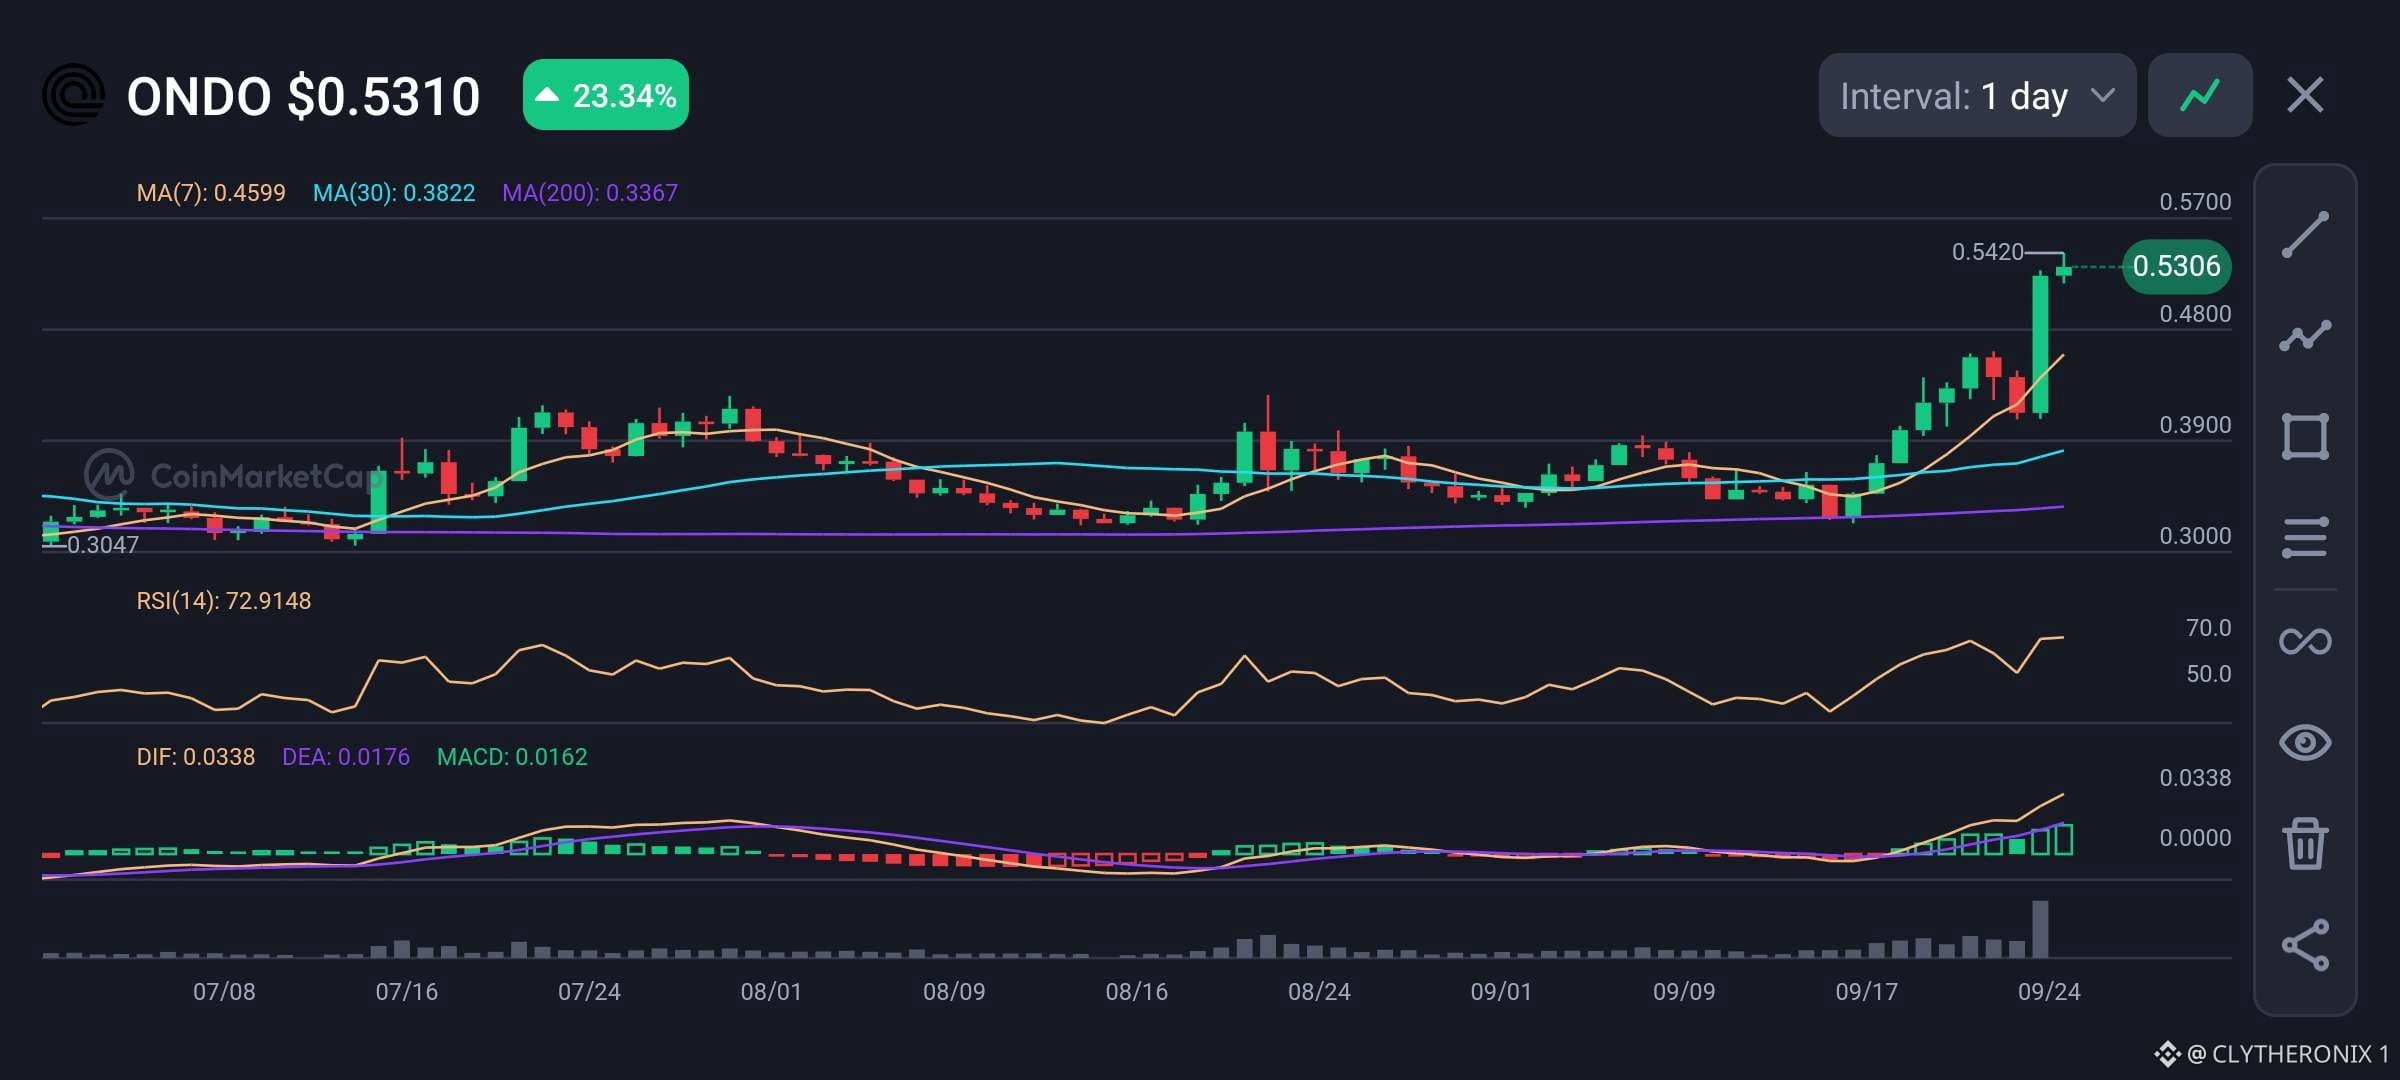
ONDO muestra un fuerte impulso alcista en el gráfico diario, cotizando alrededor de $0.5310 después de ganar un 23.34%.
• Precio: $0.5310
• Ganancia 24h: +23.34%
• MA(7): $0.4599
• MA(30): $0.3822
• MA(200): $0.3367
• RSI(14): 72.91
• MACD: 0.0162
$ONDO ha subido bien por encima de las medias móviles de 7 días, 30 días y 200 días, lo que indica que los compradores tienen firmemente el control de la tendencia actual. Las velas recientes también vinieron con un aumento claro del volumen de operaciones, respaldando la solidez de la ruptura.
El MACD es positivo y está en aumento, lo que añade confirmación adicional al impulso actual. Sin embargo, el RSI está en 72.91, colocando a ONDO en territorio de sobrecompra. Esto significa que el precio podría ver alguna toma de ganancias o una consolidación a corto plazo después de un movimiento tan fuerte.
La zona de $0.480 es un nivel importante a vigilar, mientras que la MA de 7 días alrededor de $0.4599 podría actuar como un soporte más profundo. Mantener estos niveles mantendría intacta la estructura alcista actual, mientras que un rechazo desde el máximo reciente podría llevar a una corrección temporal.
#Macro Insights#
ONDO muestra un fuerte impulso alcista en el gráfico diario, cotizando alrededor de $0.5310 después de ganar un 23.34%.
• Precio: $0.5310
• Ganancia 24h: +23.34%
• MA(7): $0.4599
• MA(30): $0.3822
• MA(200): $0.3367
• RSI(14): 72.91
• MACD: 0.0162
$ONDO ha subido bien por encima de las medias móviles de 7 días, 30 días y 200 días, lo que indica que los compradores tienen firmemente el control de la tendencia actual. Las velas recientes también vinieron con un aumento claro del volumen de operaciones, respaldando la solidez de la ruptura.
El MACD es positivo y está en aumento, lo que añade confirmación adicional al impulso actual. Sin embargo, el RSI está en 72.91, colocando a ONDO en territorio de sobrecompra. Esto significa que el precio podría ver alguna toma de ganancias o una consolidación a corto plazo después de un movimiento tan fuerte.
La zona de $0.480 es un nivel importante a vigilar, mientras que la MA de 7 días alrededor de $0.4599 podría actuar como un soporte más profundo. Mantener estos niveles mantendría intacta la estructura alcista actual, mientras que un rechazo desde el máximo reciente podría llevar a una corrección temporal.
#Macro Insights#
• Precio: $0.5310
• Ganancia 24h: +23.34%
• MA(7): $0.4599
• MA(30): $0.3822
• MA(200): $0.3367
• RSI(14): 72.91
• MACD: 0.0162
$ONDO ha subido bien por encima de las medias móviles de 7 días, 30 días y 200 días, lo que indica que los compradores tienen firmemente el control de la tendencia actual. Las velas recientes también vinieron con un aumento claro del volumen de operaciones, respaldando la solidez de la ruptura.
El MACD es positivo y está en aumento, lo que añade confirmación adicional al impulso actual. Sin embargo, el RSI está en 72.91, colocando a ONDO en territorio de sobrecompra. Esto significa que el precio podría ver alguna toma de ganancias o una consolidación a corto plazo después de un movimiento tan fuerte.
La zona de $0.480 es un nivel importante a vigilar, mientras que la MA de 7 días alrededor de $0.4599 podría actuar como un soporte más profundo. Mantener estos niveles mantendría intacta la estructura alcista actual, mientras que un rechazo desde el máximo reciente podría llevar a una corrección temporal.
#Macro Insights#
47
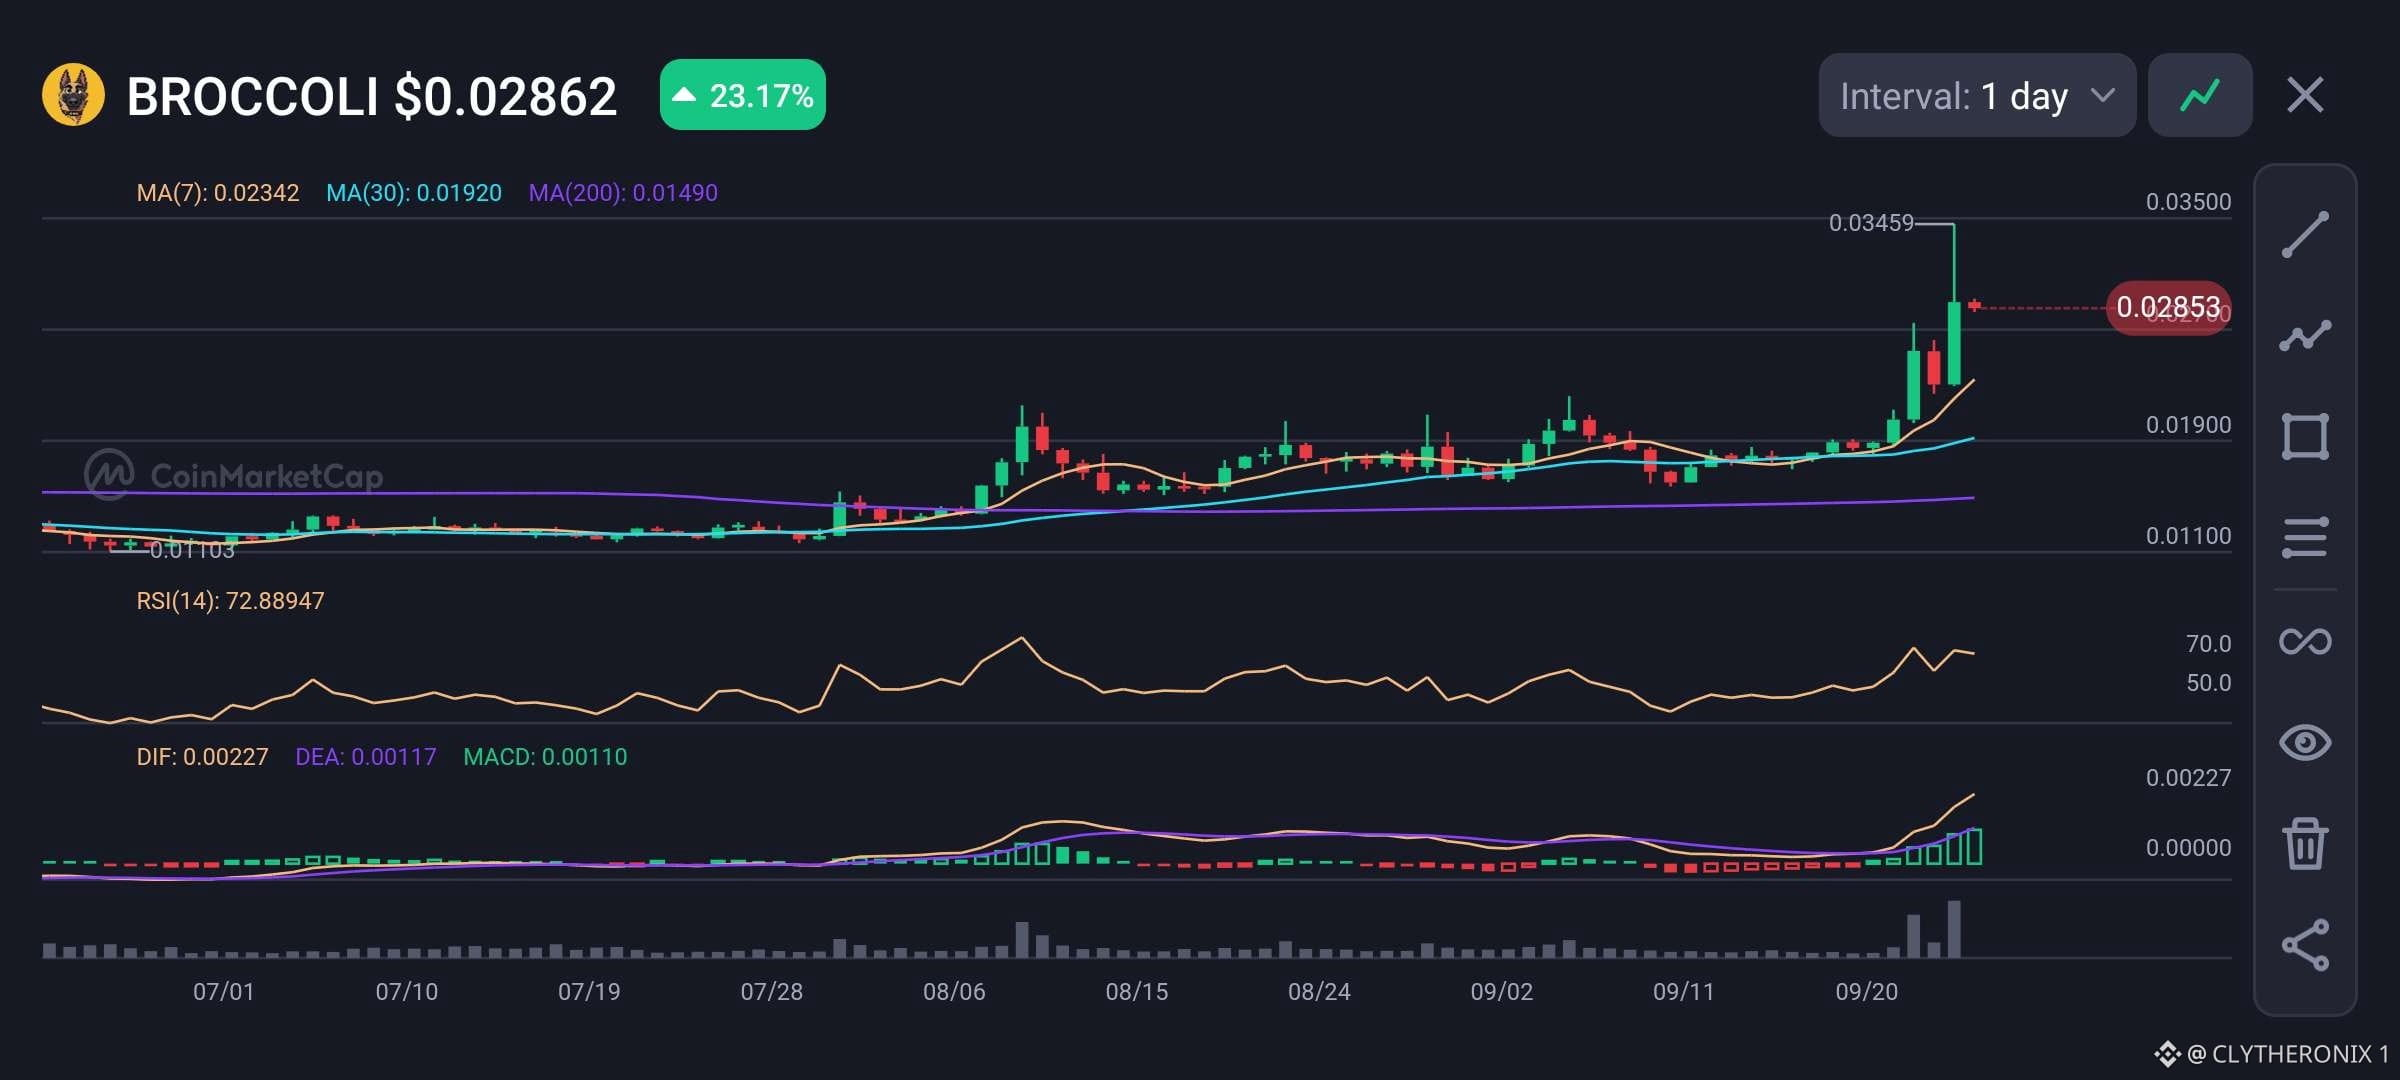
BROCCOLI está mostrando una ruptura alcista marcada en el gráfico diario, cotizando alrededor de $0.02862 después de ganar 23.17% hoy.
• Precio: $0.02862
• Ganancia 24h: +23.17%
• MA(7): $0.02342
• MA(30): $0.01920
• MA(200): $0.01490
• RSI(14): 72.89
• MACD: 0.00110
Técnicamente, el precio se ha movido bien por encima de las tres medias móviles, confirmando un impulso fuerte a corto plazo.
Y como no, las velas recientes muestran un aumento en la actividad de compra, con el volumen subiendo junto con la ruptura.
El MACD se mantiene positivo y acelera, respaldando el movimiento actual. Sin embargo, el RSI en 72.89 coloca a $BROCCOLI en territorio de sobrecompra, por lo que sigue siendo posible una corrección a corto plazo o una consolidación.
Mantener la zona de $0.0234, cerca de la MA de 7 días, ayudaría a preservar la estructura actual, mientras que una ruptura por debajo podría poner en foco $0.0192.
El impulso sigue siendo fuerte, pero la volatilidad está elevada.
#Meme Alpha#
BROCCOLI está mostrando una ruptura alcista marcada en el gráfico diario, cotizando alrededor de $0.02862 después de ganar 23.17% hoy.
• Precio: $0.02862
• Ganancia 24h: +23.17%
• MA(7): $0.02342
• MA(30): $0.01920
• MA(200): $0.01490
• RSI(14): 72.89
• MACD: 0.00110
Técnicamente, el precio se ha movido bien por encima de las tres medias móviles, confirmando un impulso fuerte a corto plazo.
Y como no, las velas recientes muestran un aumento en la actividad de compra, con el volumen subiendo junto con la ruptura.
El MACD se mantiene positivo y acelera, respaldando el movimiento actual. Sin embargo, el RSI en 72.89 coloca a $BROCCOLI en territorio de sobrecompra, por lo que sigue siendo posible una corrección a corto plazo o una consolidación.
Mantener la zona de $0.0234, cerca de la MA de 7 días, ayudaría a preservar la estructura actual, mientras que una ruptura por debajo podría poner en foco $0.0192.
El impulso sigue siendo fuerte, pero la volatilidad está elevada.
#Meme Alpha#
• Precio: $0.02862
• Ganancia 24h: +23.17%
• MA(7): $0.02342
• MA(30): $0.01920
• MA(200): $0.01490
• RSI(14): 72.89
• MACD: 0.00110
Técnicamente, el precio se ha movido bien por encima de las tres medias móviles, confirmando un impulso fuerte a corto plazo.
Y como no, las velas recientes muestran un aumento en la actividad de compra, con el volumen subiendo junto con la ruptura.
El MACD se mantiene positivo y acelera, respaldando el movimiento actual. Sin embargo, el RSI en 72.89 coloca a $BROCCOLI en territorio de sobrecompra, por lo que sigue siendo posible una corrección a corto plazo o una consolidación.
Mantener la zona de $0.0234, cerca de la MA de 7 días, ayudaría a preservar la estructura actual, mientras que una ruptura por debajo podría poner en foco $0.0192.
El impulso sigue siendo fuerte, pero la volatilidad está elevada.
#Meme Alpha#
56
Inicia sesión para explorar más contenidos
Únete a usuarios globales de criptomonedas en Binance Square
⚡️ Obtén información útil y actualizada sobre criptos.
💬 Avalado por el mayor exchange de criptomonedas en el mundo.
👍 Descubre perspectivas reales de creadores verificados.
Email/número de teléfono
Temas populares
ZcashETFPostsFirstWeeklyOutflow$93.6M
24,152 vistas
69 están debatiendo
#ZcashETFPostsFirstWeeklyOutflow$93.6M 📊 El ETF de Spot de Grayscale para Zcash (ZEC) registra $93,6M en salidas netas semanales
Los flujos de capital institucional están mostrando una nueva dinámica. El ETF spot de Zcash de Grayscale acaba de publicar su primera gran salida neta semanal, marcando un cambio notable frente al fuerte impulso de su lanzamiento inicial.
🔹Las cifras El ETF spot de ZEC de Grayscale (ticker: ZCSH) registró aproximadamente $93,6 millones en salidas netas durante la semana pasada, con retiros destacados a finales de septiembre y principios de octubre.
🔹 El contexto Esto ocurre después de un periodo inicial sólido. Tras la conversión desde el Grayscale Zcash Trust y su cotización en NYSE Arca a finales de agosto, el fondo previamente había alcanzado entradas netas acumuladas de $271 millones a mediados de septiembre.
💡 Análisis del impacto en el mercado
•Dinámicas a corto plazo Las salidas de grandes ETF pueden introducir una presión vendedora temporal sobre el activo subyacente mientras el fondo ajusta sus tenencias para cumplir con las solicitudes de reembolso.
• Sentimiento & Rebalanceo Este retroceso podría reflejar toma de ganancias habitual o un reequilibrio de cartera por parte de los primeros inversores institucionales, en lugar de un cambio fundamental en la utilidad a largo plazo de Zcash o en su propuesta de valor centrada en la privacidad.
• Observación del ecosistema Los participantes del mercado vigilarán si esto es un evento aislado para ZCSH o si indica un enfriamiento más amplio del apetito institucional por los activos digitales orientados a la privacidad.
💬 ¿Qué opinas? ¿Consideras estas salidas netas semanales como una corrección sana del mercado tras un lanzamiento fuerte, o como una señal de un cambio en el sentimiento institucional hacia las monedas de privacidad? ¡Comparte tus ideas en los comentarios a continuación!
#Zcash #ZEC #CryptoETF #InstitutionalCrypto #MarketUpdate
Esto es solo con fines educativos. No es Asesoramiento Financiero (NFA). Haz siempre tu Propia Investigación (DYOR).
$GLMR $QI $ONE
piknkkk
·0 me gusta
·47 vistas
GreekPoliceBustCryptoScamRingArrest17
36,980 vistas
377 están debatiendo
BitcoinRejectedAt$87K
102,951 vistas
129 están debatiendo