

D-CODER
2.4k Publicaciones

D-CODER
Denunciar
Bloquear usuario
Decoding The Crypto Market Charts | Market Moves | Signals | Public Surveys | Watch the market. Think for yourself.
Abrir trade
Trader ocasional
5.1 año(s)
6 Siguiendo
1.0K+ Seguidores
871 Me gusta
Publicaciones
Cartera
Todo
Citas
·
--
Alcista
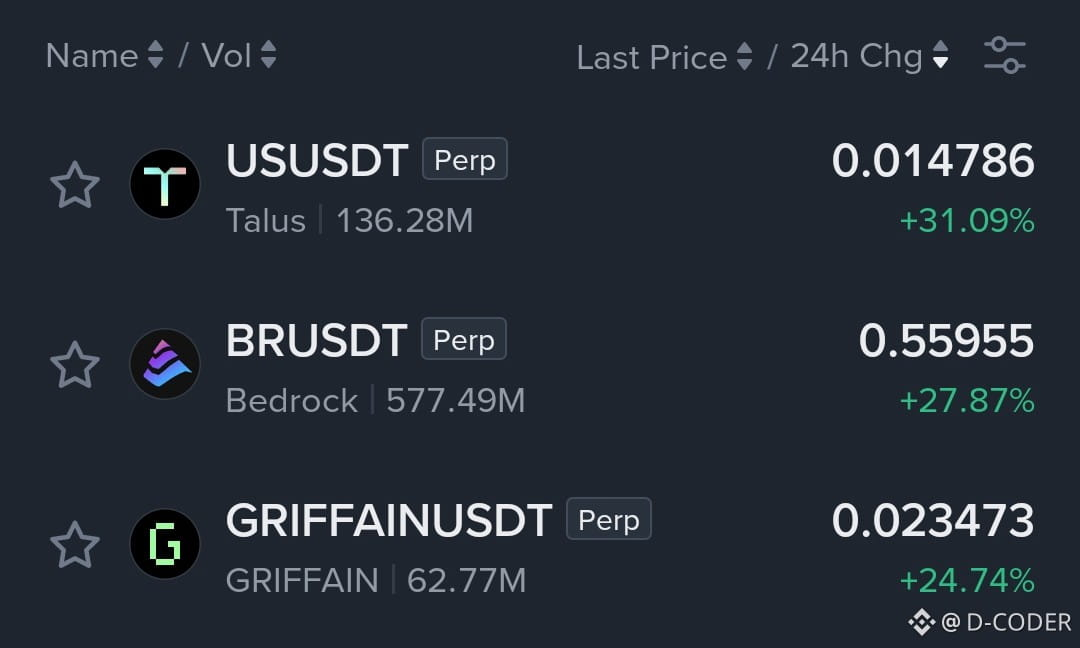
$US — +31.09% con un volumen de 136.28M muestra un fuerte impulso y una intensa actividad compradora. Un movimiento tan agresivo puede continuar si el volumen sigue creciendo, pero perseguir una subida de más del 30% conlleva un evidente riesgo de retroceso.
$BR — +27.87% con un volumen de 577.49M destaca aquí. La combinación de una fuerte subida y un volumen muy alto sugiere una gran participación del mercado, por lo que vale la pena observar si los compradores pueden sostener la ruptura.
{future}(BRUSDT)
$GRIFFAIN — +24.74% con un volumen de 62.77M muestra un sólido impulso. El movimiento cuenta con suficiente participación para seguir siendo interesante, pero después de una subida de más del 20%, la pregunta es si entrarán nuevos compradores o si los primeros inversores empezarán a recoger beneficios.
{future}(GRIFFAINUSDT)
$US — +31.09% con un volumen de 136.28M muestra un fuerte impulso y una intensa actividad compradora. Un movimiento tan agresivo puede continuar si el volumen sigue creciendo, pero perseguir una subida de más del 30% conlleva un evidente riesgo de retroceso.
$BR — +27.87% con un volumen de 577.49M destaca aquí. La combinación de una fuerte subida y un volumen muy alto sugiere una gran participación del mercado, por lo que vale la pena observar si los compradores pueden sostener la ruptura.
$GRIFFAIN — +24.74% con un volumen de 62.77M muestra un sólido impulso. El movimiento cuenta con suficiente participación para seguir siendo interesante, pero después de una subida de más del 20%, la pregunta es si entrarán nuevos compradores o si los primeros inversores empezarán a recoger beneficios.
$BR — +27.87% con un volumen de 577.49M destaca aquí. La combinación de una fuerte subida y un volumen muy alto sugiere una gran participación del mercado, por lo que vale la pena observar si los compradores pueden sostener la ruptura.
$GRIFFAIN — +24.74% con un volumen de 62.77M muestra un sólido impulso. El movimiento cuenta con suficiente participación para seguir siendo interesante, pero después de una subida de más del 20%, la pregunta es si entrarán nuevos compradores o si los primeros inversores empezarán a recoger beneficios.
1
513
·
--
Alcista
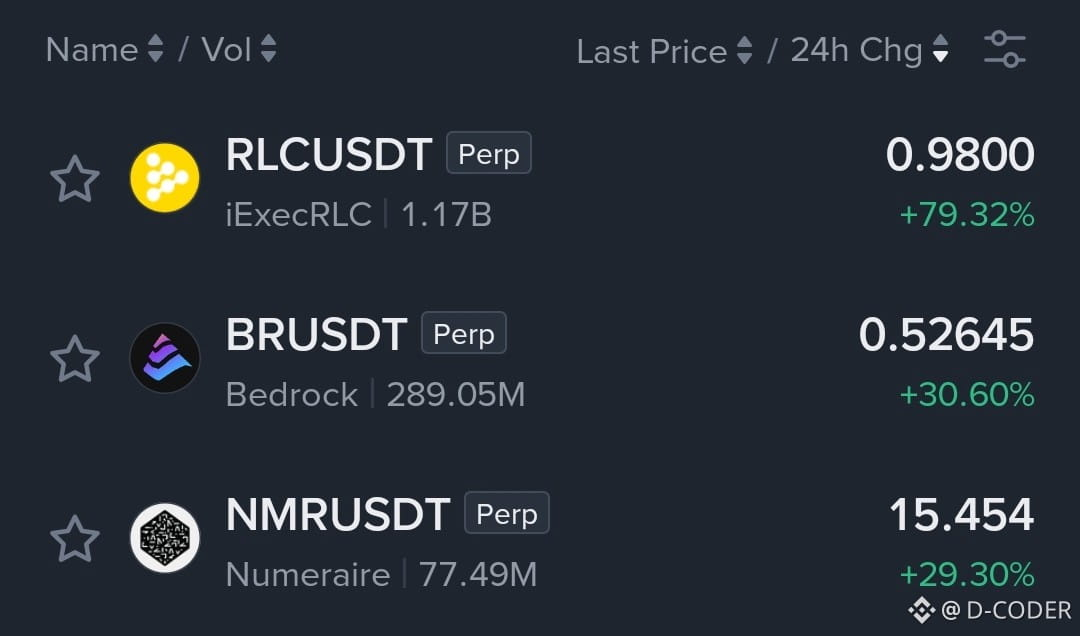
$RLC — +79.32% con un volumen de 1.17B es justo el punto en el que el FOMO se vuelve peligroso. Un movimiento tan explosivo puede hacer que los operadores sientan que se están perdiendo el siguiente tramo, pero esa misma psicología suele generar la liquidez necesaria para una reversión brusca.
{future}(RLCUSDT)
$BR — +30.60% con un volumen de 289.05M parece lo bastante sólido como para atraer a operadores de momentum. La trampa psicológica aquí consiste en perseguir el precio después de ver una gran subida; si dejan de llegar nuevos compradores, quienes entraron tarde pueden convertirse en liquidez de salida.
{future}(BRUSDT)
$NMR — +29.30% con un volumen de 77.49M es otra configuración sólida de momentum. Cuando los operadores ven ganancias de casi el 30%, la codicia empieza a reemplazar a la paciencia: la pregunta más inteligente es si sigue entrando nueva demanda o si todos simplemente esperan que alguien más compre a un precio más alto.
{future}(NMRUSDT)
$RLC — +79.32% con un volumen de 1.17B es justo el punto en el que el FOMO se vuelve peligroso. Un movimiento tan explosivo puede hacer que los operadores sientan que se están perdiendo el siguiente tramo, pero esa misma psicología suele generar la liquidez necesaria para una reversión brusca.
$BR — +30.60% con un volumen de 289.05M parece lo bastante sólido como para atraer a operadores de momentum. La trampa psicológica aquí consiste en perseguir el precio después de ver una gran subida; si dejan de llegar nuevos compradores, quienes entraron tarde pueden convertirse en liquidez de salida.
$NMR — +29.30% con un volumen de 77.49M es otra configuración sólida de momentum. Cuando los operadores ven ganancias de casi el 30%, la codicia empieza a reemplazar a la paciencia: la pregunta más inteligente es si sigue entrando nueva demanda o si todos simplemente esperan que alguien más compre a un precio más alto.
$BR — +30.60% con un volumen de 289.05M parece lo bastante sólido como para atraer a operadores de momentum. La trampa psicológica aquí consiste en perseguir el precio después de ver una gran subida; si dejan de llegar nuevos compradores, quienes entraron tarde pueden convertirse en liquidez de salida.
$NMR — +29.30% con un volumen de 77.49M es otra configuración sólida de momentum. Cuando los operadores ven ganancias de casi el 30%, la codicia empieza a reemplazar a la paciencia: la pregunta más inteligente es si sigue entrando nueva demanda o si todos simplemente esperan que alguien más compre a un precio más alto.
461
·
--
Alcista
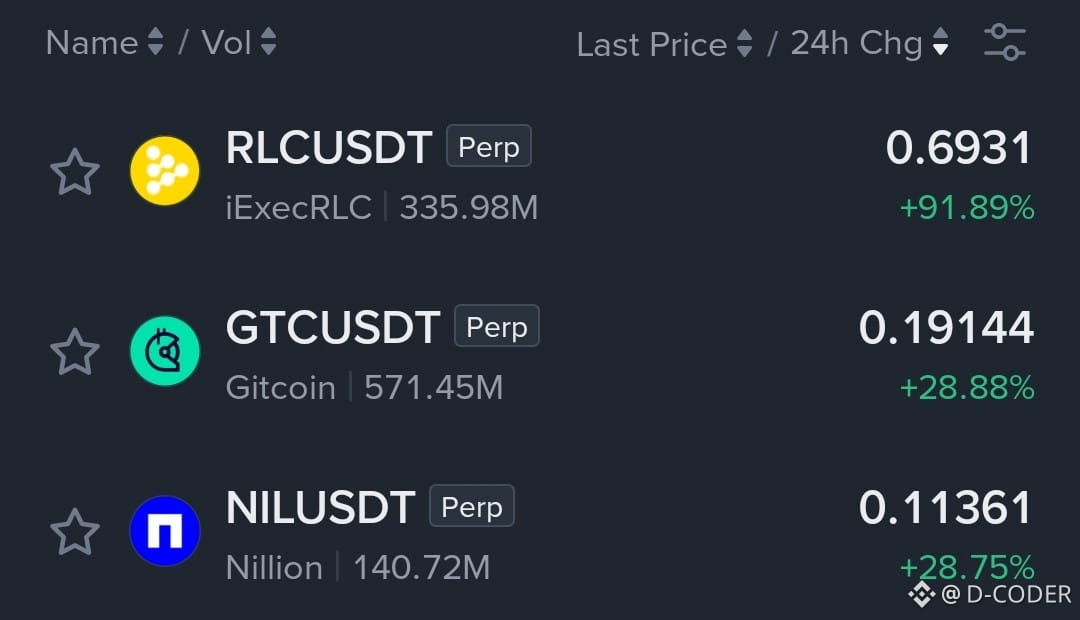
$RLC — +91.89% es el tipo de movimiento que hace peligroso ir detrás del precio. El volumen de 335.98M muestra una gran actividad, pero después de un movimiento que casi se ha duplicado, prefiero ver una consolidación clara antes que comprar durante el repunte.
{future}(RLCUSDT)
$GTC — +28.88% con un volumen de 571.45M parece más interesante desde la perspectiva del impulso. La actividad reciente de trading en torno a GTC también ha aumentado, así que este movimiento tiene más fundamento que una simple vela verde aleatoria.
{future}(GTCUSDT)
$NIL — +28.75% con un volumen de 140.72M tiene un catalizador real detrás: el lanzamiento de la red principal de Nillion está previsto para el 5 de octubre. Esto puede generar un fuerte impulso, pero también conlleva el clásico riesgo de vender tras la noticia si las expectativas ya están reflejadas en el precio.
{future}(NILUSDT)
$RLC — +91.89% es el tipo de movimiento que hace peligroso ir detrás del precio. El volumen de 335.98M muestra una gran actividad, pero después de un movimiento que casi se ha duplicado, prefiero ver una consolidación clara antes que comprar durante el repunte.
$GTC — +28.88% con un volumen de 571.45M parece más interesante desde la perspectiva del impulso. La actividad reciente de trading en torno a GTC también ha aumentado, así que este movimiento tiene más fundamento que una simple vela verde aleatoria.
$NIL — +28.75% con un volumen de 140.72M tiene un catalizador real detrás: el lanzamiento de la red principal de Nillion está previsto para el 5 de octubre. Esto puede generar un fuerte impulso, pero también conlleva el clásico riesgo de vender tras la noticia si las expectativas ya están reflejadas en el precio.
$GTC — +28.88% con un volumen de 571.45M parece más interesante desde la perspectiva del impulso. La actividad reciente de trading en torno a GTC también ha aumentado, así que este movimiento tiene más fundamento que una simple vela verde aleatoria.
$NIL — +28.75% con un volumen de 140.72M tiene un catalizador real detrás: el lanzamiento de la red principal de Nillion está previsto para el 5 de octubre. Esto puede generar un fuerte impulso, pero también conlleva el clásico riesgo de vender tras la noticia si las expectativas ya están reflejadas en el precio.
683
·
--
Bajista
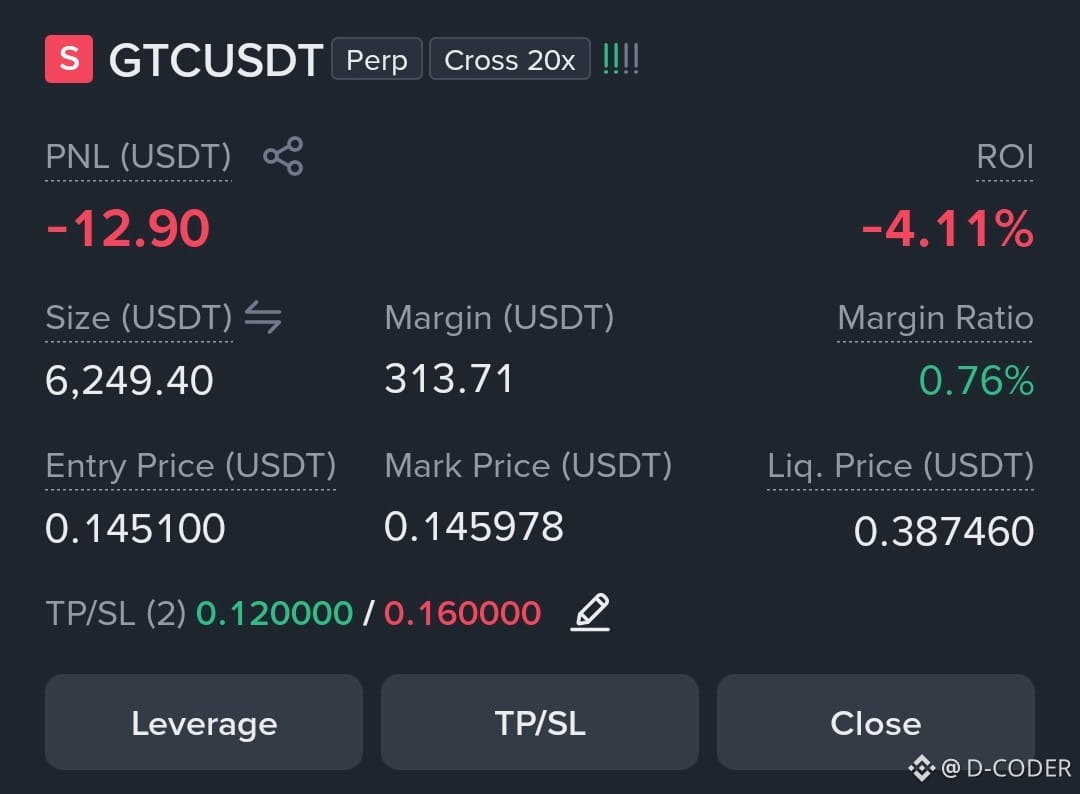
¿Puede alguien decirme?
¿Funcionará? 📉
$GTC
{future}(GTCUSDT)
¿Puede alguien decirme?
¿Funcionará? 📉
$GTC
¿Funcionará? 📉
$GTC
1
1
373
·
--
Alcista
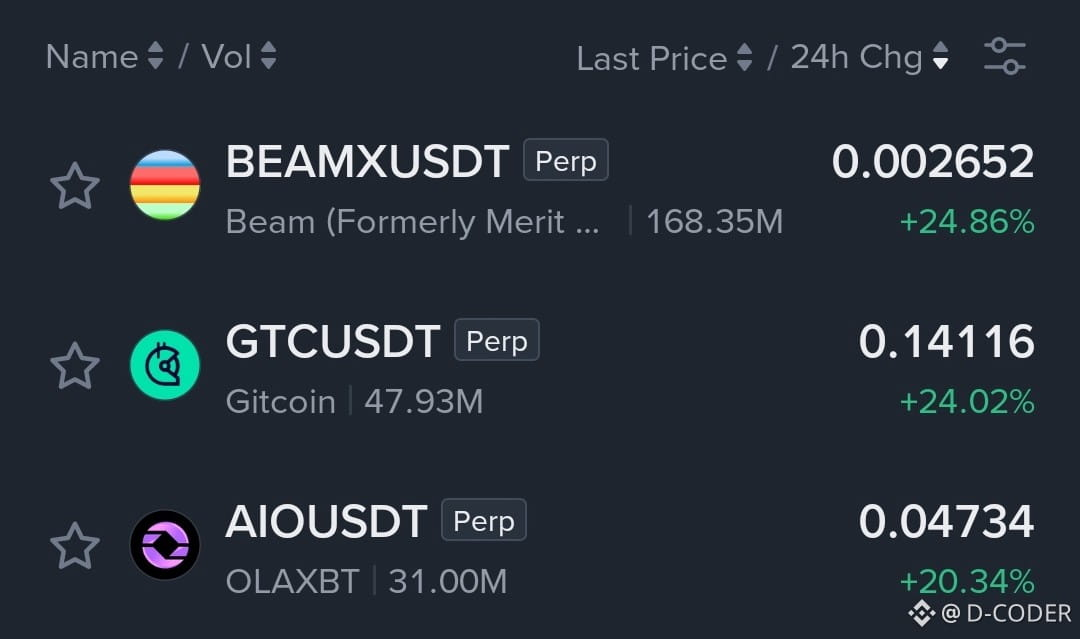
$BEAMX — +24.86% con 168.35M de volumen muestra un impulso fuerte con una participación seria detrás. El movimiento es convincente, pero después de un salto del 25%, el siguiente desafío es mantener las ganancias sin que surja una ola de toma de beneficios repentina.
{future}(BEAMXUSDT)
$GTC — +24.02% con 47.93M de volumen es otro movimiento fuerte tipo ruptura. Los compradores claramente tienen el control ahora mismo, pero la gran pregunta es si puede seguir entrando volumen nuevo después de una subida tan rápida.
{future}(GTCUSDT)
$AIO — +20.34% con 31M de volumen está empujando con fuerza y tiene suficiente actividad para mantener el movimiento interesante. Si los compradores continúan apoyándolo, hay margen para la continuación, pero si se pierde el volumen aquí, el impulso podría convertirse rápidamente en un retroceso.
{future}(AIOUSDT)
$BEAMX — +24.86% con 168.35M de volumen muestra un impulso fuerte con una participación seria detrás. El movimiento es convincente, pero después de un salto del 25%, el siguiente desafío es mantener las ganancias sin que surja una ola de toma de beneficios repentina.
$GTC — +24.02% con 47.93M de volumen es otro movimiento fuerte tipo ruptura. Los compradores claramente tienen el control ahora mismo, pero la gran pregunta es si puede seguir entrando volumen nuevo después de una subida tan rápida.
$AIO — +20.34% con 31M de volumen está empujando con fuerza y tiene suficiente actividad para mantener el movimiento interesante. Si los compradores continúan apoyándolo, hay margen para la continuación, pero si se pierde el volumen aquí, el impulso podría convertirse rápidamente en un retroceso.
$GTC — +24.02% con 47.93M de volumen es otro movimiento fuerte tipo ruptura. Los compradores claramente tienen el control ahora mismo, pero la gran pregunta es si puede seguir entrando volumen nuevo después de una subida tan rápida.
$AIO — +20.34% con 31M de volumen está empujando con fuerza y tiene suficiente actividad para mantener el movimiento interesante. Si los compradores continúan apoyándolo, hay margen para la continuación, pero si se pierde el volumen aquí, el impulso podría convertirse rápidamente en un retroceso.
473
·
--
Alcista
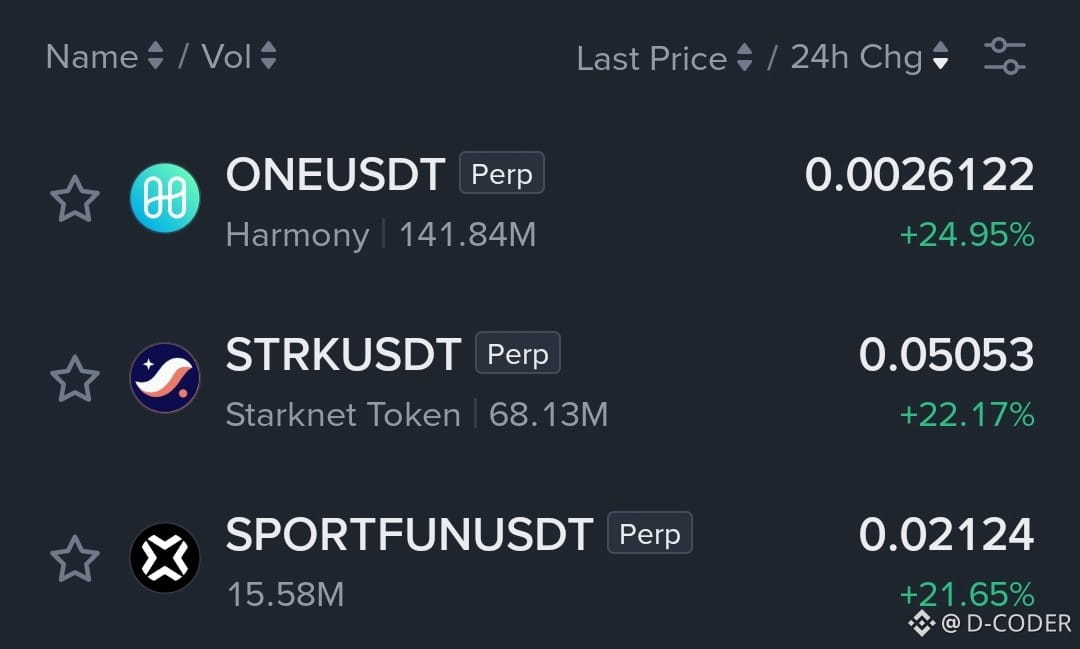
$ONE — +24.95% con un volumen de 141.84M muestra un fuerte impulso con una participación real detrás del movimiento. La gran pregunta ahora es si los compradores pueden seguir empujando después de un rally tan brusco o empezar a tomar ganancias.
{future}(ONEUSDT)
$STRK — +22.17% con un volumen de 68.13M parece un movimiento de impulso sólido. Si el volumen sigue expandiéndose, el movimiento puede continuar, pero perder la presión de compra aquí podría provocar un retroceso rápido.
{future}(STRKUSDT)
$SPORTFUN — +21.65% con un volumen de 15.58M está empujando con fuerza, pero el volumen más bajo hace que la demanda sostenida sea más importante. Necesita compradores nuevos para mantener vivo este movimiento en lugar de convertirse en un impulso rápido.
{future}(SPORTFUNUSDT)
$ONE — +24.95% con un volumen de 141.84M muestra un fuerte impulso con una participación real detrás del movimiento. La gran pregunta ahora es si los compradores pueden seguir empujando después de un rally tan brusco o empezar a tomar ganancias.
$STRK — +22.17% con un volumen de 68.13M parece un movimiento de impulso sólido. Si el volumen sigue expandiéndose, el movimiento puede continuar, pero perder la presión de compra aquí podría provocar un retroceso rápido.
$SPORTFUN — +21.65% con un volumen de 15.58M está empujando con fuerza, pero el volumen más bajo hace que la demanda sostenida sea más importante. Necesita compradores nuevos para mantener vivo este movimiento en lugar de convertirse en un impulso rápido.
$STRK — +22.17% con un volumen de 68.13M parece un movimiento de impulso sólido. Si el volumen sigue expandiéndose, el movimiento puede continuar, pero perder la presión de compra aquí podría provocar un retroceso rápido.
$SPORTFUN — +21.65% con un volumen de 15.58M está empujando con fuerza, pero el volumen más bajo hace que la demanda sostenida sea más importante. Necesita compradores nuevos para mantener vivo este movimiento en lugar de convertirse en un impulso rápido.
434
·
--
Alcista
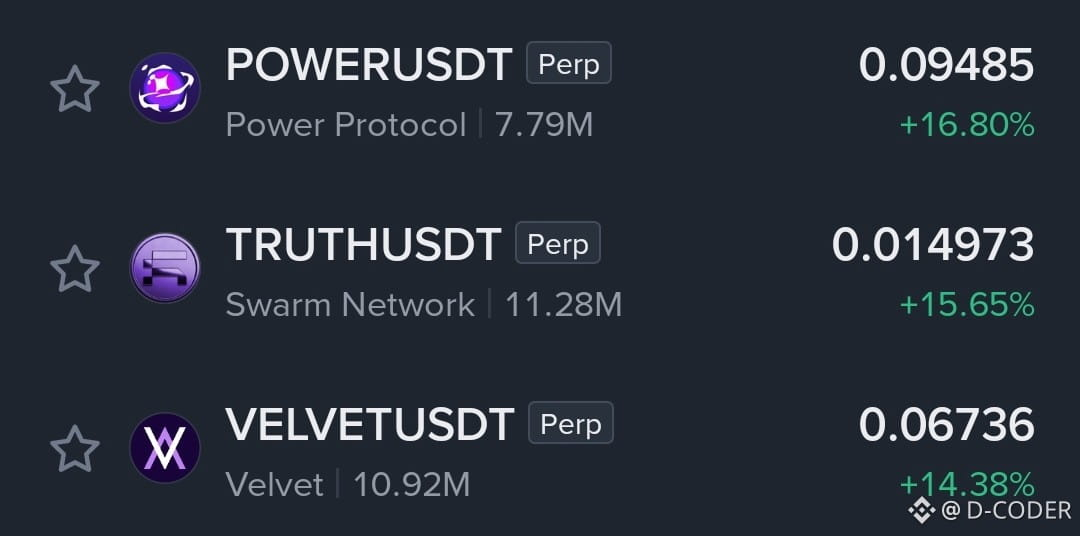
$POWER — +16.80% con un volumen de 7.79M muestra un fuerte impulso, pero el volumen aún es relativamente bajo para un movimiento de este tamaño. Si los compradores siguen entrando, el avance puede continuar, pero una caída del volumen podría provocar un retroceso brusco.
{future}(POWERUSDT)
$TRUTH — +15.65% con un volumen de 11.28M muestra una presión de compra decente detrás del movimiento. El impulso se ve saludable, pero después de un movimiento verde fuerte, lo clave es si los compradores pueden mantener las ganancias en lugar de dejar que la toma de utilidades se imponga.
{future}(TRUTHUSDT)
$VELVET — +14.38% con un volumen de 10.92M también muestra un impulso sólido. Tiene suficiente actividad para mantener el movimiento interesante, pero el volumen sostenido será importante si los alcistas quieren impulsarlo más arriba.
{future}(VELVETUSDT)
$POWER — +16.80% con un volumen de 7.79M muestra un fuerte impulso, pero el volumen aún es relativamente bajo para un movimiento de este tamaño. Si los compradores siguen entrando, el avance puede continuar, pero una caída del volumen podría provocar un retroceso brusco.
$TRUTH — +15.65% con un volumen de 11.28M muestra una presión de compra decente detrás del movimiento. El impulso se ve saludable, pero después de un movimiento verde fuerte, lo clave es si los compradores pueden mantener las ganancias en lugar de dejar que la toma de utilidades se imponga.
$VELVET — +14.38% con un volumen de 10.92M también muestra un impulso sólido. Tiene suficiente actividad para mantener el movimiento interesante, pero el volumen sostenido será importante si los alcistas quieren impulsarlo más arriba.
$TRUTH — +15.65% con un volumen de 11.28M muestra una presión de compra decente detrás del movimiento. El impulso se ve saludable, pero después de un movimiento verde fuerte, lo clave es si los compradores pueden mantener las ganancias en lugar de dejar que la toma de utilidades se imponga.
$VELVET — +14.38% con un volumen de 10.92M también muestra un impulso sólido. Tiene suficiente actividad para mantener el movimiento interesante, pero el volumen sostenido será importante si los alcistas quieren impulsarlo más arriba.
749
·
--
Alcista
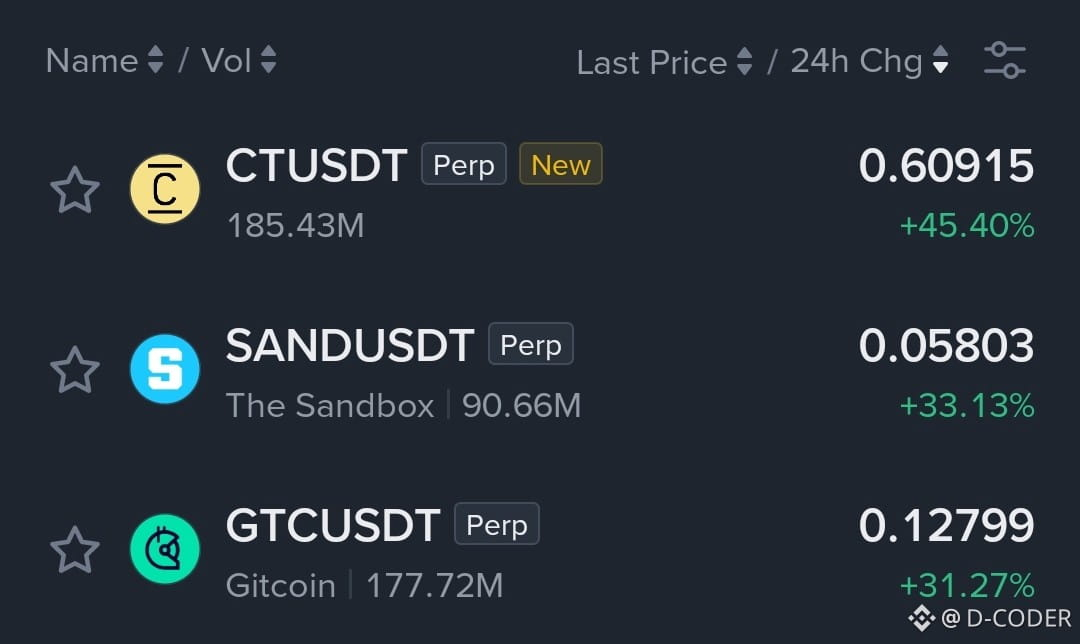
$CT — +45.40% con 185.43M de volumen es un movimiento serio de momentum. El volumen es lo suficientemente fuerte como para mostrar participación real, pero después de un pump de +45%, la volatilidad puede volverse extrema y perseguir el movimiento se vuelve arriesgado.
{future}(CTUSDT)
$SAND — +33.13% con 90.66M de volumen muestra una fuerte presión compradora detrás del movimiento. El momentum es claro, pero el siguiente movimiento necesita volumen continuo para evitar convertirse en un retroceso brusco por toma de ganancias.
{future}(SANDUSDT)
$GTC — +31.27% con 177.72M de volumen se ve fuerte tanto por la acción del precio como por la participación. Si los compradores mantienen el volumen elevado, el movimiento puede continuar, pero una caída repentina del volumen podría indicar que el momentum empieza a desvanecerse.
{future}(GTCUSDT)
$CT — +45.40% con 185.43M de volumen es un movimiento serio de momentum. El volumen es lo suficientemente fuerte como para mostrar participación real, pero después de un pump de +45%, la volatilidad puede volverse extrema y perseguir el movimiento se vuelve arriesgado.
$SAND — +33.13% con 90.66M de volumen muestra una fuerte presión compradora detrás del movimiento. El momentum es claro, pero el siguiente movimiento necesita volumen continuo para evitar convertirse en un retroceso brusco por toma de ganancias.
$GTC — +31.27% con 177.72M de volumen se ve fuerte tanto por la acción del precio como por la participación. Si los compradores mantienen el volumen elevado, el movimiento puede continuar, pero una caída repentina del volumen podría indicar que el momentum empieza a desvanecerse.
$SAND — +33.13% con 90.66M de volumen muestra una fuerte presión compradora detrás del movimiento. El momentum es claro, pero el siguiente movimiento necesita volumen continuo para evitar convertirse en un retroceso brusco por toma de ganancias.
$GTC — +31.27% con 177.72M de volumen se ve fuerte tanto por la acción del precio como por la participación. Si los compradores mantienen el volumen elevado, el movimiento puede continuar, pero una caída repentina del volumen podría indicar que el momentum empieza a desvanecerse.
568
·
--
Alcista
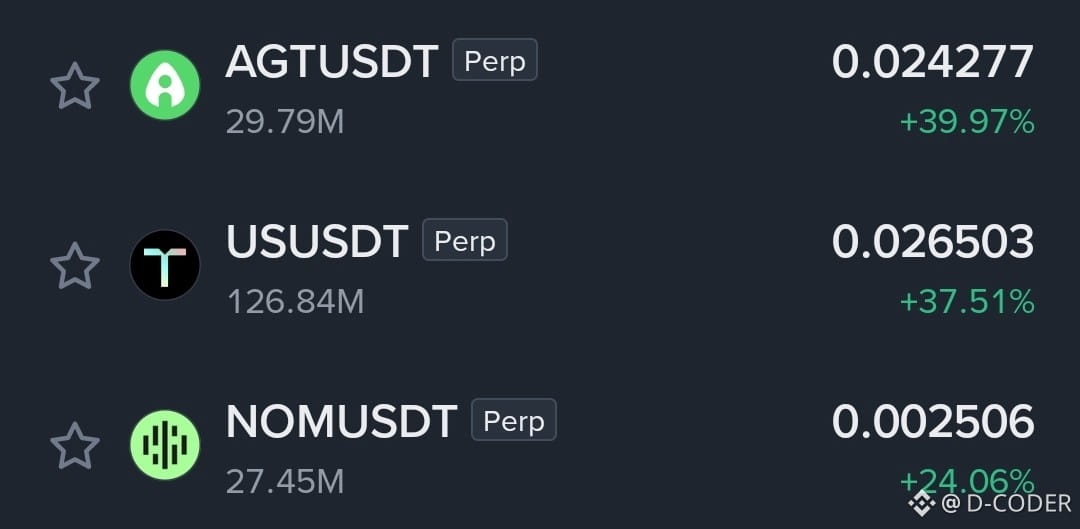
$AGT — +39.97% con 29.79M de volumen muestra una presión de compra agresiva. El movimiento es fuerte, pero casi 40% en un día también significa que la volatilidad es alta y que la toma de ganancias puede llegar rápidamente.
{future}(AGTUSDT)
$US — +37.51% con 126.84M de volumen es un movimiento de impulso fuerte con una participación seria. Si los compradores siguen apoyando el precio, el impulso puede continuar, pero perseguir una subida tan brusca conlleva un mayor riesgo de retroceso.
{future}(USUSDT)
$NOM — +24.06% con 27.45M de volumen está mostrando un movimiento sólido tipo ruptura. El volumen es decente, pero el siguiente impulso necesita compradores nuevos; de lo contrario, esto puede convertirse fácilmente en un “pump” a corto plazo y una corrección.
{future}(NOMUSDT)
$AGT — +39.97% con 29.79M de volumen muestra una presión de compra agresiva. El movimiento es fuerte, pero casi 40% en un día también significa que la volatilidad es alta y que la toma de ganancias puede llegar rápidamente.
$US — +37.51% con 126.84M de volumen es un movimiento de impulso fuerte con una participación seria. Si los compradores siguen apoyando el precio, el impulso puede continuar, pero perseguir una subida tan brusca conlleva un mayor riesgo de retroceso.
$NOM — +24.06% con 27.45M de volumen está mostrando un movimiento sólido tipo ruptura. El volumen es decente, pero el siguiente impulso necesita compradores nuevos; de lo contrario, esto puede convertirse fácilmente en un “pump” a corto plazo y una corrección.
$US — +37.51% con 126.84M de volumen es un movimiento de impulso fuerte con una participación seria. Si los compradores siguen apoyando el precio, el impulso puede continuar, pero perseguir una subida tan brusca conlleva un mayor riesgo de retroceso.
$NOM — +24.06% con 27.45M de volumen está mostrando un movimiento sólido tipo ruptura. El volumen es decente, pero el siguiente impulso necesita compradores nuevos; de lo contrario, esto puede convertirse fácilmente en un “pump” a corto plazo y una corrección.
423
·
--
Alcista
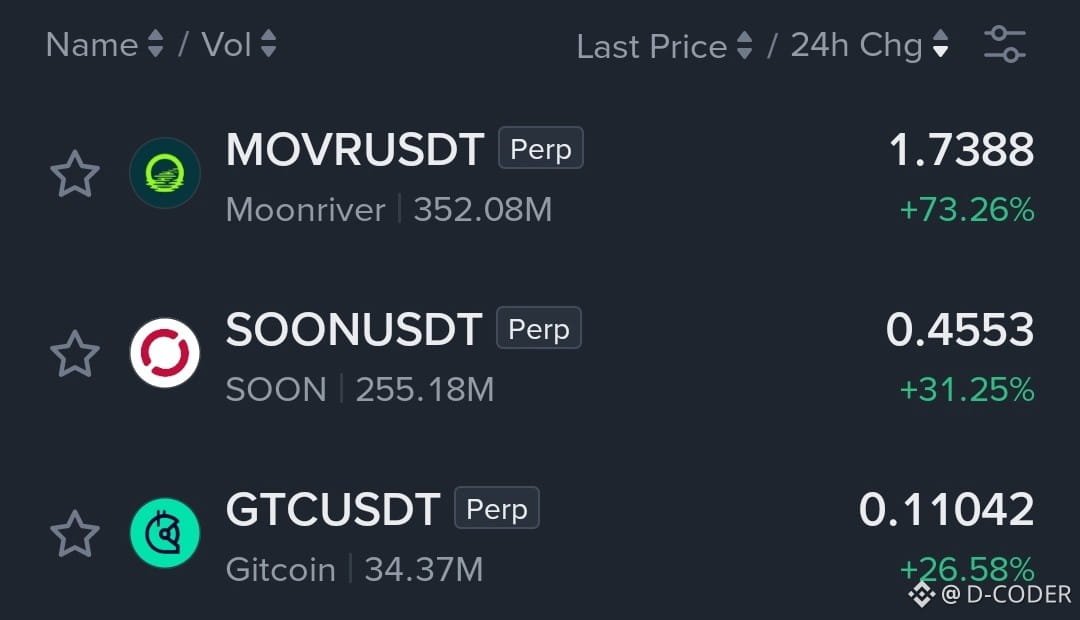
$MOVR — +73.26% con un volumen de 352.08M es un movimiento de impulso serio. El volumen confirma una participación fuerte, pero después de un salto tan grande, la volatilidad puede volverse extrema y la toma de ganancias puede afectar con fuerza.
{future}(MOVRUSDT)
$SOON — +31.25% con un volumen de 255.18M muestra una fuerte presión compradora detrás del movimiento. La combinación de expansión del precio y un alto volumen es notable, pero el siguiente movimiento depende de si los compradores pueden mantener esta actividad.
{future}(SOONUSDT)
$GTC — +26.58% con un volumen de 34.37M está ganando un impulso sólido, aunque su volumen es mucho menor que MOVR y SOON. Las compras recientes serían importantes para la continuación; de lo contrario, el movimiento podría enfriarse rápidamente.
{future}(GTCUSDT)
$MOVR — +73.26% con un volumen de 352.08M es un movimiento de impulso serio. El volumen confirma una participación fuerte, pero después de un salto tan grande, la volatilidad puede volverse extrema y la toma de ganancias puede afectar con fuerza.
$SOON — +31.25% con un volumen de 255.18M muestra una fuerte presión compradora detrás del movimiento. La combinación de expansión del precio y un alto volumen es notable, pero el siguiente movimiento depende de si los compradores pueden mantener esta actividad.
$GTC — +26.58% con un volumen de 34.37M está ganando un impulso sólido, aunque su volumen es mucho menor que MOVR y SOON. Las compras recientes serían importantes para la continuación; de lo contrario, el movimiento podría enfriarse rápidamente.
$SOON — +31.25% con un volumen de 255.18M muestra una fuerte presión compradora detrás del movimiento. La combinación de expansión del precio y un alto volumen es notable, pero el siguiente movimiento depende de si los compradores pueden mantener esta actividad.
$GTC — +26.58% con un volumen de 34.37M está ganando un impulso sólido, aunque su volumen es mucho menor que MOVR y SOON. Las compras recientes serían importantes para la continuación; de lo contrario, el movimiento podría enfriarse rápidamente.
510
·
--
Alcista
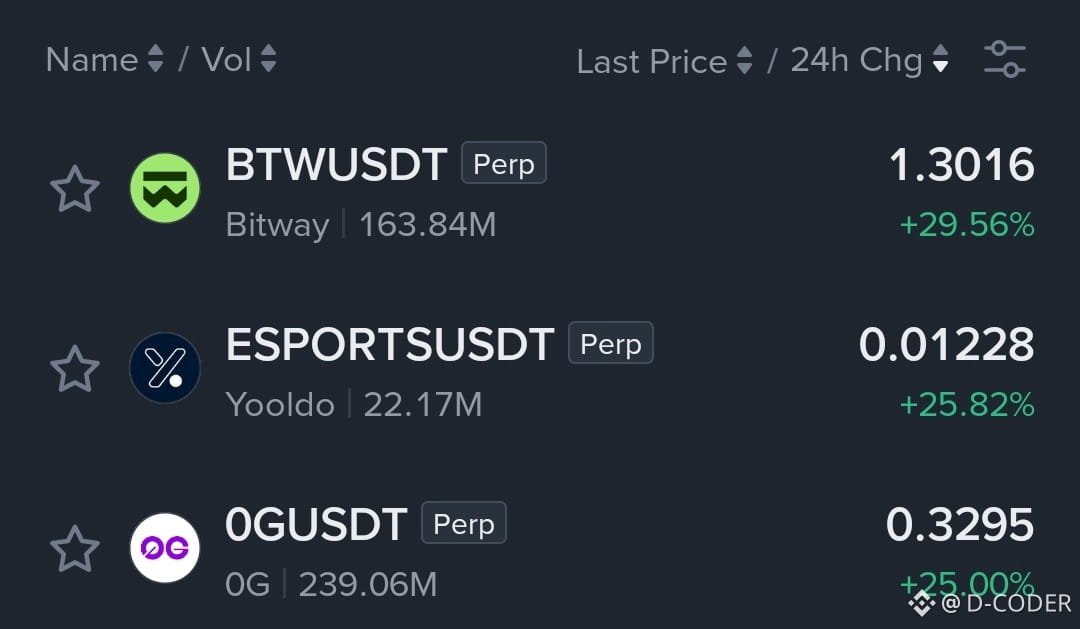
$BTW — +29.56% con un volumen de 163.84M muestra un impulso fuerte y una actividad de compra seria. El movimiento ya está extendido, así que la gran pregunta es si el volumen nuevo puede seguir empujándolo más alto o si empieza a imponerse la toma de beneficios.
{future}(BTWUSDT)
$ESPORTS — +25.82% con un volumen de 22.17M está haciendo un movimiento brusco, pero el volumen es mucho más ligero que BTW. Si el interés comprador sigue creciendo, el impulso puede continuar; de lo contrario, este tipo de movimiento puede revertirse rápidamente.
{future}(ESPORTSUSDT)
$0G — +25.00% con un volumen de 239.06M destaca con una participación fuerte detrás del movimiento. La acción del precio es agresiva, pero después de un salto del 25%, mantener el volumen será importante para evitar un enfriamiento rápido.
{future}(0GUSDT)
$BTW — +29.56% con un volumen de 163.84M muestra un impulso fuerte y una actividad de compra seria. El movimiento ya está extendido, así que la gran pregunta es si el volumen nuevo puede seguir empujándolo más alto o si empieza a imponerse la toma de beneficios.
$ESPORTS — +25.82% con un volumen de 22.17M está haciendo un movimiento brusco, pero el volumen es mucho más ligero que BTW. Si el interés comprador sigue creciendo, el impulso puede continuar; de lo contrario, este tipo de movimiento puede revertirse rápidamente.
$0G — +25.00% con un volumen de 239.06M destaca con una participación fuerte detrás del movimiento. La acción del precio es agresiva, pero después de un salto del 25%, mantener el volumen será importante para evitar un enfriamiento rápido.
$ESPORTS — +25.82% con un volumen de 22.17M está haciendo un movimiento brusco, pero el volumen es mucho más ligero que BTW. Si el interés comprador sigue creciendo, el impulso puede continuar; de lo contrario, este tipo de movimiento puede revertirse rápidamente.
$0G — +25.00% con un volumen de 239.06M destaca con una participación fuerte detrás del movimiento. La acción del precio es agresiva, pero después de un salto del 25%, mantener el volumen será importante para evitar un enfriamiento rápido.
552
·
--
Alcista
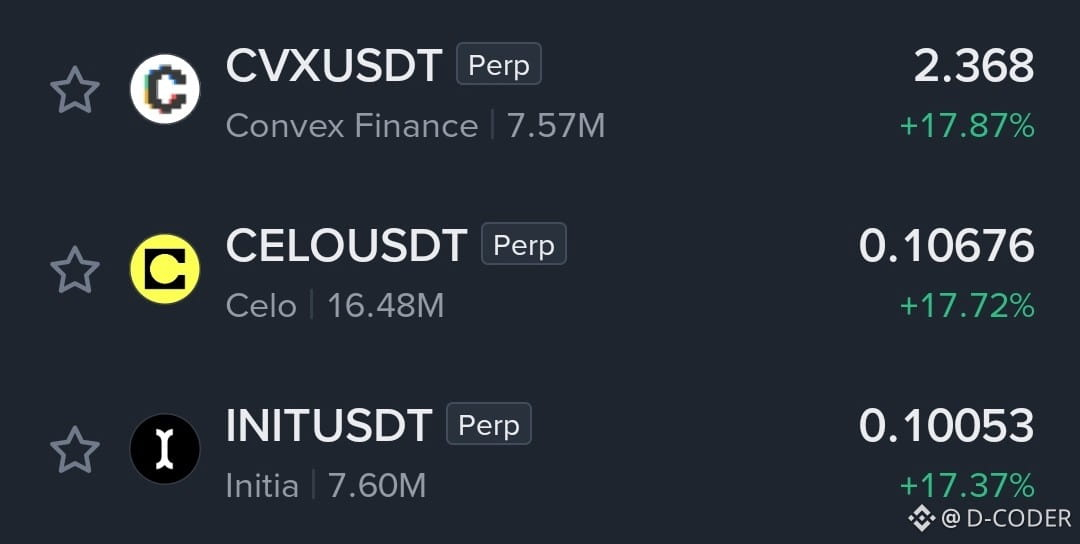
$CVX — +17.87% con un volumen de 7.57M muestra un fuerte impulso, pero el volumen relativamente ligero significa que el movimiento necesita compradores nuevos para continuar. Si el volumen se debilita, esto puede convertirse en un retroceso rápido.
{future}(CVXUSDT)
$CELO — +17.72% con un volumen de 16.48M parece un buen empuje de impulso. Los compradores están claramente activos, pero después de un movimiento de este tamaño, mantener el impulso importa más que simplemente perseguir la vela verde.
{future}(CELOUSDT)
$INIT — +17.37% con un volumen de 7.60M es otro movimiento fuerte, pero el volumen aún es relativamente bajo. Si la presión compradora sigue aumentando, la continuación es posible; de lo contrario, la toma de ganancias podría afectar rápidamente.
{future}(INITUSDT)
$CVX — +17.87% con un volumen de 7.57M muestra un fuerte impulso, pero el volumen relativamente ligero significa que el movimiento necesita compradores nuevos para continuar. Si el volumen se debilita, esto puede convertirse en un retroceso rápido.
$CELO — +17.72% con un volumen de 16.48M parece un buen empuje de impulso. Los compradores están claramente activos, pero después de un movimiento de este tamaño, mantener el impulso importa más que simplemente perseguir la vela verde.
$INIT — +17.37% con un volumen de 7.60M es otro movimiento fuerte, pero el volumen aún es relativamente bajo. Si la presión compradora sigue aumentando, la continuación es posible; de lo contrario, la toma de ganancias podría afectar rápidamente.
$CELO — +17.72% con un volumen de 16.48M parece un buen empuje de impulso. Los compradores están claramente activos, pero después de un movimiento de este tamaño, mantener el impulso importa más que simplemente perseguir la vela verde.
$INIT — +17.37% con un volumen de 7.60M es otro movimiento fuerte, pero el volumen aún es relativamente bajo. Si la presión compradora sigue aumentando, la continuación es posible; de lo contrario, la toma de ganancias podría afectar rápidamente.
1
440
·
--
Alcista
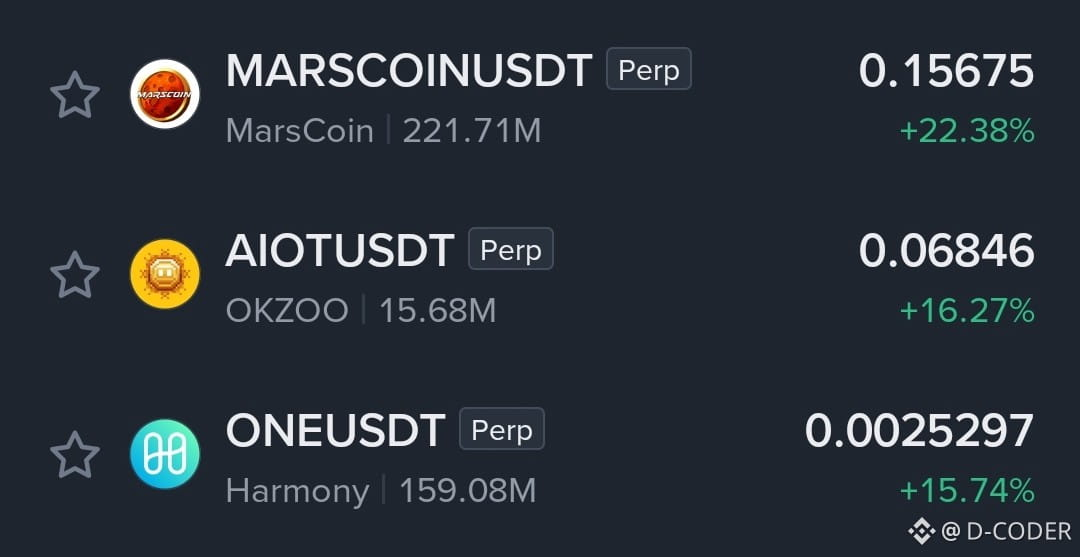
$MARSCOIN — +22.38% con un volumen de 221.71M muestra un fuerte interés comprador detrás del movimiento. El impulso está claramente ahí, pero después de una subida de 20%+ la toma de ganancias puede afectar rápido. La clave es si los compradores pueden mantener el flujo de volumen.
{future}(MARSCOINUSDT)
$AIOT — +16.27% es un movimiento sólido, pero el volumen de 15.68M es mucho menor que el de los otros dos. Si los compradores siguen entrando con fuerza, el movimiento puede extenderse; de lo contrario, este tipo de “pump” puede enfriarse rápidamente.
{future}(AIOTUSDT)
$ONE — +15.74% con un volumen de 159.08M parece un movimiento de impulso más saludable. Hay una actividad significativa detrás del comportamiento del precio, pero el siguiente impulso necesita volumen fresco para evitar convertirse en otro “pump” de corta duración.
{future}(ONEUSDT)
$MARSCOIN — +22.38% con un volumen de 221.71M muestra un fuerte interés comprador detrás del movimiento. El impulso está claramente ahí, pero después de una subida de 20%+ la toma de ganancias puede afectar rápido. La clave es si los compradores pueden mantener el flujo de volumen.
$AIOT — +16.27% es un movimiento sólido, pero el volumen de 15.68M es mucho menor que el de los otros dos. Si los compradores siguen entrando con fuerza, el movimiento puede extenderse; de lo contrario, este tipo de “pump” puede enfriarse rápidamente.
$ONE — +15.74% con un volumen de 159.08M parece un movimiento de impulso más saludable. Hay una actividad significativa detrás del comportamiento del precio, pero el siguiente impulso necesita volumen fresco para evitar convertirse en otro “pump” de corta duración.
$AIOT — +16.27% es un movimiento sólido, pero el volumen de 15.68M es mucho menor que el de los otros dos. Si los compradores siguen entrando con fuerza, el movimiento puede extenderse; de lo contrario, este tipo de “pump” puede enfriarse rápidamente.
$ONE — +15.74% con un volumen de 159.08M parece un movimiento de impulso más saludable. Hay una actividad significativa detrás del comportamiento del precio, pero el siguiente impulso necesita volumen fresco para evitar convertirse en otro “pump” de corta duración.
858
·
--
Alcista
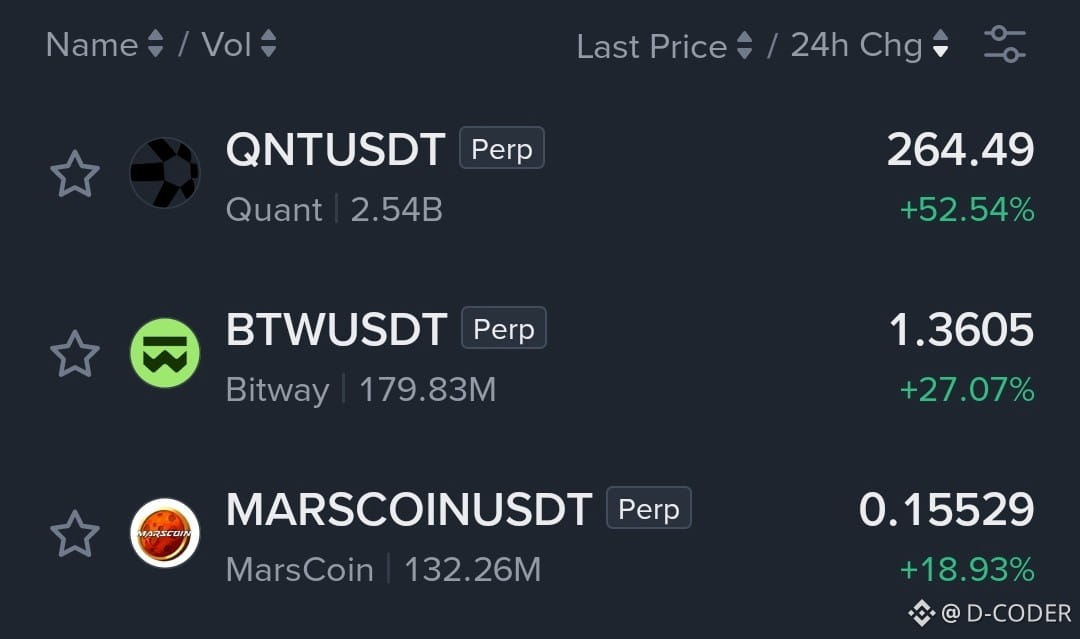
$QNT — +52.54% con un volumen de 2.54B todavía muestra un impulso serio. Pero después de un movimiento tan grande, la gran pregunta es si los compradores pueden seguir presionando o empezar a tomar ganancias. Este es el tipo de movimiento en el que perseguir puede volverse caro rápidamente.
{future}(QNTUSDT)
$BTW — +27.07% con un volumen de 179.83M muestra un interés de compra sólido, sin el pico extremo visto en QNT. Si el volumen continúa aumentando, el movimiento puede seguir siendo interesante, pero perder el impulso después de este salto podría provocar una rápida corrección.
{future}(BTWUSDT)
$MARSCOIN — +18.93% con un volumen de 132.26M parece más controlado en comparación con los otros dos. El movimiento tiene una participación decente, pero aún necesita un volumen sostenido para convertir este impulso en una continuación más fuerte en lugar de ser solo un rebote a corto plazo.
{future}(MARSCOINUSDT)
$QNT — +52.54% con un volumen de 2.54B todavía muestra un impulso serio. Pero después de un movimiento tan grande, la gran pregunta es si los compradores pueden seguir presionando o empezar a tomar ganancias. Este es el tipo de movimiento en el que perseguir puede volverse caro rápidamente.
$BTW — +27.07% con un volumen de 179.83M muestra un interés de compra sólido, sin el pico extremo visto en QNT. Si el volumen continúa aumentando, el movimiento puede seguir siendo interesante, pero perder el impulso después de este salto podría provocar una rápida corrección.
$MARSCOIN — +18.93% con un volumen de 132.26M parece más controlado en comparación con los otros dos. El movimiento tiene una participación decente, pero aún necesita un volumen sostenido para convertir este impulso en una continuación más fuerte en lugar de ser solo un rebote a corto plazo.
$BTW — +27.07% con un volumen de 179.83M muestra un interés de compra sólido, sin el pico extremo visto en QNT. Si el volumen continúa aumentando, el movimiento puede seguir siendo interesante, pero perder el impulso después de este salto podría provocar una rápida corrección.
$MARSCOIN — +18.93% con un volumen de 132.26M parece más controlado en comparación con los otros dos. El movimiento tiene una participación decente, pero aún necesita un volumen sostenido para convertir este impulso en una continuación más fuerte en lugar de ser solo un rebote a corto plazo.
728
·
--
Alcista
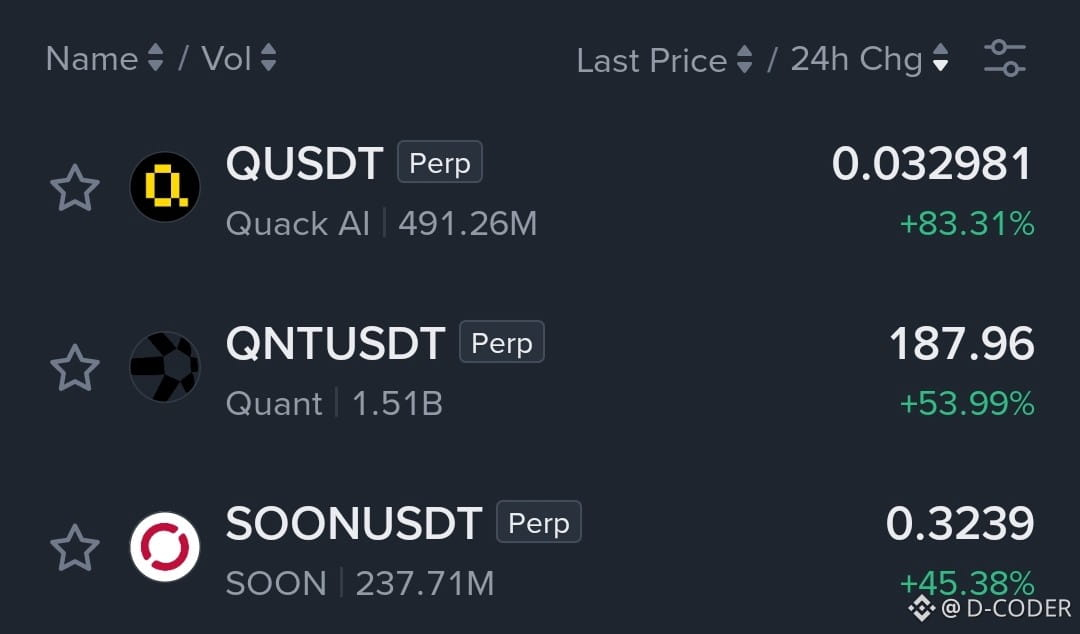
$Q — El movimiento ya es agresivo con +83.31%, con un volumen cercano a 491M. Ese tipo de expansión puede atraer compradores tardíos rápidamente, pero también incrementa el riesgo de retrocesos pronunciados si el impulso empieza a perderse.
{future}(QUSDT)
$QNT — +53.99% con aproximadamente 1.51B de volumen muestra una participación sólida detrás del movimiento. La clave ahora es si los compradores pueden seguir absorbiendo la toma de ganancias después de una subida tan grande; perseguir el impulso después del pico puede volverse arriesgado.
{future}(QNTUSDT)
$SOON — +45.38% y alrededor de 237.71M de volumen lo coloca firmemente en territorio de momentum. El movimiento se ve fuerte, pero después de un repunte de +45%, la volatilidad puede aumentar rápido, así que la próxima consolidación o retroceso puede revelar si el movimiento tiene continuidad real.
{future}(SOONUSDT)
$Q — El movimiento ya es agresivo con +83.31%, con un volumen cercano a 491M. Ese tipo de expansión puede atraer compradores tardíos rápidamente, pero también incrementa el riesgo de retrocesos pronunciados si el impulso empieza a perderse.
$QNT — +53.99% con aproximadamente 1.51B de volumen muestra una participación sólida detrás del movimiento. La clave ahora es si los compradores pueden seguir absorbiendo la toma de ganancias después de una subida tan grande; perseguir el impulso después del pico puede volverse arriesgado.
$SOON — +45.38% y alrededor de 237.71M de volumen lo coloca firmemente en territorio de momentum. El movimiento se ve fuerte, pero después de un repunte de +45%, la volatilidad puede aumentar rápido, así que la próxima consolidación o retroceso puede revelar si el movimiento tiene continuidad real.
$QNT — +53.99% con aproximadamente 1.51B de volumen muestra una participación sólida detrás del movimiento. La clave ahora es si los compradores pueden seguir absorbiendo la toma de ganancias después de una subida tan grande; perseguir el impulso después del pico puede volverse arriesgado.
$SOON — +45.38% y alrededor de 237.71M de volumen lo coloca firmemente en territorio de momentum. El movimiento se ve fuerte, pero después de un repunte de +45%, la volatilidad puede aumentar rápido, así que la próxima consolidación o retroceso puede revelar si el movimiento tiene continuidad real.
597
·
--
Alcista
$HYPE cerca de $93.
Aquí es donde la multitud se vuelve peligrosa.
Cuando todos a tu alrededor están ganando dinero, quedarse fuera empieza a sentirse como si estuvieras perdiendo dinero.
Así que entras no porque la configuración haya mejorado...
sino porque ver a otras personas ganar se volvió insoportable.
Eso no es convicción.
Eso es FOMO con traje.
{future}(HYPEUSDT)
$HYPE cerca de $93.
Aquí es donde la multitud se vuelve peligrosa.
Cuando todos a tu alrededor están ganando dinero, quedarse fuera empieza a sentirse como si estuvieras perdiendo dinero.
Así que entras no porque la configuración haya mejorado...
sino porque ver a otras personas ganar se volvió insoportable.
Eso no es convicción.
Eso es FOMO con traje.
Aquí es donde la multitud se vuelve peligrosa.
Cuando todos a tu alrededor están ganando dinero, quedarse fuera empieza a sentirse como si estuvieras perdiendo dinero.
Así que entras no porque la configuración haya mejorado...
sino porque ver a otras personas ganar se volvió insoportable.
Eso no es convicción.
Eso es FOMO con traje.
71
·
--
Alcista
$AAVE is moving again.
Aquí está la parte incómoda:
Un trader puede estar completamente en lo correcto sobre la dirección...
y aun así perder dinero al entrar en el momento equivocado.
Ser alcista no es una estrategia de entrada.
A veces la operación más difícil es ver cómo una moneda sube sin ti.
{future}(AAVEUSDT)
$AAVE is moving again.
Aquí está la parte incómoda:
Un trader puede estar completamente en lo correcto sobre la dirección...
y aun así perder dinero al entrar en el momento equivocado.
Ser alcista no es una estrategia de entrada.
A veces la operación más difícil es ver cómo una moneda sube sin ti.
Aquí está la parte incómoda:
Un trader puede estar completamente en lo correcto sobre la dirección...
y aun así perder dinero al entrar en el momento equivocado.
Ser alcista no es una estrategia de entrada.
A veces la operación más difícil es ver cómo una moneda sube sin ti.
54
·
--
Alcista
$UNI cerca de $9.
A todos les encanta la idea de atrapar una moneda antes del “movimiento real”.
Pero una vez que el movimiento realmente empieza, la psicología cambia.
Dejas de preguntarte: “¿Es una buena entrada?”.
Empiezas a preguntarte: “¿Y si me lo pierdo?”.
Esa segunda pregunta ha vaciado muchos monederos.
{future}(UNIUSDT)
$UNI cerca de $9.
A todos les encanta la idea de atrapar una moneda antes del “movimiento real”.
Pero una vez que el movimiento realmente empieza, la psicología cambia.
Dejas de preguntarte: “¿Es una buena entrada?”.
Empiezas a preguntarte: “¿Y si me lo pierdo?”.
Esa segunda pregunta ha vaciado muchos monederos.
A todos les encanta la idea de atrapar una moneda antes del “movimiento real”.
Pero una vez que el movimiento realmente empieza, la psicología cambia.
Dejas de preguntarte: “¿Es una buena entrada?”.
Empiezas a preguntarte: “¿Y si me lo pierdo?”.
Esa segunda pregunta ha vaciado muchos monederos.
74
·
--
Bajista
$NEAR is subiendo de nuevo.
Y aquí es donde los traders pueden convertirse en prisioneros de su propia predicción.
Llaman al primer movimiento una ruptura.
Luego necesitan el segundo movimiento para demostrar que tienen razón.
Entonces empiezan a defender la moneda en lugar de analizarla.
En algún momento, ya no estás operando el mercado.
Estás defendiendo tu ego.
{future}(NEARUSDT)
$NEAR is subiendo de nuevo.
Y aquí es donde los traders pueden convertirse en prisioneros de su propia predicción.
Llaman al primer movimiento una ruptura.
Luego necesitan el segundo movimiento para demostrar que tienen razón.
Entonces empiezan a defender la moneda en lugar de analizarla.
En algún momento, ya no estás operando el mercado.
Estás defendiendo tu ego.
Y aquí es donde los traders pueden convertirse en prisioneros de su propia predicción.
Llaman al primer movimiento una ruptura.
Luego necesitan el segundo movimiento para demostrar que tienen razón.
Entonces empiezan a defender la moneda en lugar de analizarla.
En algún momento, ya no estás operando el mercado.
Estás defendiendo tu ego.
104
·
--
Alcista
$TAO at $268 es exactamente donde la codicia empieza a ponerse interesante.
A $100, la gente quería una razón para comprar.
A $268, de repente la gente empieza a encontrar razones para que pueda llegar a $500.
El gráfico no creó esa creencia.
La ganancia que ya tenían delante sí lo hizo.
{future}(TAOUSDT)
$TAO at $268 es exactamente donde la codicia empieza a ponerse interesante.
A $100, la gente quería una razón para comprar.
A $268, de repente la gente empieza a encontrar razones para que pueda llegar a $500.
El gráfico no creó esa creencia.
La ganancia que ya tenían delante sí lo hizo.
A $100, la gente quería una razón para comprar.
A $268, de repente la gente empieza a encontrar razones para que pueda llegar a $500.
El gráfico no creó esa creencia.
La ganancia que ya tenían delante sí lo hizo.
154
Inicia sesión para explorar más contenidos
Únete a usuarios globales de criptomonedas en Binance Square
⚡️ Obtén información útil y actualizada sobre criptos.
💬 Avalado por el mayor exchange de criptomonedas en el mundo.
👍 Descubre perspectivas reales de creadores verificados.
Email/número de teléfono
Temas populares
FedMinutesFocusOnOctoberPause
80 vistas
57 están debatiendo
#fedminutesfocusonoctoberpause
Se acercan las actas de la Fed y ya sabemos cómo acaba: ¡sin que haya terminado la reunión, todo el mundo ya adivina sus próximos pasos! 🤫
Muchos se preguntan: «¿Por qué la prensa ya analiza las actas del FOMC como si las conociera, si todavía faltan casi 6 horas para que se publiquen?». En realidad, es una «filtración calculada» a través de declaraciones previas de los jefes de la Fed. El de Nueva York dice «sin prisa» y el de Dallas pide «mano dura y mano suave». Si a eso le sumamos la inflación a la baja y un mercado laboral debilitándose, el mercado entiende que la Fed hará una pausa en las subidas de tipos este octubre para tomar aire, en lugar de mantener una postura tan agresiva como antes.
¿Qué deberían hacer los traders? No se dejen llevar por el FOMO ni se adelanten al tren. Cuando salgan las actas oficiales, si hay alguna sorpresa, el gráfico puede barrer rápidamente ambos lados. ¡Quédense quietos y abróchense el cinturón!
⚠️ Esto no es asesoramiento financiero.
Regístrate en Binance con el código VINHTOCDO o a través del enlace: https://www.binance.com/register?ref=VINHTOCDO y ¡recibe una recompensa ahora!
Haz clic en el botón de abajo para operar y apoyarme: $BTC
, $ETH
, $SOL
#FOMCMinutes #TinFed #TradFiNews #TheoDõiFOMC #VINHTOCDO
Vinhtocdo
·1 me gusta
·297 vistas
BinanceLaunchesBinanceIntelligence
860,366 vistas
5,315 están debatiendo
RobinhoodAdds$25MInBitcoinToBalanceSheet
65 vistas
9 están debatiendo