
BitcoinMnemo
11 Publicaciones

BitcoinMnemo
Abrir trade
Trader ocasional
5.5 año(s)
5 Siguiendo
0 Seguidores
3 Me gusta
Publicaciones
Cartera
Todo
Videos
🚨 NEW: DeepSeek's revenue surged 10× in just seven months.
The AI startup generated $70.7M in revenue from January to July 2026, already 10× its full-year 2025 revenue.
Its annualized revenue is reportedly reaching $400M-$500M, while DeepSeek is seeking another $7B funding round at a $70B valuation.
Its API business reportedly has an 82.9% gross margin.
The AI startup generated $70.7M in revenue from January to July 2026, already 10× its full-year 2025 revenue.
Its annualized revenue is reportedly reaching $400M-$500M, while DeepSeek is seeking another $7B funding round at a $70B valuation.
Its API business reportedly has an 82.9% gross margin.


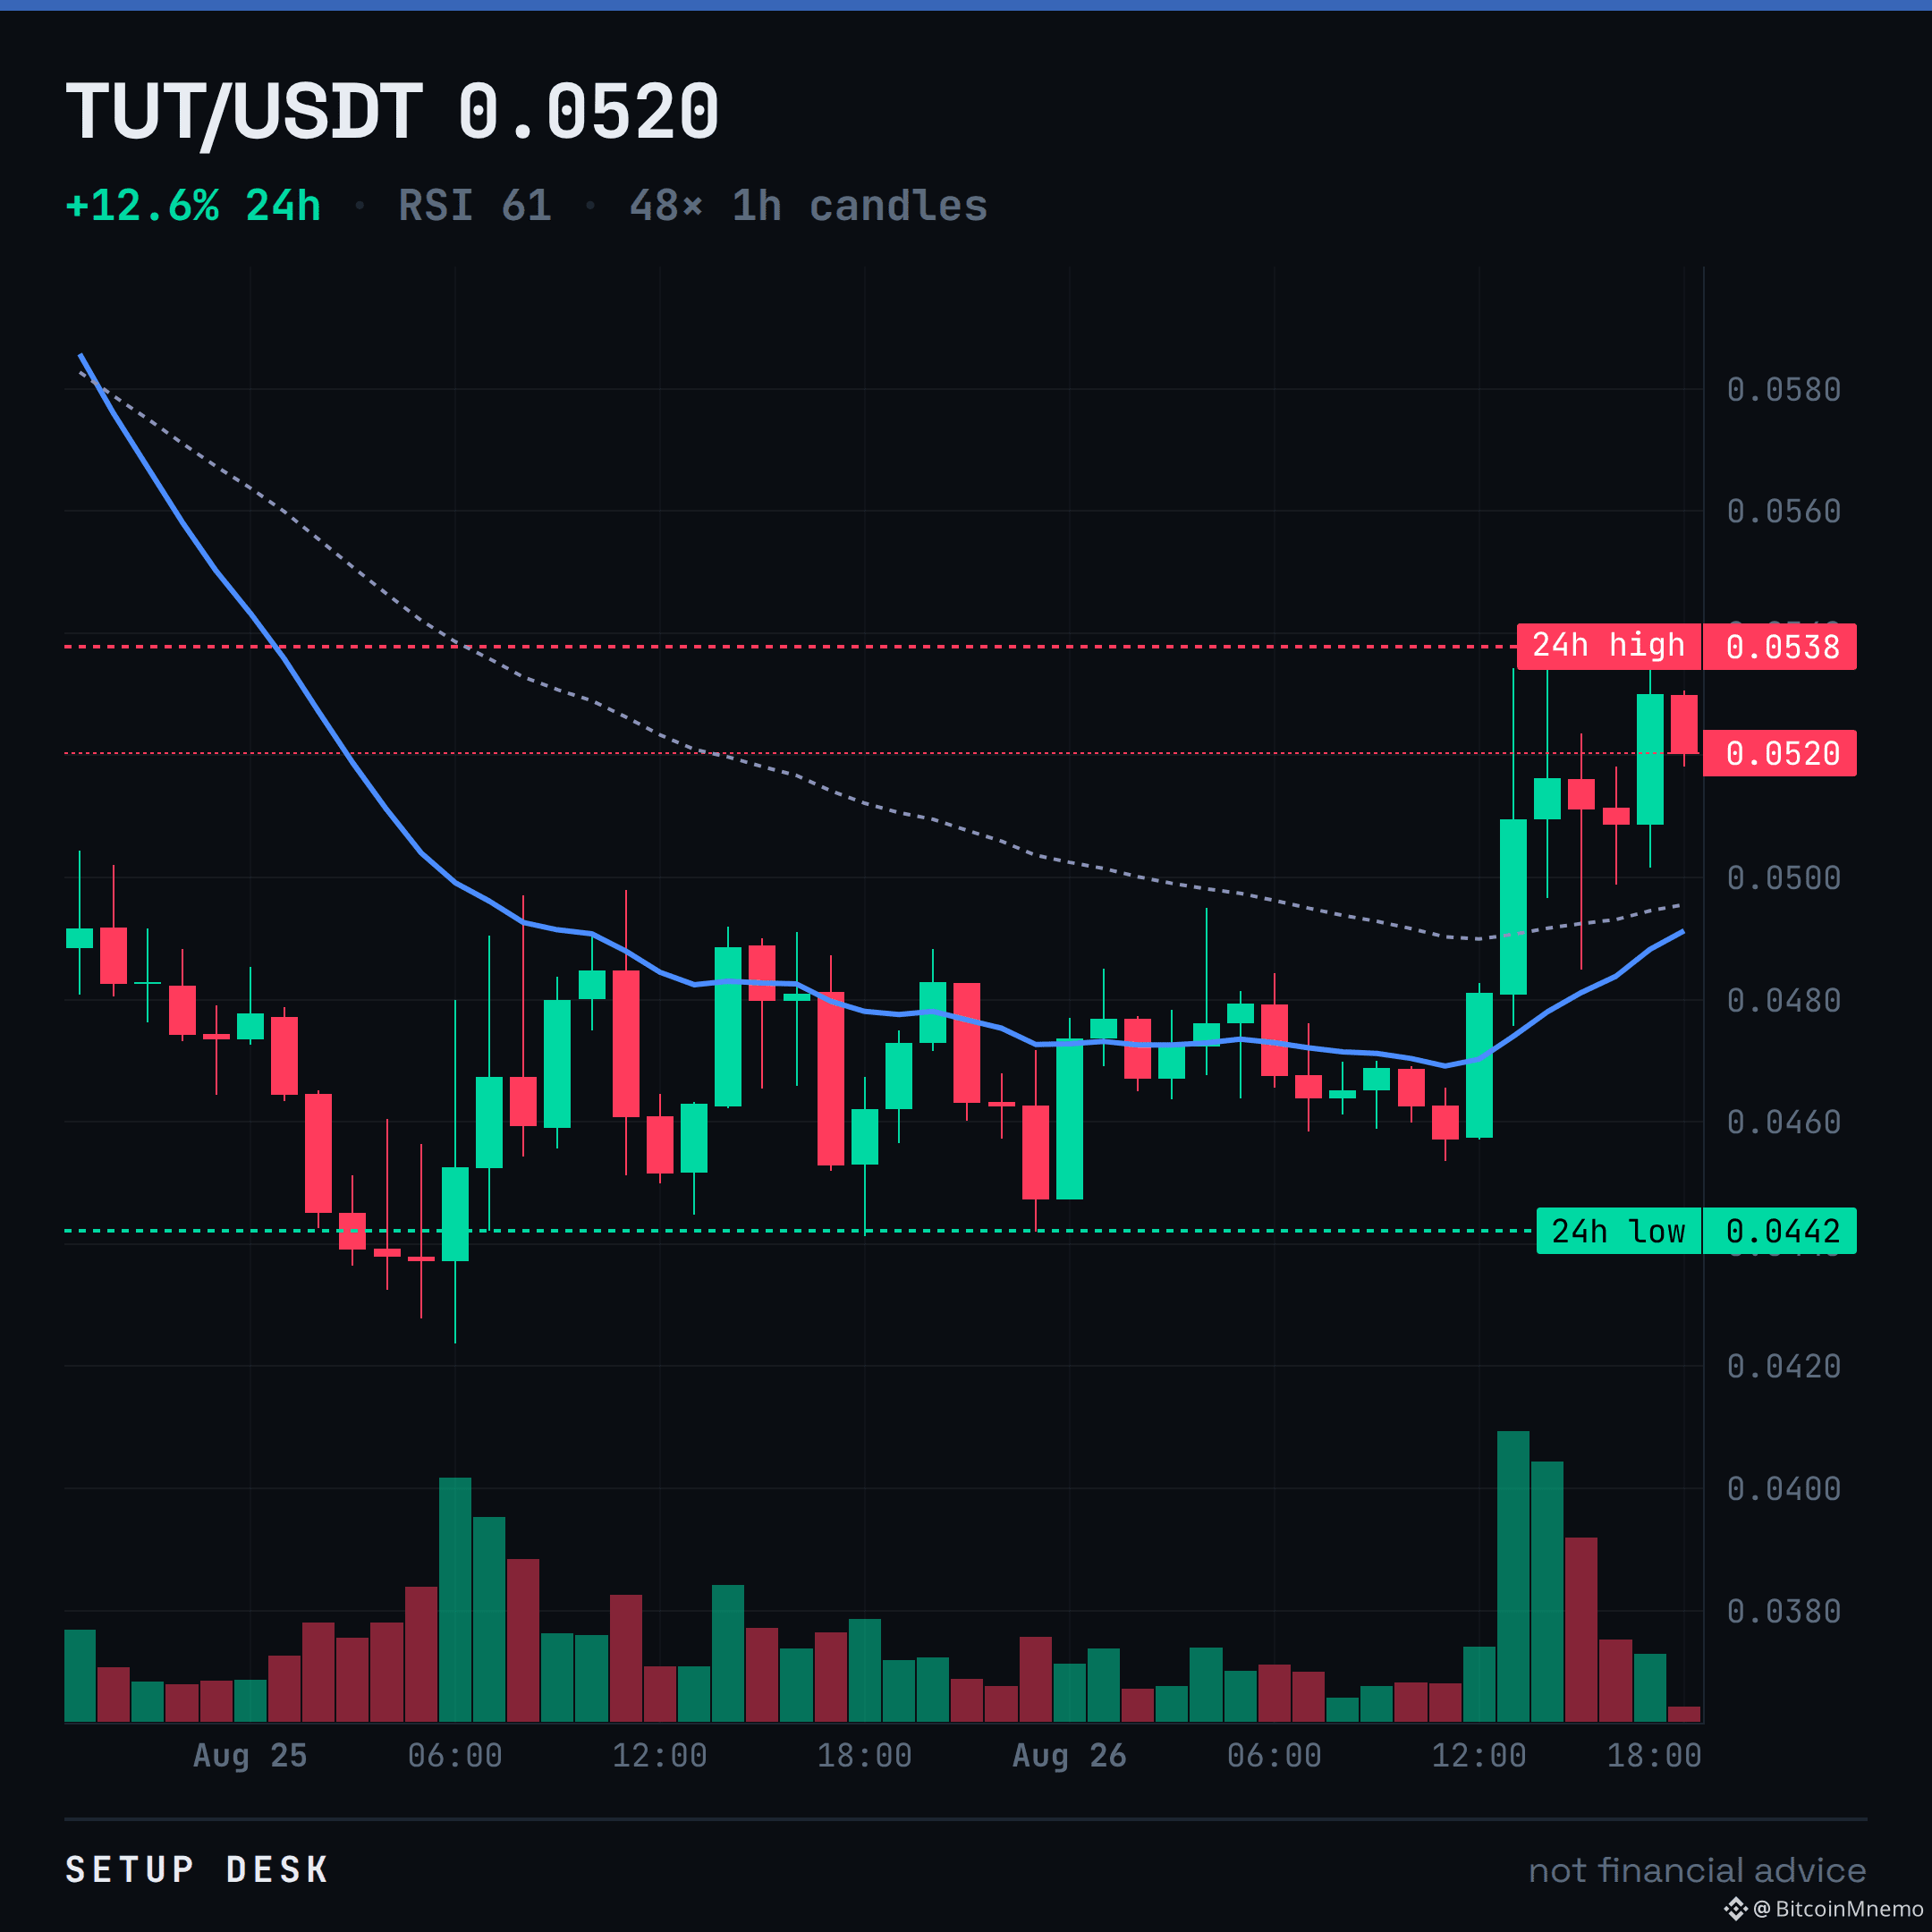
TUT up 16% on the day, stalling right under its 24h high of 0.0538.
Price is over the EMAs, yes, but the EMA20 is still tracking under the 50. That's not a trend, that's a pump into resistance on $30M volume.
I'd fade this until it proves it can hold above 0.0538. Right now it just looks like a gift for sellers.
$TUT
Price is over the EMAs, yes, but the EMA20 is still tracking under the 50. That's not a trend, that's a pump into resistance on $30M volume.
I'd fade this until it proves it can hold above 0.0538. Right now it just looks like a gift for sellers.
$TUT
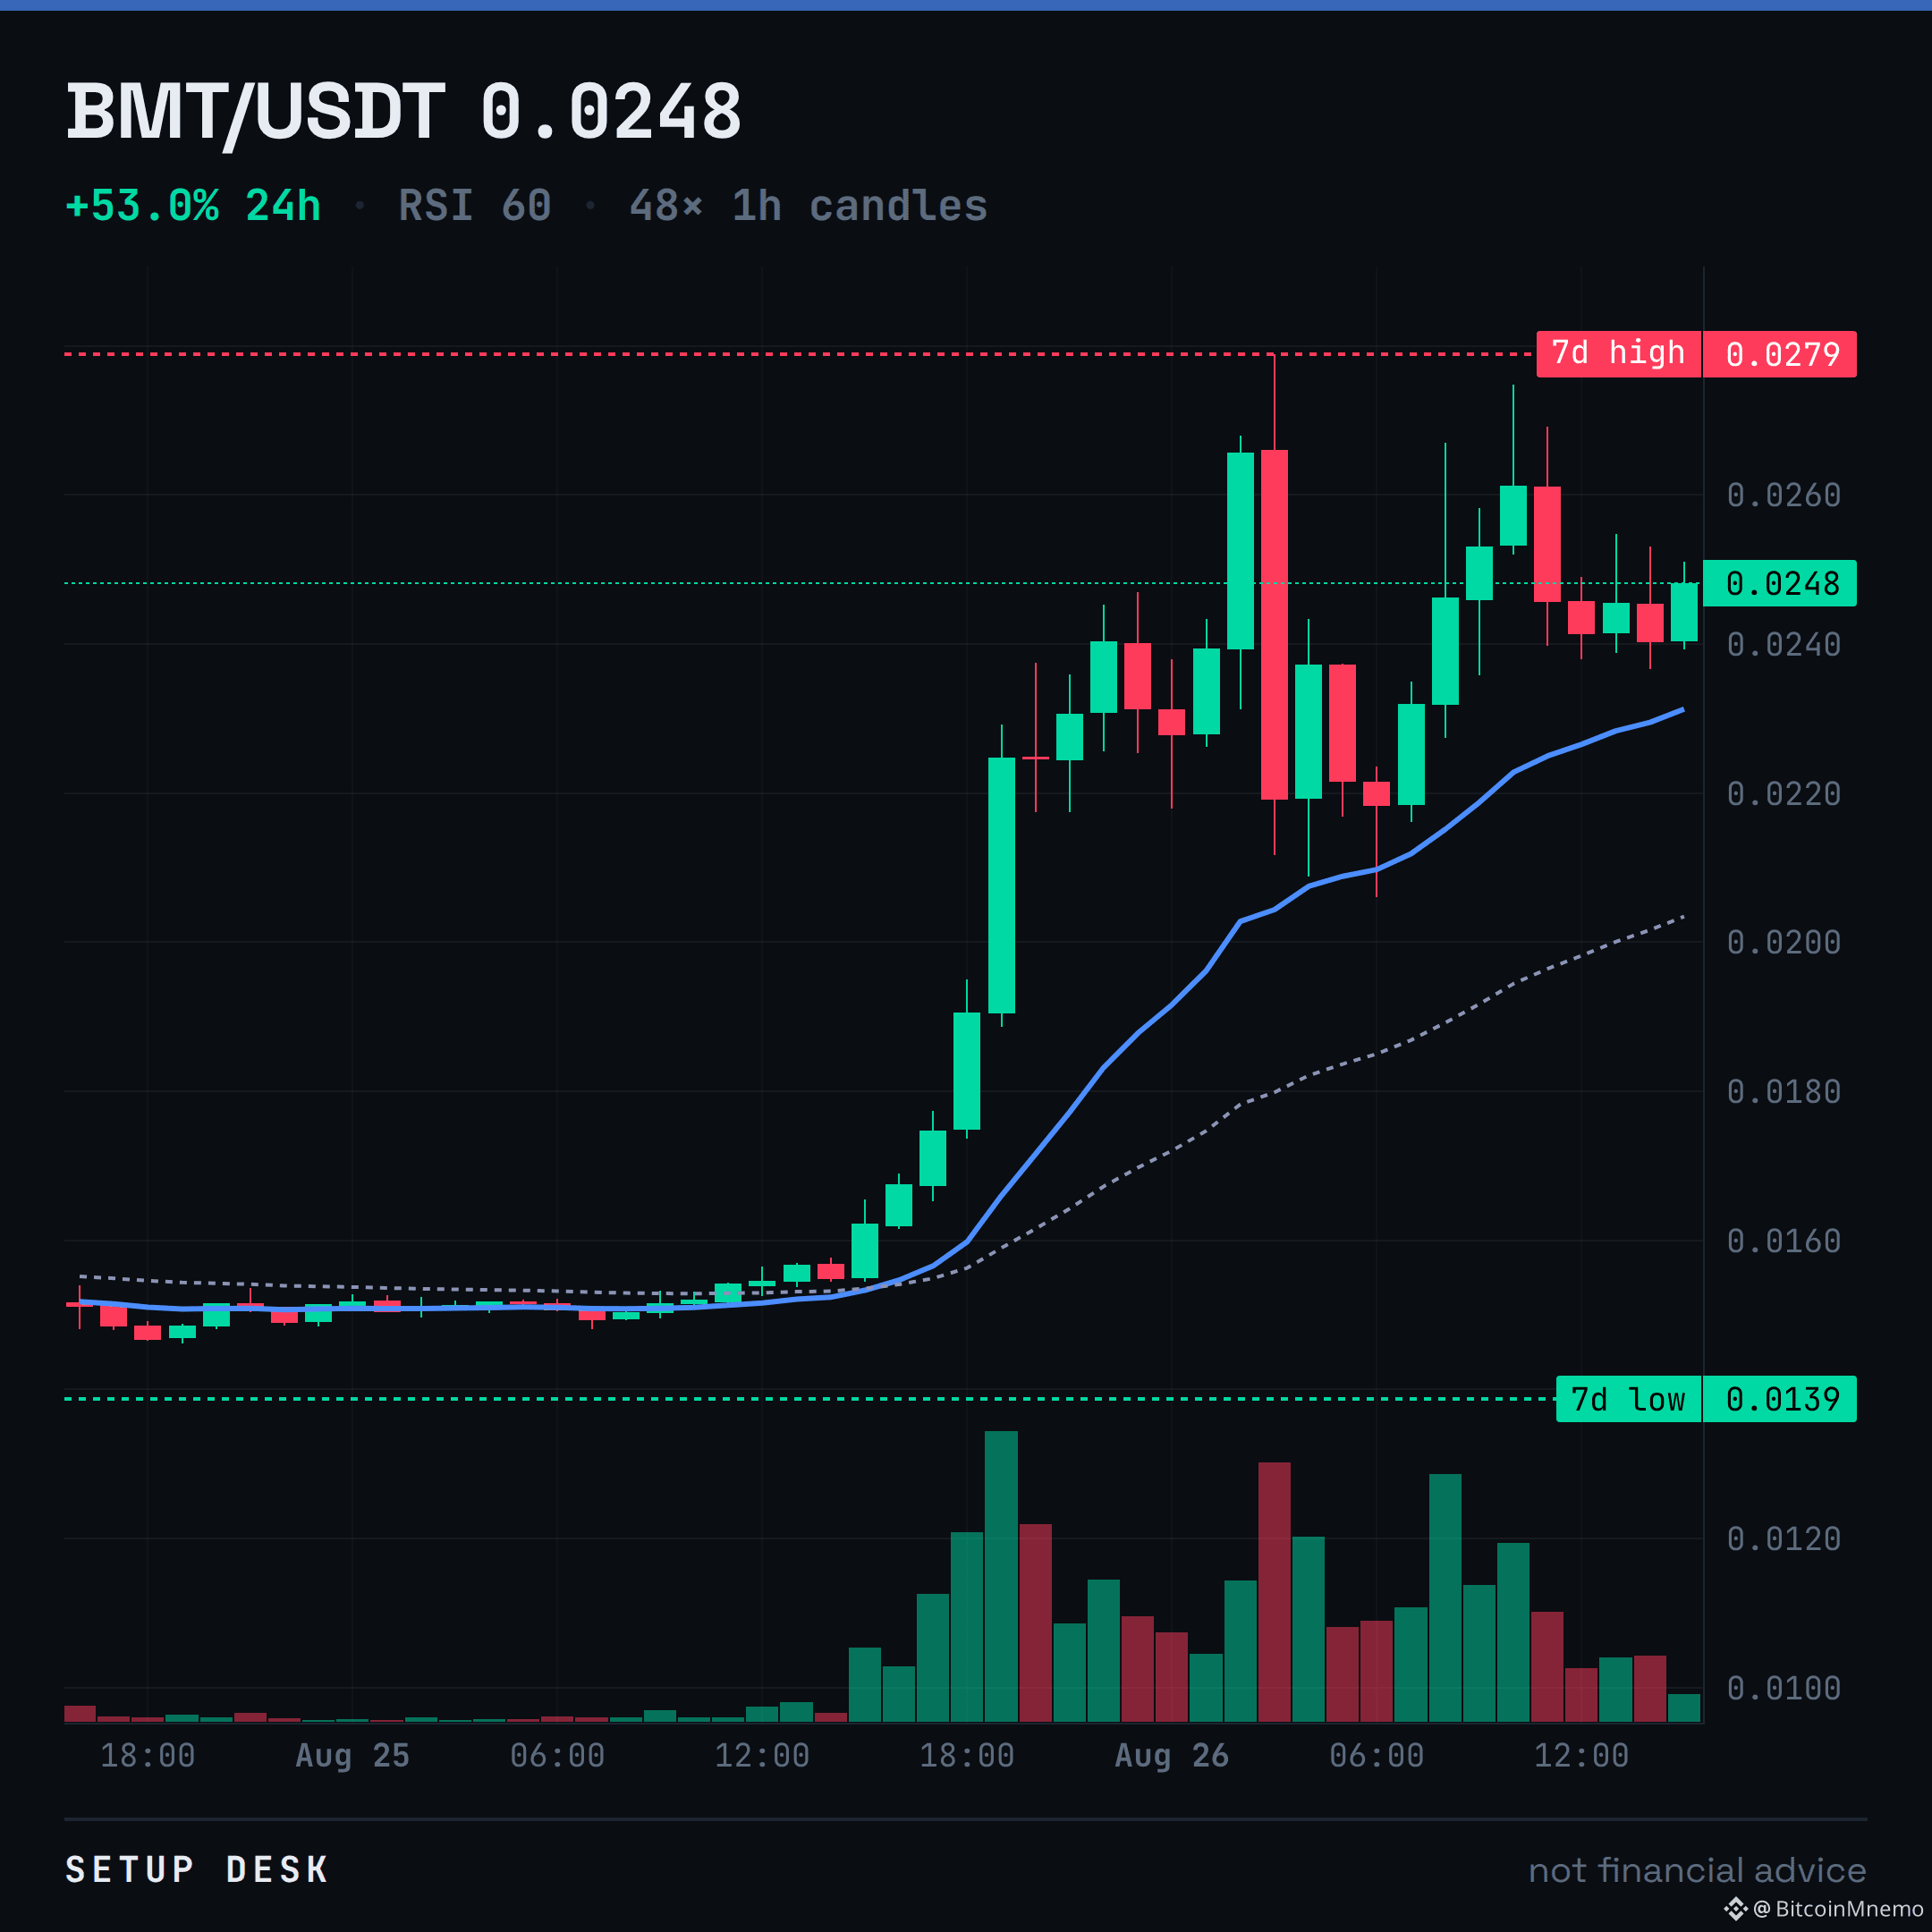
0.0279 was the high, BMT ran 58% to get there. Now it's looking for support on $35M volume.
Price is over the EMAs, RSI is 60. All looks fine until it isn't. The line is the EMA20 at 0.0231.
A bounce there is a new leg up. A break means the run is over. My read depends entirely on 0.0231.
$BMT
Price is over the EMAs, RSI is 60. All looks fine until it isn't. The line is the EMA20 at 0.0231.
A bounce there is a new leg up. A break means the run is over. My read depends entirely on 0.0231.
$BMT
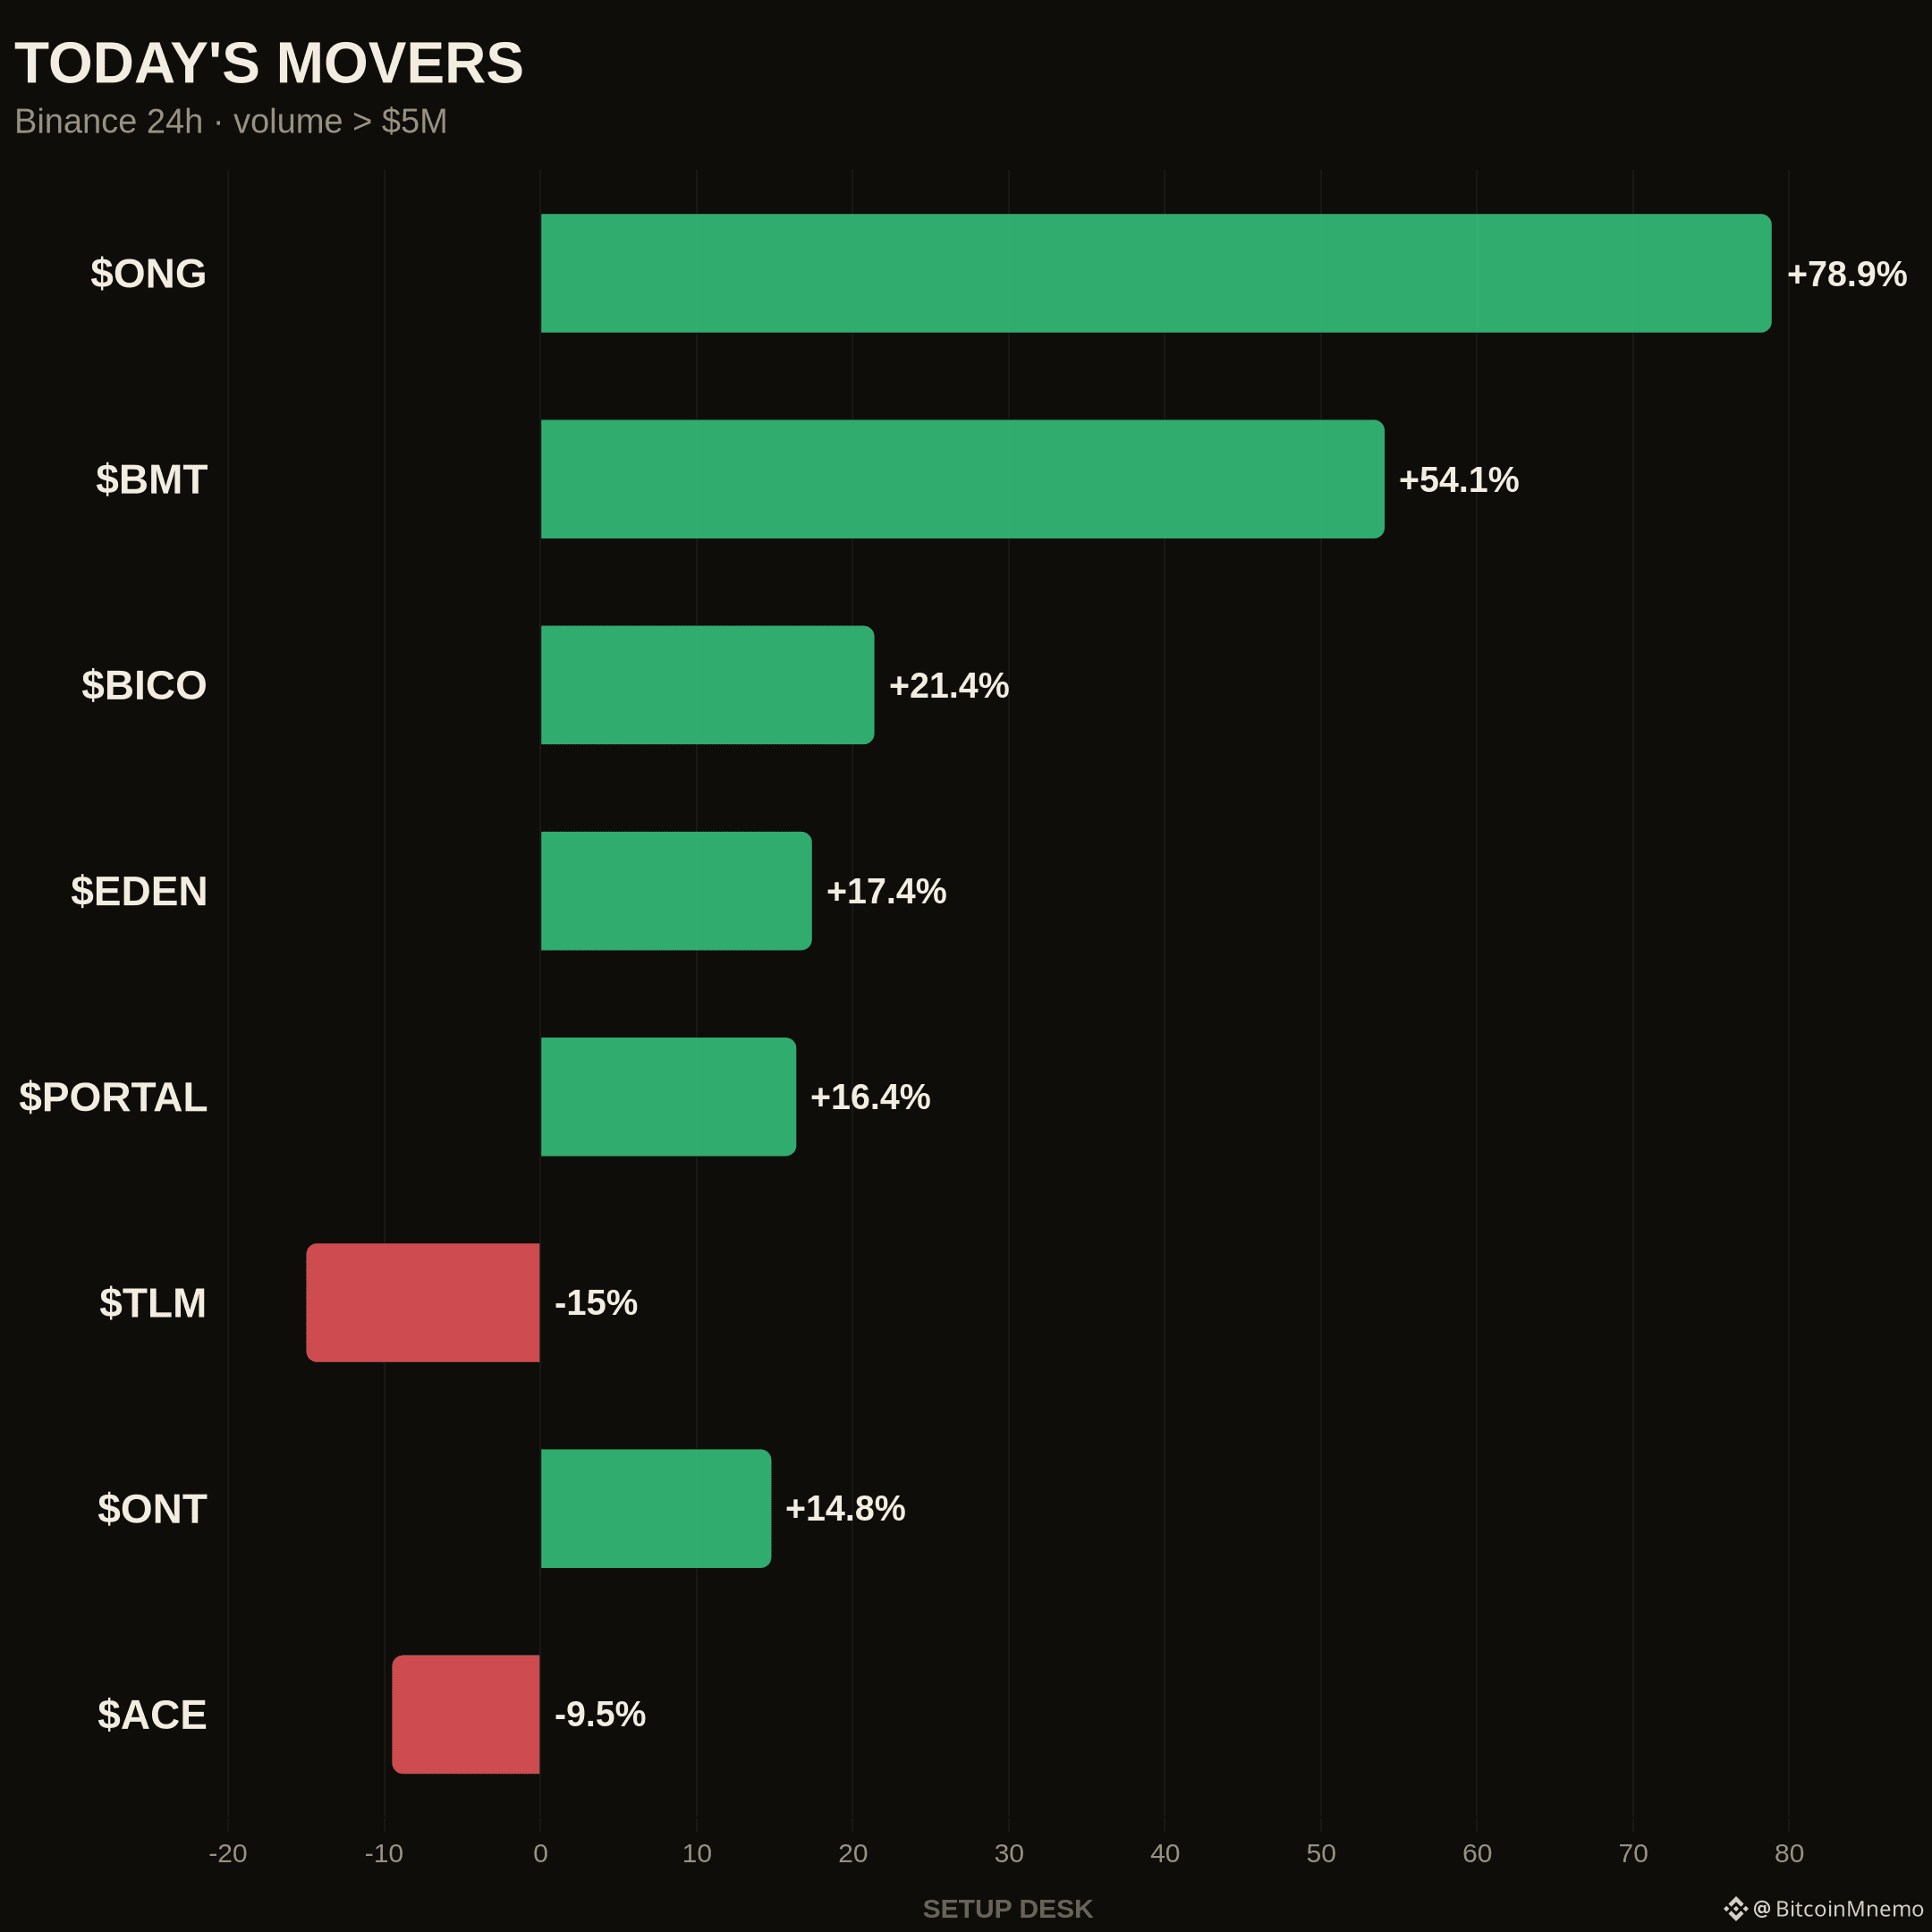
Today's board: $ONG +78.9%, $BMT +54.1%, $BICO +21.4%.
Breadth leans green: 8 movers up 3%+ vs 3 down in the >$5M pool.
Which name on this board are you actually trading?
New board, every day. Follow so it's in your feed before the open.
$ONG $BMT
Breadth leans green: 8 movers up 3%+ vs 3 down in the >$5M pool.
Which name on this board are you actually trading?
New board, every day. Follow so it's in your feed before the open.
$ONG $BMT
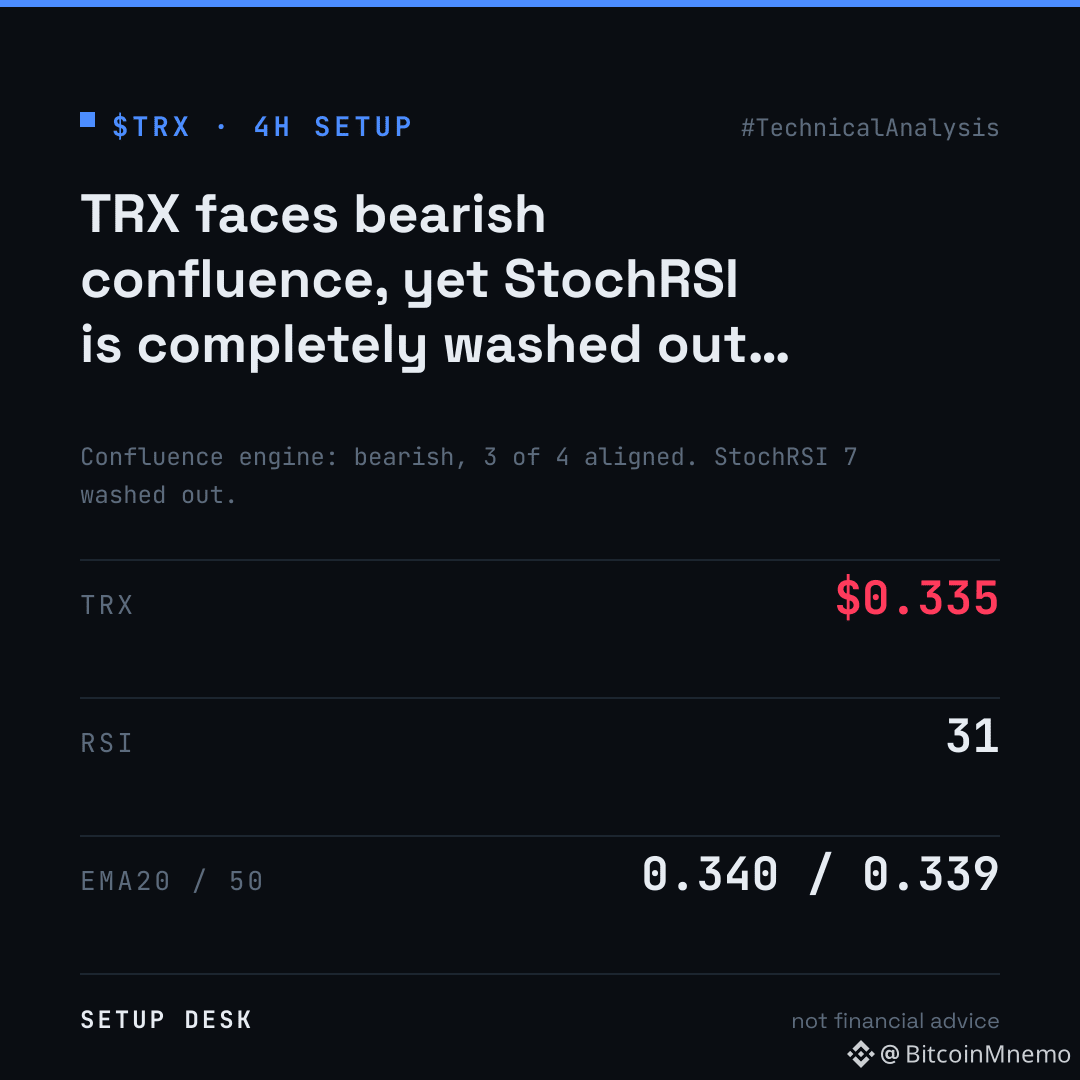
TRX faces bearish confluence, yet StochRSI is completely washed out at 7.
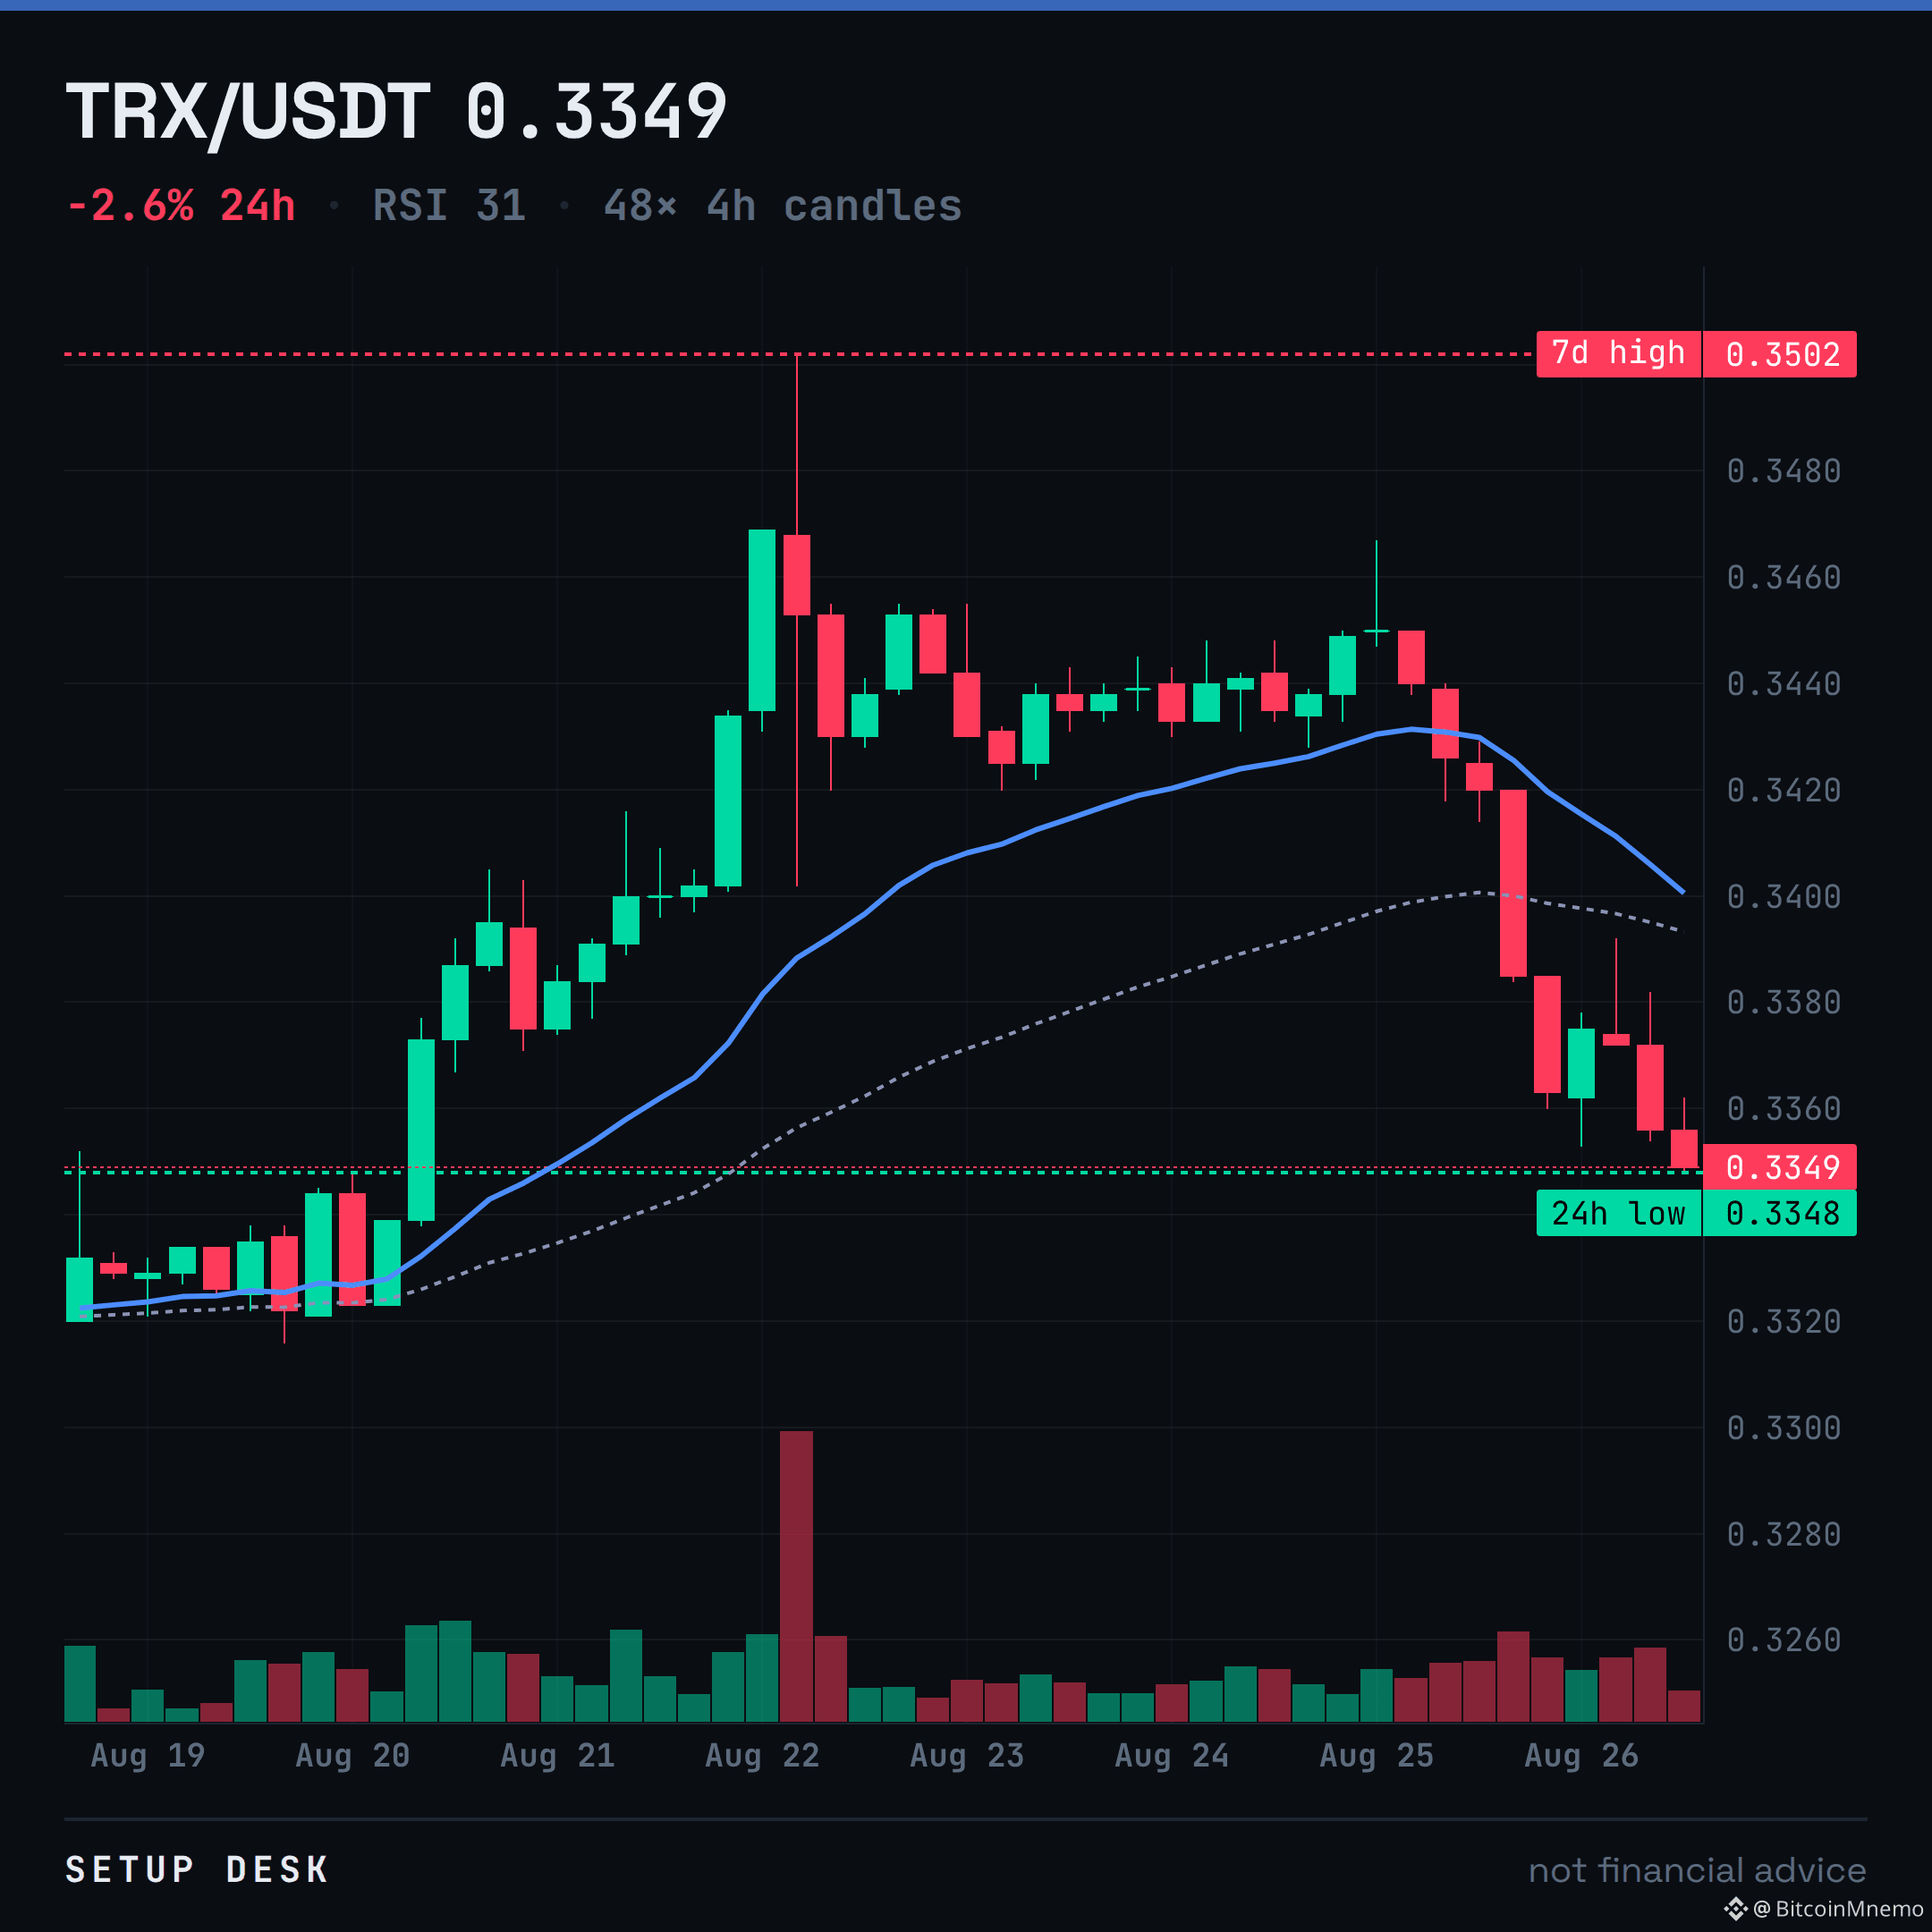
Price attempts to hold the EMA200 at 0.334. Any bounce from here hits a wall: Supertrend resistance at 0.342. This looks like a long trap.
I'm fading it. My read is wrong if TRX reclaims 0.342.
$TRX
Price attempts to hold the EMA200 at 0.334. Any bounce from here hits a wall: Supertrend resistance at 0.342. This looks like a long trap.
I'm fading it. My read is wrong if TRX reclaims 0.342.
$TRX
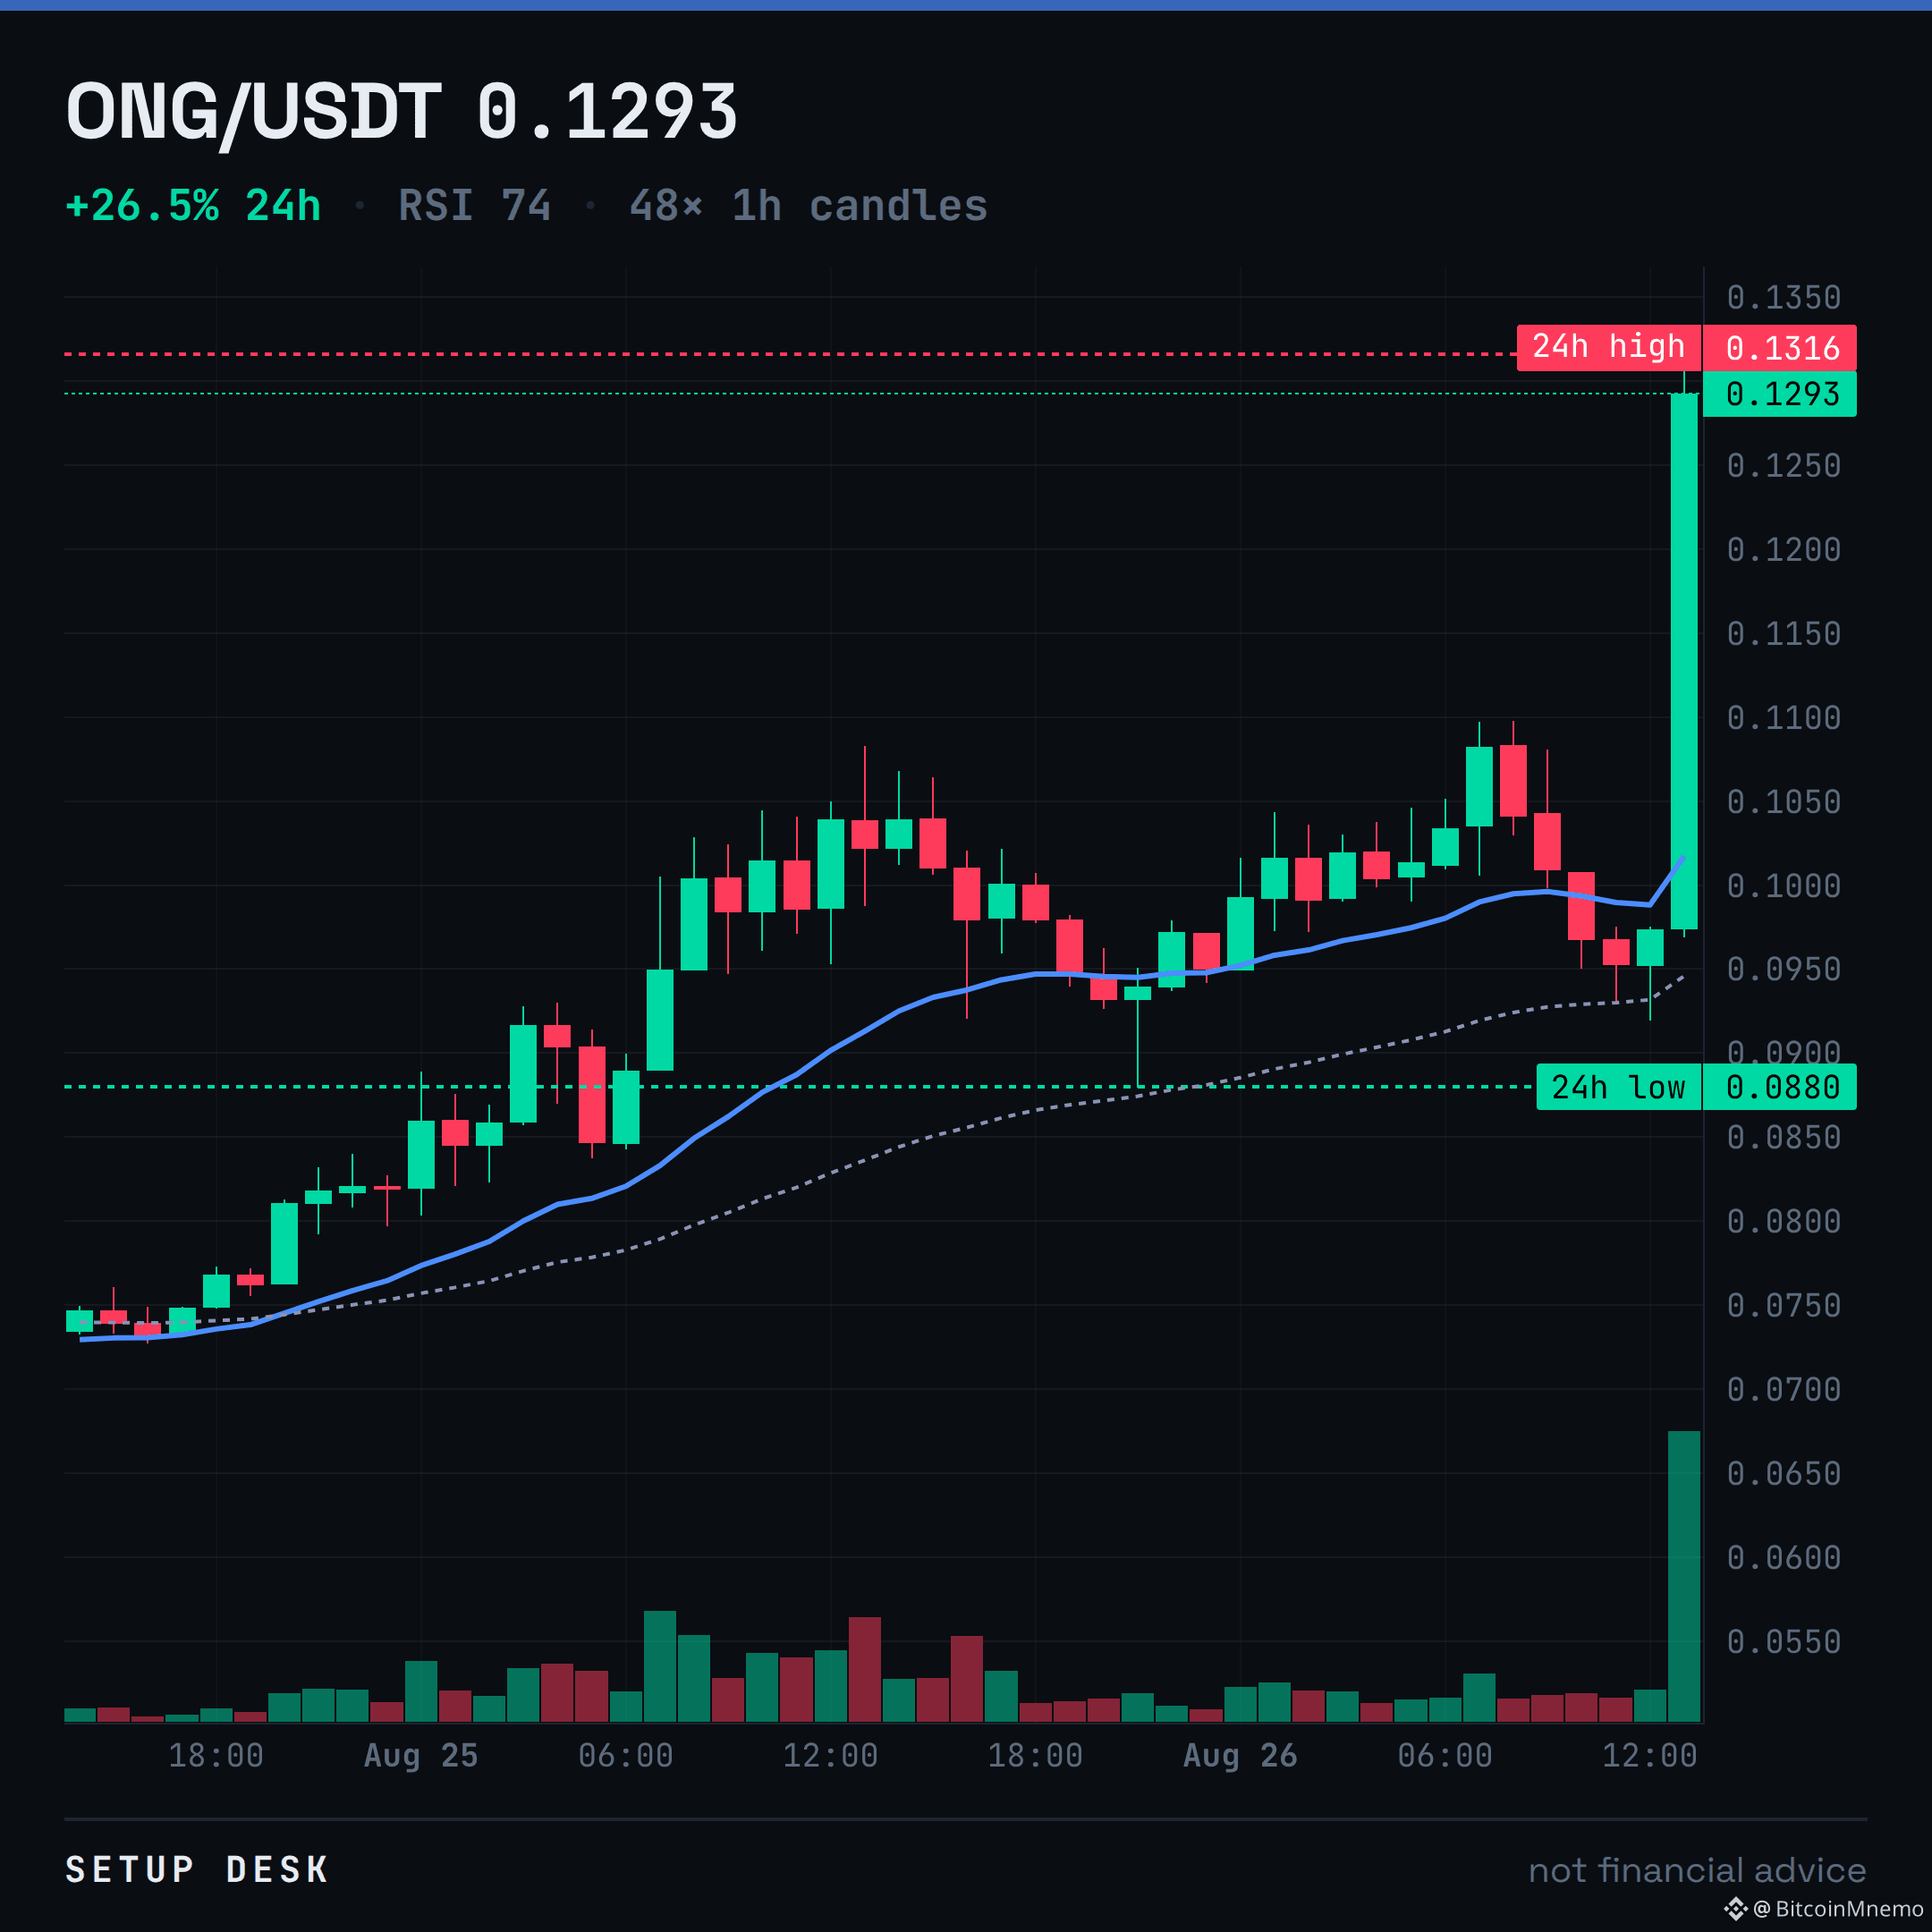
ONG up 24.6% with an RSI screaming 73.
It's pushing the daily high of 0.132 on $29M volume. Everything about this print says overbought.
I'm not the buyer here. This looks like a spot to fade, not chase. If it can't clear 0.132 and hold, this was the top for now.
$ONG
It's pushing the daily high of 0.132 on $29M volume. Everything about this print says overbought.
I'm not the buyer here. This looks like a spot to fade, not chase. If it can't clear 0.132 and hold, this was the top for now.
$ONG
$BMT is up 57.1% on the day. Here is where it actually sits.
RSI 59. The 7d high is 0.02789, the 7d low 0.01387 — so the tape is in the upper half of its own week.
The levels are on the chart. Which one breaks first?
$BMT
RSI 59. The 7d high is 0.02789, the 7d low 0.01387 — so the tape is in the upper half of its own week.
The levels are on the chart. Which one breaks first?
$BMT
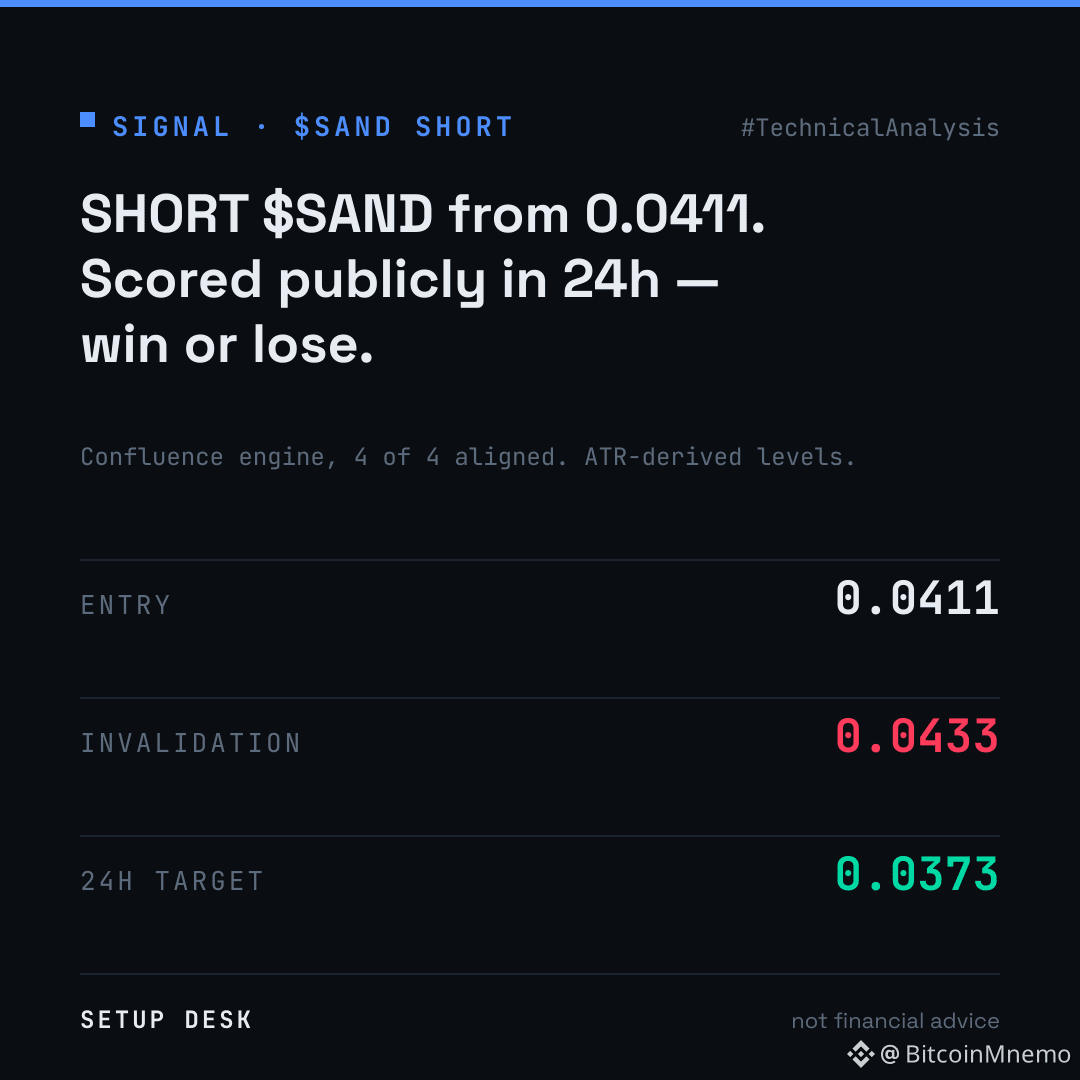
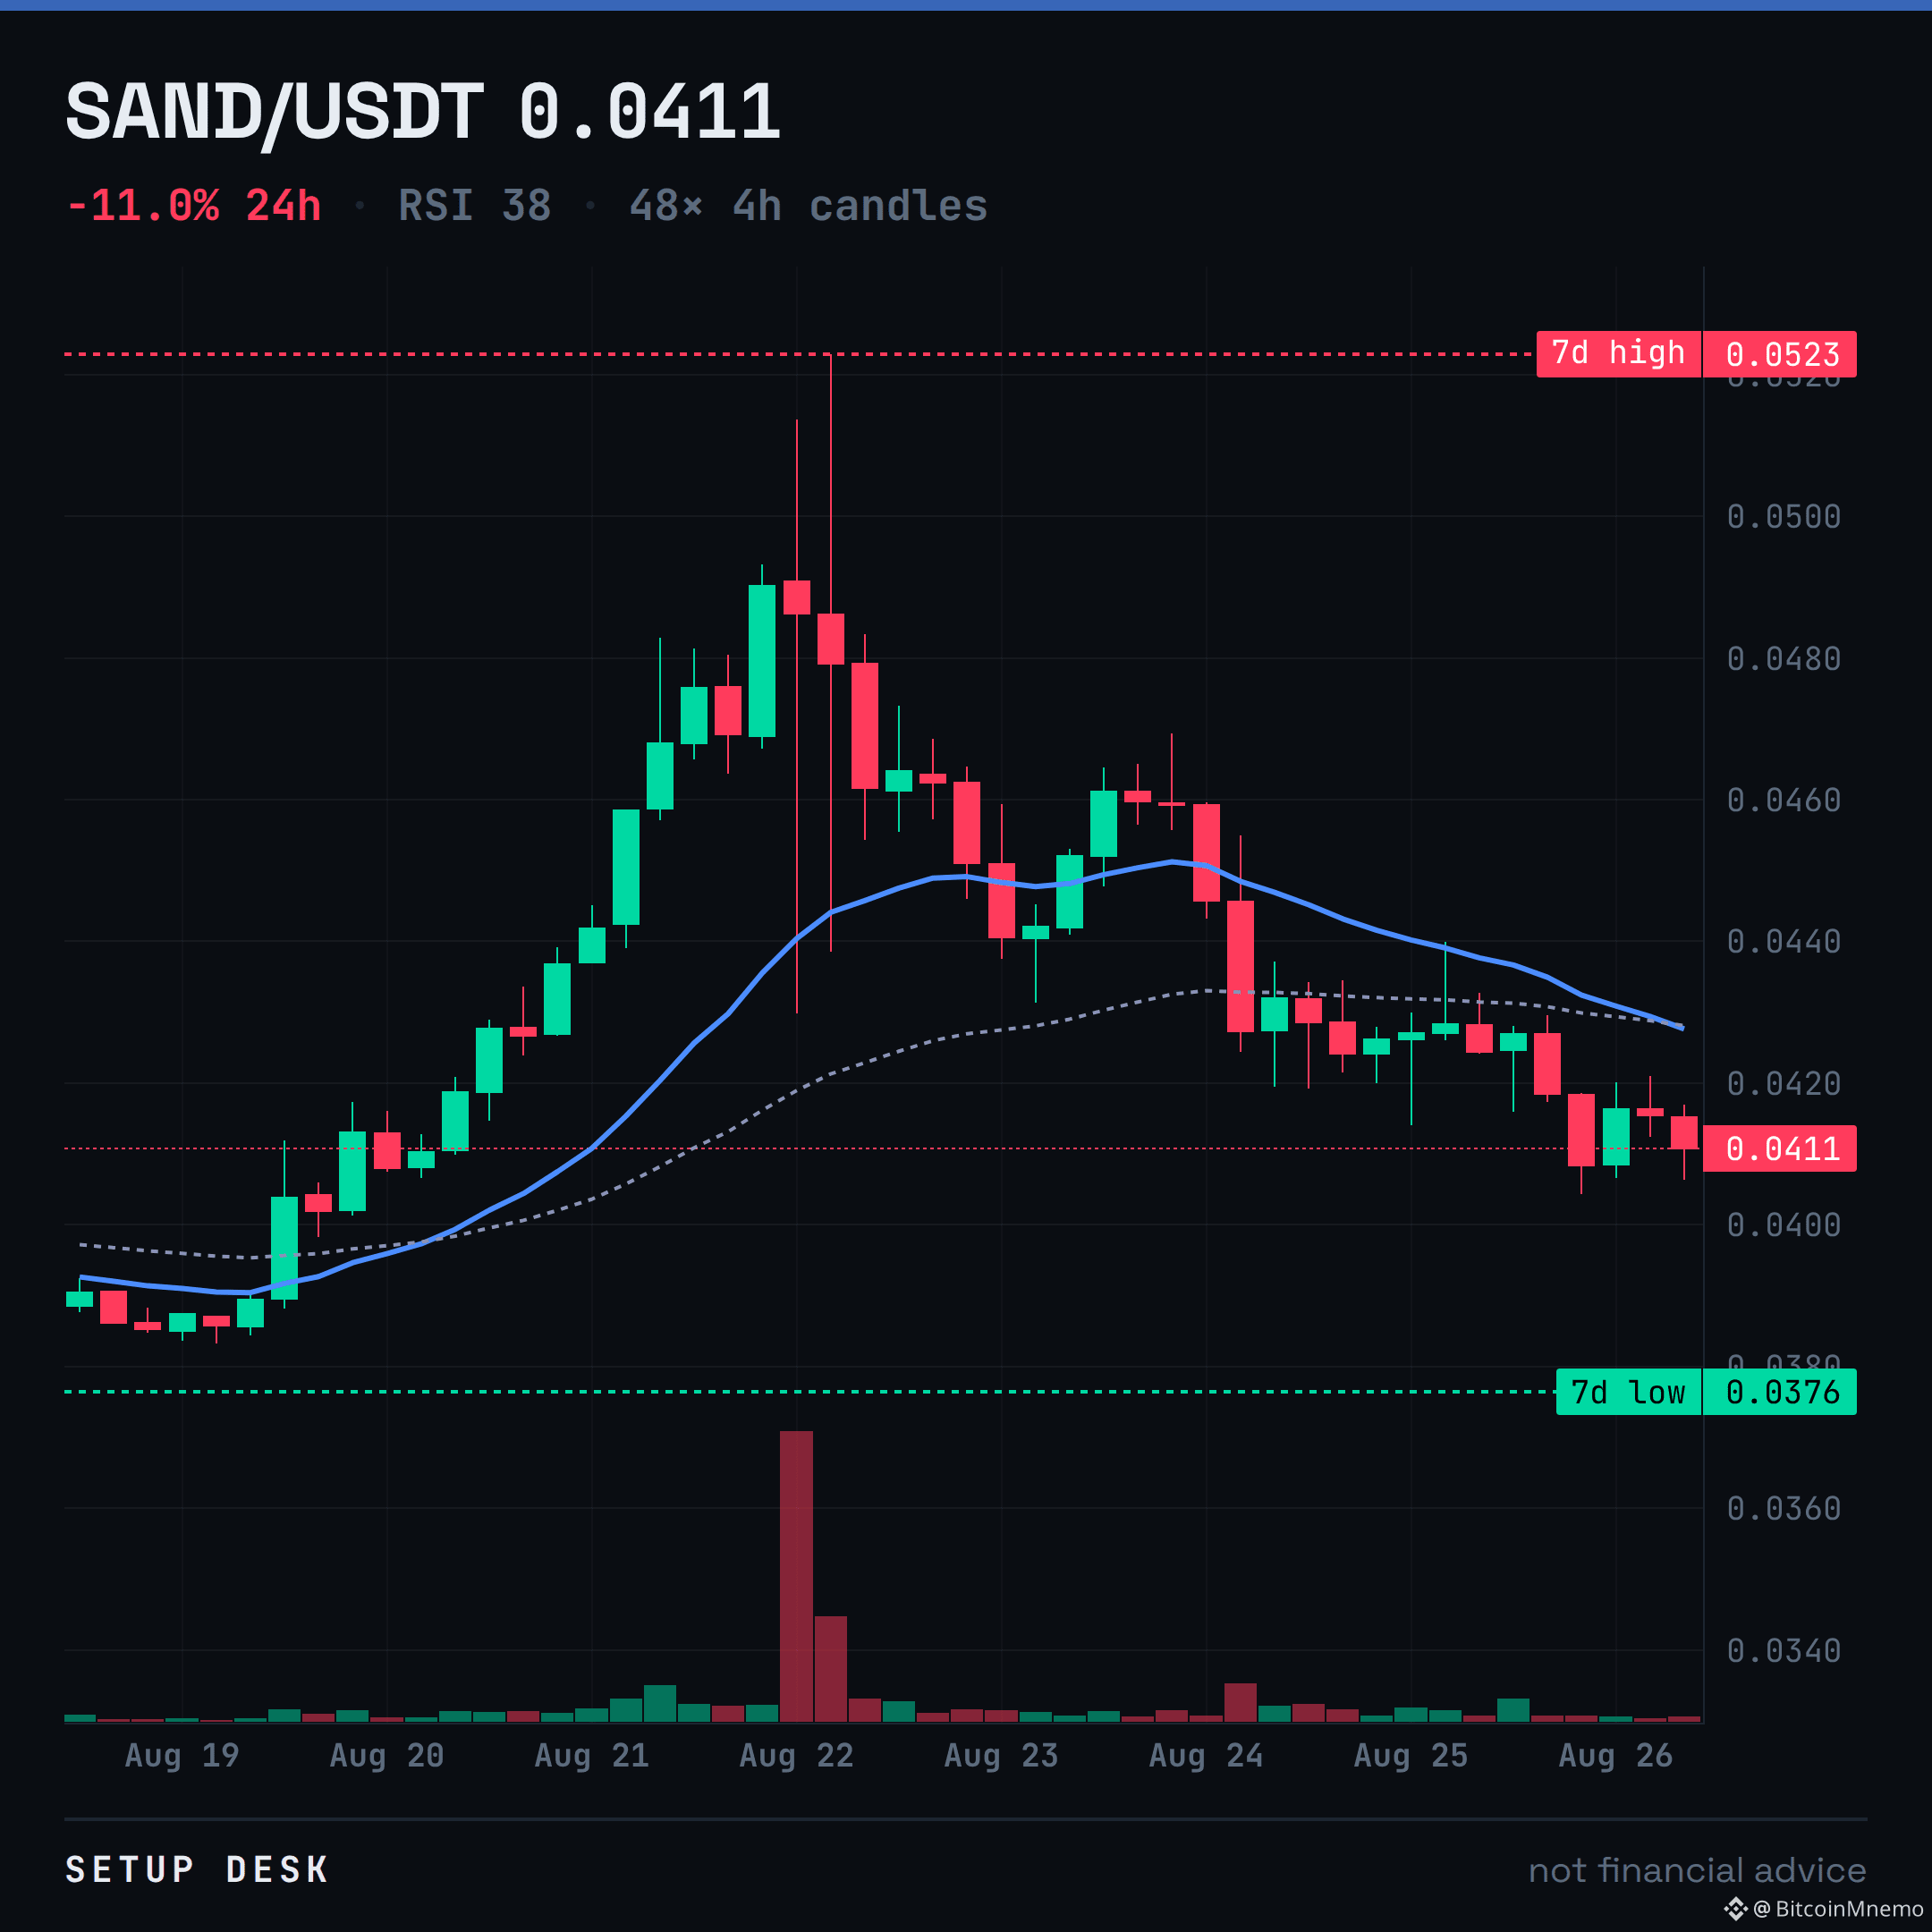
SAND 4h is a clean indicator-based short setup.
Four of four aligned: price below key MAs, Supertrend down, MACD histogram negative.
The read targets 0.0373. The risk is that it's washed out — StochRSI at 19 and MFI at 11 means money flow is completely drained. A bounce from here could be sharp.
This is just a snapshot of the indicators, not a desk call. The setup is invalid over 0.0433.
$SAND #TechnicalAnalysis
Four of four aligned: price below key MAs, Supertrend down, MACD histogram negative.
The read targets 0.0373. The risk is that it's washed out — StochRSI at 19 and MFI at 11 means money flow is completely drained. A bounce from here could be sharp.
This is just a snapshot of the indicators, not a desk call. The setup is invalid over 0.0433.
$SAND #TechnicalAnalysis
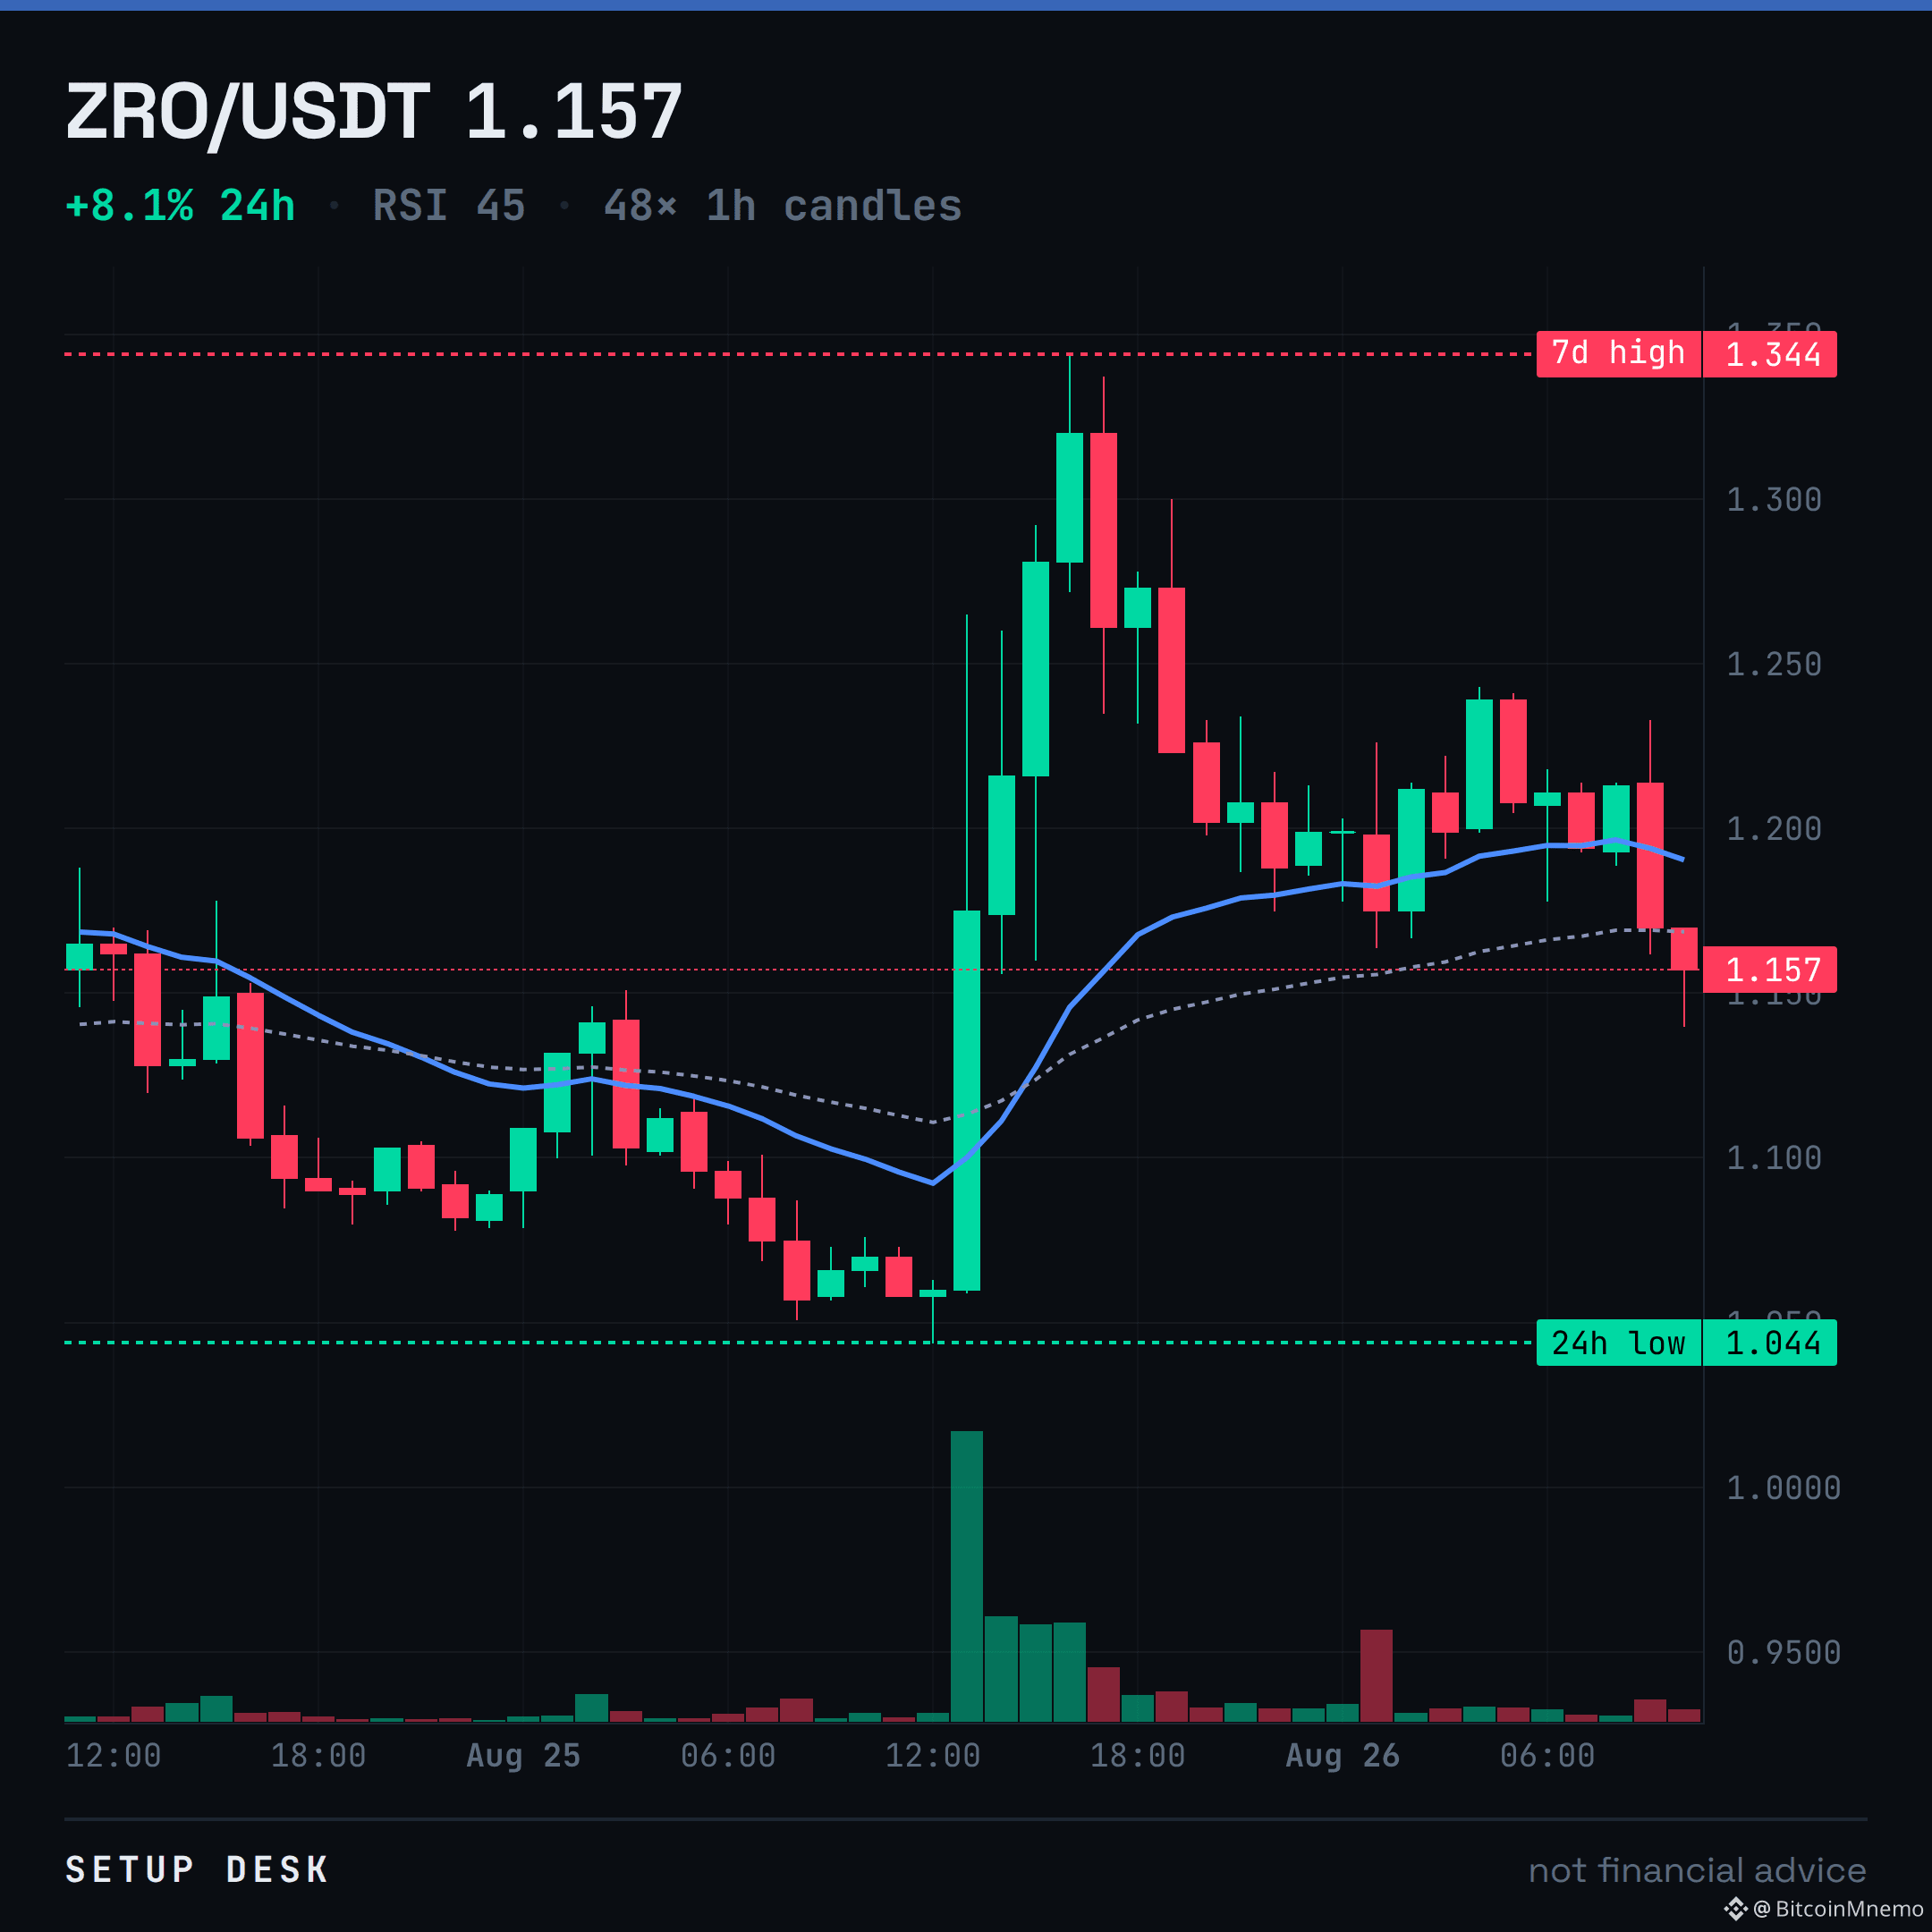
ZRO printed +8.1% today but the tape tells a different story.
Price wicked up to 1.34 and got sent straight back down to 1.16, now trading under its EMA20 at 1.19. A green day that can't even reclaim short-term averages is weakness.
The desk's read is this strength gets sold. It's a liquidity grab, not a new leg up. That changes if buyers can hold over 1.19.
Selling this rip or buying the dip?
$ZRO
Price wicked up to 1.34 and got sent straight back down to 1.16, now trading under its EMA20 at 1.19. A green day that can't even reclaim short-term averages is weakness.
The desk's read is this strength gets sold. It's a liquidity grab, not a new leg up. That changes if buyers can hold over 1.19.
Selling this rip or buying the dip?
$ZRO
Inicia sesión para explorar más contenidos