
#tokenanalysis
tokenanalysis
337,114 vistas
139 están debatiendo
Hot
Lo último

Resumen del token | Análisis de la estructura de un token Meme multichain $FLORK
Fundamentos
Origen de la narrativa: Cómic de la red Flork of Cows (en publicación desde 2012)
Imagen central: Muñeco de calcetín / maniquí tipo “MS Paint”
Catalizador más reciente: Lanzamiento de Binance Alpha el 2 de septiembre y cotización sincronizada con PONS
Instantánea de datos (3 de septiembre)
┌──────────────────────────────────────┐
│ Versión BSC (relacionada con Binance Alpha) │
│ Contrato: 0xf40592DaACb3e5abf358789F5688C0B4f64d7777
│ Market cap: ~10M USD 24h: +116% │
│ Liquidez: 39.6K USD Ratio de liquidez/bloqueo: 0.4% │
│ Suministro: 1.000 millones de monedas │
├──────────────────────────────────────┤
│ Versión de Robinhood Chain (lanzada por Pons) │
│ Market cap: ~7.63M USD 24h: +293% │
│ Pico de market cap: ~17.5M USD (caída del 56%) │
└──────────────────────────────────────┘
Estructura de riesgos
① Confusión de múltiples versiones: en BSC/Solana/ETH/Robinhood hay contratos diferentes
② Liquidez extremadamente baja: market cap de 10M USD vs liquidez de 39.6K USD
③ Concentración de tenencias: los 3 principales wallets en la versión de Solana suman 37.6%
④ Sin utilidad real: solo meme, sin equipo, sin colaboraciones
⑤ Sin relación con el autor original: sin vínculo oficial con los creadores del cómic
Comparación con PONS
PONS: Robinhood Chain nativo, market cap de 380-440M USD, con mecanismo de recompra y quema
FLORK: caos multichain sin mecanismos y sin equipo
Conclusión: Mercado especulativo a corto plazo impulsado por el efecto Alpha
No apto como activo de tenencia; solo adecuado para operaciones de muy poco capital a corto plazo
Lo anterior no constituye asesoramiento de inversión
$FLORK #TokenAnalysis #BinanceAlpha
Fundamentos
Origen de la narrativa: Cómic de la red Flork of Cows (en publicación desde 2012)
Imagen central: Muñeco de calcetín / maniquí tipo “MS Paint”
Catalizador más reciente: Lanzamiento de Binance Alpha el 2 de septiembre y cotización sincronizada con PONS
Instantánea de datos (3 de septiembre)
┌──────────────────────────────────────┐
│ Versión BSC (relacionada con Binance Alpha) │
│ Contrato: 0xf40592DaACb3e5abf358789F5688C0B4f64d7777
│ Market cap: ~10M USD 24h: +116% │
│ Liquidez: 39.6K USD Ratio de liquidez/bloqueo: 0.4% │
│ Suministro: 1.000 millones de monedas │
├──────────────────────────────────────┤
│ Versión de Robinhood Chain (lanzada por Pons) │
│ Market cap: ~7.63M USD 24h: +293% │
│ Pico de market cap: ~17.5M USD (caída del 56%) │
└──────────────────────────────────────┘
Estructura de riesgos
① Confusión de múltiples versiones: en BSC/Solana/ETH/Robinhood hay contratos diferentes
② Liquidez extremadamente baja: market cap de 10M USD vs liquidez de 39.6K USD
③ Concentración de tenencias: los 3 principales wallets en la versión de Solana suman 37.6%
④ Sin utilidad real: solo meme, sin equipo, sin colaboraciones
⑤ Sin relación con el autor original: sin vínculo oficial con los creadores del cómic
Comparación con PONS
PONS: Robinhood Chain nativo, market cap de 380-440M USD, con mecanismo de recompra y quema
FLORK: caos multichain sin mecanismos y sin equipo
Conclusión: Mercado especulativo a corto plazo impulsado por el efecto Alpha
No apto como activo de tenencia; solo adecuado para operaciones de muy poco capital a corto plazo
Lo anterior no constituye asesoramiento de inversión
$FLORK #TokenAnalysis #BinanceAlpha

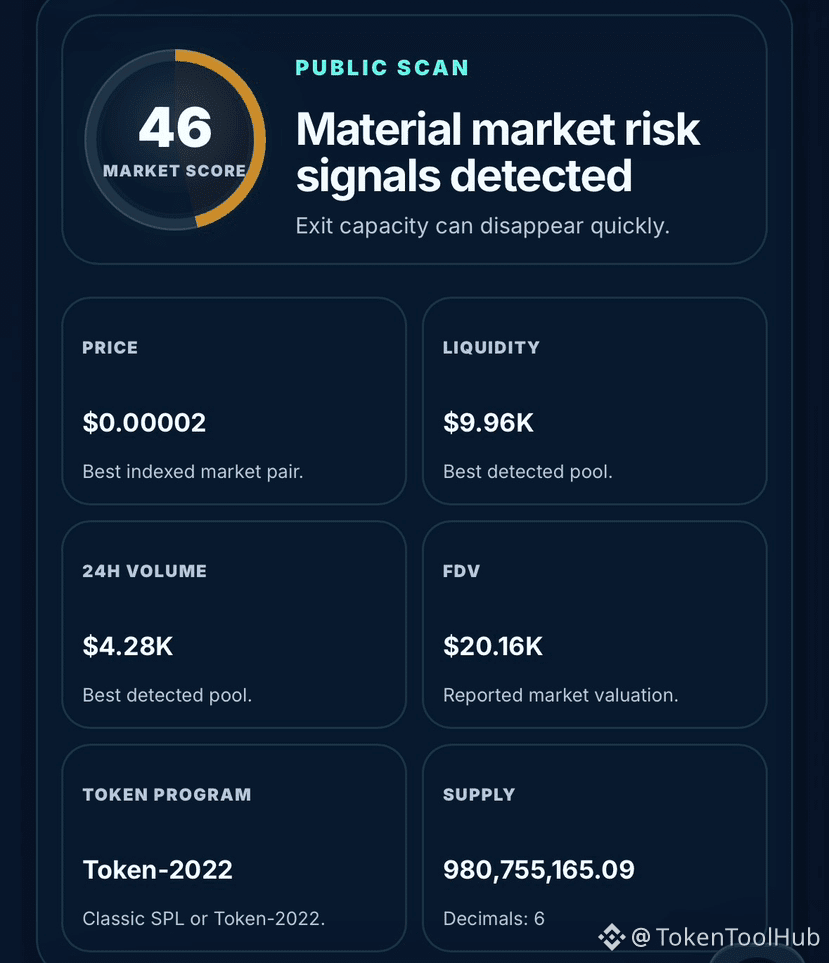
Sigmacoin (SIGMA) muestra una cobertura del 100% de liquidez bloqueada reportada.
Eso suena tranquilizador hasta que inspeccionas el resto de la estructura del mercado.
TokenToolHub analizó:
4xgUpyNrx1f9ggNETv52o7pHvz7HwKkPFZzpT3QSpump
Hallazgos clave:
• Postura ejecutiva: 50
• Autoridad de acuñación: Deshabilitada
• Autoridad de congelación: Deshabilitada
• Programa de tokens: Token-2022
• Propietario resuelto más grande: 32.17%
• Principales 10 propietarios: 90.97%
• Mejor liquidez detectada: $9,956
• Volumen 24h: $4.28K
• Puntuación de riesgo externo del token: 38/100
• Cobertura de liquidez bloqueada reportada: 100%
La principal preocupación aquí es la concentración combinada con una liquidez escasa.
El propietario resuelto más grande controla el 32.17% del suministro, mientras que las 10 cuentas principales representan el 90.97%.
Al mismo tiempo, el mejor pool de liquidez indexado contiene menos de $10K.
Eso significa que la capacidad práctica de salida podría ser frágil aunque el porcentaje reportado de liquidez bloqueada sea del 100%.
Un bloqueo de liquidez puede decirte si la liquidez reportada está bloqueada.
No te dice si hay suficiente liquidez para absorber una presión de venta significativa.
La configuración de la extensión Token-2022, las rutas ejecutables de compra/venta y la autoridad de metadatos también permanecieron sin resolverse.
Mira siempre más allá de una sola métrica tranquilizadora.
Inteligencia completa de SIGMA:
https://tokentoolhub.com/solana-token-scanner/?mint=4xgUpyNrx1f9ggNETv52o7pHvz7HwKkPFZzpT3QSpump
#solana #CryptoSecurity #Onchain #TokenAnalysis
Eso suena tranquilizador hasta que inspeccionas el resto de la estructura del mercado.
TokenToolHub analizó:
4xgUpyNrx1f9ggNETv52o7pHvz7HwKkPFZzpT3QSpump
Hallazgos clave:
• Postura ejecutiva: 50
• Autoridad de acuñación: Deshabilitada
• Autoridad de congelación: Deshabilitada
• Programa de tokens: Token-2022
• Propietario resuelto más grande: 32.17%
• Principales 10 propietarios: 90.97%
• Mejor liquidez detectada: $9,956
• Volumen 24h: $4.28K
• Puntuación de riesgo externo del token: 38/100
• Cobertura de liquidez bloqueada reportada: 100%
La principal preocupación aquí es la concentración combinada con una liquidez escasa.
El propietario resuelto más grande controla el 32.17% del suministro, mientras que las 10 cuentas principales representan el 90.97%.
Al mismo tiempo, el mejor pool de liquidez indexado contiene menos de $10K.
Eso significa que la capacidad práctica de salida podría ser frágil aunque el porcentaje reportado de liquidez bloqueada sea del 100%.
Un bloqueo de liquidez puede decirte si la liquidez reportada está bloqueada.
No te dice si hay suficiente liquidez para absorber una presión de venta significativa.
La configuración de la extensión Token-2022, las rutas ejecutables de compra/venta y la autoridad de metadatos también permanecieron sin resolverse.
Mira siempre más allá de una sola métrica tranquilizadora.
Inteligencia completa de SIGMA:
https://tokentoolhub.com/solana-token-scanner/?mint=4xgUpyNrx1f9ggNETv52o7pHvz7HwKkPFZzpT3QSpump
#solana #CryptoSecurity #Onchain #TokenAnalysis
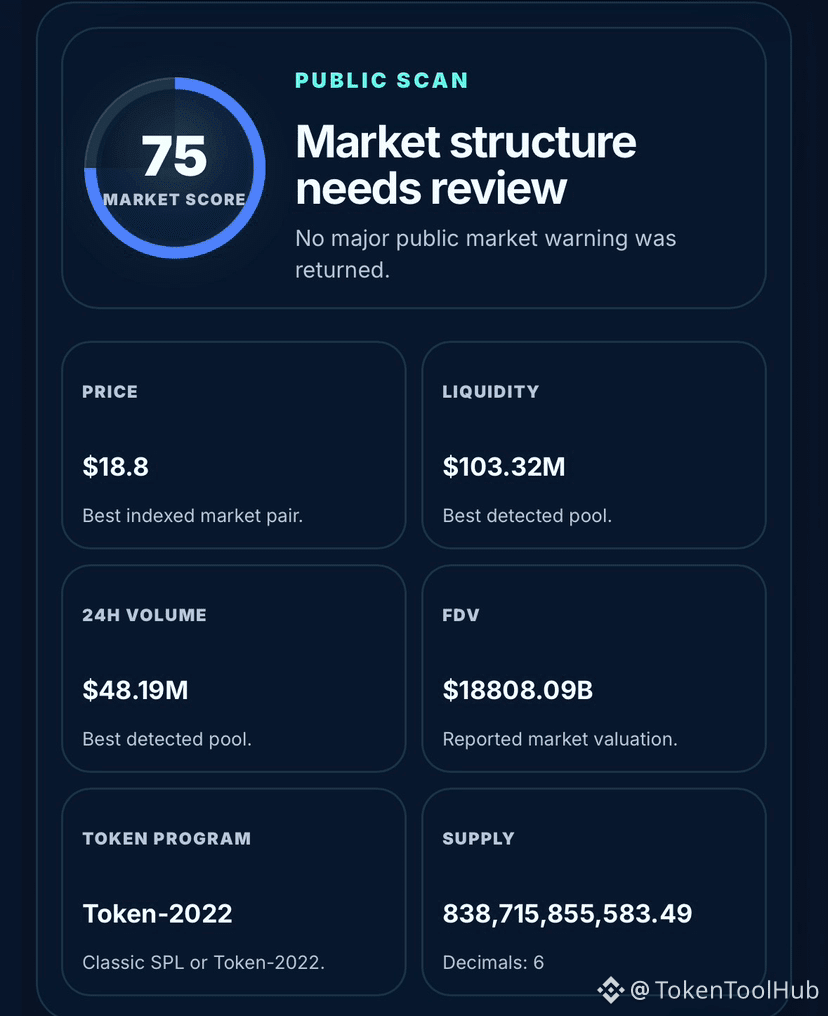
BOMBA: liquidez visible fuerte, pero la propiedad concentrada merece una mirada más de cerca.
Ejecuté BOMBA a través del TokenToolHub Solana Token Scanner.
El análisis encontró:
• $103.32M mejor liquidez detectada
• $48.19M volumen 24h
• 36.16% en manos del mayor propietario resuelto
• 69.32% en manos de los 10 principales propietarios
• Autoridad de acuñación deshabilitada
• Autoridad de congelación deshabilitada
• Programa Token-2022
• Puntuación de riesgo externo del token: 95/100
• Cobertura reportada del bloqueo de liquidez: 0.04%
Los controles de la autoridad son una señal positiva, pero la concentración de titulares sigue siendo el hallazgo principal.
Importante: una dirección grande debe clasificarse antes de asumir que se trata de una ballena individual. Podría representar liquidez, un exchange, tesorería, vesting o alguna otra cuenta controlada por un protocolo.
El análisis tampoco pudo confirmar de forma independiente rutas de compra/venta ejecutables ni la autoridad de actualización de metadatos.
Por eso, revisar solo la liquidez no es suficiente. La distribución, las superficies de control y las condiciones prácticas de salida son lo que importa.
Análisis completo de BOMBA:
https://tokentoolhub.com/solana-token-scanner/?mint=pumpCmXqMfrsAkQ5r49WcJnRayYRqmXz6ae8H7H9Dfn
#pump #solana #CryptoSecurity #TokenAnalysis #onchain
Ejecuté BOMBA a través del TokenToolHub Solana Token Scanner.
El análisis encontró:
• $103.32M mejor liquidez detectada
• $48.19M volumen 24h
• 36.16% en manos del mayor propietario resuelto
• 69.32% en manos de los 10 principales propietarios
• Autoridad de acuñación deshabilitada
• Autoridad de congelación deshabilitada
• Programa Token-2022
• Puntuación de riesgo externo del token: 95/100
• Cobertura reportada del bloqueo de liquidez: 0.04%
Los controles de la autoridad son una señal positiva, pero la concentración de titulares sigue siendo el hallazgo principal.
Importante: una dirección grande debe clasificarse antes de asumir que se trata de una ballena individual. Podría representar liquidez, un exchange, tesorería, vesting o alguna otra cuenta controlada por un protocolo.
El análisis tampoco pudo confirmar de forma independiente rutas de compra/venta ejecutables ni la autoridad de actualización de metadatos.
Por eso, revisar solo la liquidez no es suficiente. La distribución, las superficies de control y las condiciones prácticas de salida son lo que importa.
Análisis completo de BOMBA:
https://tokentoolhub.com/solana-token-scanner/?mint=pumpCmXqMfrsAkQ5r49WcJnRayYRqmXz6ae8H7H9Dfn
#pump #solana #CryptoSecurity #TokenAnalysis #onchain
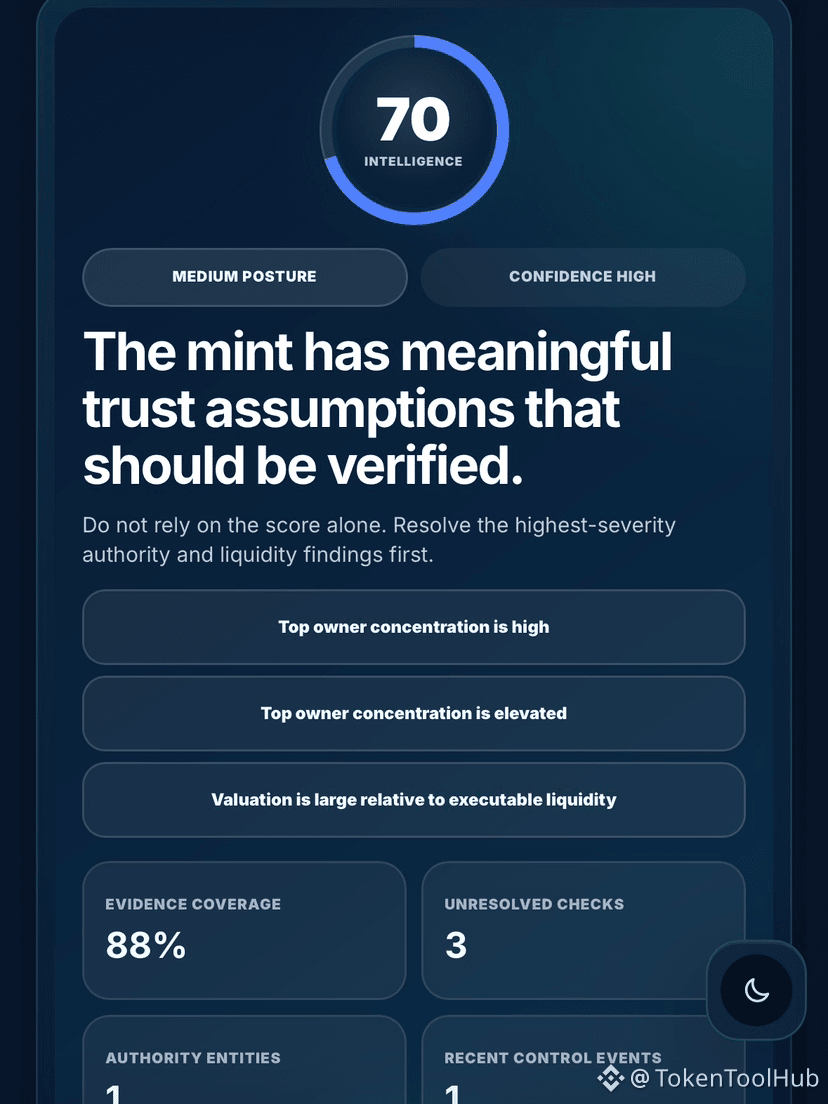
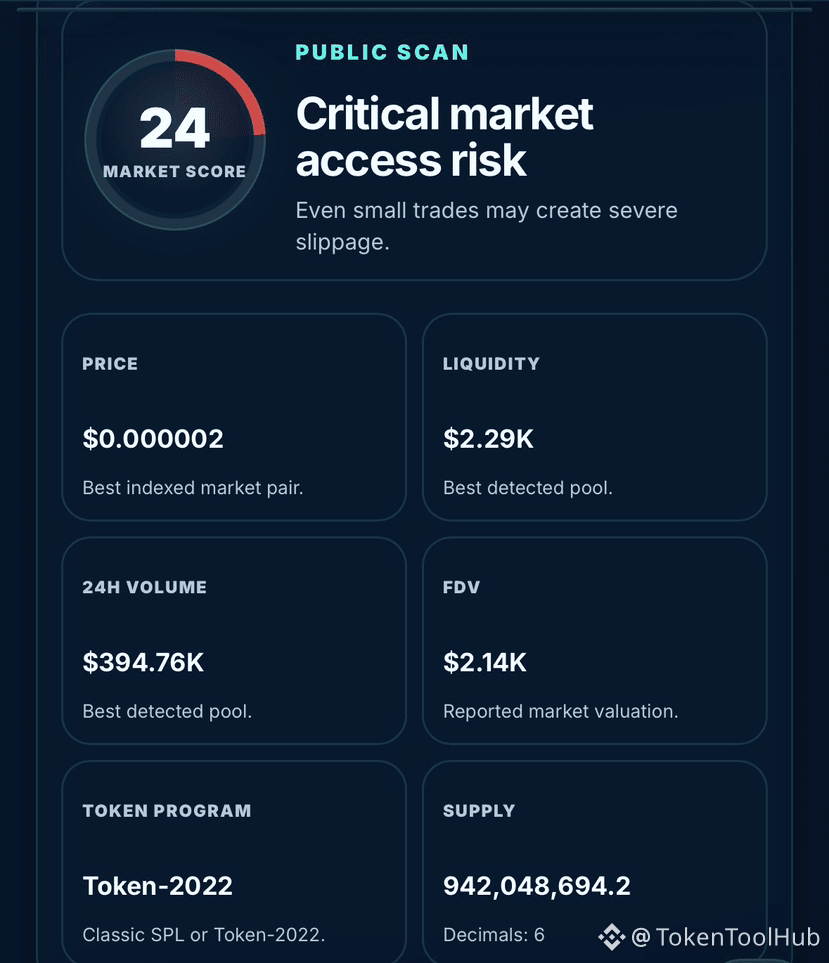
Autoridad de acuñación deshabilitada. Autoridad de congelación deshabilitada.
A primera vista parece tranquilizador.
Pero el resto de la evidencia en cadena cuenta una historia muy diferente para Load Of Hopium (Hopium).
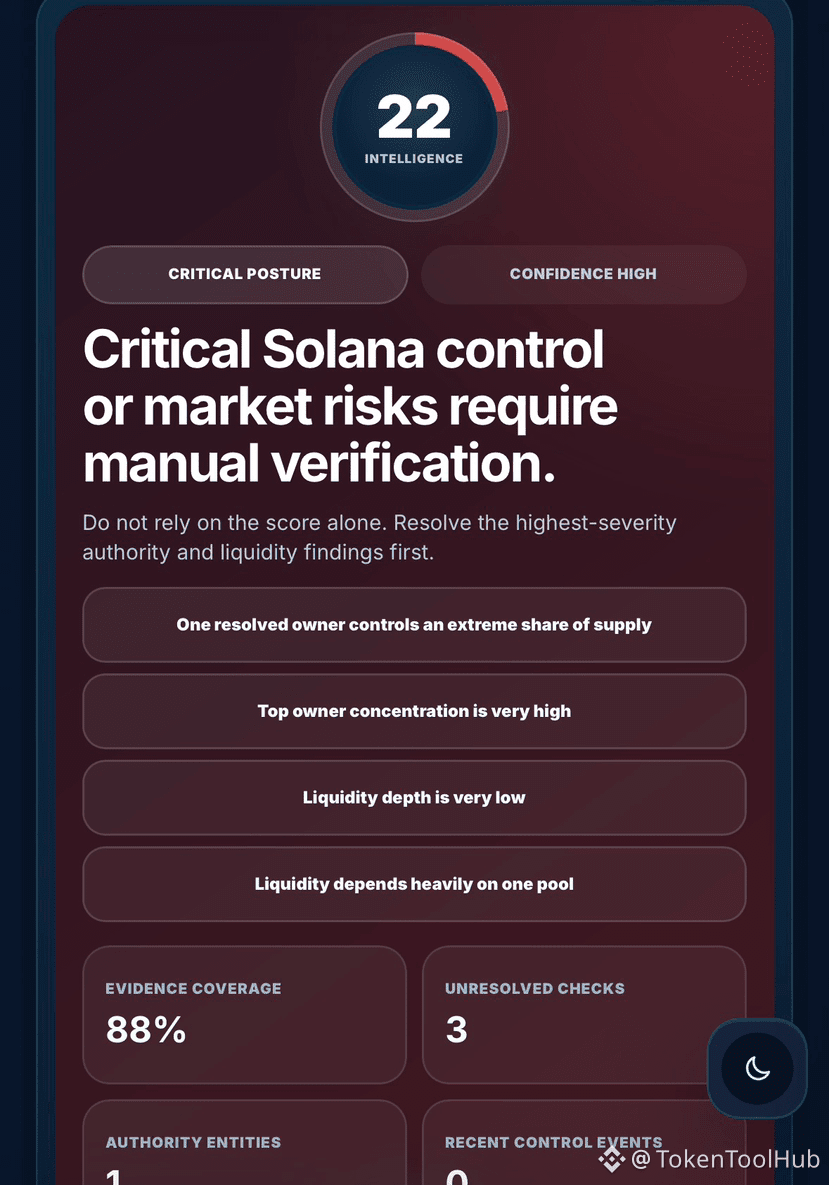
Pasé el token por el TokenToolHub Solana Token Scanner y el informe devolvió una postura ejecutiva de 22/100.
Lo que destacó:
• Mayor propietario resuelto: 88,57% del suministro
• Top 10 propietarios: 96,42%
• Mejor liquidez detectada: ~2,29K
• Volumen 24h: ~394,76K
• Liquidez bloqueada reportada: 0%
• Puntuación externa de riesgo del token: 32/100
Esa combinación merece una investigación.
El titular del 88,57% debe clasificarse antes de sacar conclusiones. Podría ser un pool de liquidez, tesorería, cuenta de vesting o una billetera controlada externamente.
Pero unos ~394K de volumen en 24 horas frente a solo ~2,29K en la mejor liquidez detectada es otra señal para examinar con detenimiento. El escaneo marcó la profundidad de liquidez como muy baja y el volumen como inusualmente alto en relación con la liquidez visible.
Por eso, comprobar si la autoridad de acuñación fue revocada no es suficiente.
Mira la distribución. Mira la liquidez. Mira la negociabilidad. Mira lo que queda sin resolver.
Escaneo completo de inteligencia Solana:
https://tokentoolhub.com/solana-token-scanner/?mint=7WqwJbBCE2JG6C2rPPDNbYN6775YhooDo4BYdDUypump
#solana #crypto #Web3 #TokenAnalysis #onchain
A primera vista parece tranquilizador.
Pero el resto de la evidencia en cadena cuenta una historia muy diferente para Load Of Hopium (Hopium).
Pasé el token por el TokenToolHub Solana Token Scanner y el informe devolvió una postura ejecutiva de 22/100.
Lo que destacó:
• Mayor propietario resuelto: 88,57% del suministro
• Top 10 propietarios: 96,42%
• Mejor liquidez detectada: ~2,29K
• Volumen 24h: ~394,76K
• Liquidez bloqueada reportada: 0%
• Puntuación externa de riesgo del token: 32/100
Esa combinación merece una investigación.
El titular del 88,57% debe clasificarse antes de sacar conclusiones. Podría ser un pool de liquidez, tesorería, cuenta de vesting o una billetera controlada externamente.
Pero unos ~394K de volumen en 24 horas frente a solo ~2,29K en la mejor liquidez detectada es otra señal para examinar con detenimiento. El escaneo marcó la profundidad de liquidez como muy baja y el volumen como inusualmente alto en relación con la liquidez visible.
Por eso, comprobar si la autoridad de acuñación fue revocada no es suficiente.
Mira la distribución. Mira la liquidez. Mira la negociabilidad. Mira lo que queda sin resolver.
Escaneo completo de inteligencia Solana:
https://tokentoolhub.com/solana-token-scanner/?mint=7WqwJbBCE2JG6C2rPPDNbYN6775YhooDo4BYdDUypump
#solana #crypto #Web3 #TokenAnalysis #onchain



29 de mayo
Solo quería compartir algunos pensamientos sobre una moneda que noté anoche. La distribución de tokens en esta, $ALLO , parece súper concentrada en comparación con otras en el espacio, lo cual siempre es interesante ver.
Acabamos de ver un aumento significativo en el volumen, llevándola a un nuevo máximo de $1.70. Al mirar su prolongada tendencia a la baja, realmente parece que los jugadores más grandes, las ballenas, han estado acumulando de manera constante durante ese período, llenando sus bolsas.
Ahora el juego se centra en monitorear esos niveles de toma de ganancias. Estoy manteniendo un ojo agudo tanto en el momentum alcista como en el bajista para ver cómo se desarrolla todo.
Terminé cerrando mi posición de $ALLO perp con un bonito +7,461.37USDT PNL. ¡Siempre es agradable cuando el análisis da sus frutos! $BTC $ETH
#CryptoTrading #OnChain #TokenAnalysis #WhaleWatching #Altcoins
Solo quería compartir algunos pensamientos sobre una moneda que noté anoche. La distribución de tokens en esta, $ALLO , parece súper concentrada en comparación con otras en el espacio, lo cual siempre es interesante ver.
Acabamos de ver un aumento significativo en el volumen, llevándola a un nuevo máximo de $1.70. Al mirar su prolongada tendencia a la baja, realmente parece que los jugadores más grandes, las ballenas, han estado acumulando de manera constante durante ese período, llenando sus bolsas.
Ahora el juego se centra en monitorear esos niveles de toma de ganancias. Estoy manteniendo un ojo agudo tanto en el momentum alcista como en el bajista para ver cómo se desarrolla todo.
Terminé cerrando mi posición de $ALLO perp con un bonito +7,461.37USDT PNL. ¡Siempre es agradable cuando el análisis da sus frutos! $BTC $ETH
#CryptoTrading #OnChain #TokenAnalysis #WhaleWatching #Altcoins

El hecho de que $NEAR esté manteniéndose cerca del extremo superior de su rango de consolidación actual es más significativo de lo que parece. Esta posición dentro del rango sugiere que los traders están mostrando un interés cada vez mayor en el token. Dadas las dinámicas actuales de negociación en 24 horas, el hecho de que $NEAR esté aguantando cerca de este nivel crítico implica cierto grado de fortaleza oculta. La idea clave aquí es que los traders deberían vigilar la capacidad de $NEAR para sostener este nivel, ya que una retención exitosa podría indicar el inicio de la construcción de impulso. ¿Qué estás observando ahora mismo en $NEAR ?
Lectura actual: $NEAR , cinta spot.
Toca $NEAR para abrir NEAR/USDT y configurar alertas.
#near
#cryptotrading
#tradingrange
#tokenanalysis
Lectura actual: $NEAR , cinta spot.
Toca $NEAR para abrir NEAR/USDT y configurar alertas.
#near
#cryptotrading
#tradingrange
#tokenanalysis

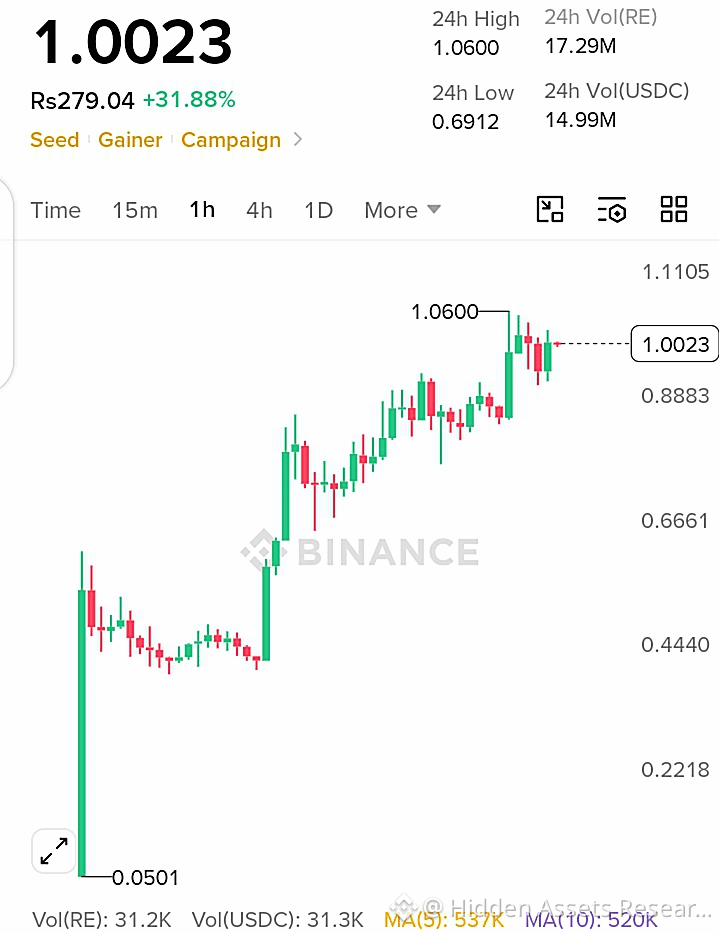
RE Acaba de Romper por Encima de $1 — ¿Qué Sigue?
RE ha cruzado oficialmente el nivel psicológico de $1, un hito importante para el activo. Después de alcanzar un máximo de 24h de $1.06, el token actualmente se mantiene por encima de $1, demostrando que los compradores siguen defendiendo esta zona clave.
📈 Rendimiento de 24h: +31.88%
💰 Precio Actual: $1.0023
📊 Volumen de 24h: 17.29M
🔥 Rango de 24h: $0.6912 → $1.0600
Un fuerte breakout es una cosa, pero mantenernos por encima de un nivel de resistencia mayor es lo que a menudo atrae más atención del mercado. El siguiente desafío para los toros es recuperar y romper por encima del reciente máximo de $1.06.
#TrendingTopic
#TokenAnalysis
RE ha cruzado oficialmente el nivel psicológico de $1, un hito importante para el activo. Después de alcanzar un máximo de 24h de $1.06, el token actualmente se mantiene por encima de $1, demostrando que los compradores siguen defendiendo esta zona clave.
📈 Rendimiento de 24h: +31.88%
💰 Precio Actual: $1.0023
📊 Volumen de 24h: 17.29M
🔥 Rango de 24h: $0.6912 → $1.0600
Un fuerte breakout es una cosa, pero mantenernos por encima de un nivel de resistencia mayor es lo que a menudo atrae más atención del mercado. El siguiente desafío para los toros es recuperar y romper por encima del reciente máximo de $1.06.
#TrendingTopic
#TokenAnalysis
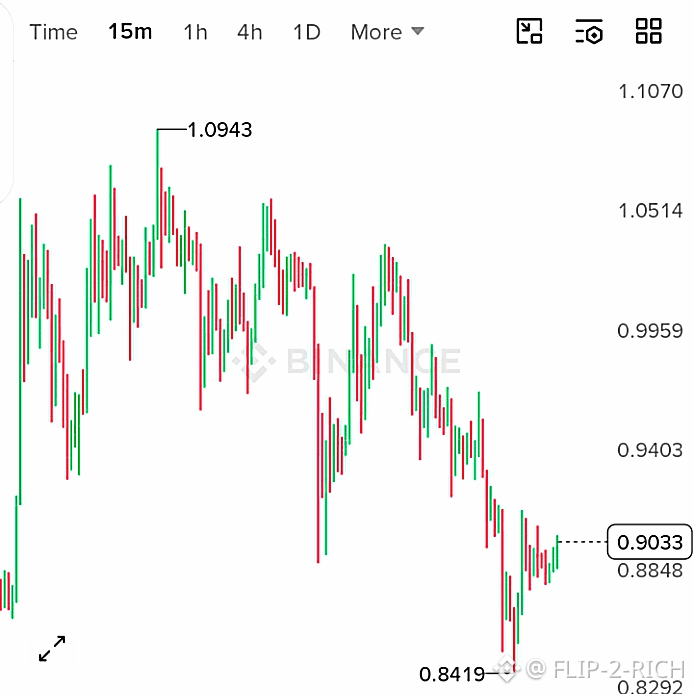
$RE cayó más del 20% desde su pico. Aquí está lo que las velas están señalando ahora.
Después de dispararse a $1.09, RE perdió impulso y cayó más de un 23% hasta un mínimo de $0.84. Los compradores ahora están defendiendo el fondo, empujando el precio de nuevo por encima de $0.90.
👀 Observa $0.94 de cerca — una ruptura podría señalar una reversión de tendencia, mientras que un rechazo podría llevar a otra prueba de soporte.
#MarketSentimentToday
#TokenAnalysis
Después de dispararse a $1.09, RE perdió impulso y cayó más de un 23% hasta un mínimo de $0.84. Los compradores ahora están defendiendo el fondo, empujando el precio de nuevo por encima de $0.90.
👀 Observa $0.94 de cerca — una ruptura podría señalar una reversión de tendencia, mientras que un rechazo podría llevar a otra prueba de soporte.
#MarketSentimentToday
#TokenAnalysis
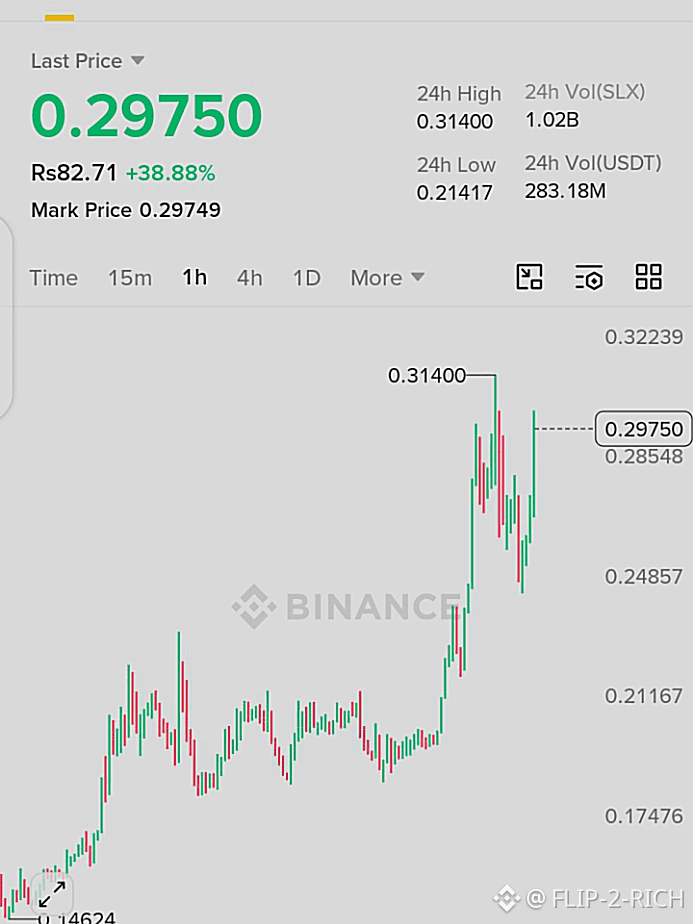
✅Una moneda. Una semana. 🔥¡Ganancias del 100%+⬆️ $SLX holders están celebrando mientras que los demás preguntan, ¿Qué sigue?
DE $0.15 A $0.3140 — ¡SLX EXPLOTA MÁS DEL 100%!
Los traders que detectaron SLX/USDT cerca de $0.15 han sido testigos de un rally impresionante hasta alrededor de $0.3140, entregando ganancias de más del 100% en muy poco tiempo. Los datos recientes del mercado muestran a SLX alcanzando la región de $0.30 con un volumen de trading fuerte y renovado interés de los inversores.
#TokenAnalysis
#MarketSentimentToday
DE $0.15 A $0.3140 — ¡SLX EXPLOTA MÁS DEL 100%!
Los traders que detectaron SLX/USDT cerca de $0.15 han sido testigos de un rally impresionante hasta alrededor de $0.3140, entregando ganancias de más del 100% en muy poco tiempo. Los datos recientes del mercado muestran a SLX alcanzando la región de $0.30 con un volumen de trading fuerte y renovado interés de los inversores.
#TokenAnalysis
#MarketSentimentToday

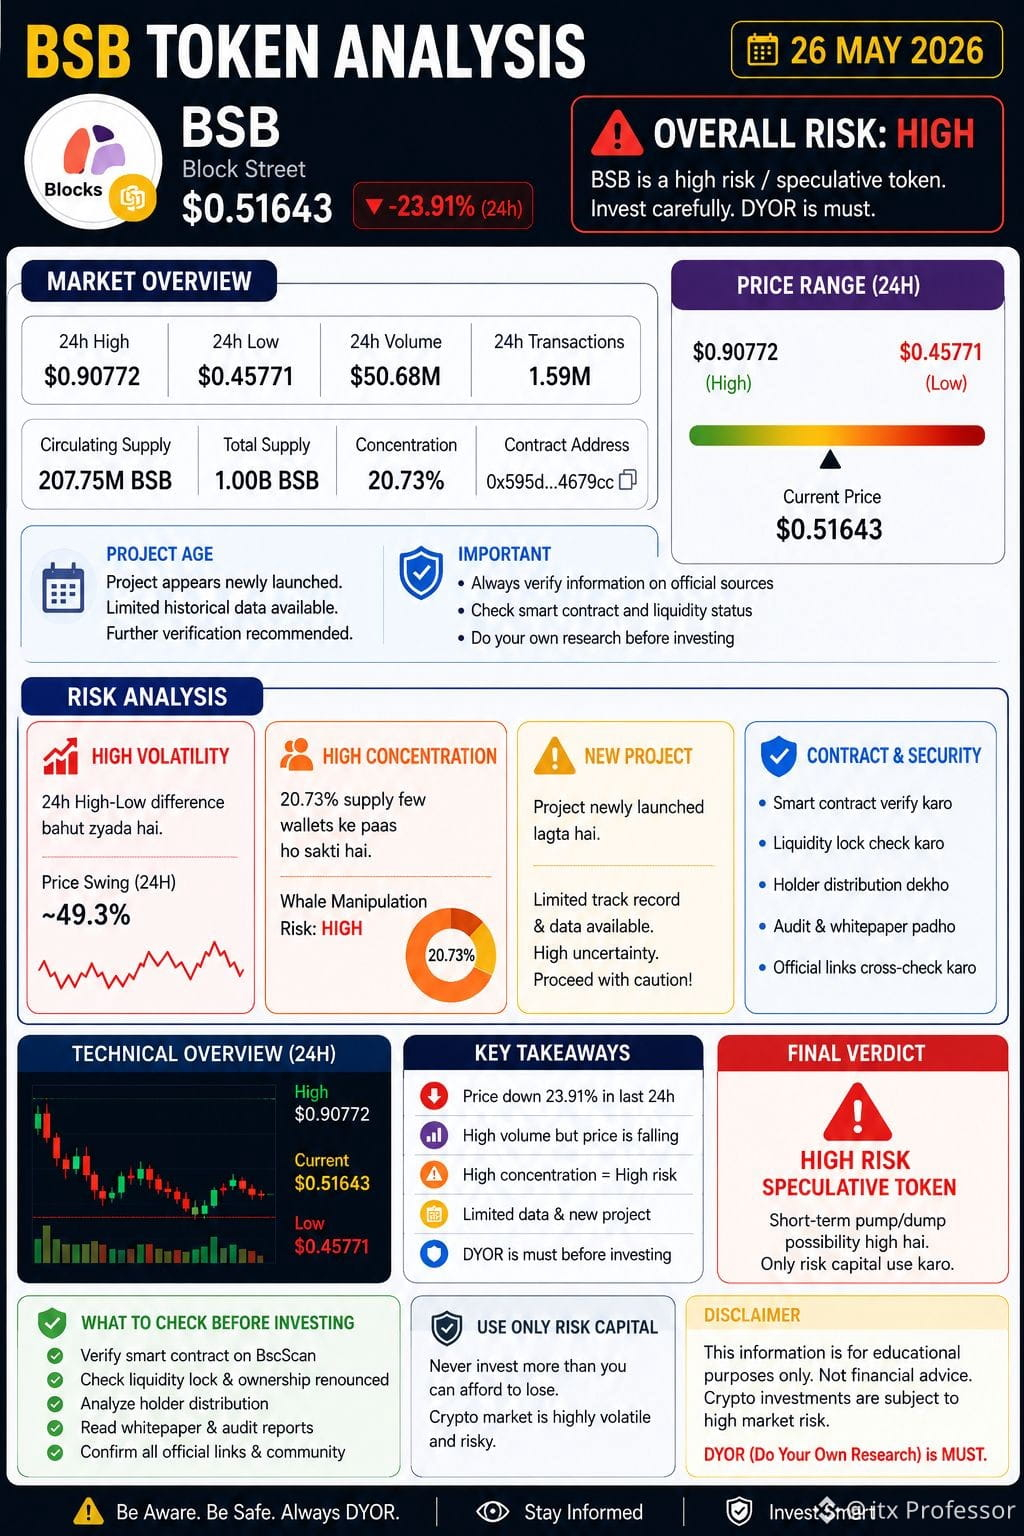
$BSB Análisis de Token 26 de Mayo de 2026
Mirada rápida a los datos de BSBs 24h:
- Alto volumen pero el precio está en tendencia bajista
- Alta concentración, 20.7% del suministro en pocas wallets
- Nuevo proyecto con datos históricos limitados
Riesgo general ALTO
Esto parece ser un token especulativo de alto riesgo. El riesgo de pump and dump a corto plazo está elevado.
Importante
Esto es solo con fines educativos. Siempre verifica antes de invertir:
- Revisa el contrato inteligente en BscScan
- Verifica el bloqueo de liquidez y el estado de propiedad
NFA No es Asesoramiento Financiero
Solo utiliza capital de riesgo que puedas permitirte perder
#BSB #Crypto #TokenAnalysis #DYOR*
Mirada rápida a los datos de BSBs 24h:
- Alto volumen pero el precio está en tendencia bajista
- Alta concentración, 20.7% del suministro en pocas wallets
- Nuevo proyecto con datos históricos limitados
Riesgo general ALTO
Esto parece ser un token especulativo de alto riesgo. El riesgo de pump and dump a corto plazo está elevado.
Importante
Esto es solo con fines educativos. Siempre verifica antes de invertir:
- Revisa el contrato inteligente en BscScan
- Verifica el bloqueo de liquidez y el estado de propiedad
NFA No es Asesoramiento Financiero
Solo utiliza capital de riesgo que puedas permitirte perder
#BSB #Crypto #TokenAnalysis #DYOR*
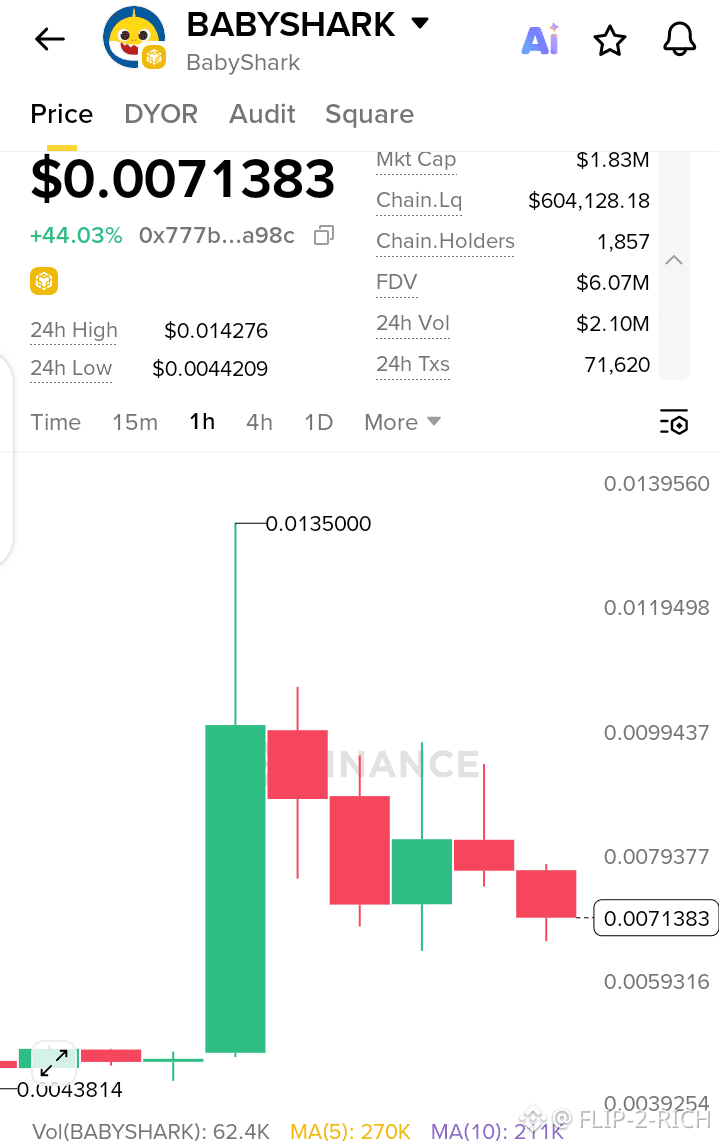
$BABYSHARK
Movimiento masivo en BabyShark ⬆️— la volatilidad explotó en minutos 🔥
BabyShark está mostrando una volatilidad explosiva en el mercado. El token actualmente cotiza cerca de $0.0071383, reflejando un fuerte aumento de +44% en el movimiento reciente. La acción del precio muestra un pico brusco hasta $0.0135 antes de enfriarse y entrar en consolidación, lo que señala actividad agresiva de trading a corto plazo. La capitalización de mercado se sitúa en $1.83M, mientras que el volumen de 24h alcanza $2.10M, lo que indica alto interés y flujo de liquidez. Este tipo de estructura a menudo atrae a traders de impulso, pero también incrementa el riesgo por reversiones rápidas. Mantente alerta, observa el comportamiento del volumen y gestiona siempre el riesgo con cuidado antes de tomar cualquier decisión de trading en condiciones tan cambiantes.
#TokenAnalysis
#babyshark
Movimiento masivo en BabyShark ⬆️— la volatilidad explotó en minutos 🔥
BabyShark está mostrando una volatilidad explosiva en el mercado. El token actualmente cotiza cerca de $0.0071383, reflejando un fuerte aumento de +44% en el movimiento reciente. La acción del precio muestra un pico brusco hasta $0.0135 antes de enfriarse y entrar en consolidación, lo que señala actividad agresiva de trading a corto plazo. La capitalización de mercado se sitúa en $1.83M, mientras que el volumen de 24h alcanza $2.10M, lo que indica alto interés y flujo de liquidez. Este tipo de estructura a menudo atrae a traders de impulso, pero también incrementa el riesgo por reversiones rápidas. Mantente alerta, observa el comportamiento del volumen y gestiona siempre el riesgo con cuidado antes de tomar cualquier decisión de trading en condiciones tan cambiantes.
#TokenAnalysis
#babyshark

He estado notando un aumento claro en la gente buscando $STO últimamente. Podría haber algunos nuevos catalizadores comenzando a atraer miradas hacia StakeStone.
Investigué la última auditoría X-Ray impulsada por $KRL y los números pintan una imagen interesante. La puntuación global se sitúa en 47.4 de 100, con los fundamentos manteniéndose en 71.1 y la seguridad en 69.8. Por otro lado, las métricas sociales y en cadena están quedándose atrás.
En este momento, $STO se está negociando alrededor de $0.055, bajando aproximadamente un 8.5 por ciento en las últimas 24 horas con un volumen de aproximadamente $5.5 millones. La capitalización de mercado es de $12.4 millones. Siempre vale la pena revisar el desglose completo por ti mismo.
Haz tu propia investigación (DYOR) como siempre.
$STO $KRL $ETH
#StakeStone #CryptoAudit #DeFi #AnálisisDeToken
Investigué la última auditoría X-Ray impulsada por $KRL y los números pintan una imagen interesante. La puntuación global se sitúa en 47.4 de 100, con los fundamentos manteniéndose en 71.1 y la seguridad en 69.8. Por otro lado, las métricas sociales y en cadena están quedándose atrás.
En este momento, $STO se está negociando alrededor de $0.055, bajando aproximadamente un 8.5 por ciento en las últimas 24 horas con un volumen de aproximadamente $5.5 millones. La capitalización de mercado es de $12.4 millones. Siempre vale la pena revisar el desglose completo por ti mismo.
Haz tu propia investigación (DYOR) como siempre.
$STO $KRL $ETH
#StakeStone #CryptoAudit #DeFi #AnálisisDeToken
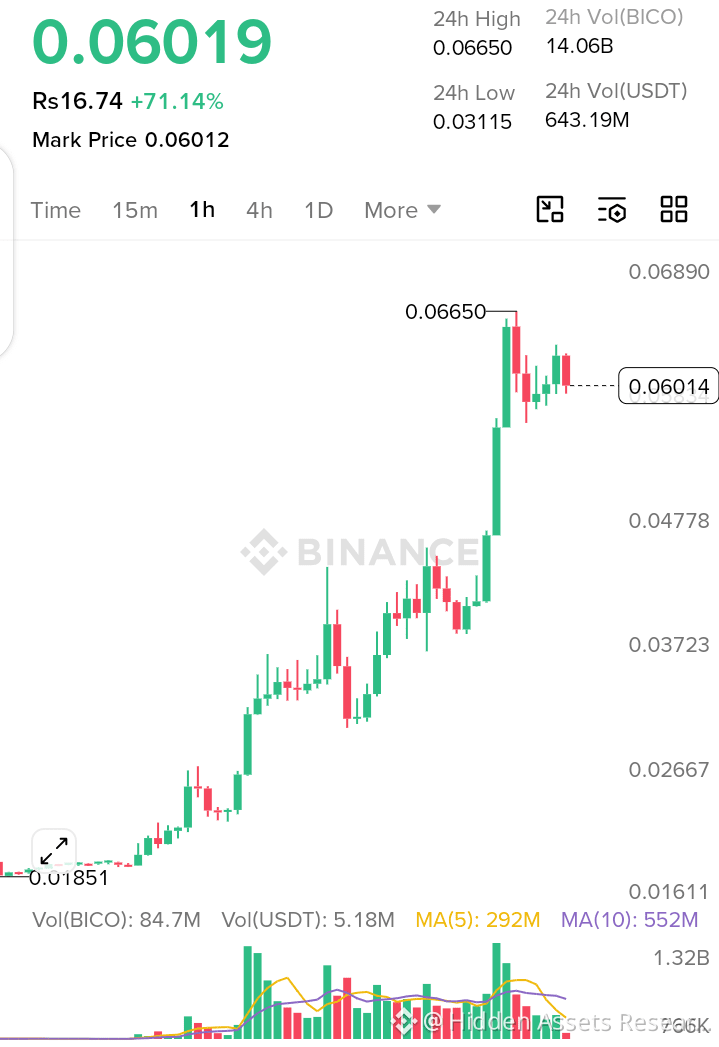
🚀 ¡Aumento del 71% — ¡Los toros están tomando el control! 😱
¡El mercado está en llamas! 🔥
$BICO ha subido más del 71%, alcanzando 0.06019 después de escalar desde mínimos cerca de 0.01851. Una fuerte presión de compra y un volumen en aumento sugieren que los traders están prestando mucha atención a este movimiento.
✅ Momentum alcista masivo
✅ Volumen fuerte apoyando la tendencia
✅ Medias móviles clave aún apuntando hacia arriba
Recuerda: los movimientos parabólicos pueden crear oportunidades, pero también aumentan la volatilidad.
Los traders inteligentes se enfocan en la gestión de riesgos, no en las emociones.
#TokenAnalysis
#ActualizaciónDelMercado
¡El mercado está en llamas! 🔥
$BICO ha subido más del 71%, alcanzando 0.06019 después de escalar desde mínimos cerca de 0.01851. Una fuerte presión de compra y un volumen en aumento sugieren que los traders están prestando mucha atención a este movimiento.
✅ Momentum alcista masivo
✅ Volumen fuerte apoyando la tendencia
✅ Medias móviles clave aún apuntando hacia arriba
Recuerda: los movimientos parabólicos pueden crear oportunidades, pero también aumentan la volatilidad.
Los traders inteligentes se enfocan en la gestión de riesgos, no en las emociones.
#TokenAnalysis
#ActualizaciónDelMercado
🔥 XCX Explota Más de 250% — ¿Es Esto Solo el Comienzo o el Tope? 😱
🚀 ¡El Protocolo Xeleb $XCX está causando revuelo en el mercado cripto!
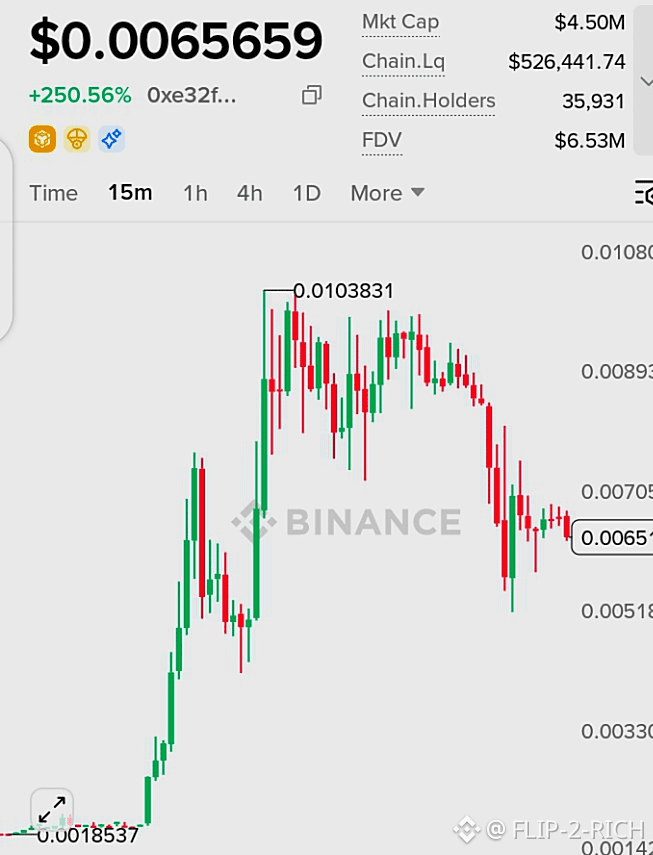
Después de un rally desde $0.0018537 hasta un pico de $0.0103831, XCX ha entregado una increíble ganancia del 250.56%, captando la atención de los traders en todo el mercado.
Actualmente cotizando alrededor de $0.0065659, el token ha retrocedido desde sus máximos pero sigue mostrando una actividad fuerte. Con una capitalización de mercado de $4.50M, más de 35,000 holders, y un volumen de trading elevado, la participación en el mercado sigue siendo intensa.
La gran pregunta ahora: ¿consolidación saludable antes de otro movimiento al alza, o el comienzo de una corrección más profunda?
❗Las oportunidades de alto rendimiento a menudo vienen con alto riesgo. Siempre haz tu propia investigación y gestiona el riesgo cuidadosamente.
#TokenAnalysis
#MarketSentimentToday
🚀 ¡El Protocolo Xeleb $XCX está causando revuelo en el mercado cripto!
Después de un rally desde $0.0018537 hasta un pico de $0.0103831, XCX ha entregado una increíble ganancia del 250.56%, captando la atención de los traders en todo el mercado.
Actualmente cotizando alrededor de $0.0065659, el token ha retrocedido desde sus máximos pero sigue mostrando una actividad fuerte. Con una capitalización de mercado de $4.50M, más de 35,000 holders, y un volumen de trading elevado, la participación en el mercado sigue siendo intensa.
La gran pregunta ahora: ¿consolidación saludable antes de otro movimiento al alza, o el comienzo de una corrección más profunda?
❗Las oportunidades de alto rendimiento a menudo vienen con alto riesgo. Siempre haz tu propia investigación y gestiona el riesgo cuidadosamente.
#TokenAnalysis
#MarketSentimentToday

🚨 $BTC TE MOSTRARON LAS ESTADÍSTICAS REALES — EL 71,9% DE LOS TOP 100 TOKENS ANTERIORES ESTÁN MUERTOS 💀
📊 CryptoRank revisó 1.539 tokens que alguna vez estuvieron en el Top 100 por capitalización de mercado. Casi el 72% ahora se clasifican como "muertos operativamente": deslistados de las principales bolsas con un volumen diario por debajo de $10K durante más de 90 días seguidos. 📉
⏱️ ¿La vida media de un token? Solo 2 años y 4 meses. En 5 años, el 62% pierde el pulso. Llévalo a una década y la tasa de mortalidad llega al 84,7%. Este es el brutal ritmo de recambio detrás de los relatos brillantes. 💡
El sesgo de supervivencia hace que tu cerebro piense que cada moneda está a un tuit de distancia de llegar a la órbita. Los datos dicen otra cosa. La cima es una puerta giratoria: solo una fracción mínima mantiene su posición. 🔍
💬 La pregunta real no es "¿qué está bombeando hoy?" — es: ¿qué tokens siguen vivos cuando se seca el volumen? ¿Qué filtros usas para separar la fortaleza duradera del hype temporal? 👇
⚠️ No es asesoramiento financiero. Gestiona siempre tu riesgo. 🛡️
🏷️ #Crypto #Bitcoin #TokenAnalysis #MarketCycle #DYOR
🔥 📊
📊 CryptoRank revisó 1.539 tokens que alguna vez estuvieron en el Top 100 por capitalización de mercado. Casi el 72% ahora se clasifican como "muertos operativamente": deslistados de las principales bolsas con un volumen diario por debajo de $10K durante más de 90 días seguidos. 📉
⏱️ ¿La vida media de un token? Solo 2 años y 4 meses. En 5 años, el 62% pierde el pulso. Llévalo a una década y la tasa de mortalidad llega al 84,7%. Este es el brutal ritmo de recambio detrás de los relatos brillantes. 💡
El sesgo de supervivencia hace que tu cerebro piense que cada moneda está a un tuit de distancia de llegar a la órbita. Los datos dicen otra cosa. La cima es una puerta giratoria: solo una fracción mínima mantiene su posición. 🔍
💬 La pregunta real no es "¿qué está bombeando hoy?" — es: ¿qué tokens siguen vivos cuando se seca el volumen? ¿Qué filtros usas para separar la fortaleza duradera del hype temporal? 👇
⚠️ No es asesoramiento financiero. Gestiona siempre tu riesgo. 🛡️
🏷️ #Crypto #Bitcoin #TokenAnalysis #MarketCycle #DYOR
🔥 📊
📉 Caída del 30% en el Interés Abierto — ¿Advertencia u Oportunidad? ✅
$2.8 Mil millones Eliminados — ¿Qué Pasará Después?
$ESPORTS
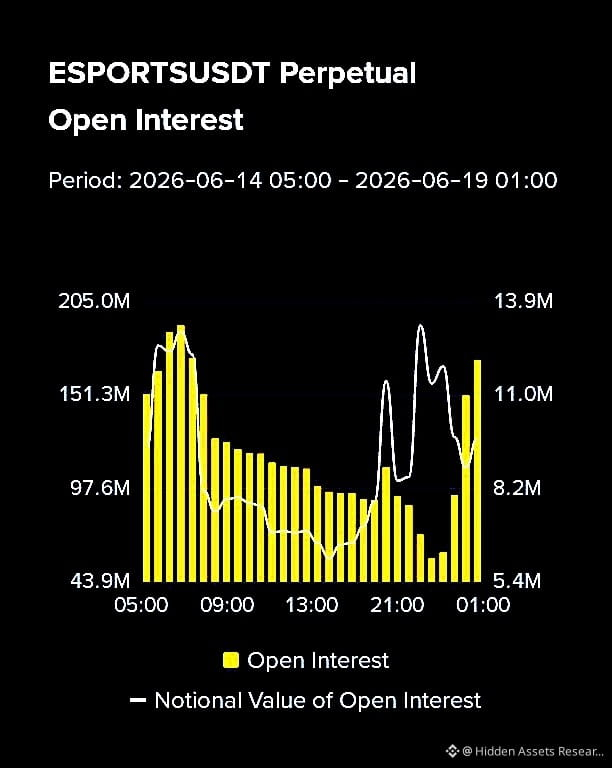
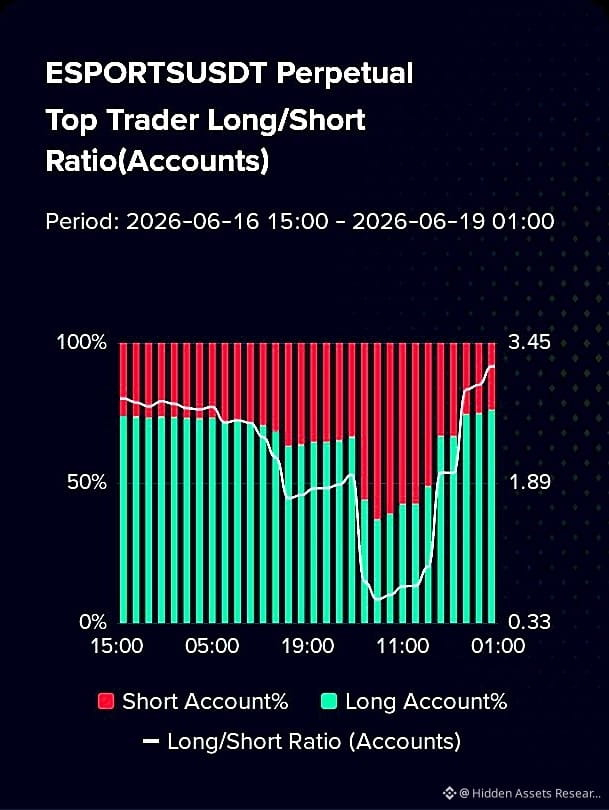
El mercado cripto acaba de presenciar una caída masiva del 30% en el Interés Abierto, señalando que miles de millones de dólares en posiciones apalancadas han sido eliminados. Al mismo tiempo, el Ratio de Traders Top Long/Short está cambiando, mostrando que el dinero inteligente está ajustando su postura en el mercado.
📉 La caída en el Interés Abierto a menudo significa que los traders están cerrando posiciones o siendo liquidadas.
📊 Un Ratio Long/Short cambiante puede insinuar un posible cambio de tendencia o una creciente incertidumbre.
⚠️ La reducción del apalancamiento no siempre significa que el dump ha terminado—frecuentemente significa que la volatilidad apenas está comenzando.
Observa de cerca el OI, las tasas de financiamiento, y la posición de los traders antes de entrar en tu próximo trade.
#TokenAnalysis
#Maket_update
$2.8 Mil millones Eliminados — ¿Qué Pasará Después?
$ESPORTS
El mercado cripto acaba de presenciar una caída masiva del 30% en el Interés Abierto, señalando que miles de millones de dólares en posiciones apalancadas han sido eliminados. Al mismo tiempo, el Ratio de Traders Top Long/Short está cambiando, mostrando que el dinero inteligente está ajustando su postura en el mercado.
📉 La caída en el Interés Abierto a menudo significa que los traders están cerrando posiciones o siendo liquidadas.
📊 Un Ratio Long/Short cambiante puede insinuar un posible cambio de tendencia o una creciente incertidumbre.
⚠️ La reducción del apalancamiento no siempre significa que el dump ha terminado—frecuentemente significa que la volatilidad apenas está comenzando.
Observa de cerca el OI, las tasas de financiamiento, y la posición de los traders antes de entrar en tu próximo trade.
#TokenAnalysis
#Maket_update
🚨 ¡EXPLOSIÓN DEL 125% EN HORAS! 🚨
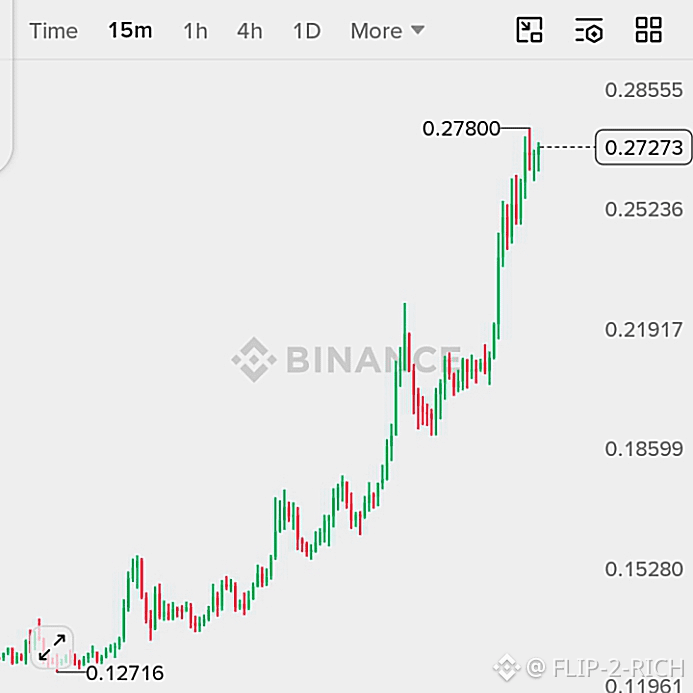
$SYN acaba de entregar un movimiento impresionante, disparándose de $0.12 a $0.27 y registrando una ganancia masiva del 125%. 🔥
El volumen de negociación ha aumentado a medida que los compradores entran, enviando el token a un poderoso rally parabólico.
📈 Movimiento del +125%
🔥 Momentum Explosivo
⚡ Aumento Masivo en el Volumen
La gran pregunta ahora: ¿Es esto solo el principio, o los tomadores de ganancias están a punto de entrar?
#Market_Update
#TokenAnalysis
$SYN acaba de entregar un movimiento impresionante, disparándose de $0.12 a $0.27 y registrando una ganancia masiva del 125%. 🔥
El volumen de negociación ha aumentado a medida que los compradores entran, enviando el token a un poderoso rally parabólico.
📈 Movimiento del +125%
🔥 Momentum Explosivo
⚡ Aumento Masivo en el Volumen
La gran pregunta ahora: ¿Es esto solo el principio, o los tomadores de ganancias están a punto de entrar?
#Market_Update
#TokenAnalysis
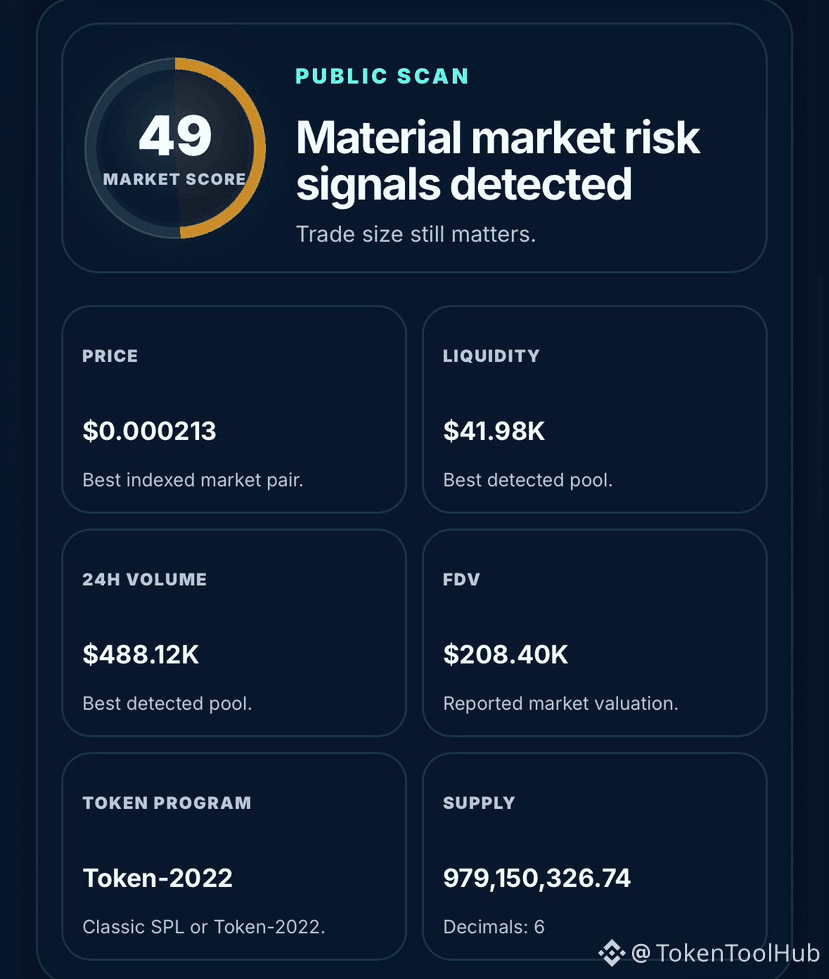
Kuro (KURO) obtuvo una postura ejecutiva de 84/100 en el último escaneo de Solana de TokenToolHub.
Mint:
5CwpF2UsgWvNKeDQaKZPjQCd6jM4K32yNVRVCuh1pump
Hallazgos clave:
• Programa de tokens: Token-2022
• Autoridad de mint: Deshabilitada
• Autoridad de freeze: Deshabilitada
• Mayor propietario resuelto: 10.5%
• Top 10 propietarios resueltos: 33.96%
• Mejor liquidez detectada: aproximadamente $41.67K
• Volumen 24h: aproximadamente $487.80K
• Suministro actual: aproximadamente 979.15M KURO
• Puntuación de riesgo externo del token: 1/100
• Cobertura de bloqueo de liquidez reportada: 97.25%
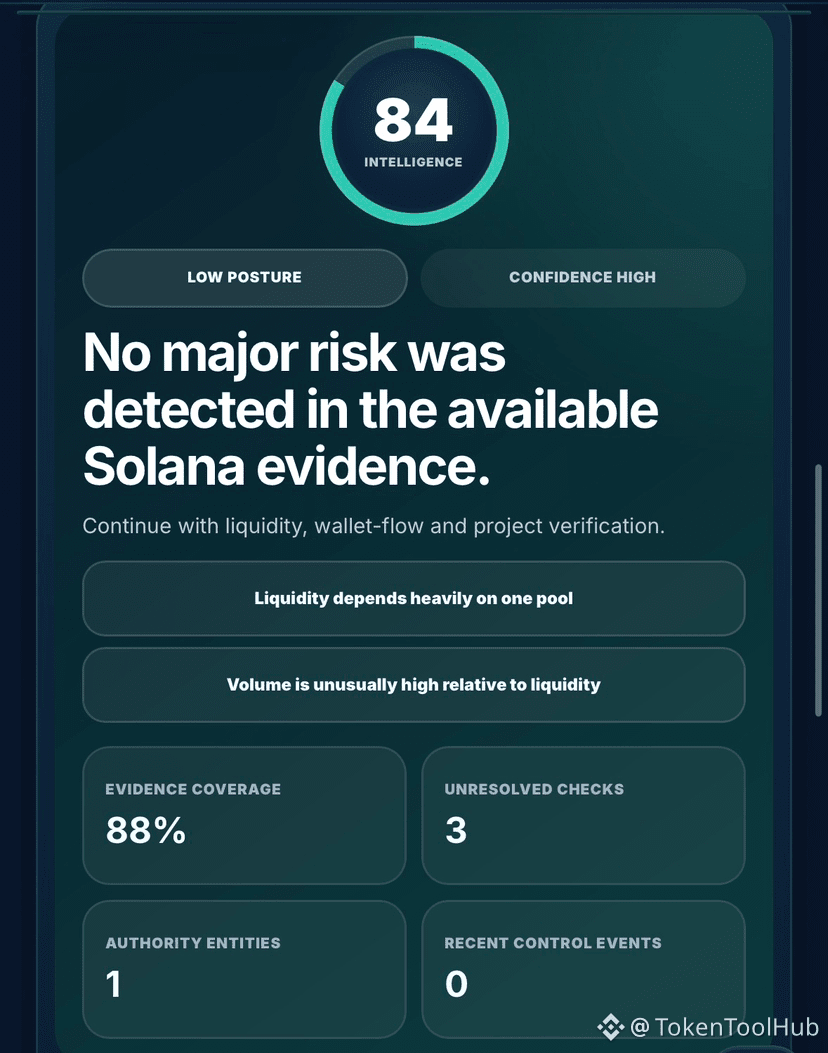
No se detectó un riesgo importante en la evidencia disponible de Solana.
Sin embargo, el informe identificó dos señales de estructura de mercado de prioridad Media.
Primero, la liquidez depende en gran medida de un único pool dominante.
Si ese pool pierde liquidez sustancial, el acceso práctico al mercado podría deteriorarse rápidamente.
Segundo, el volumen de trading es inusualmente alto en relación con la liquidez visible.
Se reportaron aproximadamente $487.8K en volumen de 24 horas frente a solo alrededor de $41.7K en el mejor pool de liquidez indexado.
Eso no prueba manipulación.
Pero puede indicar un entorno de trading altamente volátil, con mucho recambio (churn) o, de algún otro modo, inusual, por lo que los flujos de billetera y la distribución de operaciones deberían revisarse antes de tratar el volumen destacado como una medida limpia de la demanda.
La superficie de autoridad es comparativamente sólida.
La autoridad de mint está deshabilitada.
La autoridad de freeze está deshabilitada.
La concentración de holders tampoco se clasificó como fuertemente concentrada dentro de la muestra resuelta.
Aún hay áreas no resueltas.
KURO usa Token-2022, pero no se dispuso de la configuración de extensiones analizada.
No se devolvió la prueba de rutas de compra y venta ejecutables, mientras que no se pudo confirmar la autoridad de actualización de metadatos.
Una puntuación sólida es útil.
La calidad de la liquidez y la estructura del trading aún necesitan verificación independiente.
Escaneo completo de KURO:
https://tokentoolhub.com/solana-token-scanner/?mint=5CwpF2UsgWvNKeDQaKZPjQCd6jM4K32yNVRVCuh1pump
#solana #KURO #Onchain #TokenAnalysis #CryptoSecurity
Mint:
5CwpF2UsgWvNKeDQaKZPjQCd6jM4K32yNVRVCuh1pump
Hallazgos clave:
• Programa de tokens: Token-2022
• Autoridad de mint: Deshabilitada
• Autoridad de freeze: Deshabilitada
• Mayor propietario resuelto: 10.5%
• Top 10 propietarios resueltos: 33.96%
• Mejor liquidez detectada: aproximadamente $41.67K
• Volumen 24h: aproximadamente $487.80K
• Suministro actual: aproximadamente 979.15M KURO
• Puntuación de riesgo externo del token: 1/100
• Cobertura de bloqueo de liquidez reportada: 97.25%
No se detectó un riesgo importante en la evidencia disponible de Solana.
Sin embargo, el informe identificó dos señales de estructura de mercado de prioridad Media.
Primero, la liquidez depende en gran medida de un único pool dominante.
Si ese pool pierde liquidez sustancial, el acceso práctico al mercado podría deteriorarse rápidamente.
Segundo, el volumen de trading es inusualmente alto en relación con la liquidez visible.
Se reportaron aproximadamente $487.8K en volumen de 24 horas frente a solo alrededor de $41.7K en el mejor pool de liquidez indexado.
Eso no prueba manipulación.
Pero puede indicar un entorno de trading altamente volátil, con mucho recambio (churn) o, de algún otro modo, inusual, por lo que los flujos de billetera y la distribución de operaciones deberían revisarse antes de tratar el volumen destacado como una medida limpia de la demanda.
La superficie de autoridad es comparativamente sólida.
La autoridad de mint está deshabilitada.
La autoridad de freeze está deshabilitada.
La concentración de holders tampoco se clasificó como fuertemente concentrada dentro de la muestra resuelta.
Aún hay áreas no resueltas.
KURO usa Token-2022, pero no se dispuso de la configuración de extensiones analizada.
No se devolvió la prueba de rutas de compra y venta ejecutables, mientras que no se pudo confirmar la autoridad de actualización de metadatos.
Una puntuación sólida es útil.
La calidad de la liquidez y la estructura del trading aún necesitan verificación independiente.
Escaneo completo de KURO:
https://tokentoolhub.com/solana-token-scanner/?mint=5CwpF2UsgWvNKeDQaKZPjQCd6jM4K32yNVRVCuh1pump
#solana #KURO #Onchain #TokenAnalysis #CryptoSecurity
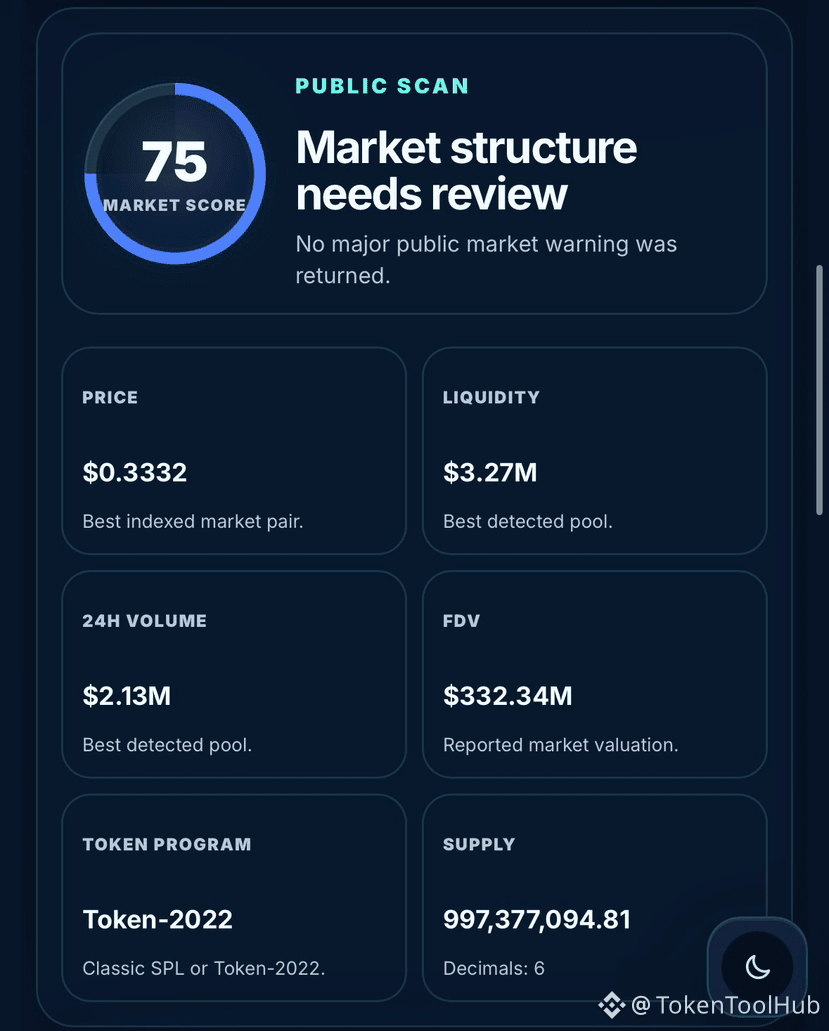
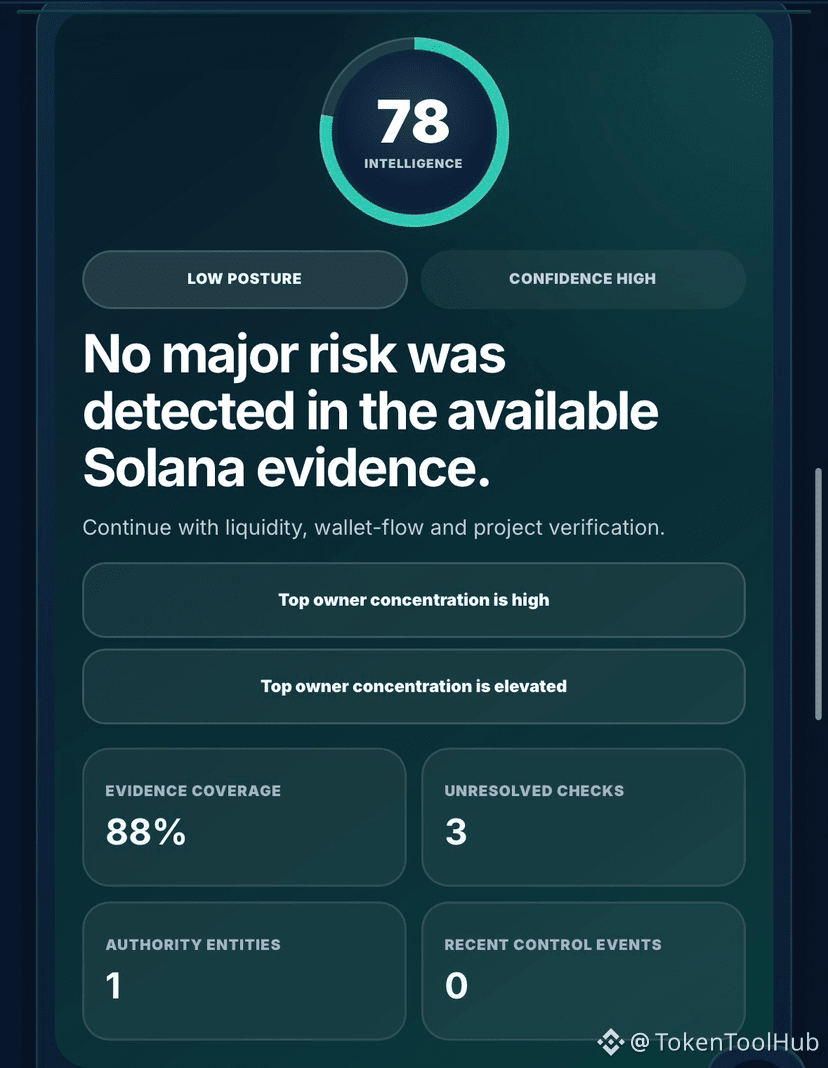
El Black Bull (ANSEM) devolvió una postura ejecutiva de 78/100 en el último análisis de Solana de TokenToolHub.
Mint:
9cRCn9rGT8V2imeM2BaKs13yhMEais3ruM3rPvTGpump
Hallazgos clave:
• Autoridad de mint: Deshabilitada
• Autoridad de freeze: Deshabilitada
• Programa de tokens: Token-2022
• Mayor propietario resuelto: 49.23%
• Principales 10 propietarios resueltos: 65.4%
• Mejor liquidez detectada: aproximadamente $3.27M
• Volumen 24 horas: aproximadamente $2.13M
• Suministro actual: aproximadamente 997.38M ANSEM
• Puntuación externa de riesgo de token: 43/100
• Cobertura de bloqueo de liquidez reportada: 46.5%
La señal de riesgo más fuerte es la concentración de titulares.
El mayor propietario resuelto controla aproximadamente el 49.23% del suministro, mientras que los 10 principales representan el 65.4%.
Esa concentración importa porque un gran titular podría potencialmente generar una presión de venta sustancial.
Pero la clasificación viene primero.
Una dirección grande puede representar una billetera individual, un pool de liquidez, una tesorería, un contrato de vesting, custodia de un exchange u otra cuenta operativa.
Por lo tanto, la cifra del 49.23% no debe interpretarse automáticamente como una sola ballena.
La superficie de autoridad es, en comparación, más limpia.
La autoridad de mint está deshabilitada.
La autoridad de freeze está deshabilitada.
No se detectó extensión de comisión de transferencia.
Sin embargo, ANSEM usa Token-2022 y la configuración de extensión parseada no fue devuelta, así que el comportamiento de control de transferencias permanece parcialmente sin resolver en lugar de confirmarse como ausente.
Las pruebas de rutas de compra y venta ejecutables tampoco estuvieron disponibles, y no se pudo confirmar la autoridad de actualización de metadatos.
Conclusión útil:
Una buena puntuación del token no hace irrelevante la distribución.
La autoridad, la liquidez y la concentración de titulares deben evaluarse juntas.
Análisis completo de ANSEM:
https://tokentoolhub.com/solana-token-scanner/?mint=9cRCn9rGT8V2imeM2BaKs13yhMEais3ruM3rPvTGpump
#solana #Ansem #Onchain #TokenAnalysis #CryptoSecurity
Mint:
9cRCn9rGT8V2imeM2BaKs13yhMEais3ruM3rPvTGpump
Hallazgos clave:
• Autoridad de mint: Deshabilitada
• Autoridad de freeze: Deshabilitada
• Programa de tokens: Token-2022
• Mayor propietario resuelto: 49.23%
• Principales 10 propietarios resueltos: 65.4%
• Mejor liquidez detectada: aproximadamente $3.27M
• Volumen 24 horas: aproximadamente $2.13M
• Suministro actual: aproximadamente 997.38M ANSEM
• Puntuación externa de riesgo de token: 43/100
• Cobertura de bloqueo de liquidez reportada: 46.5%
La señal de riesgo más fuerte es la concentración de titulares.
El mayor propietario resuelto controla aproximadamente el 49.23% del suministro, mientras que los 10 principales representan el 65.4%.
Esa concentración importa porque un gran titular podría potencialmente generar una presión de venta sustancial.
Pero la clasificación viene primero.
Una dirección grande puede representar una billetera individual, un pool de liquidez, una tesorería, un contrato de vesting, custodia de un exchange u otra cuenta operativa.
Por lo tanto, la cifra del 49.23% no debe interpretarse automáticamente como una sola ballena.
La superficie de autoridad es, en comparación, más limpia.
La autoridad de mint está deshabilitada.
La autoridad de freeze está deshabilitada.
No se detectó extensión de comisión de transferencia.
Sin embargo, ANSEM usa Token-2022 y la configuración de extensión parseada no fue devuelta, así que el comportamiento de control de transferencias permanece parcialmente sin resolver en lugar de confirmarse como ausente.
Las pruebas de rutas de compra y venta ejecutables tampoco estuvieron disponibles, y no se pudo confirmar la autoridad de actualización de metadatos.
Conclusión útil:
Una buena puntuación del token no hace irrelevante la distribución.
La autoridad, la liquidez y la concentración de titulares deben evaluarse juntas.
Análisis completo de ANSEM:
https://tokentoolhub.com/solana-token-scanner/?mint=9cRCn9rGT8V2imeM2BaKs13yhMEais3ruM3rPvTGpump
#solana #Ansem #Onchain #TokenAnalysis #CryptoSecurity
Inicia sesión para explorar más contenidos