
#metals
metals
110,236 vistas
411 están debatiendo
Hot
Lo último

·
--
Alcista
Semana de metales 31 de ago–6 de sep: el oro sigue a la Fed mientras el cobre prolonga su racha ganadora
🥇 El oro cerró la semana alrededor de $4,420–4,430/oz tras una secuencia volátil impulsada en gran medida por las expectativas sobre las tasas en EE. UU. Los precios cayeron al inicio de la semana pese al aumento de las tensiones entre Irán y Hormuz, repuntaron más de 2% después de que Christopher Waller adoptara un tono más suave, y luego volvieron a estar bajo presión tras una cifra de nóminas no agrícolas (NFP) de +162,000. El movimiento sugiere que el oro cotizó más como un proxy de las expectativas sobre la Fed que como un refugio geopolítico sostenido.
🥈 La plata se movió con un beta más alto, pero terminó alrededor de $66/oz, prácticamente sin cambios o ligeramente al alza en la semana. El platino también registró pocos cambios cerca de $1,810–1,830/oz. En conjunto, los metales preciosos siguieron siendo muy sensibles a los rendimientos reales y al dólar, mientras que el riesgo geopolítico solo brindó apoyo intermitente.
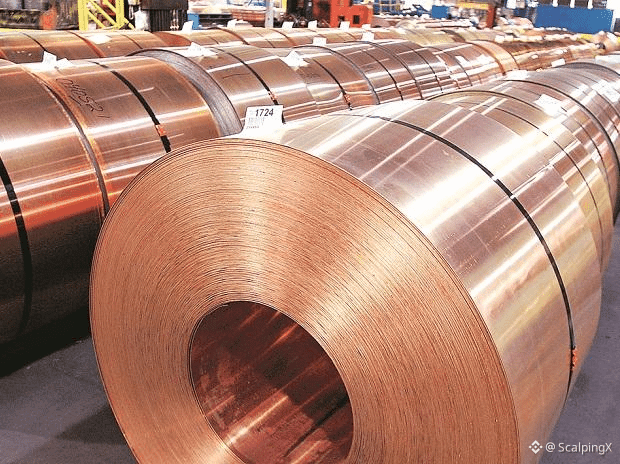
🟠 El cobre se movió en la dirección opuesta. El cobre de la LME prolongó su avance hasta una décima semana consecutiva, cotizando cerca de $14,400/tonelada y cerca de máximos históricos. Es la racha semanal ganadora más larga desde 1994. Los inventarios de cobre en la SHFE cayeron alrededor de 13% hasta aproximadamente 63,000 toneladas, mientras el metal seguía siendo atraído hacia EE. UU. ante un posible arancel al cobre refinado.
🏭 El apoyo del cobre no proviene solo de los inventarios. La producción minera global cayó alrededor de 1.1% en el primer semestre del año, mientras que Chile y varias operaciones importantes siguieron enfrentando interrupciones. El PMI manufacturero de China en 49.8 todavía apunta a una demanda débil, pero la oferta restringida ha ayudado a que el cobre se mantenga resiliente pese a señales de crecimiento más débiles.
📊 La próxima semana, el oro seguirá centrado en el IPP, IPC y las expectativas del FOMC de EE. UU., con el área de $4,360–4,530/oz en foco. El cobre mantiene un sesgo a corto plazo neutral a positivo mientras los inventarios sigan ajustados, pero los riesgos aumentarían si la demanda china decepciona o si cambia la política arancelaria de EE. UU. sobre el cobre refinado. La divergencia sigue clara: los metales preciosos están descontando a la Fed, mientras que el cobre está descontando la oferta y los inventarios.
#Metals $XAU $XAG $COPPER
Semana de metales 31 de ago–6 de sep: el oro sigue a la Fed mientras el cobre prolonga su racha ganadora
🥇 El oro cerró la semana alrededor de $4,420–4,430/oz tras una secuencia volátil impulsada en gran medida por las expectativas sobre las tasas en EE. UU. Los precios cayeron al inicio de la semana pese al aumento de las tensiones entre Irán y Hormuz, repuntaron más de 2% después de que Christopher Waller adoptara un tono más suave, y luego volvieron a estar bajo presión tras una cifra de nóminas no agrícolas (NFP) de +162,000. El movimiento sugiere que el oro cotizó más como un proxy de las expectativas sobre la Fed que como un refugio geopolítico sostenido.
🥈 La plata se movió con un beta más alto, pero terminó alrededor de $66/oz, prácticamente sin cambios o ligeramente al alza en la semana. El platino también registró pocos cambios cerca de $1,810–1,830/oz. En conjunto, los metales preciosos siguieron siendo muy sensibles a los rendimientos reales y al dólar, mientras que el riesgo geopolítico solo brindó apoyo intermitente.
🟠 El cobre se movió en la dirección opuesta. El cobre de la LME prolongó su avance hasta una décima semana consecutiva, cotizando cerca de $14,400/tonelada y cerca de máximos históricos. Es la racha semanal ganadora más larga desde 1994. Los inventarios de cobre en la SHFE cayeron alrededor de 13% hasta aproximadamente 63,000 toneladas, mientras el metal seguía siendo atraído hacia EE. UU. ante un posible arancel al cobre refinado.
🏭 El apoyo del cobre no proviene solo de los inventarios. La producción minera global cayó alrededor de 1.1% en el primer semestre del año, mientras que Chile y varias operaciones importantes siguieron enfrentando interrupciones. El PMI manufacturero de China en 49.8 todavía apunta a una demanda débil, pero la oferta restringida ha ayudado a que el cobre se mantenga resiliente pese a señales de crecimiento más débiles.
📊 La próxima semana, el oro seguirá centrado en el IPP, IPC y las expectativas del FOMC de EE. UU., con el área de $4,360–4,530/oz en foco. El cobre mantiene un sesgo a corto plazo neutral a positivo mientras los inventarios sigan ajustados, pero los riesgos aumentarían si la demanda china decepciona o si cambia la política arancelaria de EE. UU. sobre el cobre refinado. La divergencia sigue clara: los metales preciosos están descontando a la Fed, mientras que el cobre está descontando la oferta y los inventarios.
#Metals $XAU $XAG $COPPER
🥇 El oro cerró la semana alrededor de $4,420–4,430/oz tras una secuencia volátil impulsada en gran medida por las expectativas sobre las tasas en EE. UU. Los precios cayeron al inicio de la semana pese al aumento de las tensiones entre Irán y Hormuz, repuntaron más de 2% después de que Christopher Waller adoptara un tono más suave, y luego volvieron a estar bajo presión tras una cifra de nóminas no agrícolas (NFP) de +162,000. El movimiento sugiere que el oro cotizó más como un proxy de las expectativas sobre la Fed que como un refugio geopolítico sostenido.
🥈 La plata se movió con un beta más alto, pero terminó alrededor de $66/oz, prácticamente sin cambios o ligeramente al alza en la semana. El platino también registró pocos cambios cerca de $1,810–1,830/oz. En conjunto, los metales preciosos siguieron siendo muy sensibles a los rendimientos reales y al dólar, mientras que el riesgo geopolítico solo brindó apoyo intermitente.
🟠 El cobre se movió en la dirección opuesta. El cobre de la LME prolongó su avance hasta una décima semana consecutiva, cotizando cerca de $14,400/tonelada y cerca de máximos históricos. Es la racha semanal ganadora más larga desde 1994. Los inventarios de cobre en la SHFE cayeron alrededor de 13% hasta aproximadamente 63,000 toneladas, mientras el metal seguía siendo atraído hacia EE. UU. ante un posible arancel al cobre refinado.
🏭 El apoyo del cobre no proviene solo de los inventarios. La producción minera global cayó alrededor de 1.1% en el primer semestre del año, mientras que Chile y varias operaciones importantes siguieron enfrentando interrupciones. El PMI manufacturero de China en 49.8 todavía apunta a una demanda débil, pero la oferta restringida ha ayudado a que el cobre se mantenga resiliente pese a señales de crecimiento más débiles.
📊 La próxima semana, el oro seguirá centrado en el IPP, IPC y las expectativas del FOMC de EE. UU., con el área de $4,360–4,530/oz en foco. El cobre mantiene un sesgo a corto plazo neutral a positivo mientras los inventarios sigan ajustados, pero los riesgos aumentarían si la demanda china decepciona o si cambia la política arancelaria de EE. UU. sobre el cobre refinado. La divergencia sigue clara: los metales preciosos están descontando a la Fed, mientras que el cobre está descontando la oferta y los inventarios.
#Metals $XAU $XAG $COPPER
150
·
--
Alcista
Resumen del mercado de metales, 24–29 de agosto: oro y plata caen mientras el cobre y el zinc se mantienen resistentes
🥇 El oro cerró la semana con una caída de alrededor del 3% después de tocar brevemente cerca de los 4.696 dólares, su nivel más alto en más de tres meses. El 28 de agosto, declaraciones más firmes de la presidenta de la Fed, Kevin Warsh, impulsaron el rendimiento del Treasury estadounidense a 2 años hacia el 4,35%, lo que provocó la mayor caída del oro en aproximadamente seis semanas. La plata cayó incluso más, perdiendo cerca de un 3,5–4,3% el viernes.
📉 A pesar de la venta masiva, el oro se mantuvo subiendo alrededor de un 11% en agosto. El movimiento pareció, por tanto, más bien un reacomodo de la perspectiva de tipos en EE. UU., amplificado por un posicionamiento especulativo abarrotado, en lugar de una reversión total de la tendencia más amplia de las materias primas preciosas.
🏭 El cobre resistió mejor, ya que la escasez en el mercado físico siguió brindando apoyo. Los inventarios disponibles de la LME cayeron a unas 107.050 toneladas, mientras que las existencias de la SHFE disminuyeron un 19,1% hasta 72.428 toneladas. El cobre de la COMEX cayó solo modestamente el viernes, lo que mostró que todavía las dinámicas de inventario y flujo de metal superaban la presión de los tipos.
⚙️ El zinc fue el principal destaque entre los metales básicos, con precios de la LME alcanzando su nivel más alto desde mayo de 2022. Los inventarios disponibles cayeron a unas 75.600 toneladas, equivalentes a cerca de dos días de consumo global, mientras que el backwardation siguió señalando una oferta cercana ajustada.
🔄 El paladio también se desmarcó, subiendo más de un 5% el 28 de agosto mientras el oro y la plata caían. El cierre de posiciones cortas y su perfil industrial más sólido probablemente contribuyeron al movimiento.
📊 La semana puso de relieve dos impulsores distintos en los metales. El oro y la plata siguieron siendo sensibles a tipos, rendimientos y el dólar, mientras que el cobre y el zinc estuvieron impulsados más por inventarios y oferta física. Las nóminas de EE. UU. serán clave para las materias primas preciosas la próxima semana, mientras que los inventarios de la LME y la SHFE siguen siendo centrales para el cobre y el zinc.
#Metals $XAU $XAG $COPPER
Resumen del mercado de metales, 24–29 de agosto: oro y plata caen mientras el cobre y el zinc se mantienen resistentes
🥇 El oro cerró la semana con una caída de alrededor del 3% después de tocar brevemente cerca de los 4.696 dólares, su nivel más alto en más de tres meses. El 28 de agosto, declaraciones más firmes de la presidenta de la Fed, Kevin Warsh, impulsaron el rendimiento del Treasury estadounidense a 2 años hacia el 4,35%, lo que provocó la mayor caída del oro en aproximadamente seis semanas. La plata cayó incluso más, perdiendo cerca de un 3,5–4,3% el viernes.
📉 A pesar de la venta masiva, el oro se mantuvo subiendo alrededor de un 11% en agosto. El movimiento pareció, por tanto, más bien un reacomodo de la perspectiva de tipos en EE. UU., amplificado por un posicionamiento especulativo abarrotado, en lugar de una reversión total de la tendencia más amplia de las materias primas preciosas.
🏭 El cobre resistió mejor, ya que la escasez en el mercado físico siguió brindando apoyo. Los inventarios disponibles de la LME cayeron a unas 107.050 toneladas, mientras que las existencias de la SHFE disminuyeron un 19,1% hasta 72.428 toneladas. El cobre de la COMEX cayó solo modestamente el viernes, lo que mostró que todavía las dinámicas de inventario y flujo de metal superaban la presión de los tipos.
⚙️ El zinc fue el principal destaque entre los metales básicos, con precios de la LME alcanzando su nivel más alto desde mayo de 2022. Los inventarios disponibles cayeron a unas 75.600 toneladas, equivalentes a cerca de dos días de consumo global, mientras que el backwardation siguió señalando una oferta cercana ajustada.
🔄 El paladio también se desmarcó, subiendo más de un 5% el 28 de agosto mientras el oro y la plata caían. El cierre de posiciones cortas y su perfil industrial más sólido probablemente contribuyeron al movimiento.
📊 La semana puso de relieve dos impulsores distintos en los metales. El oro y la plata siguieron siendo sensibles a tipos, rendimientos y el dólar, mientras que el cobre y el zinc estuvieron impulsados más por inventarios y oferta física. Las nóminas de EE. UU. serán clave para las materias primas preciosas la próxima semana, mientras que los inventarios de la LME y la SHFE siguen siendo centrales para el cobre y el zinc.
#Metals $XAU $XAG $COPPER
🥇 El oro cerró la semana con una caída de alrededor del 3% después de tocar brevemente cerca de los 4.696 dólares, su nivel más alto en más de tres meses. El 28 de agosto, declaraciones más firmes de la presidenta de la Fed, Kevin Warsh, impulsaron el rendimiento del Treasury estadounidense a 2 años hacia el 4,35%, lo que provocó la mayor caída del oro en aproximadamente seis semanas. La plata cayó incluso más, perdiendo cerca de un 3,5–4,3% el viernes.
📉 A pesar de la venta masiva, el oro se mantuvo subiendo alrededor de un 11% en agosto. El movimiento pareció, por tanto, más bien un reacomodo de la perspectiva de tipos en EE. UU., amplificado por un posicionamiento especulativo abarrotado, en lugar de una reversión total de la tendencia más amplia de las materias primas preciosas.
🏭 El cobre resistió mejor, ya que la escasez en el mercado físico siguió brindando apoyo. Los inventarios disponibles de la LME cayeron a unas 107.050 toneladas, mientras que las existencias de la SHFE disminuyeron un 19,1% hasta 72.428 toneladas. El cobre de la COMEX cayó solo modestamente el viernes, lo que mostró que todavía las dinámicas de inventario y flujo de metal superaban la presión de los tipos.
⚙️ El zinc fue el principal destaque entre los metales básicos, con precios de la LME alcanzando su nivel más alto desde mayo de 2022. Los inventarios disponibles cayeron a unas 75.600 toneladas, equivalentes a cerca de dos días de consumo global, mientras que el backwardation siguió señalando una oferta cercana ajustada.
🔄 El paladio también se desmarcó, subiendo más de un 5% el 28 de agosto mientras el oro y la plata caían. El cierre de posiciones cortas y su perfil industrial más sólido probablemente contribuyeron al movimiento.
📊 La semana puso de relieve dos impulsores distintos en los metales. El oro y la plata siguieron siendo sensibles a tipos, rendimientos y el dólar, mientras que el cobre y el zinc estuvieron impulsados más por inventarios y oferta física. Las nóminas de EE. UU. serán clave para las materias primas preciosas la próxima semana, mientras que los inventarios de la LME y la SHFE siguen siendo centrales para el cobre y el zinc.
#Metals $XAU $XAG $COPPER
187


·
--
Alcista
Verificado
Resumen del mercado global de metales de la semana del 29 de junio al 4 de julio de 2026 muestra una división clara entre metales base y metales preciosos.
🌐 Los metales base como el cobre, el aluminio, el zinc y el níquel se negociaron mayormente en un rango estrecho, ya que el mercado equilibró expectativas de oferta más ajustadas, inventarios en descenso y una demanda industrial desigual. En cambio, los metales preciosos superaron al alza, con el oro y la plata liderando el movimiento.
⚡ El principal catalizador fue la publicación de datos de empleo en EE. UU. de junio más débiles de lo esperado, lo que elevó las expectativas de una Fed más “dovish” (menos restrictiva). A medida que los rendimientos y el dólar estadounidense perdieron presión, el oro se movió por encima de la zona de 4.100 USD/oz, mientras que la plata trepó hacia el rango de 60–62 USD/oz.
🟠 El cobre no ha salido completamente en el corto plazo, en parte porque los precios ya están elevados y las perspectivas de demanda de China siguen siendo mixtas. Aun así, el escenario de más largo plazo se mantiene respaldado por una oferta minera ajustada, menores inventarios en la LME y riesgos de disrupción en regiones productoras clave.
🏗️ El aluminio se enfrió tras su rally anterior, pero los inventarios físicos bajos y los riesgos de suministro continúan brindando soporte. El níquel y el plomo se mantuvieron más débiles debido a la presión de sobreoferta, mientras que el estaño siguió relativamente firme por su historia de déficit estructural.
🔌 Un tema clave a medio plazo es el aumento de la demanda de metales impulsada por la IA, los centros de datos y las actualizaciones de la red eléctrica. El cobre y el aluminio son los beneficiarios más claros, ya que la inversión en infraestructura eléctrica, energía renovable y vehículos eléctricos sigue expandiéndose.
📉 La divergencia también se observó en el mineral de hierro y el acero, que permanecieron bajo presión por la nueva oferta y la débil demanda inmobiliaria en China. Esto separa los metales no ferrosos con un respaldo más sólido de oferta-demanda frente a los metales ferrosos que todavía carecen de un catalizador de crecimiento fuerte.
🔎 En el corto plazo, los mercados observarán los datos de inflación de EE. UU., las señales de la Fed, las negociaciones en Medio Oriente, las decisiones sobre el arancel al cobre en EE. UU. y los datos industriales de China. La perspectiva de más largo plazo para el cobre, el aluminio, el estaño, el oro y la plata se mantiene constructiva, pero la volatilidad podría seguir alta.
#Metals $XAU $XAG $COPPER
Resumen del mercado global de metales de la semana del 29 de junio al 4 de julio de 2026 muestra una división clara entre metales base y metales preciosos.
🌐 Los metales base como el cobre, el aluminio, el zinc y el níquel se negociaron mayormente en un rango estrecho, ya que el mercado equilibró expectativas de oferta más ajustadas, inventarios en descenso y una demanda industrial desigual. En cambio, los metales preciosos superaron al alza, con el oro y la plata liderando el movimiento.
⚡ El principal catalizador fue la publicación de datos de empleo en EE. UU. de junio más débiles de lo esperado, lo que elevó las expectativas de una Fed más “dovish” (menos restrictiva). A medida que los rendimientos y el dólar estadounidense perdieron presión, el oro se movió por encima de la zona de 4.100 USD/oz, mientras que la plata trepó hacia el rango de 60–62 USD/oz.
🟠 El cobre no ha salido completamente en el corto plazo, en parte porque los precios ya están elevados y las perspectivas de demanda de China siguen siendo mixtas. Aun así, el escenario de más largo plazo se mantiene respaldado por una oferta minera ajustada, menores inventarios en la LME y riesgos de disrupción en regiones productoras clave.
🏗️ El aluminio se enfrió tras su rally anterior, pero los inventarios físicos bajos y los riesgos de suministro continúan brindando soporte. El níquel y el plomo se mantuvieron más débiles debido a la presión de sobreoferta, mientras que el estaño siguió relativamente firme por su historia de déficit estructural.
🔌 Un tema clave a medio plazo es el aumento de la demanda de metales impulsada por la IA, los centros de datos y las actualizaciones de la red eléctrica. El cobre y el aluminio son los beneficiarios más claros, ya que la inversión en infraestructura eléctrica, energía renovable y vehículos eléctricos sigue expandiéndose.
📉 La divergencia también se observó en el mineral de hierro y el acero, que permanecieron bajo presión por la nueva oferta y la débil demanda inmobiliaria en China. Esto separa los metales no ferrosos con un respaldo más sólido de oferta-demanda frente a los metales ferrosos que todavía carecen de un catalizador de crecimiento fuerte.
🔎 En el corto plazo, los mercados observarán los datos de inflación de EE. UU., las señales de la Fed, las negociaciones en Medio Oriente, las decisiones sobre el arancel al cobre en EE. UU. y los datos industriales de China. La perspectiva de más largo plazo para el cobre, el aluminio, el estaño, el oro y la plata se mantiene constructiva, pero la volatilidad podría seguir alta.
#Metals $XAU $XAG $COPPER
🌐 Los metales base como el cobre, el aluminio, el zinc y el níquel se negociaron mayormente en un rango estrecho, ya que el mercado equilibró expectativas de oferta más ajustadas, inventarios en descenso y una demanda industrial desigual. En cambio, los metales preciosos superaron al alza, con el oro y la plata liderando el movimiento.
⚡ El principal catalizador fue la publicación de datos de empleo en EE. UU. de junio más débiles de lo esperado, lo que elevó las expectativas de una Fed más “dovish” (menos restrictiva). A medida que los rendimientos y el dólar estadounidense perdieron presión, el oro se movió por encima de la zona de 4.100 USD/oz, mientras que la plata trepó hacia el rango de 60–62 USD/oz.
🟠 El cobre no ha salido completamente en el corto plazo, en parte porque los precios ya están elevados y las perspectivas de demanda de China siguen siendo mixtas. Aun así, el escenario de más largo plazo se mantiene respaldado por una oferta minera ajustada, menores inventarios en la LME y riesgos de disrupción en regiones productoras clave.
🏗️ El aluminio se enfrió tras su rally anterior, pero los inventarios físicos bajos y los riesgos de suministro continúan brindando soporte. El níquel y el plomo se mantuvieron más débiles debido a la presión de sobreoferta, mientras que el estaño siguió relativamente firme por su historia de déficit estructural.
🔌 Un tema clave a medio plazo es el aumento de la demanda de metales impulsada por la IA, los centros de datos y las actualizaciones de la red eléctrica. El cobre y el aluminio son los beneficiarios más claros, ya que la inversión en infraestructura eléctrica, energía renovable y vehículos eléctricos sigue expandiéndose.
📉 La divergencia también se observó en el mineral de hierro y el acero, que permanecieron bajo presión por la nueva oferta y la débil demanda inmobiliaria en China. Esto separa los metales no ferrosos con un respaldo más sólido de oferta-demanda frente a los metales ferrosos que todavía carecen de un catalizador de crecimiento fuerte.
🔎 En el corto plazo, los mercados observarán los datos de inflación de EE. UU., las señales de la Fed, las negociaciones en Medio Oriente, las decisiones sobre el arancel al cobre en EE. UU. y los datos industriales de China. La perspectiva de más largo plazo para el cobre, el aluminio, el estaño, el oro y la plata se mantiene constructiva, pero la volatilidad podría seguir alta.
#Metals $XAU $XAG $COPPER
2
945

·
--
Bajista
🔴 $COPPER
{future}(COPPERUSDT)
Alerta de Liquidación Larga
💰 Monto Liquidado:
$1.4506K
📍 Precio de Liquidación:
6.75 (BINANCE)
━━━━━━━━━━━━━━
📊 Perspectiva del Operativo
🎯 Objetivo:
6.63
📥 Zona de Entrada:
6.71
📈 Take Profit:
6.66
🛑 Stop Loss:
6.82
━━━━━━━━━━━━━━
⚡ INFORME DE TRADING ELITE ⚡
Las liquidaciones largas reflejan un aumento de la presión de venta a medida que el precio atraviesa la liquidez del lado bajista. Esperar una confirmación bajista antes de entrar puede reducir las señales falsas, mientras que mantener niveles disciplinados de stop-loss ayuda a protegerse ante rebotes repentinos.
#Copper #commodities #Metals
🔴 $COPPER
Alerta de Liquidación Larga
💰 Monto Liquidado:
$1.4506K
📍 Precio de Liquidación:
6.75 (BINANCE)
━━━━━━━━━━━━━━
📊 Perspectiva del Operativo
🎯 Objetivo:
6.63
📥 Zona de Entrada:
6.71
📈 Take Profit:
6.66
🛑 Stop Loss:
6.82
━━━━━━━━━━━━━━
⚡ INFORME DE TRADING ELITE ⚡
Las liquidaciones largas reflejan un aumento de la presión de venta a medida que el precio atraviesa la liquidez del lado bajista. Esperar una confirmación bajista antes de entrar puede reducir las señales falsas, mientras que mantener niveles disciplinados de stop-loss ayuda a protegerse ante rebotes repentinos.
#Copper #commodities #Metals
Alerta de Liquidación Larga
💰 Monto Liquidado:
$1.4506K
📍 Precio de Liquidación:
6.75 (BINANCE)
━━━━━━━━━━━━━━
📊 Perspectiva del Operativo
🎯 Objetivo:
6.63
📥 Zona de Entrada:
6.71
📈 Take Profit:
6.66
🛑 Stop Loss:
6.82
━━━━━━━━━━━━━━
⚡ INFORME DE TRADING ELITE ⚡
Las liquidaciones largas reflejan un aumento de la presión de venta a medida que el precio atraviesa la liquidez del lado bajista. Esperar una confirmación bajista antes de entrar puede reducir las señales falsas, mientras que mantener niveles disciplinados de stop-loss ayuda a protegerse ante rebotes repentinos.
#Copper #commodities #Metals
3
·
--
Alcista
Los metales globales se dividen mientras el oro enfrenta la presión de la Fed, mientras que el cobre se mantiene firme ante el suministro ajustado
📉 El mercado de metales se diversificó esta semana. Los metales preciosos se debilitaron ya que los datos más fuertes de EE.UU. elevaron el dólar y los rendimientos del Tesoro, empujando a los mercados a valorar una Fed más agresiva por más tiempo.
🟡 El oro aún encontró algo de soporte por las tensiones entre EE.UU. e Irán, pero la geopolítica no fue suficiente para compensar la presión macroeconómica. Con la inflación y los datos laborales aún calientes, el costo de oportunidad de mantener oro aumentó, haciendo que los rebotes parecieran más técnicos que impulsados por tendencias.
⚪ La plata se mantuvo ligeramente mejor gracias a su papel dual como activo monetario e industrial, pero seguía atada a la presión más amplia sobre los metales preciosos. El platino y el paladio se mantuvieron más débiles a medida que la transición hacia los vehículos eléctricos seguía pesando sobre la demanda de catalizadores de automóviles.
🔶 El cobre fue el gran protagonista. A pesar de la volatilidad macroeconómica, los precios fueron respaldados por señales físicas más ajustadas, disminución de las existencias en LME, mayores garantías canceladas y flujos de metales moviéndose hacia EE.UU. antes de posibles cambios en los aranceles.
🏗️ Los riesgos de suministro también fortalecieron el caso del cobre. Las interrupciones en minas importantes como Grasberg hacen que un reajuste rápido en 2026 sea menos probable, mientras que la demanda de centros de datos de IA, redes eléctricas y electrificación sigue apoyando las perspectivas a largo plazo.
🌍 Irán y Hormuz siguen siendo riesgos clave, pero el impacto es de doble filo. Las tensiones pueden apoyar al oro a corto plazo, mientras que los costos más altos de energía y logística pueden añadir presión inflacionaria. Para el cobre y el níquel, los riesgos en la cadena de suministro pueden crear un extra de prima si las interrupciones duran más.
📌 En general, los metales preciosos siguen siendo sensibles a la Fed, al dólar y a los rendimientos, mientras que el cobre tiene un soporte más sólido gracias a las existencias, las restricciones de suministro y la demanda industrial. La próxima semana, los mercados estarán atentos a las señales políticas de EE.UU., Hormuz, las existencias de LME/COMEX y las actualizaciones de aranceles del cobre en EE.UU.
#Metals $XAU $XAG $COPPER
Los metales globales se dividen mientras el oro enfrenta la presión de la Fed, mientras que el cobre se mantiene firme ante el suministro ajustado
📉 El mercado de metales se diversificó esta semana. Los metales preciosos se debilitaron ya que los datos más fuertes de EE.UU. elevaron el dólar y los rendimientos del Tesoro, empujando a los mercados a valorar una Fed más agresiva por más tiempo.
🟡 El oro aún encontró algo de soporte por las tensiones entre EE.UU. e Irán, pero la geopolítica no fue suficiente para compensar la presión macroeconómica. Con la inflación y los datos laborales aún calientes, el costo de oportunidad de mantener oro aumentó, haciendo que los rebotes parecieran más técnicos que impulsados por tendencias.
⚪ La plata se mantuvo ligeramente mejor gracias a su papel dual como activo monetario e industrial, pero seguía atada a la presión más amplia sobre los metales preciosos. El platino y el paladio se mantuvieron más débiles a medida que la transición hacia los vehículos eléctricos seguía pesando sobre la demanda de catalizadores de automóviles.
🔶 El cobre fue el gran protagonista. A pesar de la volatilidad macroeconómica, los precios fueron respaldados por señales físicas más ajustadas, disminución de las existencias en LME, mayores garantías canceladas y flujos de metales moviéndose hacia EE.UU. antes de posibles cambios en los aranceles.
🏗️ Los riesgos de suministro también fortalecieron el caso del cobre. Las interrupciones en minas importantes como Grasberg hacen que un reajuste rápido en 2026 sea menos probable, mientras que la demanda de centros de datos de IA, redes eléctricas y electrificación sigue apoyando las perspectivas a largo plazo.
🌍 Irán y Hormuz siguen siendo riesgos clave, pero el impacto es de doble filo. Las tensiones pueden apoyar al oro a corto plazo, mientras que los costos más altos de energía y logística pueden añadir presión inflacionaria. Para el cobre y el níquel, los riesgos en la cadena de suministro pueden crear un extra de prima si las interrupciones duran más.
📌 En general, los metales preciosos siguen siendo sensibles a la Fed, al dólar y a los rendimientos, mientras que el cobre tiene un soporte más sólido gracias a las existencias, las restricciones de suministro y la demanda industrial. La próxima semana, los mercados estarán atentos a las señales políticas de EE.UU., Hormuz, las existencias de LME/COMEX y las actualizaciones de aranceles del cobre en EE.UU.
#Metals $XAU $XAG $COPPER
📉 El mercado de metales se diversificó esta semana. Los metales preciosos se debilitaron ya que los datos más fuertes de EE.UU. elevaron el dólar y los rendimientos del Tesoro, empujando a los mercados a valorar una Fed más agresiva por más tiempo.
🟡 El oro aún encontró algo de soporte por las tensiones entre EE.UU. e Irán, pero la geopolítica no fue suficiente para compensar la presión macroeconómica. Con la inflación y los datos laborales aún calientes, el costo de oportunidad de mantener oro aumentó, haciendo que los rebotes parecieran más técnicos que impulsados por tendencias.
⚪ La plata se mantuvo ligeramente mejor gracias a su papel dual como activo monetario e industrial, pero seguía atada a la presión más amplia sobre los metales preciosos. El platino y el paladio se mantuvieron más débiles a medida que la transición hacia los vehículos eléctricos seguía pesando sobre la demanda de catalizadores de automóviles.
🔶 El cobre fue el gran protagonista. A pesar de la volatilidad macroeconómica, los precios fueron respaldados por señales físicas más ajustadas, disminución de las existencias en LME, mayores garantías canceladas y flujos de metales moviéndose hacia EE.UU. antes de posibles cambios en los aranceles.
🏗️ Los riesgos de suministro también fortalecieron el caso del cobre. Las interrupciones en minas importantes como Grasberg hacen que un reajuste rápido en 2026 sea menos probable, mientras que la demanda de centros de datos de IA, redes eléctricas y electrificación sigue apoyando las perspectivas a largo plazo.
🌍 Irán y Hormuz siguen siendo riesgos clave, pero el impacto es de doble filo. Las tensiones pueden apoyar al oro a corto plazo, mientras que los costos más altos de energía y logística pueden añadir presión inflacionaria. Para el cobre y el níquel, los riesgos en la cadena de suministro pueden crear un extra de prima si las interrupciones duran más.
📌 En general, los metales preciosos siguen siendo sensibles a la Fed, al dólar y a los rendimientos, mientras que el cobre tiene un soporte más sólido gracias a las existencias, las restricciones de suministro y la demanda industrial. La próxima semana, los mercados estarán atentos a las señales políticas de EE.UU., Hormuz, las existencias de LME/COMEX y las actualizaciones de aranceles del cobre en EE.UU.
#Metals $XAU $XAG $COPPER
3.3k

·
--
Alcista
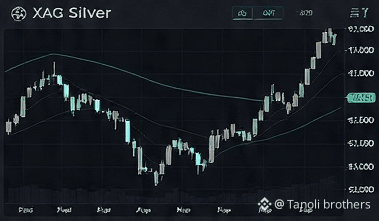
$XAG /USDT | PLATA | ACTUALIZACIÓN
Precio: *$58.68 | +1.09%*
$XAG +1% mientras $XAU cayó. La plata lidera
*$59 BREAK = $60 PRÓXIMO*.
Niveles Clave: Soporte $58 | Resistencia $59 → $60
Nota: Volumen $1.43B. Demanda industrial + refugio seguro.
*OBJETIVO: $60+ CARGANDO*
La plata supera al oro en las subidas
#Silver #XAGUSTD #Metals #Macro
$XAG /USDT | PLATA | ACTUALIZACIÓN
Precio: *$58.68 | +1.09%*
$XAG +1% mientras $XAU cayó. La plata lidera
*$59 BREAK = $60 PRÓXIMO*.
Niveles Clave: Soporte $58 | Resistencia $59 → $60
Nota: Volumen $1.43B. Demanda industrial + refugio seguro.
*OBJETIVO: $60+ CARGANDO*
La plata supera al oro en las subidas
#Silver #XAGUSTD #Metals #Macro
Precio: *$58.68 | +1.09%*
$XAG +1% mientras $XAU cayó. La plata lidera
*$59 BREAK = $60 PRÓXIMO*.
Niveles Clave: Soporte $58 | Resistencia $59 → $60
Nota: Volumen $1.43B. Demanda industrial + refugio seguro.
*OBJETIVO: $60+ CARGANDO*
La plata supera al oro en las subidas
#Silver #XAGUSTD #Metals #Macro
243
·
--
Alcista
Descripción general del mercado global de metales para el 17–22 de agosto de 2026: El oro y la plata lideran las subidas, mientras que los metales básicos se mantienen mixtos
🥇 El oro subió alrededor de un 5% durante la semana, alcanzando brevemente la zona de 4.624–4.632 USD/oz, su nivel más alto en más de tres meses. El avance estuvo respaldado por un USD más débil, que alivió los rendimientos de EE. UU. y reavivó las preocupaciones fiscales tras la expansión de la recompra de bonos a largo plazo por parte del Tesoro.
🥈 La plata también registró alzas sólidas, acercándose a 69,5–69,9 USD/oz, su nivel más alto en aproximadamente dos meses. El metal se benefició tanto de un entorno macroeconómico favorable para los activos refugio como de unas expectativas de demanda industrial relativamente estables.
🏦 La demanda de inversión siguió aportando una base sólida para los metales preciosos. Los ETF de oro respaldados físicamente registraron entradas fuertes en las últimas semanas, mientras que las compras de bancos centrales se mantuvieron elevadas, reforzando la demanda más allá de la posición especulativa de corto plazo.
🟠 El cobre se negoció alrededor de 14.000–14.200 USD por tonelada, pero mostró una tendencia menos consistente. Las existencias de la LME habían caído con fuerza y empujaron las primas al contado al alza, antes de rebotar más de un 17% desde el mínimo y suavizarse la tensión de suministro en el corto plazo.
🏭 Los datos económicos chinos más débiles siguieron pesando sobre los metales industriales. En contraste, el aluminio y el zinc permanecieron respaldados por existencias relativamente bajas en la LME, lo que pone de relieve una clara divergencia en las condiciones de oferta física entre los metales básicos.
⛏️ El mineral de hierro se mantuvo cerca de 95–96 USD por tonelada. Las importaciones chinas siguieron relativamente estables, pero la débil demanda de acero y el elevado nivel de inventarios en puertos continuaron limitando el potencial de un movimiento alcista sostenido.
📊 De cara al futuro, es probable que los mercados se concentren en los movimientos del USD, las señales de la política de la Fed, los datos de PCE de EE. UU., los cambios diarios en los inventarios de la LME y los indicadores de demanda de China. Los metales preciosos siguen siendo muy sensibles a las condiciones macroeconómicas, mientras que el cobre y otros metales básicos pueden continuar reaccionando con fuerza a los flujos de inventarios y a las perspectivas de crecimiento global.
#Metals $XAUT $XAG $COPPER
Descripción general del mercado global de metales para el 17–22 de agosto de 2026: El oro y la plata lideran las subidas, mientras que los metales básicos se mantienen mixtos
🥇 El oro subió alrededor de un 5% durante la semana, alcanzando brevemente la zona de 4.624–4.632 USD/oz, su nivel más alto en más de tres meses. El avance estuvo respaldado por un USD más débil, que alivió los rendimientos de EE. UU. y reavivó las preocupaciones fiscales tras la expansión de la recompra de bonos a largo plazo por parte del Tesoro.
🥈 La plata también registró alzas sólidas, acercándose a 69,5–69,9 USD/oz, su nivel más alto en aproximadamente dos meses. El metal se benefició tanto de un entorno macroeconómico favorable para los activos refugio como de unas expectativas de demanda industrial relativamente estables.
🏦 La demanda de inversión siguió aportando una base sólida para los metales preciosos. Los ETF de oro respaldados físicamente registraron entradas fuertes en las últimas semanas, mientras que las compras de bancos centrales se mantuvieron elevadas, reforzando la demanda más allá de la posición especulativa de corto plazo.
🟠 El cobre se negoció alrededor de 14.000–14.200 USD por tonelada, pero mostró una tendencia menos consistente. Las existencias de la LME habían caído con fuerza y empujaron las primas al contado al alza, antes de rebotar más de un 17% desde el mínimo y suavizarse la tensión de suministro en el corto plazo.
🏭 Los datos económicos chinos más débiles siguieron pesando sobre los metales industriales. En contraste, el aluminio y el zinc permanecieron respaldados por existencias relativamente bajas en la LME, lo que pone de relieve una clara divergencia en las condiciones de oferta física entre los metales básicos.
⛏️ El mineral de hierro se mantuvo cerca de 95–96 USD por tonelada. Las importaciones chinas siguieron relativamente estables, pero la débil demanda de acero y el elevado nivel de inventarios en puertos continuaron limitando el potencial de un movimiento alcista sostenido.
📊 De cara al futuro, es probable que los mercados se concentren en los movimientos del USD, las señales de la política de la Fed, los datos de PCE de EE. UU., los cambios diarios en los inventarios de la LME y los indicadores de demanda de China. Los metales preciosos siguen siendo muy sensibles a las condiciones macroeconómicas, mientras que el cobre y otros metales básicos pueden continuar reaccionando con fuerza a los flujos de inventarios y a las perspectivas de crecimiento global.
#Metals $XAUT $XAG $COPPER
🥇 El oro subió alrededor de un 5% durante la semana, alcanzando brevemente la zona de 4.624–4.632 USD/oz, su nivel más alto en más de tres meses. El avance estuvo respaldado por un USD más débil, que alivió los rendimientos de EE. UU. y reavivó las preocupaciones fiscales tras la expansión de la recompra de bonos a largo plazo por parte del Tesoro.
🥈 La plata también registró alzas sólidas, acercándose a 69,5–69,9 USD/oz, su nivel más alto en aproximadamente dos meses. El metal se benefició tanto de un entorno macroeconómico favorable para los activos refugio como de unas expectativas de demanda industrial relativamente estables.
🏦 La demanda de inversión siguió aportando una base sólida para los metales preciosos. Los ETF de oro respaldados físicamente registraron entradas fuertes en las últimas semanas, mientras que las compras de bancos centrales se mantuvieron elevadas, reforzando la demanda más allá de la posición especulativa de corto plazo.
🟠 El cobre se negoció alrededor de 14.000–14.200 USD por tonelada, pero mostró una tendencia menos consistente. Las existencias de la LME habían caído con fuerza y empujaron las primas al contado al alza, antes de rebotar más de un 17% desde el mínimo y suavizarse la tensión de suministro en el corto plazo.
🏭 Los datos económicos chinos más débiles siguieron pesando sobre los metales industriales. En contraste, el aluminio y el zinc permanecieron respaldados por existencias relativamente bajas en la LME, lo que pone de relieve una clara divergencia en las condiciones de oferta física entre los metales básicos.
⛏️ El mineral de hierro se mantuvo cerca de 95–96 USD por tonelada. Las importaciones chinas siguieron relativamente estables, pero la débil demanda de acero y el elevado nivel de inventarios en puertos continuaron limitando el potencial de un movimiento alcista sostenido.
📊 De cara al futuro, es probable que los mercados se concentren en los movimientos del USD, las señales de la política de la Fed, los datos de PCE de EE. UU., los cambios diarios en los inventarios de la LME y los indicadores de demanda de China. Los metales preciosos siguen siendo muy sensibles a las condiciones macroeconómicas, mientras que el cobre y otros metales básicos pueden continuar reaccionando con fuerza a los flujos de inventarios y a las perspectivas de crecimiento global.
#Metals $XAUT $XAG $COPPER
109
·
--
Alcista
Resumen general del mercado global de metales del 10–15 de agosto: el oro extiende la recuperación mientras el cobre lidera los metales base
🟡 Los mercados de metales mostraron una divergencia clara durante la semana pasada: los metales preciosos estuvieron respaldados por un dólar estadounidense más débil y menores rendimientos de los Treasury, mientras que los metales base reaccionaron con mayor fuerza a las condiciones de inventario y los riesgos de suministro. La liquidez relativamente fina del verano mantuvo la volatilidad general contenida.
🥇 El oro extendió su recuperación y llegó brevemente a su nivel más alto en casi dos meses antes de consolidarse hacia el final de la semana. Las expectativas más flexibles de la Fed tras los datos de EE. UU., las entradas a los ETF y los riesgos geopolíticos persistentes continuaron brindando respaldo. La plata superó en términos relativos, beneficiándose tanto de la fortaleza del oro como de la demanda industrial.
🔶 El cobre se mantuvo como el mejor desempeño entre los metales base, con precios cerca de niveles elevados. Los inventarios de la LME continuaron disminuyendo, mientras que las existencias de la COMEX aumentaron a medida que el metal fluyó hacia EE. UU., ajustando la disponibilidad fuera del país. Antofagasta redujo su guía de producción tras interrupciones en Los Pelambres, mientras que los problemas de fundición en Indonesia añadieron preocupaciones más amplias sobre el suministro.
🏭 El zinc y el aluminio también encontraron respaldo por inventarios bajos y riesgos de producción. El níquel quedó rezagado mientras los mercados evaluaban la posibilidad de un mayor suministro de mineral desde Indonesia. El mineral de hierro, el acero y los metales para baterías permanecieron relativamente más débiles, ya que la demanda industrial tradicional mostró una mejora limitada.
📊 En general, el oro y el cobre siguen siendo los metales clave a vigilar: el oro está impulsado principalmente por condiciones macroeconómicas, mientras que el cobre está respaldado de forma más directa por la estrechez del mercado físico. La próxima semana, el dólar estadounidense, los rendimientos de los Treasury, los datos de China, Jackson Hole y los acontecimientos de suministro en Chile e Indonesia podrían seguir siendo impulsores importantes del mercado.
#Metals $XAU $XAG $COPPER
Resumen general del mercado global de metales del 10–15 de agosto: el oro extiende la recuperación mientras el cobre lidera los metales base
🟡 Los mercados de metales mostraron una divergencia clara durante la semana pasada: los metales preciosos estuvieron respaldados por un dólar estadounidense más débil y menores rendimientos de los Treasury, mientras que los metales base reaccionaron con mayor fuerza a las condiciones de inventario y los riesgos de suministro. La liquidez relativamente fina del verano mantuvo la volatilidad general contenida.
🥇 El oro extendió su recuperación y llegó brevemente a su nivel más alto en casi dos meses antes de consolidarse hacia el final de la semana. Las expectativas más flexibles de la Fed tras los datos de EE. UU., las entradas a los ETF y los riesgos geopolíticos persistentes continuaron brindando respaldo. La plata superó en términos relativos, beneficiándose tanto de la fortaleza del oro como de la demanda industrial.
🔶 El cobre se mantuvo como el mejor desempeño entre los metales base, con precios cerca de niveles elevados. Los inventarios de la LME continuaron disminuyendo, mientras que las existencias de la COMEX aumentaron a medida que el metal fluyó hacia EE. UU., ajustando la disponibilidad fuera del país. Antofagasta redujo su guía de producción tras interrupciones en Los Pelambres, mientras que los problemas de fundición en Indonesia añadieron preocupaciones más amplias sobre el suministro.
🏭 El zinc y el aluminio también encontraron respaldo por inventarios bajos y riesgos de producción. El níquel quedó rezagado mientras los mercados evaluaban la posibilidad de un mayor suministro de mineral desde Indonesia. El mineral de hierro, el acero y los metales para baterías permanecieron relativamente más débiles, ya que la demanda industrial tradicional mostró una mejora limitada.
📊 En general, el oro y el cobre siguen siendo los metales clave a vigilar: el oro está impulsado principalmente por condiciones macroeconómicas, mientras que el cobre está respaldado de forma más directa por la estrechez del mercado físico. La próxima semana, el dólar estadounidense, los rendimientos de los Treasury, los datos de China, Jackson Hole y los acontecimientos de suministro en Chile e Indonesia podrían seguir siendo impulsores importantes del mercado.
#Metals $XAU $XAG $COPPER
🟡 Los mercados de metales mostraron una divergencia clara durante la semana pasada: los metales preciosos estuvieron respaldados por un dólar estadounidense más débil y menores rendimientos de los Treasury, mientras que los metales base reaccionaron con mayor fuerza a las condiciones de inventario y los riesgos de suministro. La liquidez relativamente fina del verano mantuvo la volatilidad general contenida.
🥇 El oro extendió su recuperación y llegó brevemente a su nivel más alto en casi dos meses antes de consolidarse hacia el final de la semana. Las expectativas más flexibles de la Fed tras los datos de EE. UU., las entradas a los ETF y los riesgos geopolíticos persistentes continuaron brindando respaldo. La plata superó en términos relativos, beneficiándose tanto de la fortaleza del oro como de la demanda industrial.
🔶 El cobre se mantuvo como el mejor desempeño entre los metales base, con precios cerca de niveles elevados. Los inventarios de la LME continuaron disminuyendo, mientras que las existencias de la COMEX aumentaron a medida que el metal fluyó hacia EE. UU., ajustando la disponibilidad fuera del país. Antofagasta redujo su guía de producción tras interrupciones en Los Pelambres, mientras que los problemas de fundición en Indonesia añadieron preocupaciones más amplias sobre el suministro.
🏭 El zinc y el aluminio también encontraron respaldo por inventarios bajos y riesgos de producción. El níquel quedó rezagado mientras los mercados evaluaban la posibilidad de un mayor suministro de mineral desde Indonesia. El mineral de hierro, el acero y los metales para baterías permanecieron relativamente más débiles, ya que la demanda industrial tradicional mostró una mejora limitada.
📊 En general, el oro y el cobre siguen siendo los metales clave a vigilar: el oro está impulsado principalmente por condiciones macroeconómicas, mientras que el cobre está respaldado de forma más directa por la estrechez del mercado físico. La próxima semana, el dólar estadounidense, los rendimientos de los Treasury, los datos de China, Jackson Hole y los acontecimientos de suministro en Chile e Indonesia podrían seguir siendo impulsores importantes del mercado.
#Metals $XAU $XAG $COPPER
95
·
--
Alcista
Resumen del mercado global de metales: 6–11 de julio de 2026
🌍 Los mercados globales de metales registraron una alta volatilidad esta semana debido a la tensión entre EE. UU. e Irán, los acontecimientos en torno al Estrecho de Ormuz y los movimientos del dólar estadounidense, que marcaron el sentimiento. El aluminio superó al complejo de metales base, mientras que el cobre sufrió presión por el apetito por el riesgo a la baja y las preocupaciones sobre el crecimiento global.
🏗️ El aluminio de la LME subió de alrededor de $3.105 a $3.141–$3.159 por tonelada. El avance estuvo respaldado por posibles disrupciones en el suministro de Oriente Medio, costos elevados de energía y flete, y la reposición de inventarios en China. Los inventarios de la LME cayeron al nivel más bajo desde 2022, mientras que los inventarios chinos disminuyeron aproximadamente un 25% desde su máximo de abril.
🔌 El cobre cotizó entre aproximadamente $13.160 y $13.400 por tonelada, cayendo con fuerza el 8 de julio cuando las tensiones geopolíticas desencadenaron un movimiento más amplio de “risk-off”. Sin embargo, la caída de inventarios en la LME y China, las primas de Shanghái más altas y la demanda de largo plazo impulsada por la IA, los centros de datos, los vehículos eléctricos y la infraestructura siguieron brindando soporte subyacente.
🛡️ El oro se recuperó de alrededor de $4.076 a más de $4.120 por onza a medida que las tensiones en Oriente Medio se intensificaron nuevamente. La plata mostró una volatilidad mayor y ganó aproximadamente un 3,1% en la sesión final de la semana. Las compras continuas de los bancos centrales también ayudaron a establecer un suelo más firme para los metales preciosos.
📈 Surgió una recuperación amplia el 10 de julio, con el cobre avanzando 1,71%, el aluminio 2,29%, el zinc 2,49% y el oro 1,23%. El movimiento sugirió que la demanda física y las condiciones de suministro ajustado podrían seguir limitando la presión a la baja cuando el sentimiento del mercado se estabilice.
🔎 A corto plazo, es probable que los metales sigan siendo sensibles a los acontecimientos en torno a Ormuz, los precios del petróleo, los datos económicos de China y las tendencias de inventarios de la LME. El aluminio tiene actualmente los fundamentos de soporte más claros; el cobre podría mantenerse volátil en ambos sentidos, mientras que el oro y la plata continúan desempeñando el papel de coberturas frente al riesgo geopolítico.
#Metals $XAU $XAG $COPPER
Resumen del mercado global de metales: 6–11 de julio de 2026
🌍 Los mercados globales de metales registraron una alta volatilidad esta semana debido a la tensión entre EE. UU. e Irán, los acontecimientos en torno al Estrecho de Ormuz y los movimientos del dólar estadounidense, que marcaron el sentimiento. El aluminio superó al complejo de metales base, mientras que el cobre sufrió presión por el apetito por el riesgo a la baja y las preocupaciones sobre el crecimiento global.
🏗️ El aluminio de la LME subió de alrededor de $3.105 a $3.141–$3.159 por tonelada. El avance estuvo respaldado por posibles disrupciones en el suministro de Oriente Medio, costos elevados de energía y flete, y la reposición de inventarios en China. Los inventarios de la LME cayeron al nivel más bajo desde 2022, mientras que los inventarios chinos disminuyeron aproximadamente un 25% desde su máximo de abril.
🔌 El cobre cotizó entre aproximadamente $13.160 y $13.400 por tonelada, cayendo con fuerza el 8 de julio cuando las tensiones geopolíticas desencadenaron un movimiento más amplio de “risk-off”. Sin embargo, la caída de inventarios en la LME y China, las primas de Shanghái más altas y la demanda de largo plazo impulsada por la IA, los centros de datos, los vehículos eléctricos y la infraestructura siguieron brindando soporte subyacente.
🛡️ El oro se recuperó de alrededor de $4.076 a más de $4.120 por onza a medida que las tensiones en Oriente Medio se intensificaron nuevamente. La plata mostró una volatilidad mayor y ganó aproximadamente un 3,1% en la sesión final de la semana. Las compras continuas de los bancos centrales también ayudaron a establecer un suelo más firme para los metales preciosos.
📈 Surgió una recuperación amplia el 10 de julio, con el cobre avanzando 1,71%, el aluminio 2,29%, el zinc 2,49% y el oro 1,23%. El movimiento sugirió que la demanda física y las condiciones de suministro ajustado podrían seguir limitando la presión a la baja cuando el sentimiento del mercado se estabilice.
🔎 A corto plazo, es probable que los metales sigan siendo sensibles a los acontecimientos en torno a Ormuz, los precios del petróleo, los datos económicos de China y las tendencias de inventarios de la LME. El aluminio tiene actualmente los fundamentos de soporte más claros; el cobre podría mantenerse volátil en ambos sentidos, mientras que el oro y la plata continúan desempeñando el papel de coberturas frente al riesgo geopolítico.
#Metals $XAU $XAG $COPPER
🌍 Los mercados globales de metales registraron una alta volatilidad esta semana debido a la tensión entre EE. UU. e Irán, los acontecimientos en torno al Estrecho de Ormuz y los movimientos del dólar estadounidense, que marcaron el sentimiento. El aluminio superó al complejo de metales base, mientras que el cobre sufrió presión por el apetito por el riesgo a la baja y las preocupaciones sobre el crecimiento global.
🏗️ El aluminio de la LME subió de alrededor de $3.105 a $3.141–$3.159 por tonelada. El avance estuvo respaldado por posibles disrupciones en el suministro de Oriente Medio, costos elevados de energía y flete, y la reposición de inventarios en China. Los inventarios de la LME cayeron al nivel más bajo desde 2022, mientras que los inventarios chinos disminuyeron aproximadamente un 25% desde su máximo de abril.
🔌 El cobre cotizó entre aproximadamente $13.160 y $13.400 por tonelada, cayendo con fuerza el 8 de julio cuando las tensiones geopolíticas desencadenaron un movimiento más amplio de “risk-off”. Sin embargo, la caída de inventarios en la LME y China, las primas de Shanghái más altas y la demanda de largo plazo impulsada por la IA, los centros de datos, los vehículos eléctricos y la infraestructura siguieron brindando soporte subyacente.
🛡️ El oro se recuperó de alrededor de $4.076 a más de $4.120 por onza a medida que las tensiones en Oriente Medio se intensificaron nuevamente. La plata mostró una volatilidad mayor y ganó aproximadamente un 3,1% en la sesión final de la semana. Las compras continuas de los bancos centrales también ayudaron a establecer un suelo más firme para los metales preciosos.
📈 Surgió una recuperación amplia el 10 de julio, con el cobre avanzando 1,71%, el aluminio 2,29%, el zinc 2,49% y el oro 1,23%. El movimiento sugirió que la demanda física y las condiciones de suministro ajustado podrían seguir limitando la presión a la baja cuando el sentimiento del mercado se estabilice.
🔎 A corto plazo, es probable que los metales sigan siendo sensibles a los acontecimientos en torno a Ormuz, los precios del petróleo, los datos económicos de China y las tendencias de inventarios de la LME. El aluminio tiene actualmente los fundamentos de soporte más claros; el cobre podría mantenerse volátil en ambos sentidos, mientras que el oro y la plata continúan desempeñando el papel de coberturas frente al riesgo geopolítico.
#Metals $XAU $XAG $COPPER
192
·
--
Alcista
Resumen del mercado global de metales del 15 al 20 de junio: el oro se enfría tras un fuerte rebote, mientras que el cobre mantiene su narrativa impulsada por la oferta
🟡 Los metales fueron volátiles esta semana, ya que los desarrollos entre EE.UU. e Irán aliviaron las preocupaciones en torno al estrecho de Ormuz y alejaron al petróleo de los niveles de estrés recientes. Esto creó una configuración mixta para los metales preciosos: la inflación energética más suave apoyó las esperanzas de una Reserva Federal menos agresiva, mientras que el menor riesgo geopolítico redujo la demanda de refugio seguro a corto plazo.
⚪ El oro y la plata ganaron en las primeras y medias partes de la semana a medida que los traders reaccionaron a las expectativas de la Fed, la sensibilidad del dólar y la presión inflacionaria en disminución. Hacia el final de la semana, la disminución de la prima de riesgo y la toma de ganancias pesaron sobre ambos mercados, con el oro retrocediendo y la plata cediendo después de su fuerza inicial.
🔵 La plata se mantuvo destacada porque lleva tanto impulso monetario como industrial. A diferencia del oro, que fue principalmente moldeado por el dólar, las perspectivas de la Fed y los flujos defensivos, la plata también obtuvo apoyo de la energía solar, la electrificación y la demanda manufacturera. Esto le ayudó a mostrar fuerza relativa en ciertos momentos, aunque la volatilidad se mantuvo alta.
🟠 En metales base, el cobre continuó destacándose. Los precios se mantuvieron cerca de niveles elevados, ya que la oferta ajustada, los inventarios más bajos y los riesgos de interrupción en las principales minas reforzaron la demanda a largo plazo de las redes eléctricas, vehículos eléctricos e infraestructura verde.
⚙️ El aluminio, el platino y otros metales industriales también encontraron apoyo de factores estructurales de oferta y demanda, pero el mercado siguió siendo desigual. El platino tiene una narrativa de déficit más clara, mientras que los metales más vinculados al ciclo de construcción de China aún requieren precaución.
📌 En general, del 15 al 20 de junio se destacó una clara división entre los metales. El oro y la plata fueron impulsados principalmente por flujos macroeconómicos y la descompresión de la prima geopolítica, mientras que el cobre y ciertos metales base se mantuvieron respaldados por restricciones de oferta, tendencias de inventario y demanda de transición energética.
#Metals $XAU $XAG $COPPER
Resumen del mercado global de metales del 15 al 20 de junio: el oro se enfría tras un fuerte rebote, mientras que el cobre mantiene su narrativa impulsada por la oferta
🟡 Los metales fueron volátiles esta semana, ya que los desarrollos entre EE.UU. e Irán aliviaron las preocupaciones en torno al estrecho de Ormuz y alejaron al petróleo de los niveles de estrés recientes. Esto creó una configuración mixta para los metales preciosos: la inflación energética más suave apoyó las esperanzas de una Reserva Federal menos agresiva, mientras que el menor riesgo geopolítico redujo la demanda de refugio seguro a corto plazo.
⚪ El oro y la plata ganaron en las primeras y medias partes de la semana a medida que los traders reaccionaron a las expectativas de la Fed, la sensibilidad del dólar y la presión inflacionaria en disminución. Hacia el final de la semana, la disminución de la prima de riesgo y la toma de ganancias pesaron sobre ambos mercados, con el oro retrocediendo y la plata cediendo después de su fuerza inicial.
🔵 La plata se mantuvo destacada porque lleva tanto impulso monetario como industrial. A diferencia del oro, que fue principalmente moldeado por el dólar, las perspectivas de la Fed y los flujos defensivos, la plata también obtuvo apoyo de la energía solar, la electrificación y la demanda manufacturera. Esto le ayudó a mostrar fuerza relativa en ciertos momentos, aunque la volatilidad se mantuvo alta.
🟠 En metales base, el cobre continuó destacándose. Los precios se mantuvieron cerca de niveles elevados, ya que la oferta ajustada, los inventarios más bajos y los riesgos de interrupción en las principales minas reforzaron la demanda a largo plazo de las redes eléctricas, vehículos eléctricos e infraestructura verde.
⚙️ El aluminio, el platino y otros metales industriales también encontraron apoyo de factores estructurales de oferta y demanda, pero el mercado siguió siendo desigual. El platino tiene una narrativa de déficit más clara, mientras que los metales más vinculados al ciclo de construcción de China aún requieren precaución.
📌 En general, del 15 al 20 de junio se destacó una clara división entre los metales. El oro y la plata fueron impulsados principalmente por flujos macroeconómicos y la descompresión de la prima geopolítica, mientras que el cobre y ciertos metales base se mantuvieron respaldados por restricciones de oferta, tendencias de inventario y demanda de transición energética.
#Metals $XAU $XAG $COPPER
🟡 Los metales fueron volátiles esta semana, ya que los desarrollos entre EE.UU. e Irán aliviaron las preocupaciones en torno al estrecho de Ormuz y alejaron al petróleo de los niveles de estrés recientes. Esto creó una configuración mixta para los metales preciosos: la inflación energética más suave apoyó las esperanzas de una Reserva Federal menos agresiva, mientras que el menor riesgo geopolítico redujo la demanda de refugio seguro a corto plazo.
⚪ El oro y la plata ganaron en las primeras y medias partes de la semana a medida que los traders reaccionaron a las expectativas de la Fed, la sensibilidad del dólar y la presión inflacionaria en disminución. Hacia el final de la semana, la disminución de la prima de riesgo y la toma de ganancias pesaron sobre ambos mercados, con el oro retrocediendo y la plata cediendo después de su fuerza inicial.
🔵 La plata se mantuvo destacada porque lleva tanto impulso monetario como industrial. A diferencia del oro, que fue principalmente moldeado por el dólar, las perspectivas de la Fed y los flujos defensivos, la plata también obtuvo apoyo de la energía solar, la electrificación y la demanda manufacturera. Esto le ayudó a mostrar fuerza relativa en ciertos momentos, aunque la volatilidad se mantuvo alta.
🟠 En metales base, el cobre continuó destacándose. Los precios se mantuvieron cerca de niveles elevados, ya que la oferta ajustada, los inventarios más bajos y los riesgos de interrupción en las principales minas reforzaron la demanda a largo plazo de las redes eléctricas, vehículos eléctricos e infraestructura verde.
⚙️ El aluminio, el platino y otros metales industriales también encontraron apoyo de factores estructurales de oferta y demanda, pero el mercado siguió siendo desigual. El platino tiene una narrativa de déficit más clara, mientras que los metales más vinculados al ciclo de construcción de China aún requieren precaución.
📌 En general, del 15 al 20 de junio se destacó una clara división entre los metales. El oro y la plata fueron impulsados principalmente por flujos macroeconómicos y la descompresión de la prima geopolítica, mientras que el cobre y ciertos metales base se mantuvieron respaldados por restricciones de oferta, tendencias de inventario y demanda de transición energética.
#Metals $XAU $XAG $COPPER
675
·
--
Alcista
Resumen del mercado global de metales: 3–8 de agosto de 2026
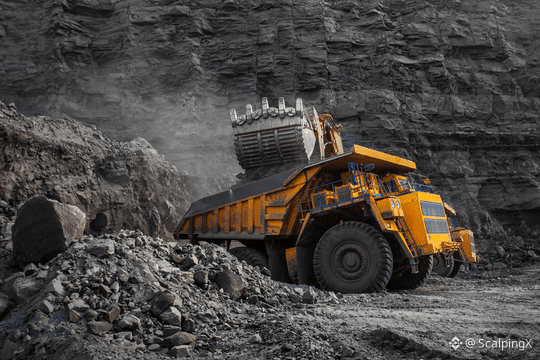
🥇 Los metales preciosos cerraron la semana con fuertes avances, liderados por el oro y la plata. El oro subió más de un 7% durante la semana, marcando una de sus mejores actuaciones semanales en meses, mientras que la plata lo superó y avanzó brevemente al rango de 63–64 USD/oz.
📉 El principal catalizador surgió al final de la semana tras unos datos de empleo en EE. UU. más débiles de lo esperado. Las nóminas de julio cayeron 23.000, mientras que las cifras anteriores también se revisaron bruscamente a la baja, reduciendo las expectativas de una nueva subida de tipos de la Fed en septiembre. Los rendimientos de los Treasury y el dólar estadounidense disminuyeron después de la publicación, brindando un apoyo directo al oro y la plata.
🏦 La demanda de los bancos centrales siguió aportando soporte estructural al oro. China añadió alrededor de 20 toneladas de oro a sus reservas en julio, equivalentes a unas 640.000 onzas, y el mayor incremento mensual desde finales de 2023. El PBOC ha extendido ahora su racha de compras de oro a 21 meses consecutivos.
⚙️ El platino y el paladio también avanzaron en la sesión final de la semana, aunque sus ganancias fueron más moderadas que las del oro y la plata. Entre los metales base, el cobre se mantuvo respaldado por inventarios físicos ajustados y riesgos de suministro, aunque la evolución del precio fue menos marcada que en los metales preciosos.
📊 Después del fuerte repunte, la atención la próxima semana se centrará en los datos de IPC de EE. UU. del 12 de agosto. Una inflación más débil de lo esperado podría mantener la presión sobre el dólar y los rendimientos de los Treasury, preservando un entorno favorable para los metales preciosos. Por el contrario, una inflación más fuerte podría provocar toma de ganancias tras el fuerte avance semanal.
#Metals $XAU $XAG $COPPER
Resumen del mercado global de metales: 3–8 de agosto de 2026
🥇 Los metales preciosos cerraron la semana con fuertes avances, liderados por el oro y la plata. El oro subió más de un 7% durante la semana, marcando una de sus mejores actuaciones semanales en meses, mientras que la plata lo superó y avanzó brevemente al rango de 63–64 USD/oz.
📉 El principal catalizador surgió al final de la semana tras unos datos de empleo en EE. UU. más débiles de lo esperado. Las nóminas de julio cayeron 23.000, mientras que las cifras anteriores también se revisaron bruscamente a la baja, reduciendo las expectativas de una nueva subida de tipos de la Fed en septiembre. Los rendimientos de los Treasury y el dólar estadounidense disminuyeron después de la publicación, brindando un apoyo directo al oro y la plata.
🏦 La demanda de los bancos centrales siguió aportando soporte estructural al oro. China añadió alrededor de 20 toneladas de oro a sus reservas en julio, equivalentes a unas 640.000 onzas, y el mayor incremento mensual desde finales de 2023. El PBOC ha extendido ahora su racha de compras de oro a 21 meses consecutivos.
⚙️ El platino y el paladio también avanzaron en la sesión final de la semana, aunque sus ganancias fueron más moderadas que las del oro y la plata. Entre los metales base, el cobre se mantuvo respaldado por inventarios físicos ajustados y riesgos de suministro, aunque la evolución del precio fue menos marcada que en los metales preciosos.
📊 Después del fuerte repunte, la atención la próxima semana se centrará en los datos de IPC de EE. UU. del 12 de agosto. Una inflación más débil de lo esperado podría mantener la presión sobre el dólar y los rendimientos de los Treasury, preservando un entorno favorable para los metales preciosos. Por el contrario, una inflación más fuerte podría provocar toma de ganancias tras el fuerte avance semanal.
#Metals $XAU $XAG $COPPER
🥇 Los metales preciosos cerraron la semana con fuertes avances, liderados por el oro y la plata. El oro subió más de un 7% durante la semana, marcando una de sus mejores actuaciones semanales en meses, mientras que la plata lo superó y avanzó brevemente al rango de 63–64 USD/oz.
📉 El principal catalizador surgió al final de la semana tras unos datos de empleo en EE. UU. más débiles de lo esperado. Las nóminas de julio cayeron 23.000, mientras que las cifras anteriores también se revisaron bruscamente a la baja, reduciendo las expectativas de una nueva subida de tipos de la Fed en septiembre. Los rendimientos de los Treasury y el dólar estadounidense disminuyeron después de la publicación, brindando un apoyo directo al oro y la plata.
🏦 La demanda de los bancos centrales siguió aportando soporte estructural al oro. China añadió alrededor de 20 toneladas de oro a sus reservas en julio, equivalentes a unas 640.000 onzas, y el mayor incremento mensual desde finales de 2023. El PBOC ha extendido ahora su racha de compras de oro a 21 meses consecutivos.
⚙️ El platino y el paladio también avanzaron en la sesión final de la semana, aunque sus ganancias fueron más moderadas que las del oro y la plata. Entre los metales base, el cobre se mantuvo respaldado por inventarios físicos ajustados y riesgos de suministro, aunque la evolución del precio fue menos marcada que en los metales preciosos.
📊 Después del fuerte repunte, la atención la próxima semana se centrará en los datos de IPC de EE. UU. del 12 de agosto. Una inflación más débil de lo esperado podría mantener la presión sobre el dólar y los rendimientos de los Treasury, preservando un entorno favorable para los metales preciosos. Por el contrario, una inflación más fuerte podría provocar toma de ganancias tras el fuerte avance semanal.
#Metals $XAU $XAG $COPPER
98
·
--
Alcista
Resumen del mercado global de metales para el 22–27 de junio de 2026 – La corrección se profundiza, pero los fundamentos a largo plazo siguen intactos
📉 El mercado global de metales registró una fuerte corrección la semana pasada, especialmente a mediados de semana, antes de un rebote técnico parcial hacia el final del periodo. Un USD más fuerte, datos de inflación de EE. UU. más intensos y un sentimiento más amplio de aversión al riesgo permitieron que la presión macro dominara las narrativas de corto plazo sobre oferta y demanda.
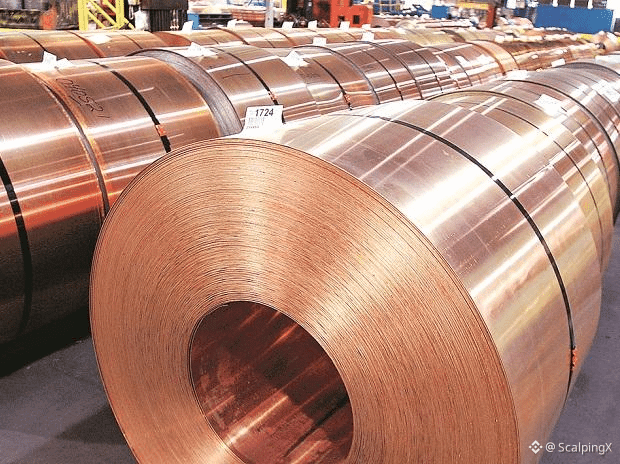
⚙️ Los metales industriales sufrieron presión cuando se deshizo el posicionamiento especulativo tras la fuerte subida anterior. El cobre siguió siendo el metal clave a vigilar, ya que su perspectiva de mediano a largo plazo aún está respaldada por déficits de oferta, electrificación, expansión de redes y la demanda de IA/centros de datos.
🏗️ El aluminio estuvo entre los peores desempeños después de romper por debajo de una zona de soporte importante. Esto reflejó la sensibilidad del mercado a las expectativas de crecimiento global, especialmente cuando las señales de demanda procedentes de China todavía no han mejorado de forma significativa.
🪙 En metales preciosos, el oro probó brevemente el nivel psicológico de 4.000 USD/oz antes de recuperarse hacia el final de la semana. Sin embargo, un USD fuerte, rendimientos reales más altos y las expectativas de una Fed más bien hawkish siguen limitando el potencial alcista de corto plazo.
🥈 La plata claramente superó a la baja al oro debido a su mayor exposición industrial y a una menor aversión al riesgo. Aunque la historia del déficit a largo plazo sigue siendo favorable, la fuerte caída semanal muestra que la plata puede ser más vulnerable durante los sell-offs impulsados por la macro.
📊 Las señales del mercado físico todavía no sugieren de forma clara un mercado de metales holgado. Los inventarios registrados más bajos en la LME y el aumento de los stocks sin orden (off-warrant) indican que la caída probablemente estuvo impulsada más por la presión macro y el posicionamiento que por una ruptura total en los fundamentos a largo plazo.
🔎 En el corto plazo, los metales seguirán siendo sensibles al USD, los rendimientos de EE. UU., los próximos datos de empleo e inflación y las señales de política desde China. La volatilidad puede mantenerse alta, pero los metales con historias de déficit de oferta más sólidas, especialmente el cobre, aún conservan una base más constructiva de mediano plazo.
#Metals $XAU $XAG $COPPER
Resumen del mercado global de metales para el 22–27 de junio de 2026 – La corrección se profundiza, pero los fundamentos a largo plazo siguen intactos
📉 El mercado global de metales registró una fuerte corrección la semana pasada, especialmente a mediados de semana, antes de un rebote técnico parcial hacia el final del periodo. Un USD más fuerte, datos de inflación de EE. UU. más intensos y un sentimiento más amplio de aversión al riesgo permitieron que la presión macro dominara las narrativas de corto plazo sobre oferta y demanda.
⚙️ Los metales industriales sufrieron presión cuando se deshizo el posicionamiento especulativo tras la fuerte subida anterior. El cobre siguió siendo el metal clave a vigilar, ya que su perspectiva de mediano a largo plazo aún está respaldada por déficits de oferta, electrificación, expansión de redes y la demanda de IA/centros de datos.
🏗️ El aluminio estuvo entre los peores desempeños después de romper por debajo de una zona de soporte importante. Esto reflejó la sensibilidad del mercado a las expectativas de crecimiento global, especialmente cuando las señales de demanda procedentes de China todavía no han mejorado de forma significativa.
🪙 En metales preciosos, el oro probó brevemente el nivel psicológico de 4.000 USD/oz antes de recuperarse hacia el final de la semana. Sin embargo, un USD fuerte, rendimientos reales más altos y las expectativas de una Fed más bien hawkish siguen limitando el potencial alcista de corto plazo.
🥈 La plata claramente superó a la baja al oro debido a su mayor exposición industrial y a una menor aversión al riesgo. Aunque la historia del déficit a largo plazo sigue siendo favorable, la fuerte caída semanal muestra que la plata puede ser más vulnerable durante los sell-offs impulsados por la macro.
📊 Las señales del mercado físico todavía no sugieren de forma clara un mercado de metales holgado. Los inventarios registrados más bajos en la LME y el aumento de los stocks sin orden (off-warrant) indican que la caída probablemente estuvo impulsada más por la presión macro y el posicionamiento que por una ruptura total en los fundamentos a largo plazo.
🔎 En el corto plazo, los metales seguirán siendo sensibles al USD, los rendimientos de EE. UU., los próximos datos de empleo e inflación y las señales de política desde China. La volatilidad puede mantenerse alta, pero los metales con historias de déficit de oferta más sólidas, especialmente el cobre, aún conservan una base más constructiva de mediano plazo.
#Metals $XAU $XAG $COPPER
📉 El mercado global de metales registró una fuerte corrección la semana pasada, especialmente a mediados de semana, antes de un rebote técnico parcial hacia el final del periodo. Un USD más fuerte, datos de inflación de EE. UU. más intensos y un sentimiento más amplio de aversión al riesgo permitieron que la presión macro dominara las narrativas de corto plazo sobre oferta y demanda.
⚙️ Los metales industriales sufrieron presión cuando se deshizo el posicionamiento especulativo tras la fuerte subida anterior. El cobre siguió siendo el metal clave a vigilar, ya que su perspectiva de mediano a largo plazo aún está respaldada por déficits de oferta, electrificación, expansión de redes y la demanda de IA/centros de datos.
🏗️ El aluminio estuvo entre los peores desempeños después de romper por debajo de una zona de soporte importante. Esto reflejó la sensibilidad del mercado a las expectativas de crecimiento global, especialmente cuando las señales de demanda procedentes de China todavía no han mejorado de forma significativa.
🪙 En metales preciosos, el oro probó brevemente el nivel psicológico de 4.000 USD/oz antes de recuperarse hacia el final de la semana. Sin embargo, un USD fuerte, rendimientos reales más altos y las expectativas de una Fed más bien hawkish siguen limitando el potencial alcista de corto plazo.
🥈 La plata claramente superó a la baja al oro debido a su mayor exposición industrial y a una menor aversión al riesgo. Aunque la historia del déficit a largo plazo sigue siendo favorable, la fuerte caída semanal muestra que la plata puede ser más vulnerable durante los sell-offs impulsados por la macro.
📊 Las señales del mercado físico todavía no sugieren de forma clara un mercado de metales holgado. Los inventarios registrados más bajos en la LME y el aumento de los stocks sin orden (off-warrant) indican que la caída probablemente estuvo impulsada más por la presión macro y el posicionamiento que por una ruptura total en los fundamentos a largo plazo.
🔎 En el corto plazo, los metales seguirán siendo sensibles al USD, los rendimientos de EE. UU., los próximos datos de empleo e inflación y las señales de política desde China. La volatilidad puede mantenerse alta, pero los metales con historias de déficit de oferta más sólidas, especialmente el cobre, aún conservan una base más constructiva de mediano plazo.
#Metals $XAU $XAG $COPPER
1
5.9k

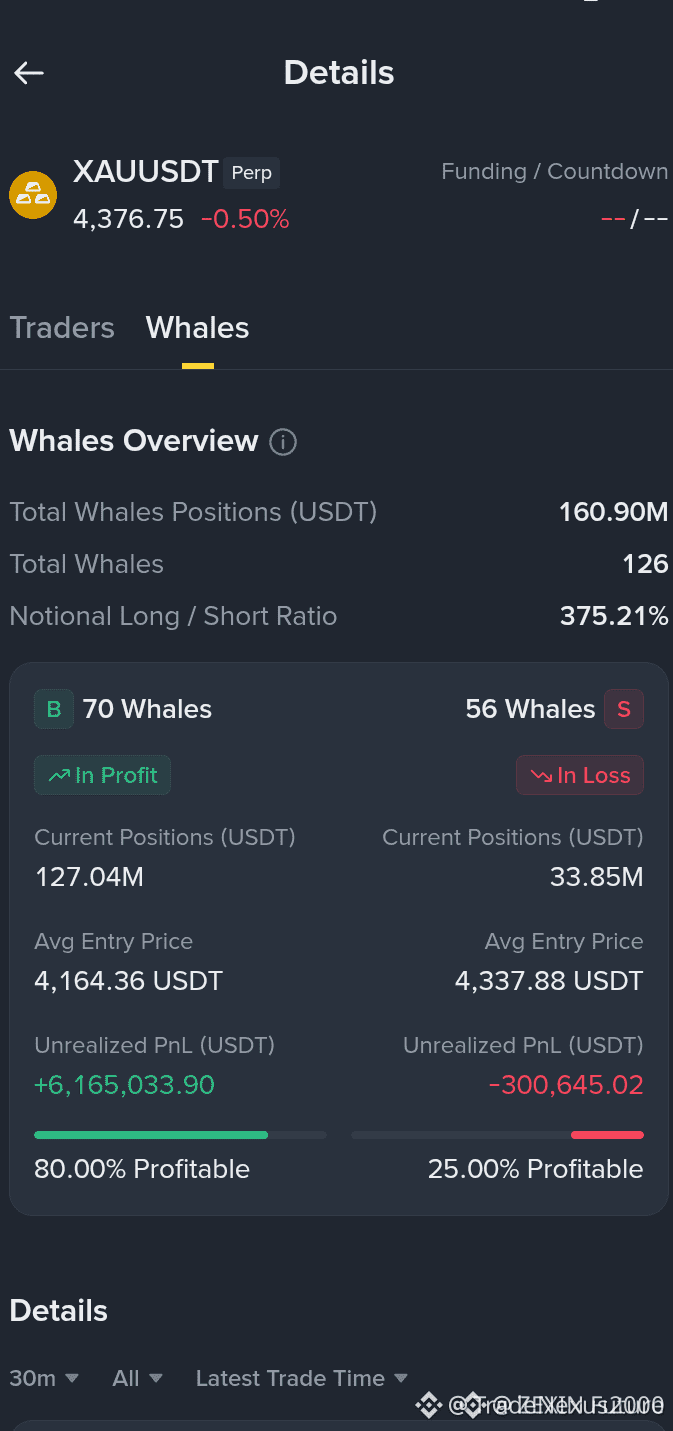
⚡ $XAU LONG IN PLAY AS SMART MONEY SHIELDS THE DEMAND ZONE! 🚀
Objetivo: 4460.00 🚀
Stop Loss: 4345.00 ⚠️
📌 El oro acaba de confirmar nuevamente su resiliencia: el precio defendió el nivel de 4345 mientras las instituciones absorbían en silencio la liquidez del retroceso por debajo. 📊 Ese ataque a stops seguido de un recobro inmediato es una acumulación de manual: vendedores atrapados debajo, combustible fresco apilado arriba.
💡 Con la invalidación en 4345 y 4460 por encima de una liquidez limpia, el camino de menor resistencia se inclina hacia el norte. Estas zonas tienden a defenderse con precisión una vez que la huella confirma. 💬 ¿Estás montando la estructura, o esperando una última purga antes de aumentar tamaño? 👇
⚠️ No es asesoramiento financiero. Gestiona siempre tu riesgo. 🛡️
🏷️ #XAU #GoldLong #SmartMoney #Metals #Breakout
🦈 🎯
⚡ $XAU LONG IN PLAY AS SMART MONEY SHIELDS THE DEMAND ZONE! 🚀
Objetivo: 4460.00 🚀
Stop Loss: 4345.00 ⚠️
📌 El oro acaba de confirmar nuevamente su resiliencia: el precio defendió el nivel de 4345 mientras las instituciones absorbían en silencio la liquidez del retroceso por debajo. 📊 Ese ataque a stops seguido de un recobro inmediato es una acumulación de manual: vendedores atrapados debajo, combustible fresco apilado arriba.
💡 Con la invalidación en 4345 y 4460 por encima de una liquidez limpia, el camino de menor resistencia se inclina hacia el norte. Estas zonas tienden a defenderse con precisión una vez que la huella confirma. 💬 ¿Estás montando la estructura, o esperando una última purga antes de aumentar tamaño? 👇
⚠️ No es asesoramiento financiero. Gestiona siempre tu riesgo. 🛡️
🏷️ #XAU #GoldLong #SmartMoney #Metals #Breakout
🦈 🎯
Objetivo: 4460.00 🚀
Stop Loss: 4345.00 ⚠️
📌 El oro acaba de confirmar nuevamente su resiliencia: el precio defendió el nivel de 4345 mientras las instituciones absorbían en silencio la liquidez del retroceso por debajo. 📊 Ese ataque a stops seguido de un recobro inmediato es una acumulación de manual: vendedores atrapados debajo, combustible fresco apilado arriba.
💡 Con la invalidación en 4345 y 4460 por encima de una liquidez limpia, el camino de menor resistencia se inclina hacia el norte. Estas zonas tienden a defenderse con precisión una vez que la huella confirma. 💬 ¿Estás montando la estructura, o esperando una última purga antes de aumentar tamaño? 👇
⚠️ No es asesoramiento financiero. Gestiona siempre tu riesgo. 🛡️
🏷️ #XAU #GoldLong #SmartMoney #Metals #Breakout
🦈 🎯
98

⚡ RUPTURAS DE PLATA $65 — EL RALLY DE LOS METALES ¡SOLO ACABA DE EMPEZAR! 🚀
Entrada: $65.00 ⚡
Objetivo: $70.00 🚀
Stop Loss: $64.20 ⚠️
📊 El metal blanco acaba de atravesar una fortaleza psicológica que aguantó durante semanas, y el impulso intradía con una ganancia del 2.66% me dice que los compradores de caídas están llevando el control. 🦈 Esto no es un repunte minorista: el peso del flujo institucional está presionando hacia abajo el lado de las ofertas, absorbiendo a cada vendedor que se interpone delante del tren.
💡 El impulso trae un viento de cola que hace que el oro refleje felizmente el movimiento en $4,360.96, con +0.46% intradía. Los metales vuelven a estar en el foco y, cuando el complejo de PM rota, los movimientos tienden a acumularse. 📌 $65 es la nueva línea en la arena: la pregunta es si la ruptura se mantiene o si hace una falsa antes de la pierna real más arriba. 💬 ¿Estás persiguiendo la ruptura o esperando el primer retroceso para recargar? 👇
⚠️ No es asesoramiento financiero. Siempre gestiona tu riesgo. 🛡️
🏷️ #Silver #XAGUSD #Metals #Breakout #PreciousMetals
🔥 🦈
⚡ RUPTURAS DE PLATA $65 — EL RALLY DE LOS METALES ¡SOLO ACABA DE EMPEZAR! 🚀
Entrada: $65.00 ⚡
Objetivo: $70.00 🚀
Stop Loss: $64.20 ⚠️
📊 El metal blanco acaba de atravesar una fortaleza psicológica que aguantó durante semanas, y el impulso intradía con una ganancia del 2.66% me dice que los compradores de caídas están llevando el control. 🦈 Esto no es un repunte minorista: el peso del flujo institucional está presionando hacia abajo el lado de las ofertas, absorbiendo a cada vendedor que se interpone delante del tren.
💡 El impulso trae un viento de cola que hace que el oro refleje felizmente el movimiento en $4,360.96, con +0.46% intradía. Los metales vuelven a estar en el foco y, cuando el complejo de PM rota, los movimientos tienden a acumularse. 📌 $65 es la nueva línea en la arena: la pregunta es si la ruptura se mantiene o si hace una falsa antes de la pierna real más arriba. 💬 ¿Estás persiguiendo la ruptura o esperando el primer retroceso para recargar? 👇
⚠️ No es asesoramiento financiero. Siempre gestiona tu riesgo. 🛡️
🏷️ #Silver #XAGUSD #Metals #Breakout #PreciousMetals
🔥 🦈
Entrada: $65.00 ⚡
Objetivo: $70.00 🚀
Stop Loss: $64.20 ⚠️
📊 El metal blanco acaba de atravesar una fortaleza psicológica que aguantó durante semanas, y el impulso intradía con una ganancia del 2.66% me dice que los compradores de caídas están llevando el control. 🦈 Esto no es un repunte minorista: el peso del flujo institucional está presionando hacia abajo el lado de las ofertas, absorbiendo a cada vendedor que se interpone delante del tren.
💡 El impulso trae un viento de cola que hace que el oro refleje felizmente el movimiento en $4,360.96, con +0.46% intradía. Los metales vuelven a estar en el foco y, cuando el complejo de PM rota, los movimientos tienden a acumularse. 📌 $65 es la nueva línea en la arena: la pregunta es si la ruptura se mantiene o si hace una falsa antes de la pierna real más arriba. 💬 ¿Estás persiguiendo la ruptura o esperando el primer retroceso para recargar? 👇
⚠️ No es asesoramiento financiero. Siempre gestiona tu riesgo. 🛡️
🏷️ #Silver #XAGUSD #Metals #Breakout #PreciousMetals
🔥 🦈
116

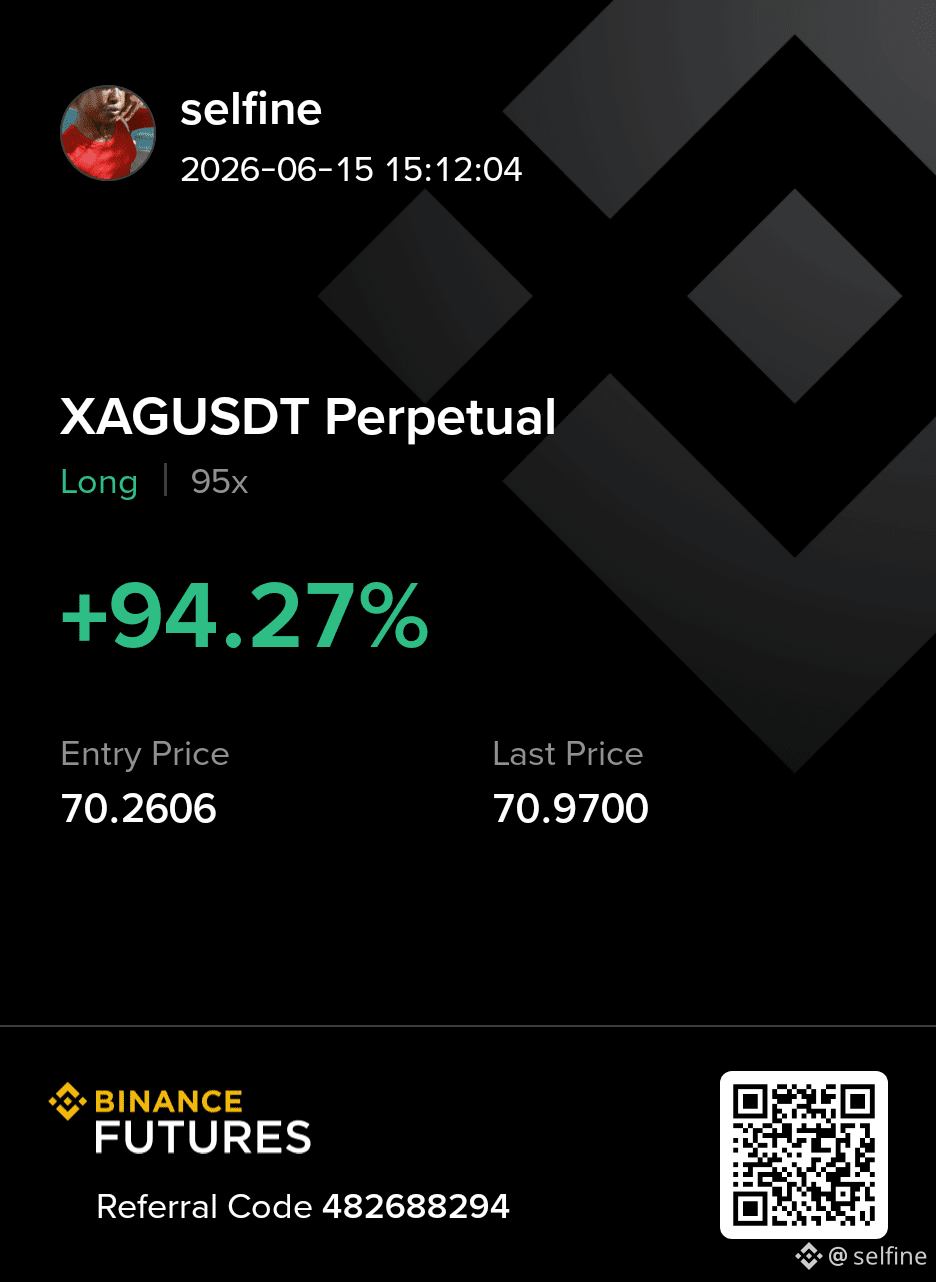
$XAG se ajusta a una zona de ruptura decisiva mientras la escasez de suministro y la demanda física superan los rendimientos más altos 🥈
Entrada: 76.9 🔥
Objetivo: 95 🚀
Stop Loss: 70 ⚠️
La plata está extendiendo su avance ya que una caída del 12% en el petróleo mejora el tape de commodities en general y se informa que 3.4 millones de onzas de producción anual de la instalación Kazzinc de Glencore se han sacado del mercado. El mercado ya está enfrentando un déficit proyectado de 215 millones de onzas en 2026, mientras que las entregas de COMEX de 24.645 millones de onzas en mayo subrayan la demanda física persistente. El precio se mantiene por encima de la base de $70, y la compresión de ocho semanas entre aproximadamente $70 y $80 sigue estrechándose hacia el ápice del cuña.
Lo que el mercado está pasando por alto es que esto ya no es solo una historia de gráficos. La venta de ETFs minoristas puede estar creando flujos visibles de salida, pero el flujo de órdenes subyacente aún refleja la absorción de suministro en las caídas, no la distribución. Con los rendimientos elevados, la plata debería haber estado más débil. El hecho de que no lo esté sugiere que los compradores institucionales están inclinándose hacia la escasez en lugar de perseguir el impulso. Una ruptura limpia por encima de $80 probablemente forzaría una cobertura de posiciones cortas y una re-hedging sistemática, abriendo el camino hacia la banda de $95 a $104 más rápido de lo que la mayoría espera.
No es asesoramiento financiero. Solo para fines informativos.
#Silver #XAG #Comex #Metals
{future}(XAGUSDT)
$XAG se ajusta a una zona de ruptura decisiva mientras la escasez de suministro y la demanda física superan los rendimientos más altos 🥈
Entrada: 76.9 🔥
Objetivo: 95 🚀
Stop Loss: 70 ⚠️
La plata está extendiendo su avance ya que una caída del 12% en el petróleo mejora el tape de commodities en general y se informa que 3.4 millones de onzas de producción anual de la instalación Kazzinc de Glencore se han sacado del mercado. El mercado ya está enfrentando un déficit proyectado de 215 millones de onzas en 2026, mientras que las entregas de COMEX de 24.645 millones de onzas en mayo subrayan la demanda física persistente. El precio se mantiene por encima de la base de $70, y la compresión de ocho semanas entre aproximadamente $70 y $80 sigue estrechándose hacia el ápice del cuña.
Lo que el mercado está pasando por alto es que esto ya no es solo una historia de gráficos. La venta de ETFs minoristas puede estar creando flujos visibles de salida, pero el flujo de órdenes subyacente aún refleja la absorción de suministro en las caídas, no la distribución. Con los rendimientos elevados, la plata debería haber estado más débil. El hecho de que no lo esté sugiere que los compradores institucionales están inclinándose hacia la escasez en lugar de perseguir el impulso. Una ruptura limpia por encima de $80 probablemente forzaría una cobertura de posiciones cortas y una re-hedging sistemática, abriendo el camino hacia la banda de $95 a $104 más rápido de lo que la mayoría espera.
No es asesoramiento financiero. Solo para fines informativos.
#Silver #XAG #Comex #Metals
Entrada: 76.9 🔥
Objetivo: 95 🚀
Stop Loss: 70 ⚠️
La plata está extendiendo su avance ya que una caída del 12% en el petróleo mejora el tape de commodities en general y se informa que 3.4 millones de onzas de producción anual de la instalación Kazzinc de Glencore se han sacado del mercado. El mercado ya está enfrentando un déficit proyectado de 215 millones de onzas en 2026, mientras que las entregas de COMEX de 24.645 millones de onzas en mayo subrayan la demanda física persistente. El precio se mantiene por encima de la base de $70, y la compresión de ocho semanas entre aproximadamente $70 y $80 sigue estrechándose hacia el ápice del cuña.
Lo que el mercado está pasando por alto es que esto ya no es solo una historia de gráficos. La venta de ETFs minoristas puede estar creando flujos visibles de salida, pero el flujo de órdenes subyacente aún refleja la absorción de suministro en las caídas, no la distribución. Con los rendimientos elevados, la plata debería haber estado más débil. El hecho de que no lo esté sugiere que los compradores institucionales están inclinándose hacia la escasez en lugar de perseguir el impulso. Una ruptura limpia por encima de $80 probablemente forzaría una cobertura de posiciones cortas y una re-hedging sistemática, abriendo el camino hacia la banda de $95 a $104 más rápido de lo que la mayoría espera.
No es asesoramiento financiero. Solo para fines informativos.
#Silver #XAG #Comex #Metals
246

$XAG se ajusta a una zona de ruptura decisiva a medida que el shock de oferta y la demanda física superan los rendimientos más altos 🥈
Entrada: 76.9 🔥
Objetivo: 95 🚀
Stop Loss: 70 ⚠️
La plata sigue extendiendo su avance a medida que una caída del 12% en el petróleo mejora el tape de materias primas en general y se informa que 3.4 millones de onzas de producción anual de la instalación Kazzinc de Glencore se retiran del mercado. El mercado ya está enfrentando un déficit proyectado de 215 millones de onzas en 2026, mientras que las entregas de COMEX de 24.645 millones de onzas en mayo subrayan la demanda física persistente. El precio se mantiene por encima de la base de $70, y la compresión de ocho semanas entre aproximadamente $70 y $80 sigue estrechándose hacia el vértice del cuña.
Lo que el mercado está pasando por alto es que esto ya no es solo una historia de velas. La venta de ETF minoristas puede estar creando salidas visibles, pero el flujo de órdenes subyacente aún refleja la absorción de oferta en los retrocesos, no distribución. Con los rendimientos elevados, la plata debería haber estado más débil. El hecho de que no lo esté sugiere que los compradores institucionales se están inclinando hacia la escasez en lugar de seguir la tendencia. Un quiebre limpio por encima de $80 probablemente forzaría una cobertura sistemática de cortos, abriendo el camino hacia la banda de $95 a $104 más rápido de lo que la mayoría espera.
No es asesoramiento financiero. Solo para fines informativos.
#Silver #XAG #Comex #Metals
{future}(XAGUSDT)
$XAG se ajusta a una zona de ruptura decisiva a medida que el shock de oferta y la demanda física superan los rendimientos más altos 🥈
Entrada: 76.9 🔥
Objetivo: 95 🚀
Stop Loss: 70 ⚠️
La plata sigue extendiendo su avance a medida que una caída del 12% en el petróleo mejora el tape de materias primas en general y se informa que 3.4 millones de onzas de producción anual de la instalación Kazzinc de Glencore se retiran del mercado. El mercado ya está enfrentando un déficit proyectado de 215 millones de onzas en 2026, mientras que las entregas de COMEX de 24.645 millones de onzas en mayo subrayan la demanda física persistente. El precio se mantiene por encima de la base de $70, y la compresión de ocho semanas entre aproximadamente $70 y $80 sigue estrechándose hacia el vértice del cuña.
Lo que el mercado está pasando por alto es que esto ya no es solo una historia de velas. La venta de ETF minoristas puede estar creando salidas visibles, pero el flujo de órdenes subyacente aún refleja la absorción de oferta en los retrocesos, no distribución. Con los rendimientos elevados, la plata debería haber estado más débil. El hecho de que no lo esté sugiere que los compradores institucionales se están inclinando hacia la escasez en lugar de seguir la tendencia. Un quiebre limpio por encima de $80 probablemente forzaría una cobertura sistemática de cortos, abriendo el camino hacia la banda de $95 a $104 más rápido de lo que la mayoría espera.
No es asesoramiento financiero. Solo para fines informativos.
#Silver #XAG #Comex #Metals
Entrada: 76.9 🔥
Objetivo: 95 🚀
Stop Loss: 70 ⚠️
La plata sigue extendiendo su avance a medida que una caída del 12% en el petróleo mejora el tape de materias primas en general y se informa que 3.4 millones de onzas de producción anual de la instalación Kazzinc de Glencore se retiran del mercado. El mercado ya está enfrentando un déficit proyectado de 215 millones de onzas en 2026, mientras que las entregas de COMEX de 24.645 millones de onzas en mayo subrayan la demanda física persistente. El precio se mantiene por encima de la base de $70, y la compresión de ocho semanas entre aproximadamente $70 y $80 sigue estrechándose hacia el vértice del cuña.
Lo que el mercado está pasando por alto es que esto ya no es solo una historia de velas. La venta de ETF minoristas puede estar creando salidas visibles, pero el flujo de órdenes subyacente aún refleja la absorción de oferta en los retrocesos, no distribución. Con los rendimientos elevados, la plata debería haber estado más débil. El hecho de que no lo esté sugiere que los compradores institucionales se están inclinando hacia la escasez en lugar de seguir la tendencia. Un quiebre limpio por encima de $80 probablemente forzaría una cobertura sistemática de cortos, abriendo el camino hacia la banda de $95 a $104 más rápido de lo que la mayoría espera.
No es asesoramiento financiero. Solo para fines informativos.
#Silver #XAG #Comex #Metals
164

·
--
Alcista
🌎 El ETF de Metales y Minería (XME) está ganando impulso. A medida que la demanda por metales sigue creciendo, este fondo cotizado en bolsa está atrayendo atención significativa de los traders.
El XME se enfoca en empresas involucradas en la extracción y producción de metales ($XAU $XAG ), posicionándose como un jugador clave en el mercado en expansión.
Para más info, sigue. $ALLO
{future}(XAUTUSDT)
{spot}(ALLOUSDT)
{future}(XAGUSDT)
#ETFs #Metals #GENIUSBinanceHODLer #bullish #$9BillionBitcoinOptionsExpireToday
🌎 El ETF de Metales y Minería (XME) está ganando impulso. A medida que la demanda por metales sigue creciendo, este fondo cotizado en bolsa está atrayendo atención significativa de los traders.
El XME se enfoca en empresas involucradas en la extracción y producción de metales ($XAU $XAG ), posicionándose como un jugador clave en el mercado en expansión.
Para más info, sigue. $ALLO
#ETFs #Metals #GENIUSBinanceHODLer #bullish #$9BillionBitcoinOptionsExpireToday
El XME se enfoca en empresas involucradas en la extracción y producción de metales ($XAU $XAG ), posicionándose como un jugador clave en el mercado en expansión.
Para más info, sigue. $ALLO
#ETFs #Metals #GENIUSBinanceHODLer #bullish #$9BillionBitcoinOptionsExpireToday
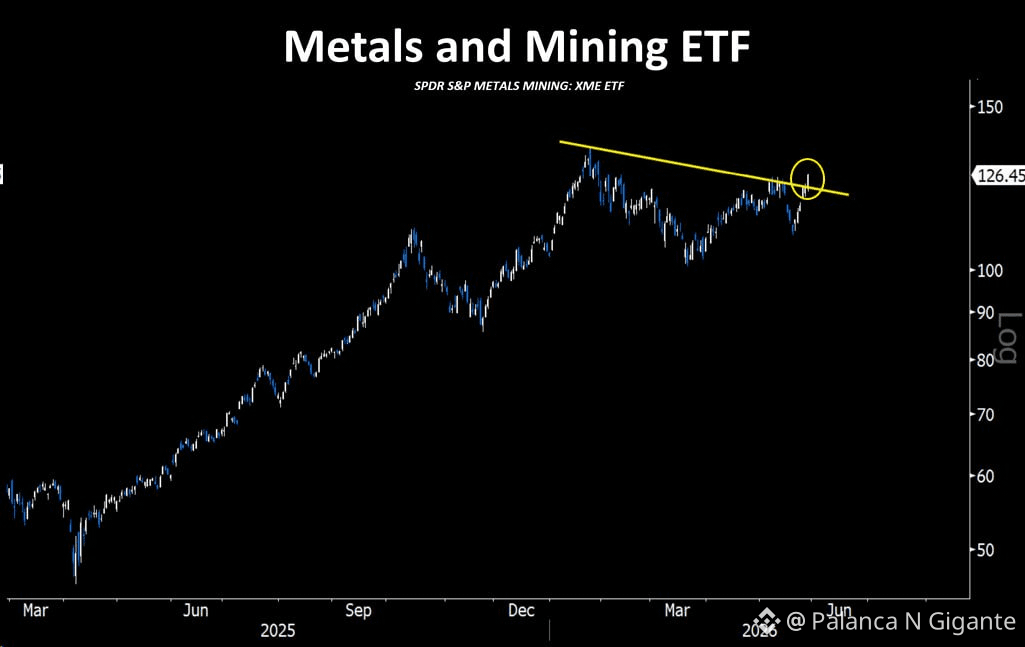
133
🚨 $XAU VENTANA CORTA SE ABRE — ESCALPERS, ESTE MOVIMIENTO TIENE HUELLAS POR TODOS LADOS 🔻
🦈 La demanda refugio está perdiendo el control. El rally del oro está chocando contra un muro de toma de beneficios, y los vendedores salen de las sombras con munición nueva. Esto no mata una tendencia — es un golpe táctico contra un impulso sobreextendido.
📊 La estructura diaria muestra máximos más bajos mientras el volumen se adelgaza en cada subida. Esa es la firma clásica de un rally en retirada: los compradores están agotados, y el primer barrido real de liquidez podría desencadenar una cascada. Para un pequeño scalp corto, el timing lo es todo: espera el primer rechazo desde el último máximo del swing, y luego monta el retroceso.
💡 La clave es respetar el stop — esto es un scalp, no un short de convicción. Mantenlo ajustado, toma ganancias rápido y no dejes que una operación ganadora se convierta en una espera por revancha. 💬 ¿Estás bajando el oro aquí, o esperando una entrada más limpia por debajo del último mínimo? 👇
⚠️ No es asesoramiento financiero. Gestiona siempre tu riesgo. 🛡️
🏷️ #XAU #GoldScalp #ShortSetup #Trading #Metals
🐻 💣
🚨 $XAU VENTANA CORTA SE ABRE — ESCALPERS, ESTE MOVIMIENTO TIENE HUELLAS POR TODOS LADOS 🔻
🦈 La demanda refugio está perdiendo el control. El rally del oro está chocando contra un muro de toma de beneficios, y los vendedores salen de las sombras con munición nueva. Esto no mata una tendencia — es un golpe táctico contra un impulso sobreextendido.
📊 La estructura diaria muestra máximos más bajos mientras el volumen se adelgaza en cada subida. Esa es la firma clásica de un rally en retirada: los compradores están agotados, y el primer barrido real de liquidez podría desencadenar una cascada. Para un pequeño scalp corto, el timing lo es todo: espera el primer rechazo desde el último máximo del swing, y luego monta el retroceso.
💡 La clave es respetar el stop — esto es un scalp, no un short de convicción. Mantenlo ajustado, toma ganancias rápido y no dejes que una operación ganadora se convierta en una espera por revancha. 💬 ¿Estás bajando el oro aquí, o esperando una entrada más limpia por debajo del último mínimo? 👇
⚠️ No es asesoramiento financiero. Gestiona siempre tu riesgo. 🛡️
🏷️ #XAU #GoldScalp #ShortSetup #Trading #Metals
🐻 💣
🦈 La demanda refugio está perdiendo el control. El rally del oro está chocando contra un muro de toma de beneficios, y los vendedores salen de las sombras con munición nueva. Esto no mata una tendencia — es un golpe táctico contra un impulso sobreextendido.
📊 La estructura diaria muestra máximos más bajos mientras el volumen se adelgaza en cada subida. Esa es la firma clásica de un rally en retirada: los compradores están agotados, y el primer barrido real de liquidez podría desencadenar una cascada. Para un pequeño scalp corto, el timing lo es todo: espera el primer rechazo desde el último máximo del swing, y luego monta el retroceso.
💡 La clave es respetar el stop — esto es un scalp, no un short de convicción. Mantenlo ajustado, toma ganancias rápido y no dejes que una operación ganadora se convierta en una espera por revancha. 💬 ¿Estás bajando el oro aquí, o esperando una entrada más limpia por debajo del último mínimo? 👇
⚠️ No es asesoramiento financiero. Gestiona siempre tu riesgo. 🛡️
🏷️ #XAU #GoldScalp #ShortSetup #Trading #Metals
🐻 💣
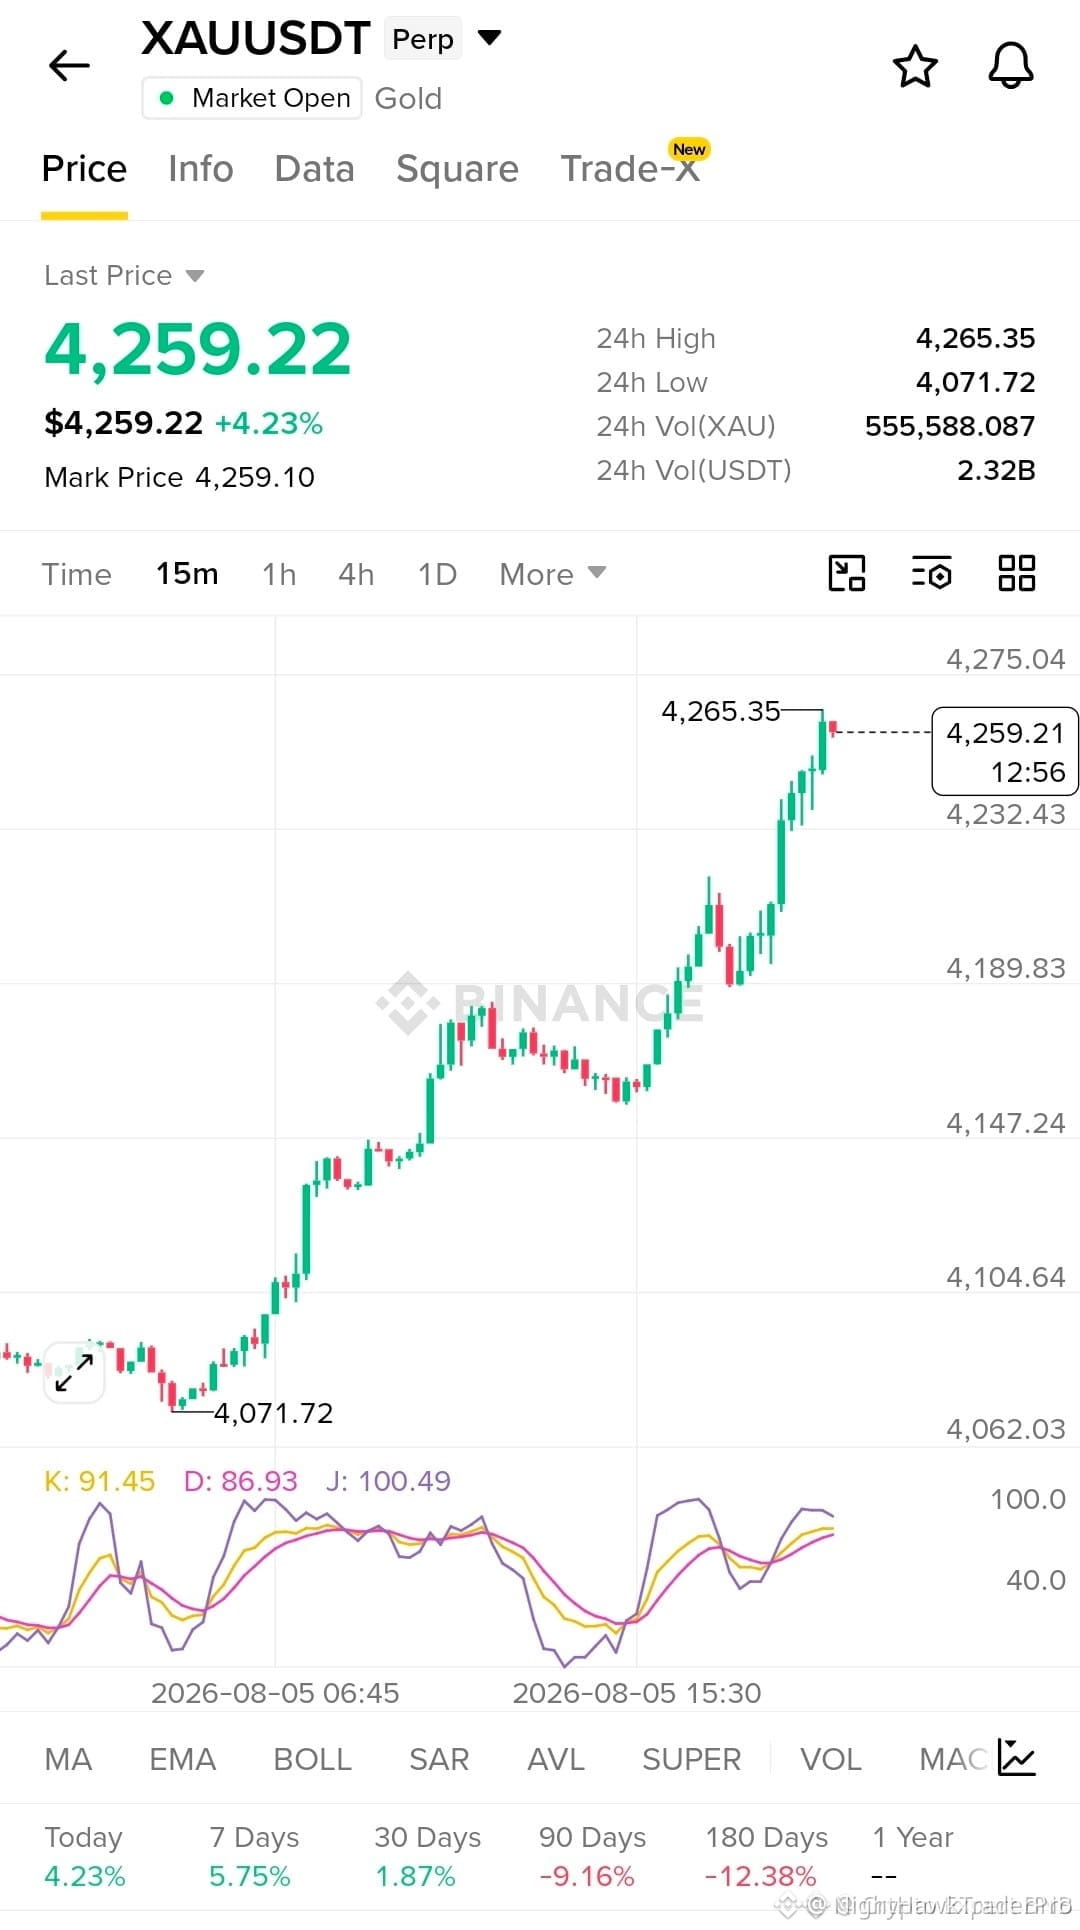
133
Inicia sesión para explorar más contenidos
Únete a usuarios globales de criptomonedas en Binance Square
⚡️ Obtén información útil y actualizada sobre criptos.
💬 Avalado por el mayor exchange de criptomonedas en el mundo.
👍 Descubre perspectivas reales de creadores verificados.
Email/número de teléfono
Temas populares
1
#USAugustPPIRisesLessThanExpected
60,222 vistas
882 están debatiendo
2
#SECApprovesNasdaqTexasCommodityTrustRule
32,557 vistas
622 están debatiendo
3
#ECBRaisesRatesSecondTimeTo2.5%
28,740 vistas
447 están debatiendo
4
#USContinuingJoblessClaims1.774M
38,144 vistas
540 están debatiendo
5
#USAugustPPIYoYRisesTo5.4%
35,382 vistas
411 están debatiendo
6
#AppleDebutsFoldablePhone
115,051 vistas
1,581 están debatiendo
7
#TSMCAugustRevenueUp53.3%YoY
28,052 vistas
563 están debatiendo
8
#IranSaysReadyToEscalateWarWithUS
40,986 vistas
547 están debatiendo
9
#EUExtendsCentralContactPointToCASPs
34,894 vistas
555 están debatiendo
10
#US10YTreasuryYieldHitsHighestSinceNov2023
74,581 vistas
867 están debatiendo