
ZIV OREN
12.6k Posts

ZIV OREN
 Square Verified
Report
Block User
Energy can't be faked | Sharp mind, Calm Soul. KITE_539271
Open Trade
Occasional Trader
1.4 Years
280 Following
34.3K+ Followers
29.8K+ Liked
Posts
Portfolio
All
Quotes
Live
·
--
Bullish
🚨 **TRUMP MEDIA'S BITCOIN MOVES RAISE BIG QUESTIONS!**
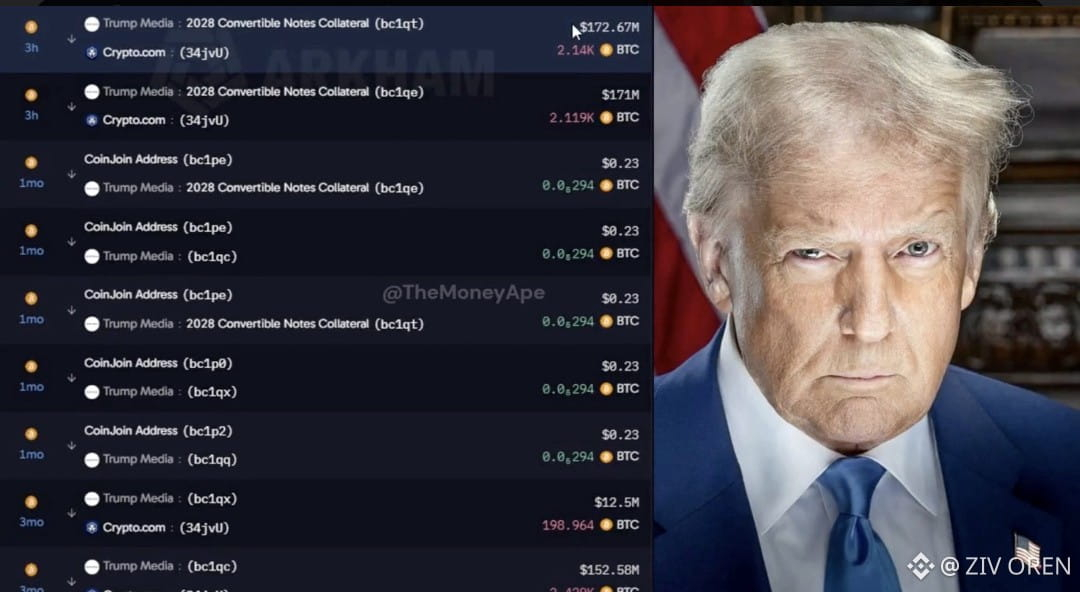
On November 5, Trump Media $DJT reportedly transferred approximately **4,259 BTC** to Crypto.com, representing nearly 30% of its reported Bitcoin holdings.
The timing has caught the market's attention, especially amid growing political scrutiny of the Trump family's crypto business.
Is this simply a treasury move, or could something bigger be happening?
**Markets are watching closely.** 👀
#Bitcoin #BTC #TrumpMedia #Crypto
🚨 **TRUMP MEDIA'S BITCOIN MOVES RAISE BIG QUESTIONS!**
On November 5, Trump Media $DJT reportedly transferred approximately **4,259 BTC** to Crypto.com, representing nearly 30% of its reported Bitcoin holdings.
The timing has caught the market's attention, especially amid growing political scrutiny of the Trump family's crypto business.
Is this simply a treasury move, or could something bigger be happening?
**Markets are watching closely.** 👀
#Bitcoin #BTC #TrumpMedia #Crypto
On November 5, Trump Media $DJT reportedly transferred approximately **4,259 BTC** to Crypto.com, representing nearly 30% of its reported Bitcoin holdings.
The timing has caught the market's attention, especially amid growing political scrutiny of the Trump family's crypto business.
Is this simply a treasury move, or could something bigger be happening?
**Markets are watching closely.** 👀
#Bitcoin #BTC #TrumpMedia #Crypto
1
1
148
·
--
Bullish
🔥 US JOBS MARKET DELIVERS A MAJOR SURPRISE!
Unemployment drops to 4.1%, beating the 4.2% forecast, while payrolls add 165K jobs versus just 65K expected!
A stronger labor market could push the Fed to keep rates higher for longer, putting pressure on rate-cut expectations.
👀 Now the big question: What happens next for Bitcoin, crypto, and the US dollar?
$BTC $UAI $ONE
{spot}(BTCUSDT)
#JobsReportRaisesHikeOdds
🔥 US JOBS MARKET DELIVERS A MAJOR SURPRISE!
Unemployment drops to 4.1%, beating the 4.2% forecast, while payrolls add 165K jobs versus just 65K expected!
A stronger labor market could push the Fed to keep rates higher for longer, putting pressure on rate-cut expectations.
👀 Now the big question: What happens next for Bitcoin, crypto, and the US dollar?
$BTC $UAI $ONE
#JobsReportRaisesHikeOdds
Unemployment drops to 4.1%, beating the 4.2% forecast, while payrolls add 165K jobs versus just 65K expected!
A stronger labor market could push the Fed to keep rates higher for longer, putting pressure on rate-cut expectations.
👀 Now the big question: What happens next for Bitcoin, crypto, and the US dollar?
$BTC $UAI $ONE
#JobsReportRaisesHikeOdds

1
64
·
--
Bullish
$AIO SURGES 7.19% — BULLS ARE TAKING CONTROL!
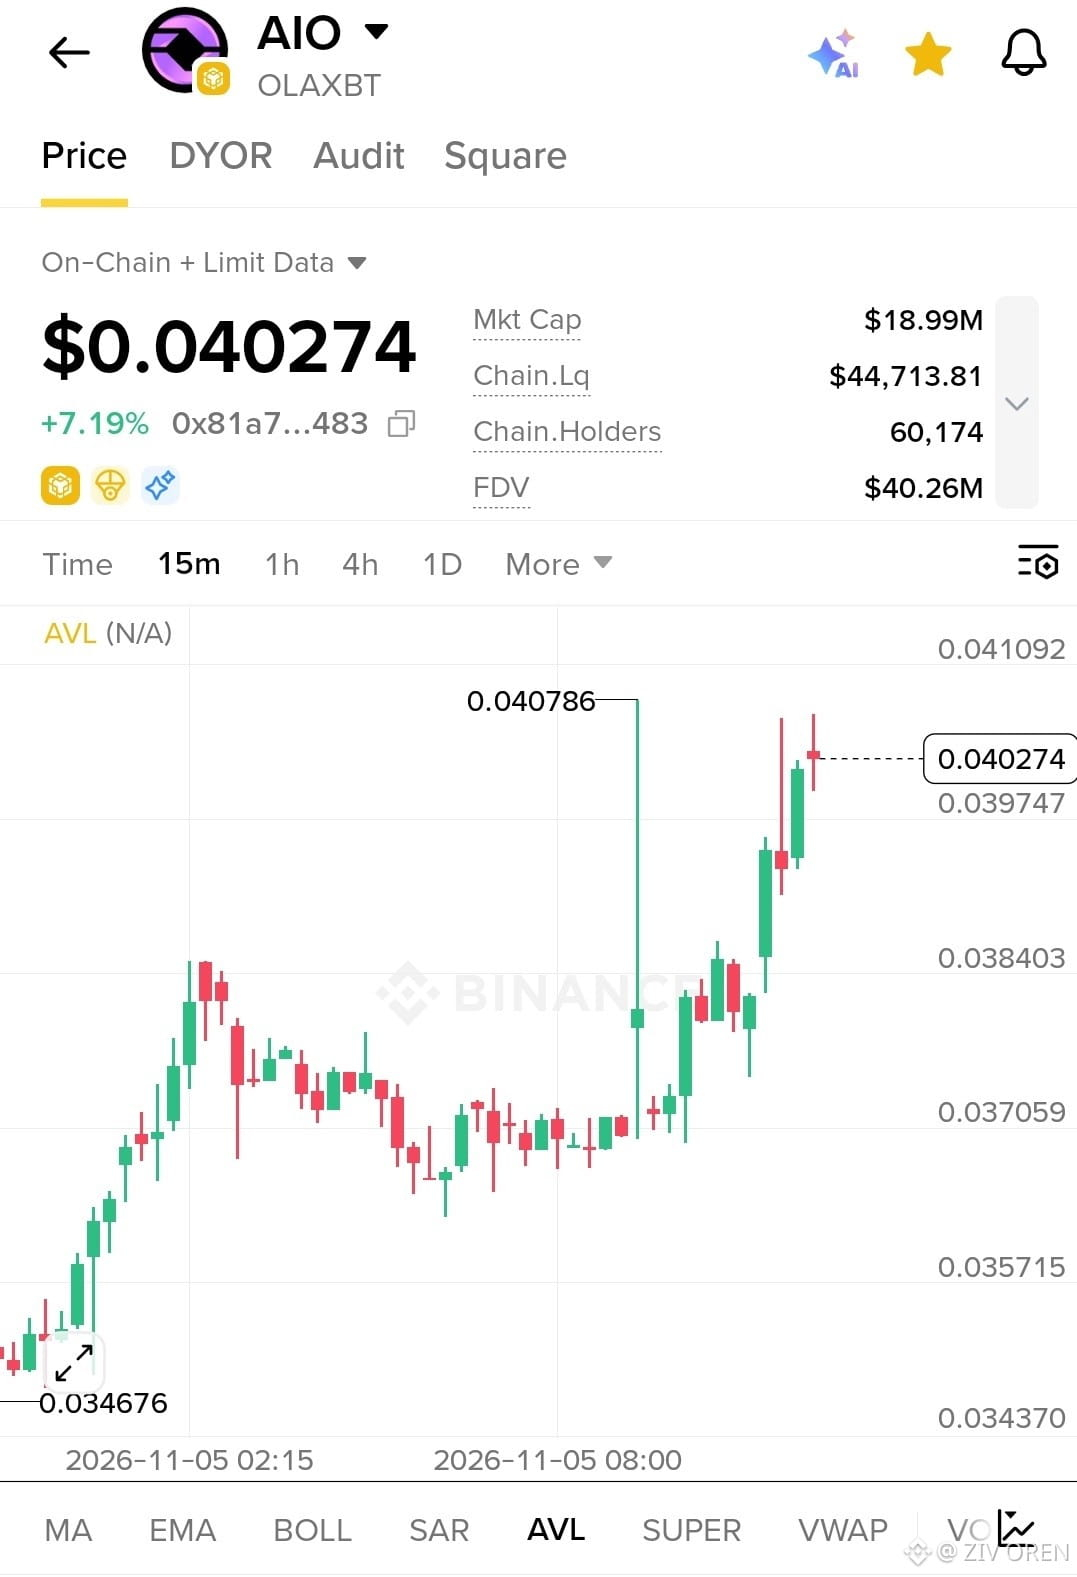
AIO is showing strong bullish momentum, climbing to $0.040274 after breaking above its previous consolidation zone. The chart shows a powerful upward move toward $0.040786, while market capitalization reaches $18.99M and on-chain liquidity stands at $44,713.81.
The 15-minute chart shows consecutive bullish candles and increasing buying pressure. A breakout above $0.040786 could open the door to further upside, while $0.039747 is an important near-term support.
Is AIO preparing for its next breakout?
Momentum is building, and the next resistance test could be crucial. Watch $AIO closely!
$AIO SURGES 7.19% — BULLS ARE TAKING CONTROL!
AIO is showing strong bullish momentum, climbing to $0.040274 after breaking above its previous consolidation zone. The chart shows a powerful upward move toward $0.040786, while market capitalization reaches $18.99M and on-chain liquidity stands at $44,713.81.
The 15-minute chart shows consecutive bullish candles and increasing buying pressure. A breakout above $0.040786 could open the door to further upside, while $0.039747 is an important near-term support.
Is AIO preparing for its next breakout?
Momentum is building, and the next resistance test could be crucial. Watch $AIO closely!
AIO is showing strong bullish momentum, climbing to $0.040274 after breaking above its previous consolidation zone. The chart shows a powerful upward move toward $0.040786, while market capitalization reaches $18.99M and on-chain liquidity stands at $44,713.81.
The 15-minute chart shows consecutive bullish candles and increasing buying pressure. A breakout above $0.040786 could open the door to further upside, while $0.039747 is an important near-term support.
Is AIO preparing for its next breakout?
Momentum is building, and the next resistance test could be crucial. Watch $AIO closely!
326
·
--
Bullish
$DJTB CRASHES 18.38% — SELLING PRESSURE WIPES OUT THE GAINS!
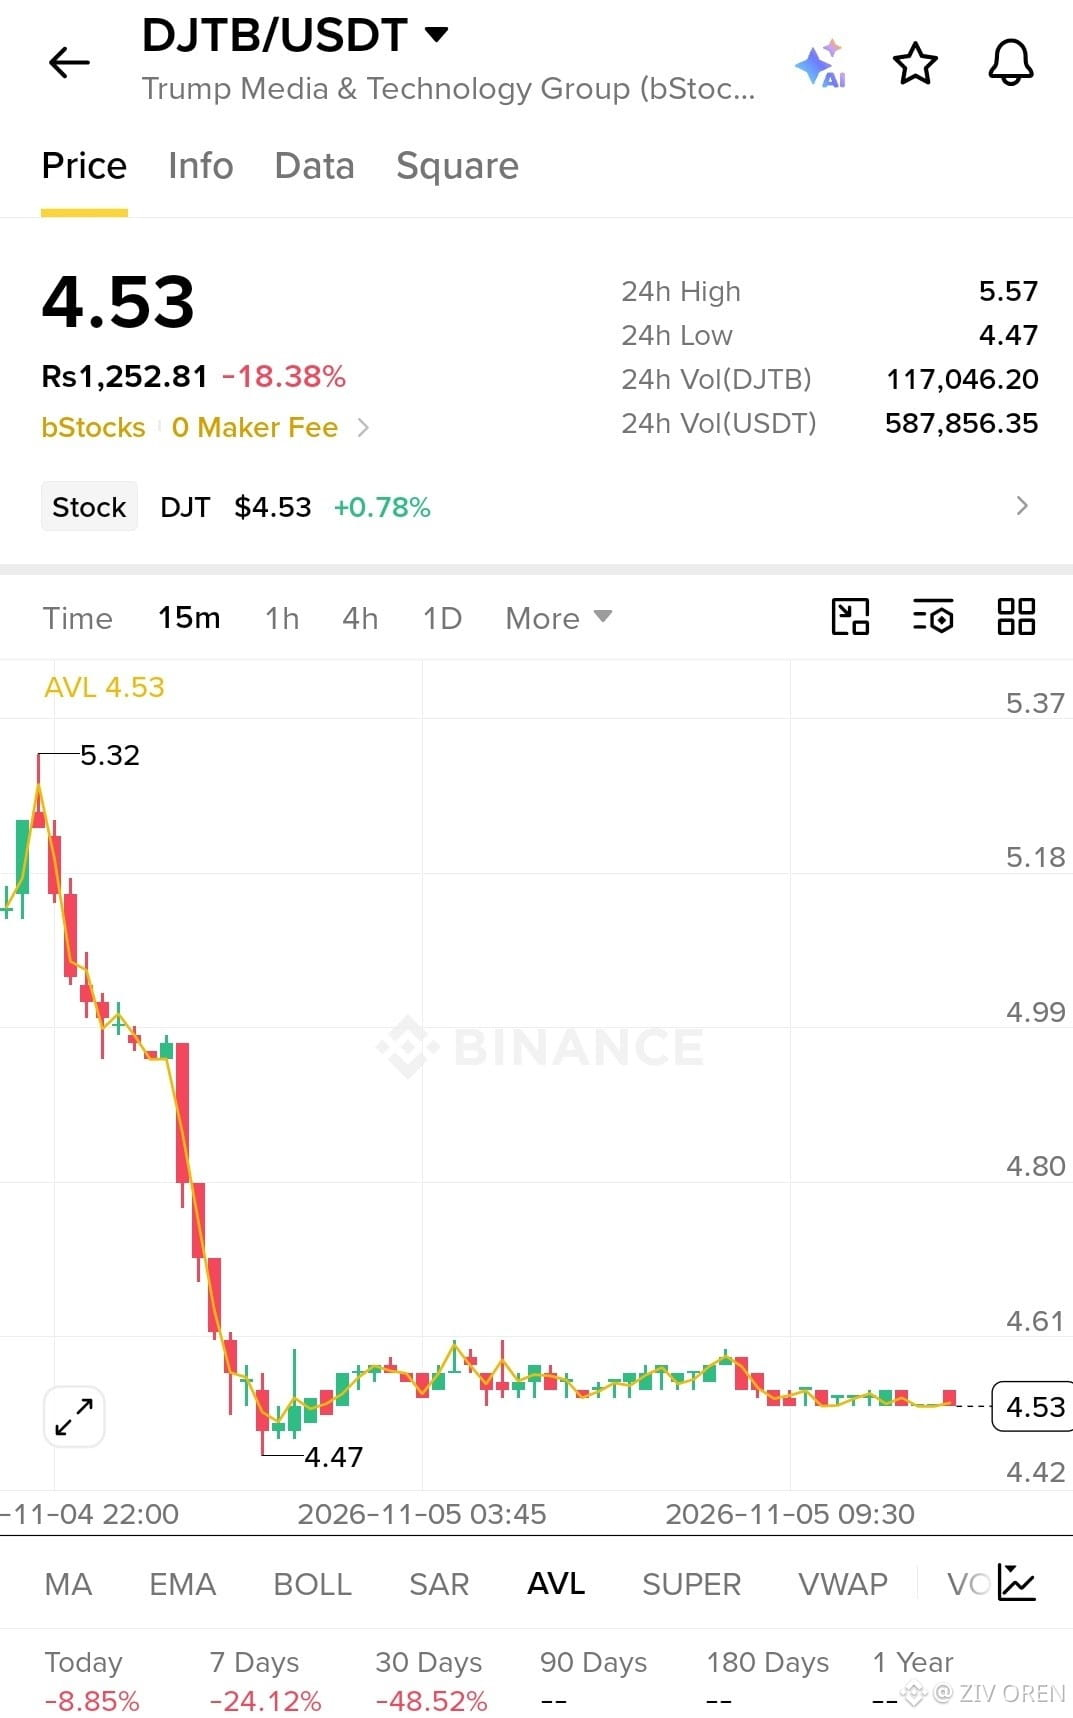
Trump Media & Technology Group (DJTB) has plunged to $4.53, falling from a 24-hour high of $5.57 to a low of $4.47. 24-hour trading volume stands at 117,046 DJTB, worth approximately $587,856 USDT.
The 15-minute chart shows a brutal sell-off followed by sideways consolidation near the lows. Buyers are struggling to regain momentum, with $4.61 as immediate resistance and $4.47 as critical support.
Will DJTB finally recover, or are sellers preparing another breakdown?
The next move around $4.47 could determine its short-term direction. Watch closely!
$DJTB CRASHES 18.38% — SELLING PRESSURE WIPES OUT THE GAINS!
Trump Media & Technology Group (DJTB) has plunged to $4.53, falling from a 24-hour high of $5.57 to a low of $4.47. 24-hour trading volume stands at 117,046 DJTB, worth approximately $587,856 USDT.
The 15-minute chart shows a brutal sell-off followed by sideways consolidation near the lows. Buyers are struggling to regain momentum, with $4.61 as immediate resistance and $4.47 as critical support.
Will DJTB finally recover, or are sellers preparing another breakdown?
The next move around $4.47 could determine its short-term direction. Watch closely!
Trump Media & Technology Group (DJTB) has plunged to $4.53, falling from a 24-hour high of $5.57 to a low of $4.47. 24-hour trading volume stands at 117,046 DJTB, worth approximately $587,856 USDT.
The 15-minute chart shows a brutal sell-off followed by sideways consolidation near the lows. Buyers are struggling to regain momentum, with $4.61 as immediate resistance and $4.47 as critical support.
Will DJTB finally recover, or are sellers preparing another breakdown?
The next move around $4.47 could determine its short-term direction. Watch closely!
90
·
--
Bullish
$SNXXB PLUNGES 18.54% — BUT BUYERS ARE FIGHTING BACK!
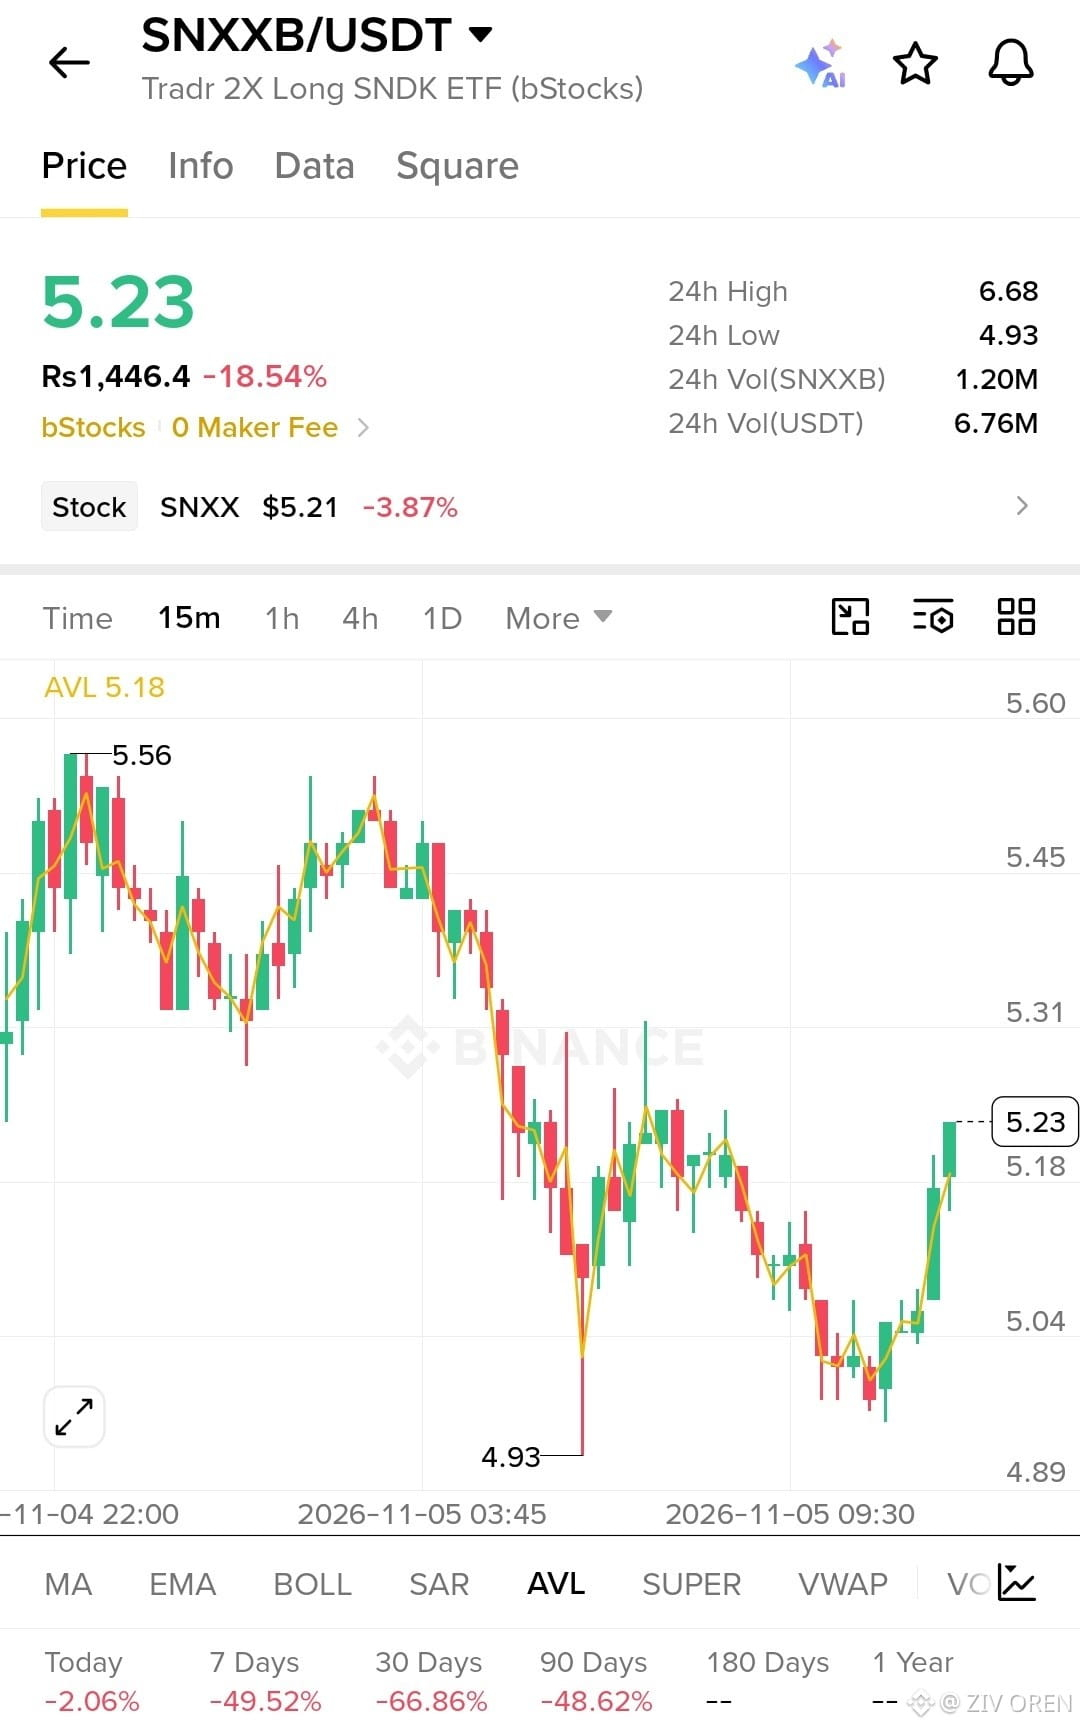
The SNXXB/USDT leveraged ETF has dropped to $5.23 after crashing from a 24-hour high of $6.68 to a low of $4.93. Trading volume has reached 1.20M SNXXB, worth $6.76M USDT.
The 15-minute chart shows a sharp sell-off followed by a strong recovery from $4.93. Buyers are attempting to regain control, with $5.31 as the next key resistance and $5.04 as an important support zone.
Is this the beginning of a recovery or just a temporary bounce?
The next breakout could decide SNXXB's short-term direction. Watch closely!
$SNXXB PLUNGES 18.54% — BUT BUYERS ARE FIGHTING BACK!
The SNXXB/USDT leveraged ETF has dropped to $5.23 after crashing from a 24-hour high of $6.68 to a low of $4.93. Trading volume has reached 1.20M SNXXB, worth $6.76M USDT.
The 15-minute chart shows a sharp sell-off followed by a strong recovery from $4.93. Buyers are attempting to regain control, with $5.31 as the next key resistance and $5.04 as an important support zone.
Is this the beginning of a recovery or just a temporary bounce?
The next breakout could decide SNXXB's short-term direction. Watch closely!
The SNXXB/USDT leveraged ETF has dropped to $5.23 after crashing from a 24-hour high of $6.68 to a low of $4.93. Trading volume has reached 1.20M SNXXB, worth $6.76M USDT.
The 15-minute chart shows a sharp sell-off followed by a strong recovery from $4.93. Buyers are attempting to regain control, with $5.31 as the next key resistance and $5.04 as an important support zone.
Is this the beginning of a recovery or just a temporary bounce?
The next breakout could decide SNXXB's short-term direction. Watch closely!
1
486
·
--
Bullish
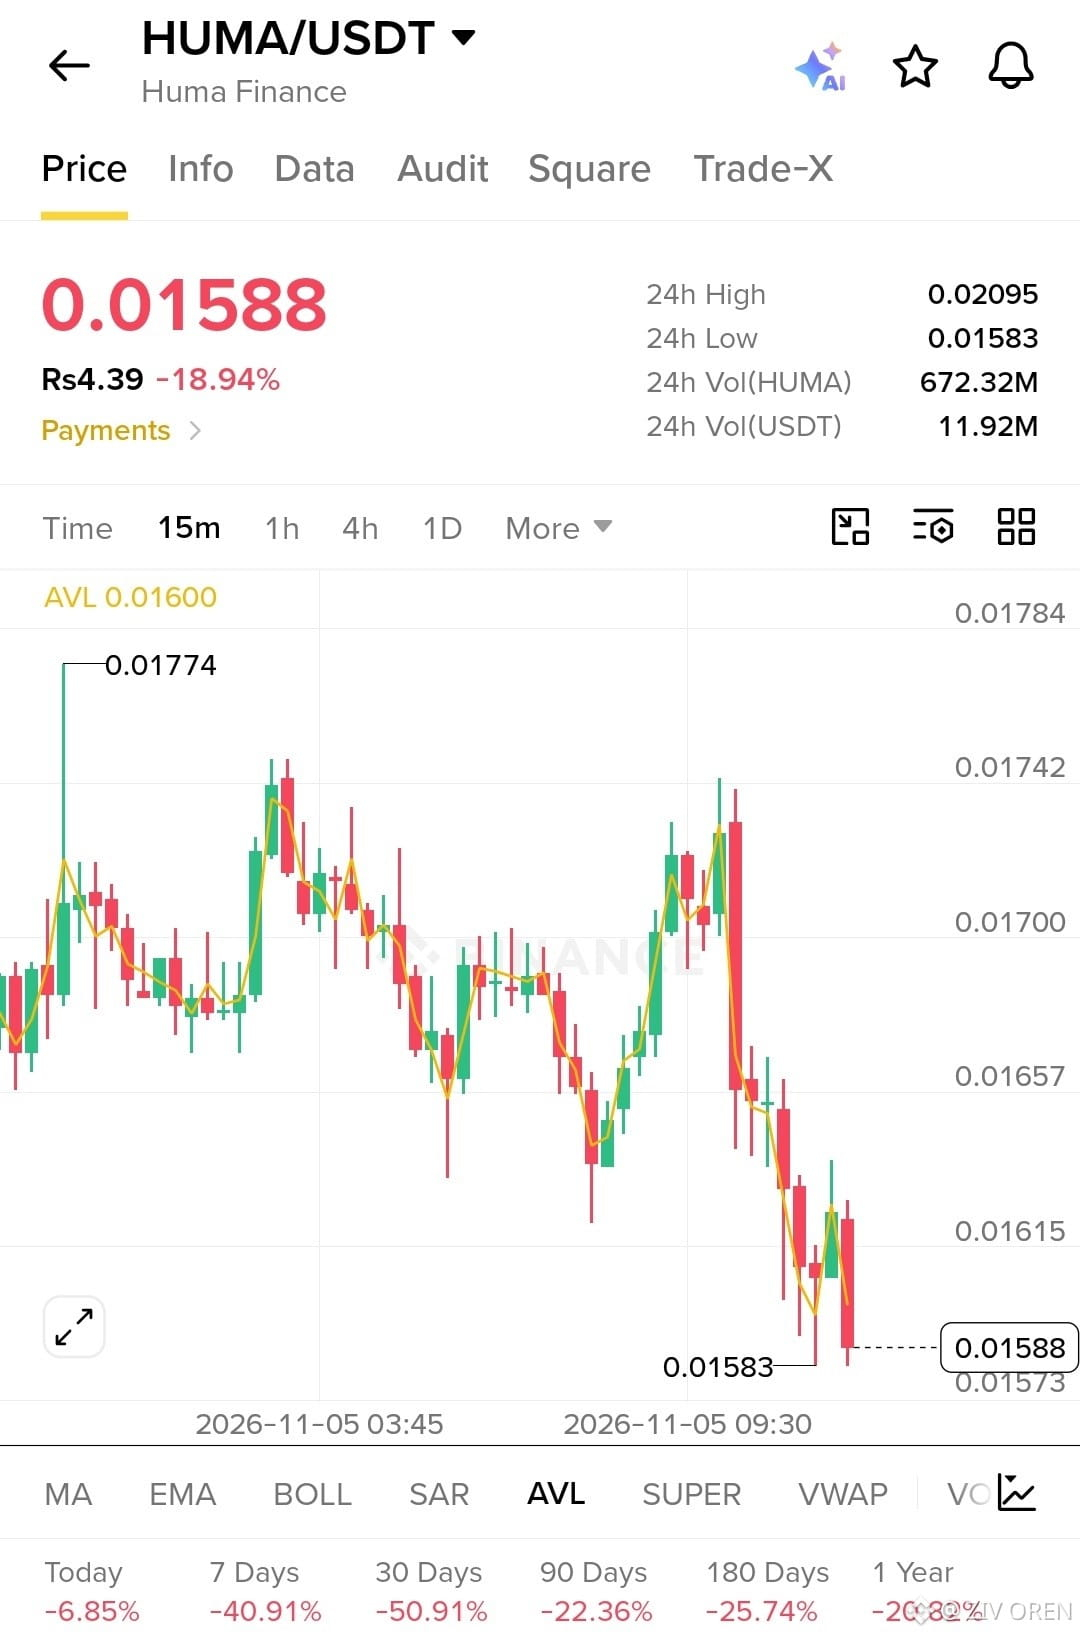
$HUMA CRASHES 18.94% — MASSIVE SELLING PRESSURE HITS THE MARKET!
Huma Finance ($HUMA) has plunged to $0.01588, dangerously close to its 24-hour low of $0.01583, after reaching $0.02095. Trading volume has surged to 672.32M HUMA, worth $11.92M USDT.
The 15-minute chart shows aggressive bearish momentum, failed recovery attempts, and sellers pushing price toward fresh lows. A break below $0.01583 could increase downside pressure, while buyers need to reclaim $0.01657 to show signs of recovery.
Is $HUMA preparing for a bounce or another major leg down?
The next move could be critical. Watch $HUMA closely!
$HUMA CRASHES 18.94% — MASSIVE SELLING PRESSURE HITS THE MARKET!
Huma Finance ($HUMA ) has plunged to $0.01588, dangerously close to its 24-hour low of $0.01583, after reaching $0.02095. Trading volume has surged to 672.32M HUMA, worth $11.92M USDT.
The 15-minute chart shows aggressive bearish momentum, failed recovery attempts, and sellers pushing price toward fresh lows. A break below $0.01583 could increase downside pressure, while buyers need to reclaim $0.01657 to show signs of recovery.
Is $HUMA preparing for a bounce or another major leg down?
The next move could be critical. Watch $HUMA closely!
Huma Finance ($HUMA ) has plunged to $0.01588, dangerously close to its 24-hour low of $0.01583, after reaching $0.02095. Trading volume has surged to 672.32M HUMA, worth $11.92M USDT.
The 15-minute chart shows aggressive bearish momentum, failed recovery attempts, and sellers pushing price toward fresh lows. A break below $0.01583 could increase downside pressure, while buyers need to reclaim $0.01657 to show signs of recovery.
Is $HUMA preparing for a bounce or another major leg down?
The next move could be critical. Watch $HUMA closely!
1
774
·
--
Bullish
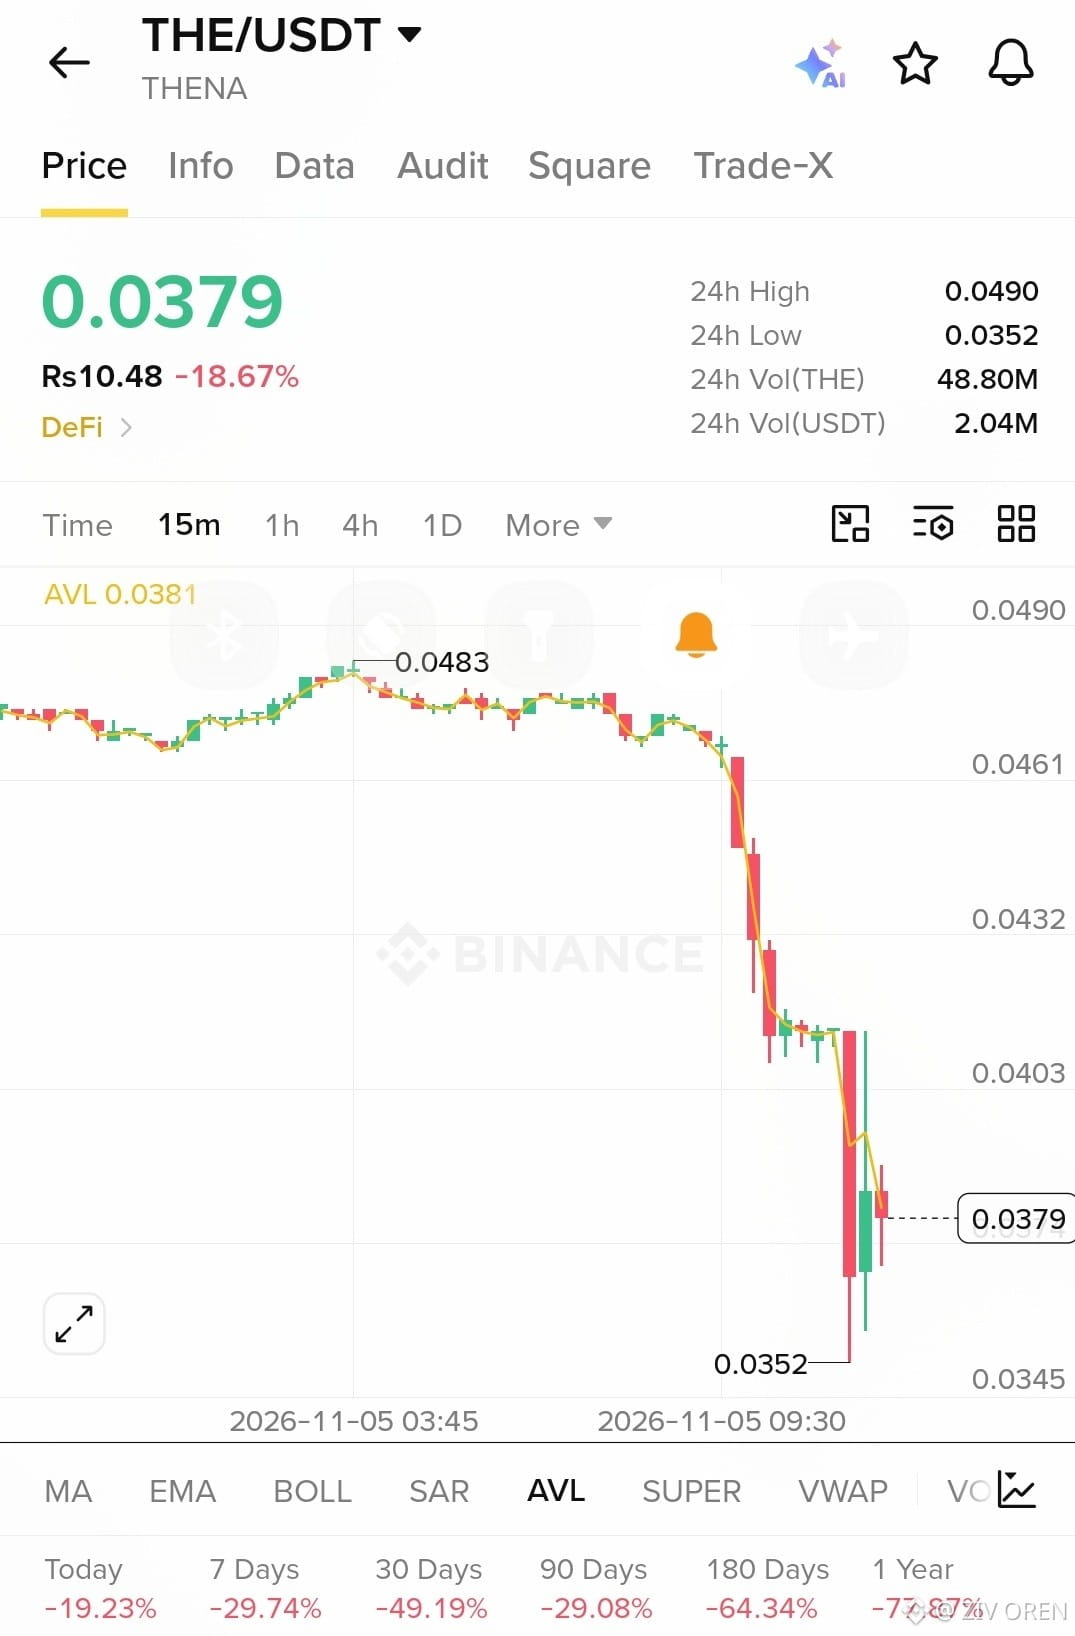
$THE CRASHES 18.67% IN 24 HOURS — SELLERS TAKE CONTROL!
THENA ($THE) has plunged to $0.0379, hitting a 24-hour low of $0.0352 after trading near $0.0483. 24-hour volume stands at 48.80M THE, worth approximately $2.04M USDT.
The 15-minute chart shows aggressive selling pressure, a sharp breakdown, and a volatile bounce from the lows. Bears remain in control unless buyers reclaim key resistance levels.
The big question: Is this a temporary flush or the beginning of another leg down?
$THE is at a critical turning point. Watch the next move closely!
$THE CRASHES 18.67% IN 24 HOURS — SELLERS TAKE CONTROL!
THENA ($THE ) has plunged to $0.0379, hitting a 24-hour low of $0.0352 after trading near $0.0483. 24-hour volume stands at 48.80M THE, worth approximately $2.04M USDT.
The 15-minute chart shows aggressive selling pressure, a sharp breakdown, and a volatile bounce from the lows. Bears remain in control unless buyers reclaim key resistance levels.
The big question: Is this a temporary flush or the beginning of another leg down?
$THE is at a critical turning point. Watch the next move closely!
THENA ($THE ) has plunged to $0.0379, hitting a 24-hour low of $0.0352 after trading near $0.0483. 24-hour volume stands at 48.80M THE, worth approximately $2.04M USDT.
The 15-minute chart shows aggressive selling pressure, a sharp breakdown, and a volatile bounce from the lows. Bears remain in control unless buyers reclaim key resistance levels.
The big question: Is this a temporary flush or the beginning of another leg down?
$THE is at a critical turning point. Watch the next move closely!
1
1
1.6k
·
--
Bullish
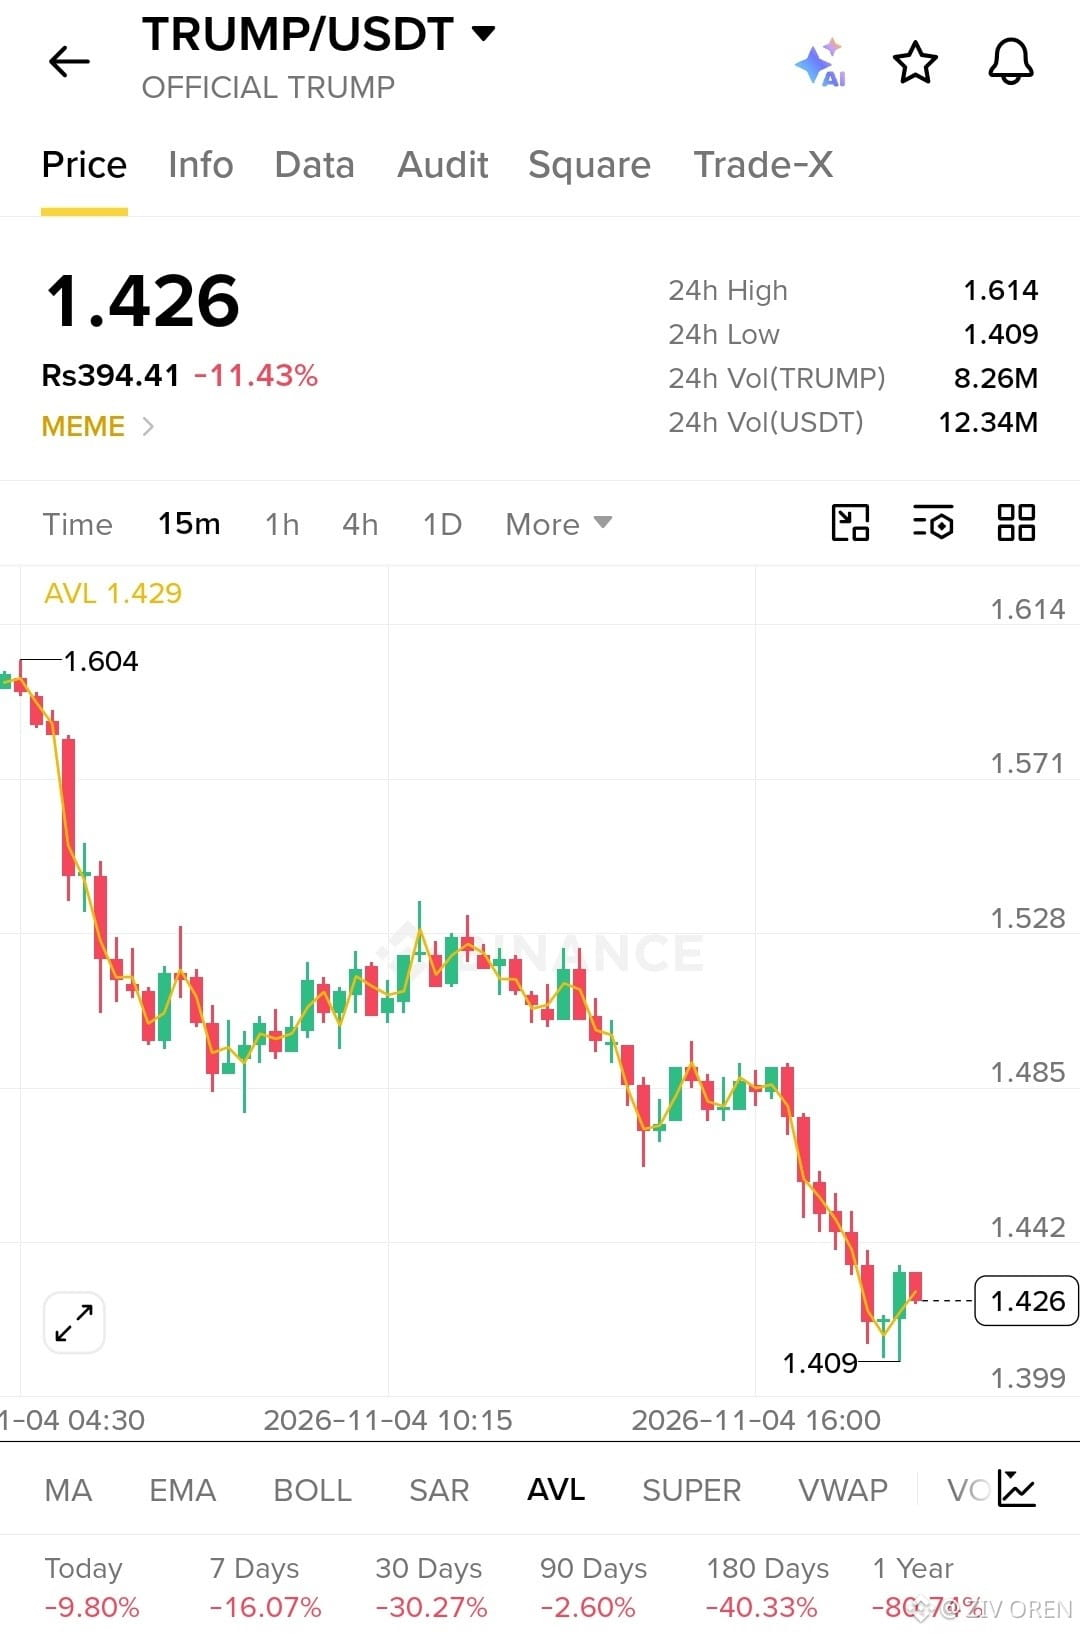
$TRUMP COIN TAKES A SHARP HIT — 11.43% CRASH IN 24 HOURS!
$TRUMP is facing heavy selling pressure, with price dropping to $1.426, down 11.43% in the last 24 hours.
Key numbers tell the story:
* Current Price: $1.426
* 24H High: $1.614
* 24H Low: $1.409
* 24H Volume: $12.34M USDT
* 7-Day Performance: -16.07%
* 30-Day Performance: -30.27%
The 15-minute chart shows a clear bearish structure, with lower highs and lower lows. A brief bounce from $1.409 has appeared, but buyers have yet to prove they can reverse the trend.
Market Impact: $1.409 is the immediate support to watch. A breakdown could bring further downside pressure, while reclaiming $1.442 may offer the first sign of short-term recovery.
The warning is clear: one small bounce doesn't erase a major sell-off.
$TRUMP COIN TAKES A SHARP HIT — 11.43% CRASH IN 24 HOURS!
$TRUMP is facing heavy selling pressure, with price dropping to $1.426, down 11.43% in the last 24 hours.
Key numbers tell the story:
* Current Price: $1.426
* 24H High: $1.614
* 24H Low: $1.409
* 24H Volume: $12.34M USDT
* 7-Day Performance: -16.07%
* 30-Day Performance: -30.27%
The 15-minute chart shows a clear bearish structure, with lower highs and lower lows. A brief bounce from $1.409 has appeared, but buyers have yet to prove they can reverse the trend.
Market Impact: $1.409 is the immediate support to watch. A breakdown could bring further downside pressure, while reclaiming $1.442 may offer the first sign of short-term recovery.
The warning is clear: one small bounce doesn't erase a major sell-off.
$TRUMP is facing heavy selling pressure, with price dropping to $1.426, down 11.43% in the last 24 hours.
Key numbers tell the story:
* Current Price: $1.426
* 24H High: $1.614
* 24H Low: $1.409
* 24H Volume: $12.34M USDT
* 7-Day Performance: -16.07%
* 30-Day Performance: -30.27%
The 15-minute chart shows a clear bearish structure, with lower highs and lower lows. A brief bounce from $1.409 has appeared, but buyers have yet to prove they can reverse the trend.
Market Impact: $1.409 is the immediate support to watch. A breakdown could bring further downside pressure, while reclaiming $1.442 may offer the first sign of short-term recovery.
The warning is clear: one small bounce doesn't erase a major sell-off.
384
·
--
Bullish
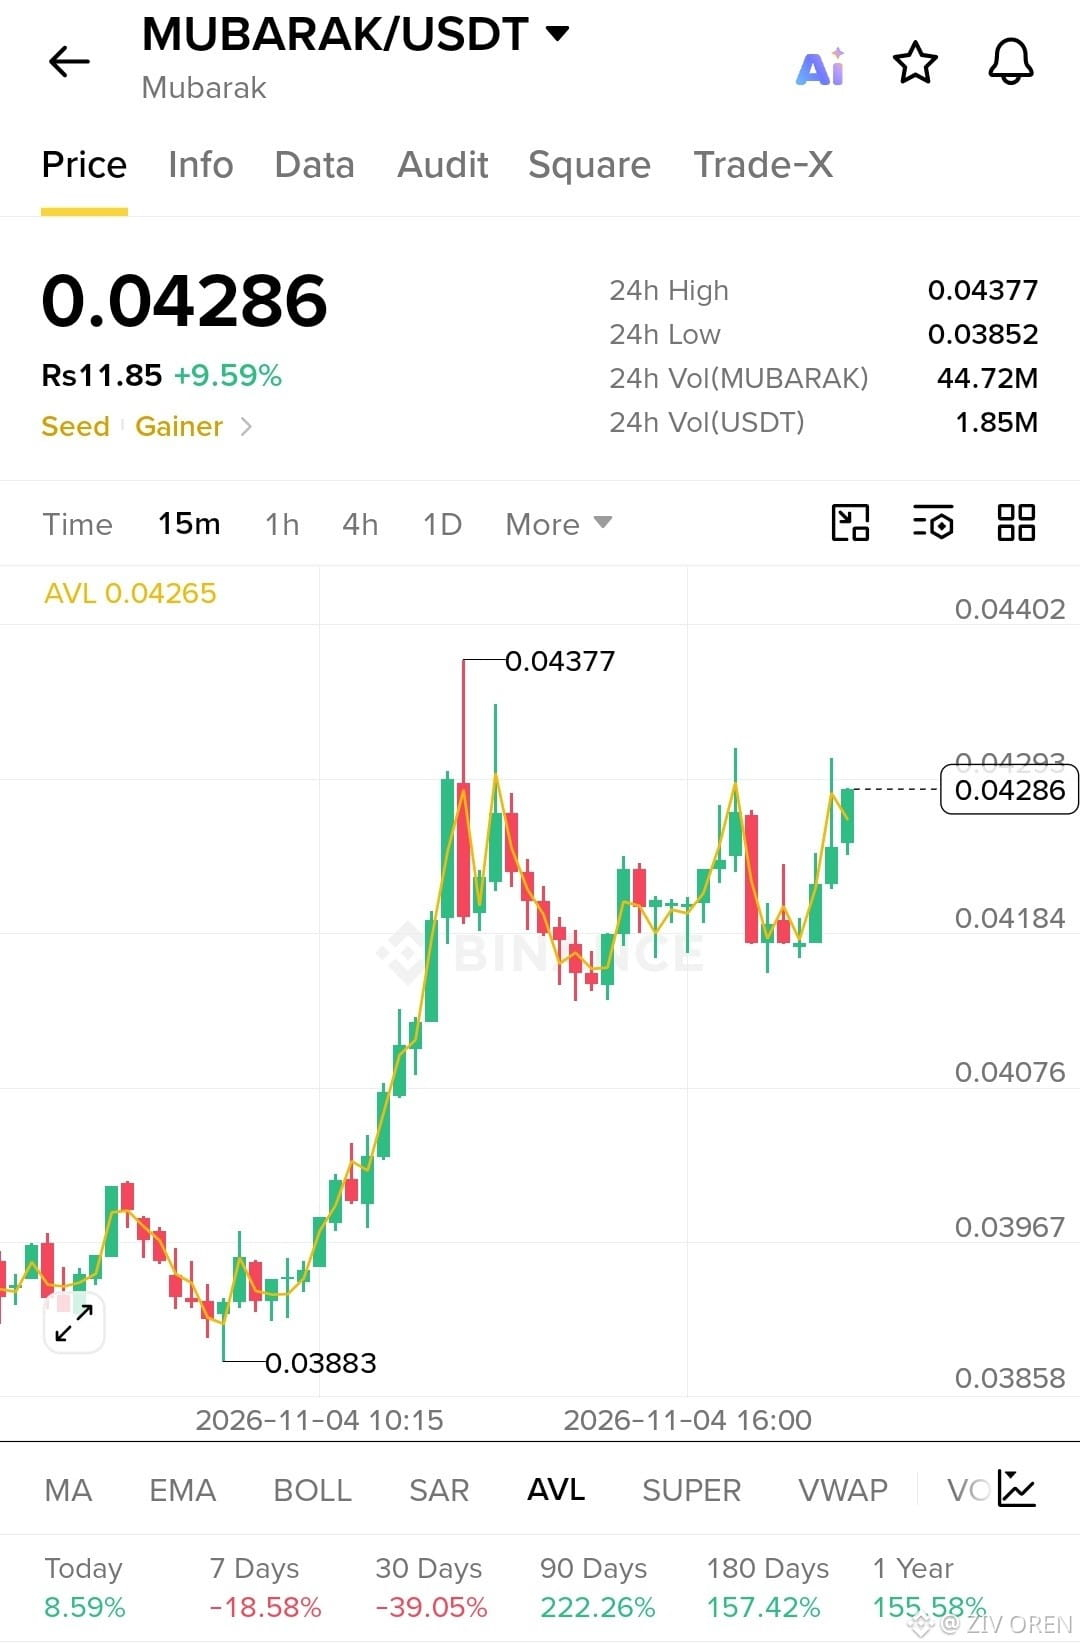
$MUBARAK RALLIES 9.59% — $0.04377 BREAKOUT IN SIGHT!
$MUBARAK is trading at $0.04286, with $1.85M in 24H volume as bullish momentum pushes price toward its daily high!
24H High: $0.04377 Support: $0.04184 Breakout Level: $0.04300 Upside Target: $0.04377
A clean break above resistance could extend the rally, while rejection may trigger a pullback toward support.
Will MUBARAK break higher or face another rejection? Watch the next move! DYOR.
$MUBARAK RALLIES 9.59% — $0.04377 BREAKOUT IN SIGHT!
$MUBARAK is trading at $0.04286, with $1.85M in 24H volume as bullish momentum pushes price toward its daily high!
24H High: $0.04377 Support: $0.04184 Breakout Level: $0.04300 Upside Target: $0.04377
A clean break above resistance could extend the rally, while rejection may trigger a pullback toward support.
Will MUBARAK break higher or face another rejection? Watch the next move! DYOR.
$MUBARAK is trading at $0.04286, with $1.85M in 24H volume as bullish momentum pushes price toward its daily high!
24H High: $0.04377 Support: $0.04184 Breakout Level: $0.04300 Upside Target: $0.04377
A clean break above resistance could extend the rally, while rejection may trigger a pullback toward support.
Will MUBARAK break higher or face another rejection? Watch the next move! DYOR.
166
·
--
Bullish
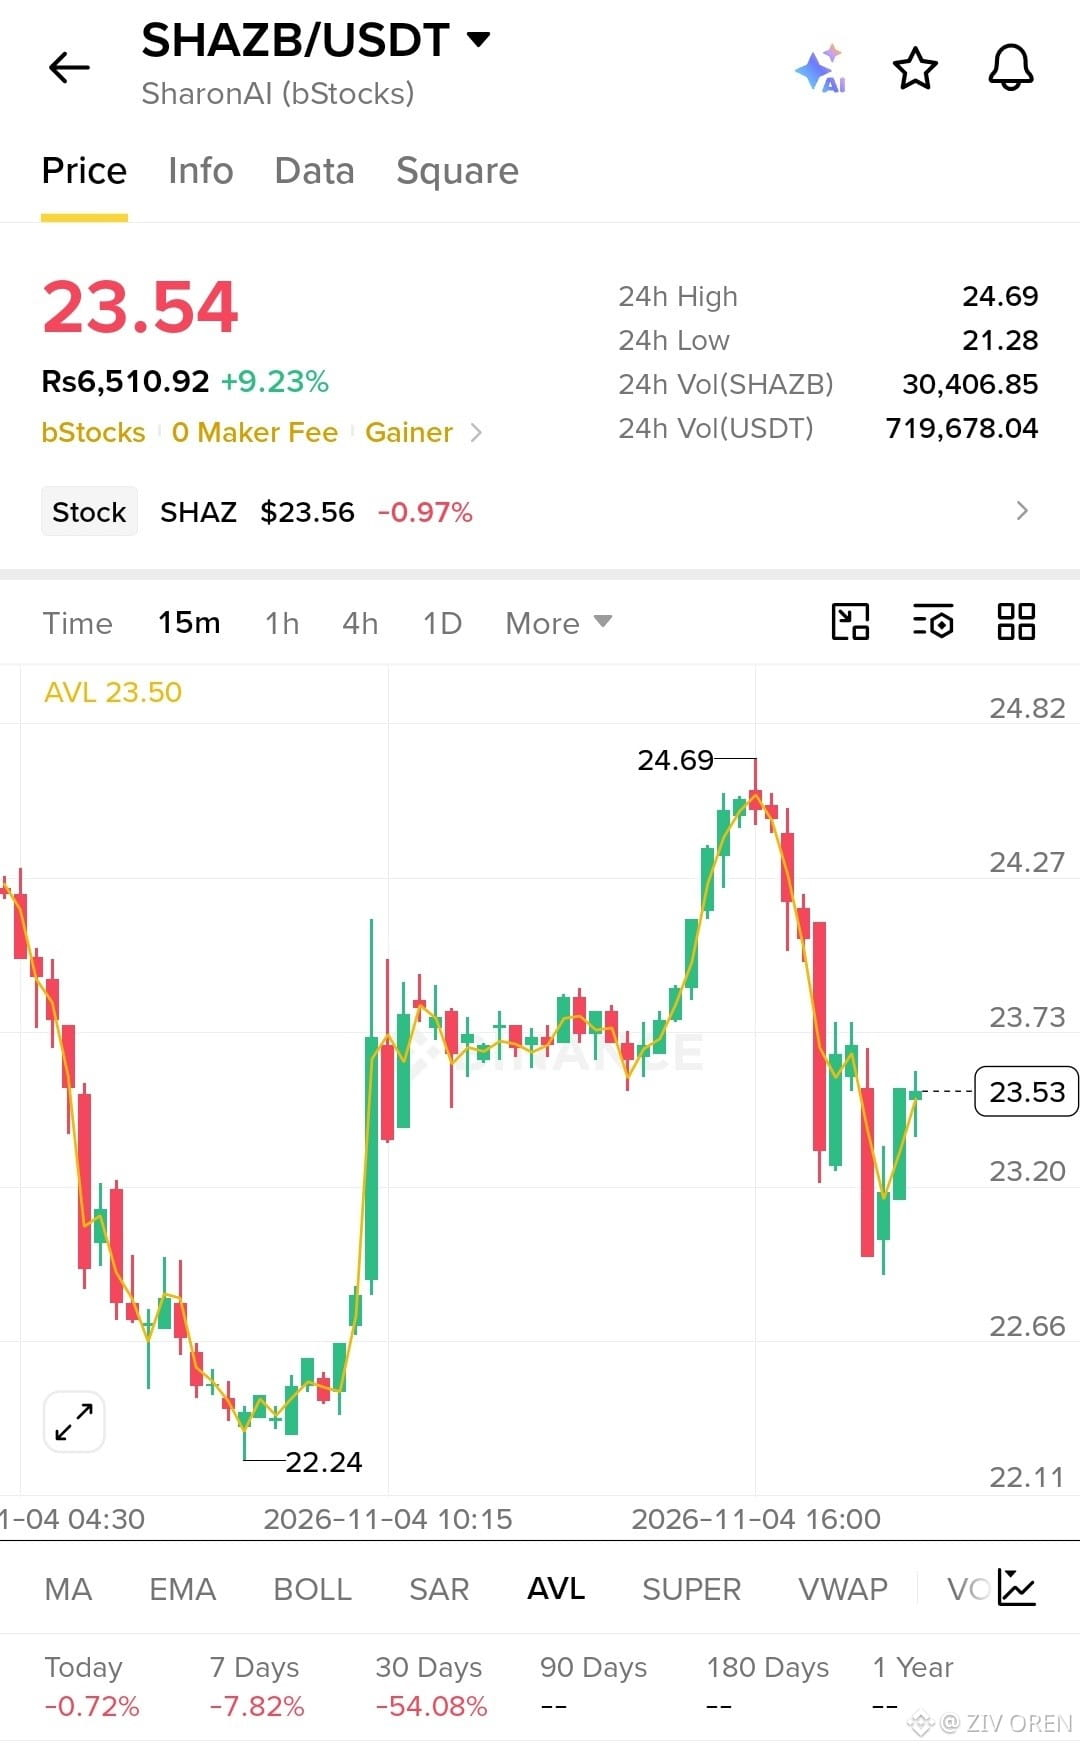
$SHAZB JUMPS 9.23% — WILL BULLS RECLAIM $24.69?
SHAZB is trading at $23.54, up 9.23% in 24 hours, with trading volume reaching $719K USDT!
24H High: $24.69 Support Zone: $23.20 Resistance: $23.73 → $24.27 → $24.69
Price is rebounding after a sharp pullback. A break above resistance could revive bullish momentum, while losing $23.20 may invite further selling.
Recovery or another rejection? SHAZB is at a critical turning point! DYOR.
$SHAZB JUMPS 9.23% — WILL BULLS RECLAIM $24.69?
SHAZB is trading at $23.54, up 9.23% in 24 hours, with trading volume reaching $719K USDT!
24H High: $24.69 Support Zone: $23.20 Resistance: $23.73 → $24.27 → $24.69
Price is rebounding after a sharp pullback. A break above resistance could revive bullish momentum, while losing $23.20 may invite further selling.
Recovery or another rejection? SHAZB is at a critical turning point! DYOR.
SHAZB is trading at $23.54, up 9.23% in 24 hours, with trading volume reaching $719K USDT!
24H High: $24.69 Support Zone: $23.20 Resistance: $23.73 → $24.27 → $24.69
Price is rebounding after a sharp pullback. A break above resistance could revive bullish momentum, while losing $23.20 may invite further selling.
Recovery or another rejection? SHAZB is at a critical turning point! DYOR.
90
·
--
Bullish
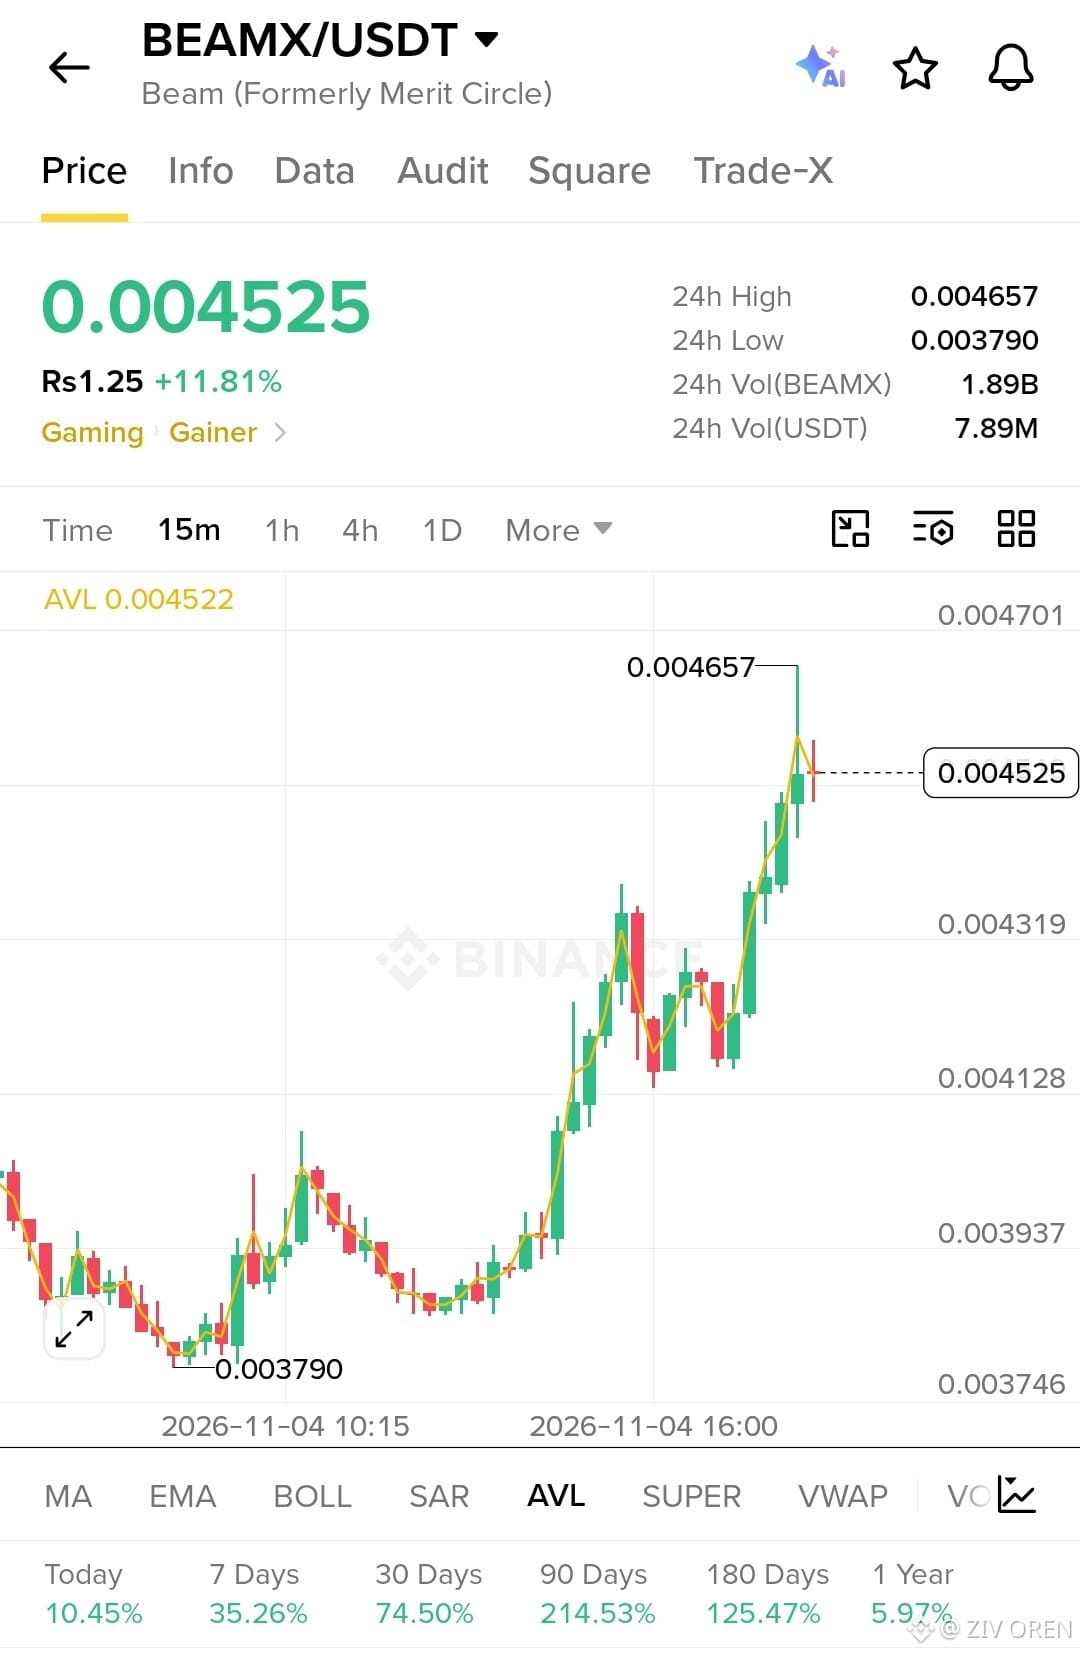
$BEAMX SURGES 11.81% — BULLS EYE $0.004657!
BEAMX is heating up at $0.004525, backed by $7.89M in 24H trading volume. Momentum is strong, but resistance is approaching!
24H High: $0.004657 Support: $0.004319 Resistance: $0.004657
A breakout above the daily high could fuel another leg up, while rejection may trigger a pullback.
BEAMX is at a critical level — breakout or profit-taking? Watch closely! DYOR.
$BEAMX SURGES 11.81% — BULLS EYE $0.004657!
BEAMX is heating up at $0.004525, backed by $7.89M in 24H trading volume. Momentum is strong, but resistance is approaching!
24H High: $0.004657 Support: $0.004319 Resistance: $0.004657
A breakout above the daily high could fuel another leg up, while rejection may trigger a pullback.
BEAMX is at a critical level — breakout or profit-taking? Watch closely! DYOR.
BEAMX is heating up at $0.004525, backed by $7.89M in 24H trading volume. Momentum is strong, but resistance is approaching!
24H High: $0.004657 Support: $0.004319 Resistance: $0.004657
A breakout above the daily high could fuel another leg up, while rejection may trigger a pullback.
BEAMX is at a critical level — breakout or profit-taking? Watch closely! DYOR.
145
·
--
Bullish
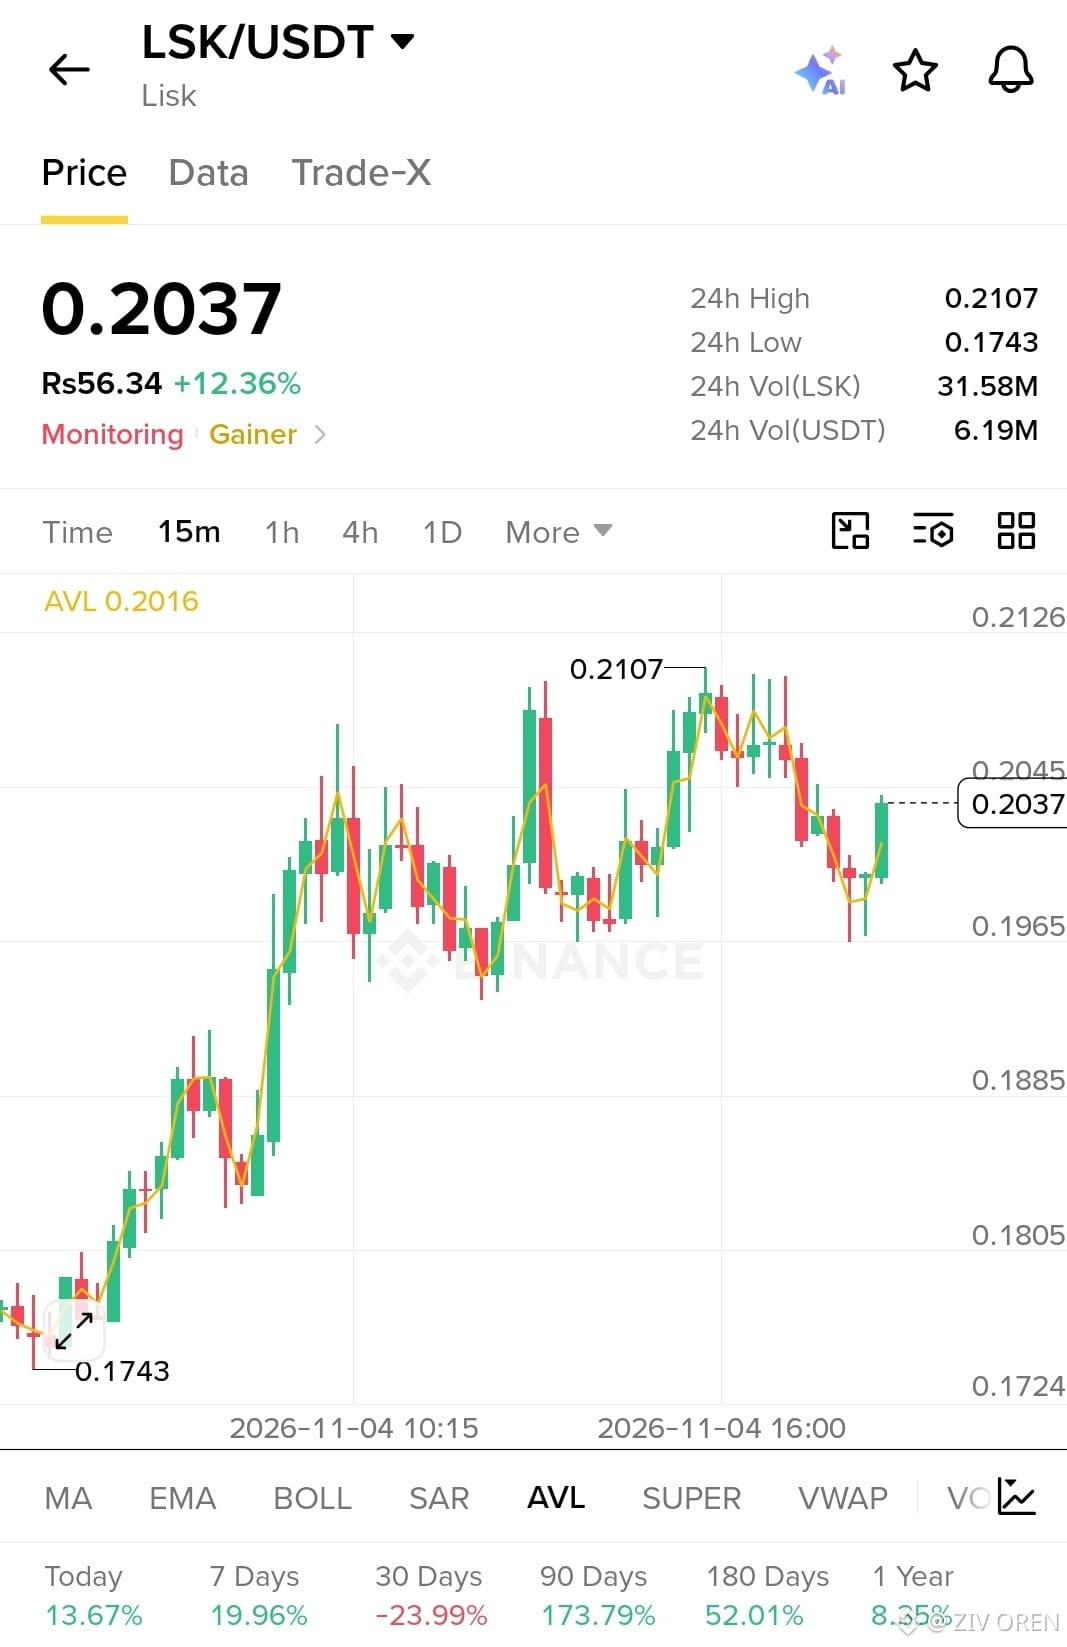
LSK EXPLODES 12.36% — BULLS TARGET $0.21!
Lisk ($LSK ) is trading at $0.2037, up 12.36% in 24 hours, with $6.19M in trading volume!
24H High: $0.2107 Support: $0.1965 Resistance: $0.2045–$0.2107
A breakout above $0.2107 could signal another bullish push, while rejection may trigger a pullback toward support.
Will $LSK smash resistance or lose momentum? The next move could be decisive!
LSK EXPLODES 12.36% — BULLS TARGET $0.21!
Lisk ($LSK ) is trading at $0.2037, up 12.36% in 24 hours, with $6.19M in trading volume!
24H High: $0.2107 Support: $0.1965 Resistance: $0.2045–$0.2107
A breakout above $0.2107 could signal another bullish push, while rejection may trigger a pullback toward support.
Will $LSK smash resistance or lose momentum? The next move could be decisive!
Lisk ($LSK ) is trading at $0.2037, up 12.36% in 24 hours, with $6.19M in trading volume!
24H High: $0.2107 Support: $0.1965 Resistance: $0.2045–$0.2107
A breakout above $0.2107 could signal another bullish push, while rejection may trigger a pullback toward support.
Will $LSK smash resistance or lose momentum? The next move could be decisive!
224
·
--
Bullish
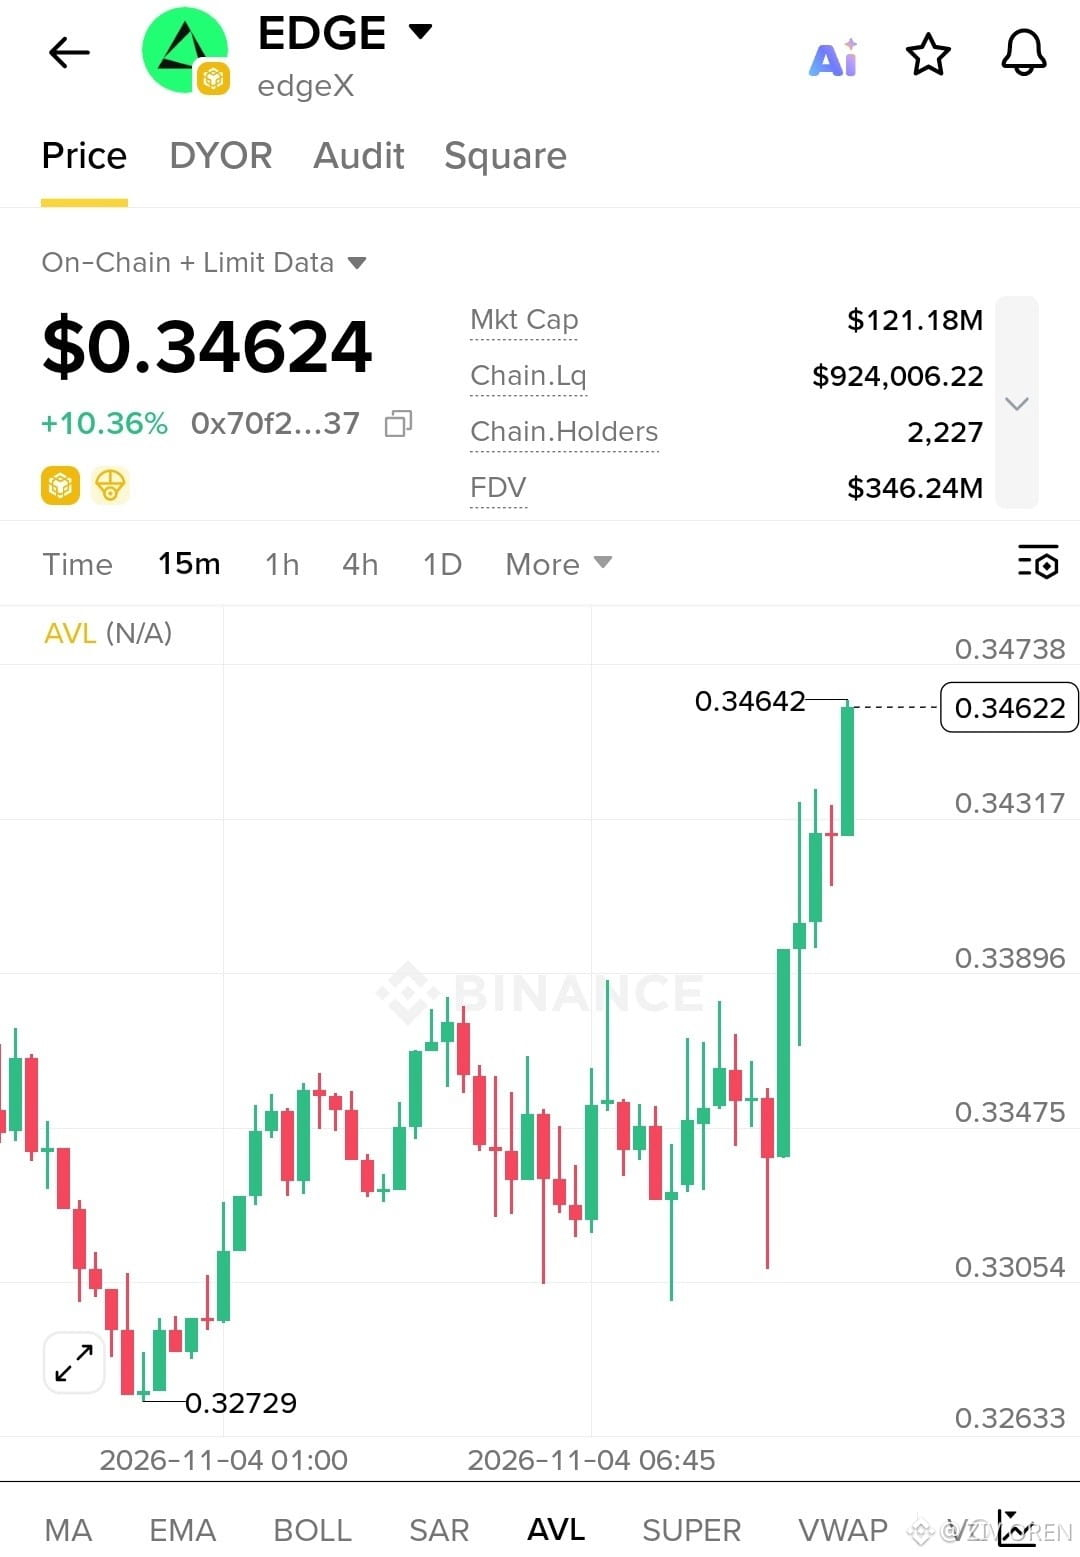
$EDGE (edgeX) SURGES 10.36% — Bulls Launch A Powerful Breakout!
EDGE is making a strong move, climbing to $0.34624, with buyers pushing price toward fresh local highs.
Key Market Data:
* Price: $0.34624
* 24H Change: +10.36%
* Market Cap: $121.18M
* On-chain Liquidity: $924K
* Holders: 2,227
* FDV: $346.24M
📈 The 15-minute chart shows a strong bullish breakout from the $0.32729 low. Price has pushed above the $0.34317 area, with immediate resistance near $0.34642.
If buyers sustain this breakout, further upside could follow. A rejection may bring a short-term pullback.
EDGE is heating up. The next move could be crucial!
$EDGE (edgeX) SURGES 10.36% — Bulls Launch A Powerful Breakout!
EDGE is making a strong move, climbing to $0.34624, with buyers pushing price toward fresh local highs.
Key Market Data:
* Price: $0.34624
* 24H Change: +10.36%
* Market Cap: $121.18M
* On-chain Liquidity: $924K
* Holders: 2,227
* FDV: $346.24M
📈 The 15-minute chart shows a strong bullish breakout from the $0.32729 low. Price has pushed above the $0.34317 area, with immediate resistance near $0.34642.
If buyers sustain this breakout, further upside could follow. A rejection may bring a short-term pullback.
EDGE is heating up. The next move could be crucial!
EDGE is making a strong move, climbing to $0.34624, with buyers pushing price toward fresh local highs.
Key Market Data:
* Price: $0.34624
* 24H Change: +10.36%
* Market Cap: $121.18M
* On-chain Liquidity: $924K
* Holders: 2,227
* FDV: $346.24M
📈 The 15-minute chart shows a strong bullish breakout from the $0.32729 low. Price has pushed above the $0.34317 area, with immediate resistance near $0.34642.
If buyers sustain this breakout, further upside could follow. A rejection may bring a short-term pullback.
EDGE is heating up. The next move could be crucial!
229
·
--
Bullish
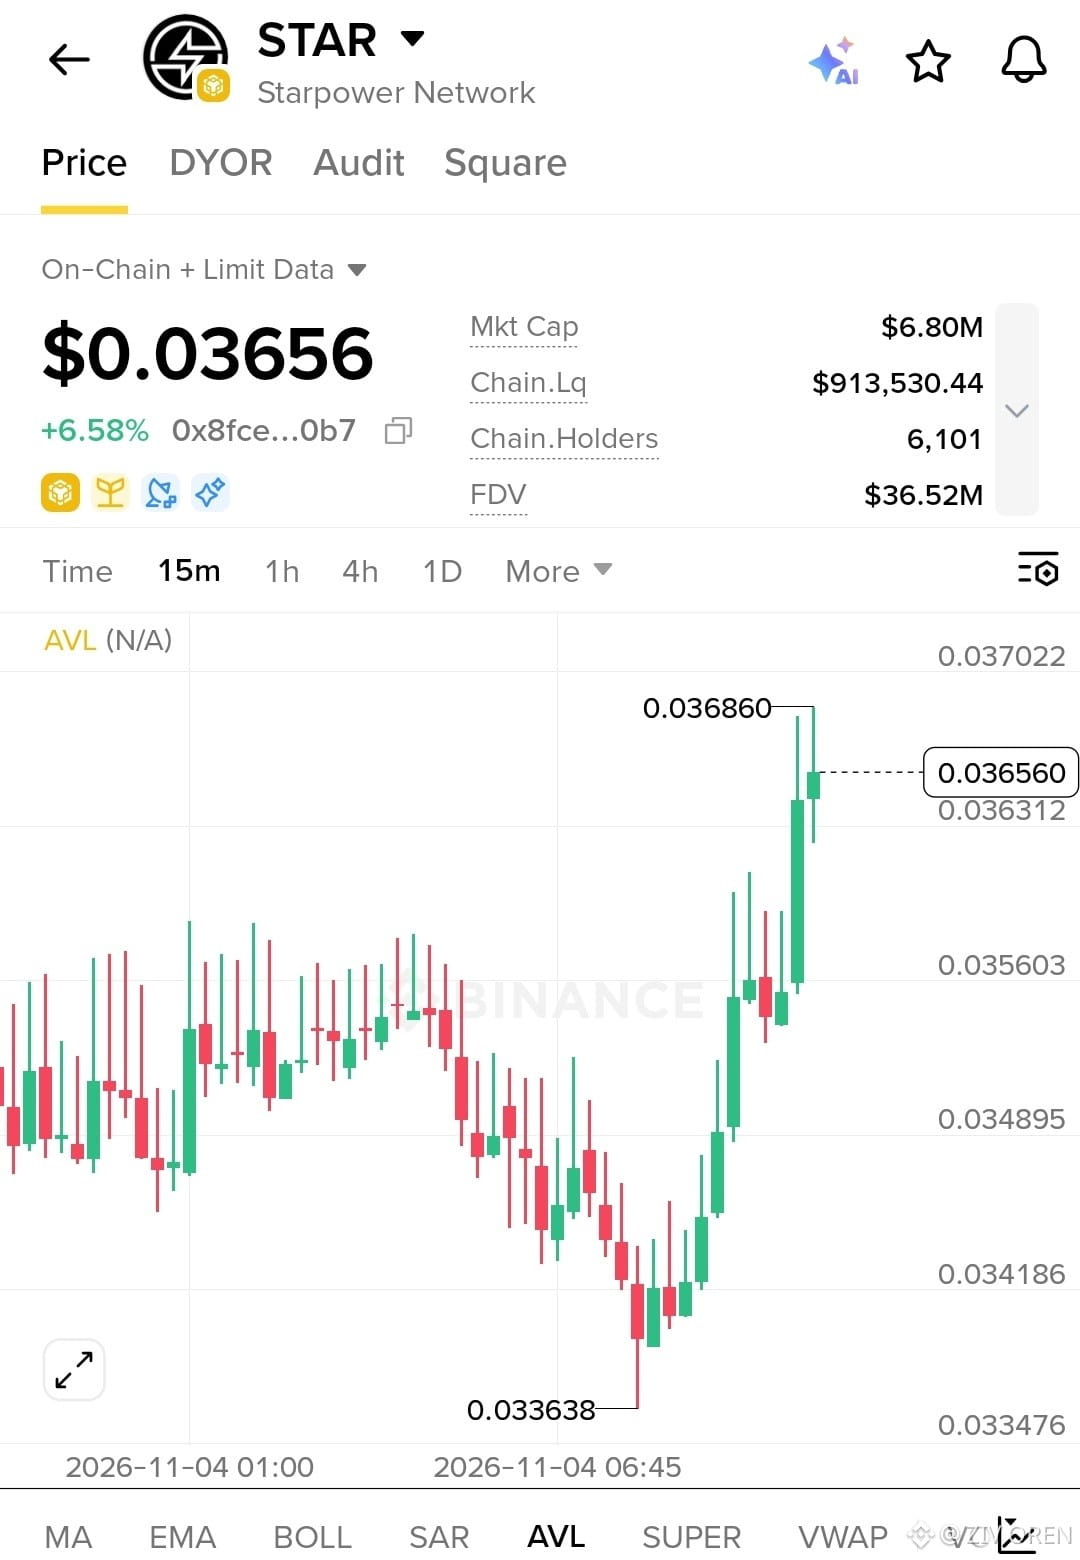
$STAR (Starpower Network) EXPLODES 6.58% — Bulls Take Control!
STAR is showing strong bullish momentum, trading at $0.03656, up 6.58%.
Market Highlights:
* Market Cap: $6.80M
* FDV: $36.52M
* On-chain Liquidity: $913.53K
* Holders: 6,101
* Recent High: $0.03686
The 15-minute chart shows a powerful recovery from $0.033638, followed by a sharp breakout. Bulls are now testing the $0.03686 resistance.
A sustained move above resistance could strengthen bullish momentum, while rejection may trigger a pullback.
STAR is heating up. Watch the breakout level closely!
$STAR (Starpower Network) EXPLODES 6.58% — Bulls Take Control!
STAR is showing strong bullish momentum, trading at $0.03656, up 6.58%.
Market Highlights:
* Market Cap: $6.80M
* FDV: $36.52M
* On-chain Liquidity: $913.53K
* Holders: 6,101
* Recent High: $0.03686
The 15-minute chart shows a powerful recovery from $0.033638, followed by a sharp breakout. Bulls are now testing the $0.03686 resistance.
A sustained move above resistance could strengthen bullish momentum, while rejection may trigger a pullback.
STAR is heating up. Watch the breakout level closely!
STAR is showing strong bullish momentum, trading at $0.03656, up 6.58%.
Market Highlights:
* Market Cap: $6.80M
* FDV: $36.52M
* On-chain Liquidity: $913.53K
* Holders: 6,101
* Recent High: $0.03686
The 15-minute chart shows a powerful recovery from $0.033638, followed by a sharp breakout. Bulls are now testing the $0.03686 resistance.
A sustained move above resistance could strengthen bullish momentum, while rejection may trigger a pullback.
STAR is heating up. Watch the breakout level closely!
338
·
--
Bullish
Partly True
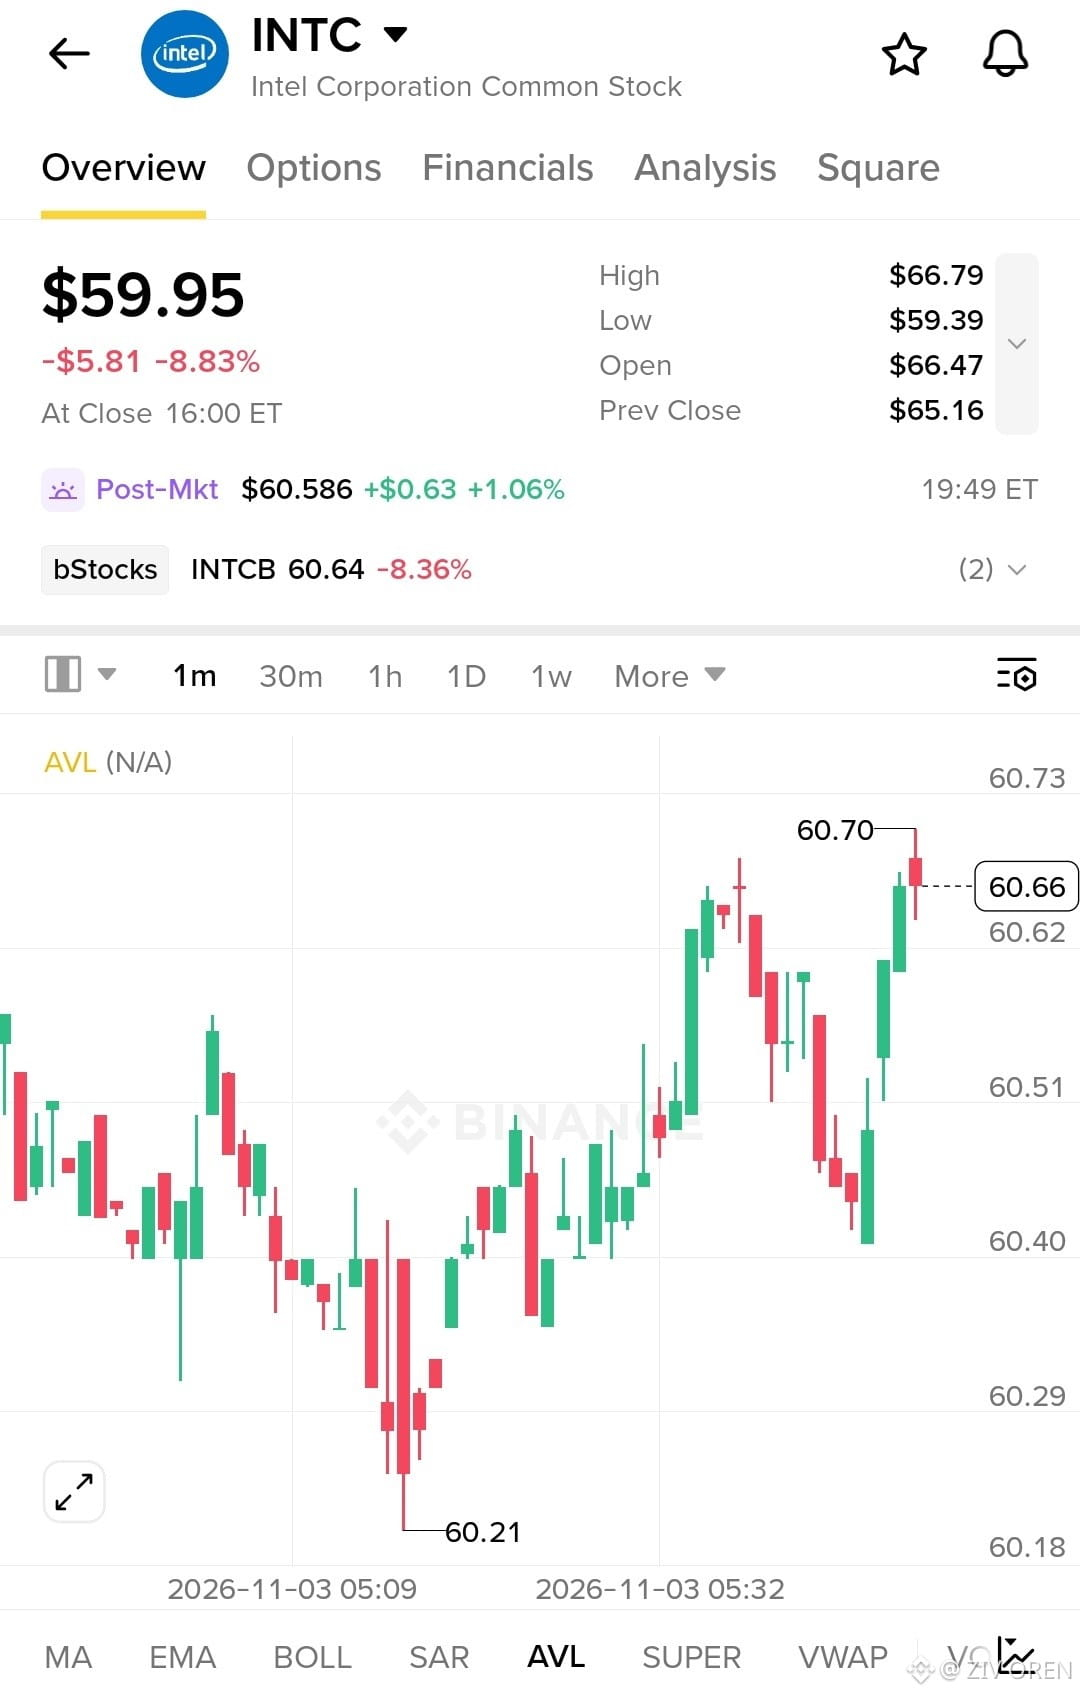
INTEL STOCK CRASHES 8.83% — BUT AFTER-HOURS BUYERS STRIKE BACK!
Intel ($INTCB ) closed at $59.95, down $5.81 (-8.83%), after opening at $66.47 and hitting an intraday high of $66.79.
But the action isn't over. After-hours trading pushed the stock to $60.586, up 1.06%, signaling a modest rebound after the sharp sell-off.
Key levels to watch: $59.39 support and $66.79 resistance.
Can Intel recover, or will selling pressure return? The next move depends on whether buyers can defend the recovery.
After a brutal sell-off, the real test is whether the rebound can hold.
INTEL STOCK CRASHES 8.83% — BUT AFTER-HOURS BUYERS STRIKE BACK!
Intel ($INTCB ) closed at $59.95, down $5.81 (-8.83%), after opening at $66.47 and hitting an intraday high of $66.79.
But the action isn't over. After-hours trading pushed the stock to $60.586, up 1.06%, signaling a modest rebound after the sharp sell-off.
Key levels to watch: $59.39 support and $66.79 resistance.
Can Intel recover, or will selling pressure return? The next move depends on whether buyers can defend the recovery.
After a brutal sell-off, the real test is whether the rebound can hold.
Intel ($INTCB ) closed at $59.95, down $5.81 (-8.83%), after opening at $66.47 and hitting an intraday high of $66.79.
But the action isn't over. After-hours trading pushed the stock to $60.586, up 1.06%, signaling a modest rebound after the sharp sell-off.
Key levels to watch: $59.39 support and $66.79 resistance.
Can Intel recover, or will selling pressure return? The next move depends on whether buyers can defend the recovery.
After a brutal sell-off, the real test is whether the rebound can hold.
652
·
--
Bullish
Partly True
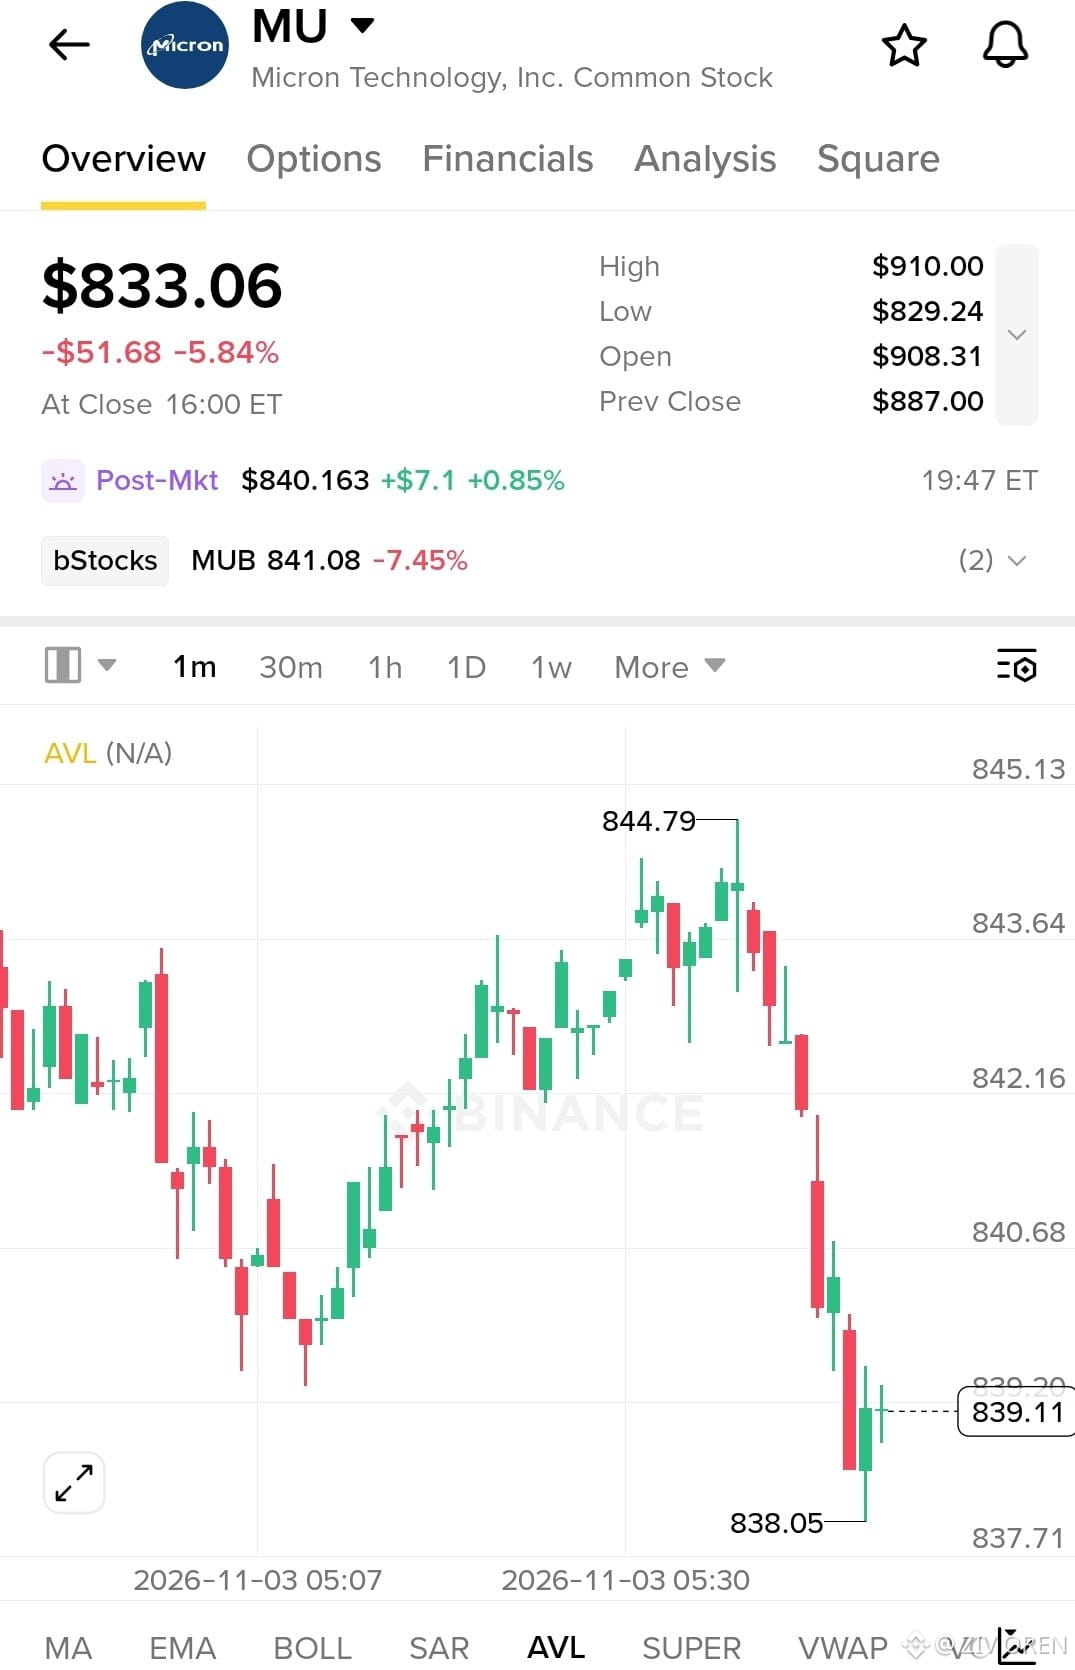
BREAKING: $MU SLIDES 5.84% — SELLERS TAKE CONTROL!
Micron Technology ($MU) faces heavy selling pressure!
Closing Price: $833.06 Daily Change: -5.84% (-$51.68) Day High: $910.00 Day Low: $829.24 Post-Market: $840.16 (+0.85%)
Key Levels
* Support: $838–$829
* Resistance: $840–$845
The sharp intraday drop signals bearish momentum, while the post-market rebound offers a potential recovery signal.
Will $MU reclaim $845 or extend its slide? Watch the next move closely!
BREAKING: $MU SLIDES 5.84% — SELLERS TAKE CONTROL!
Micron Technology ($MU ) faces heavy selling pressure!
Closing Price: $833.06 Daily Change: -5.84% (-$51.68) Day High: $910.00 Day Low: $829.24 Post-Market: $840.16 (+0.85%)
Key Levels
* Support: $838–$829
* Resistance: $840–$845
The sharp intraday drop signals bearish momentum, while the post-market rebound offers a potential recovery signal.
Will $MU reclaim $845 or extend its slide? Watch the next move closely!
Micron Technology ($MU ) faces heavy selling pressure!
Closing Price: $833.06 Daily Change: -5.84% (-$51.68) Day High: $910.00 Day Low: $829.24 Post-Market: $840.16 (+0.85%)
Key Levels
* Support: $838–$829
* Resistance: $840–$845
The sharp intraday drop signals bearish momentum, while the post-market rebound offers a potential recovery signal.
Will $MU reclaim $845 or extend its slide? Watch the next move closely!
558
·
--
Bullish
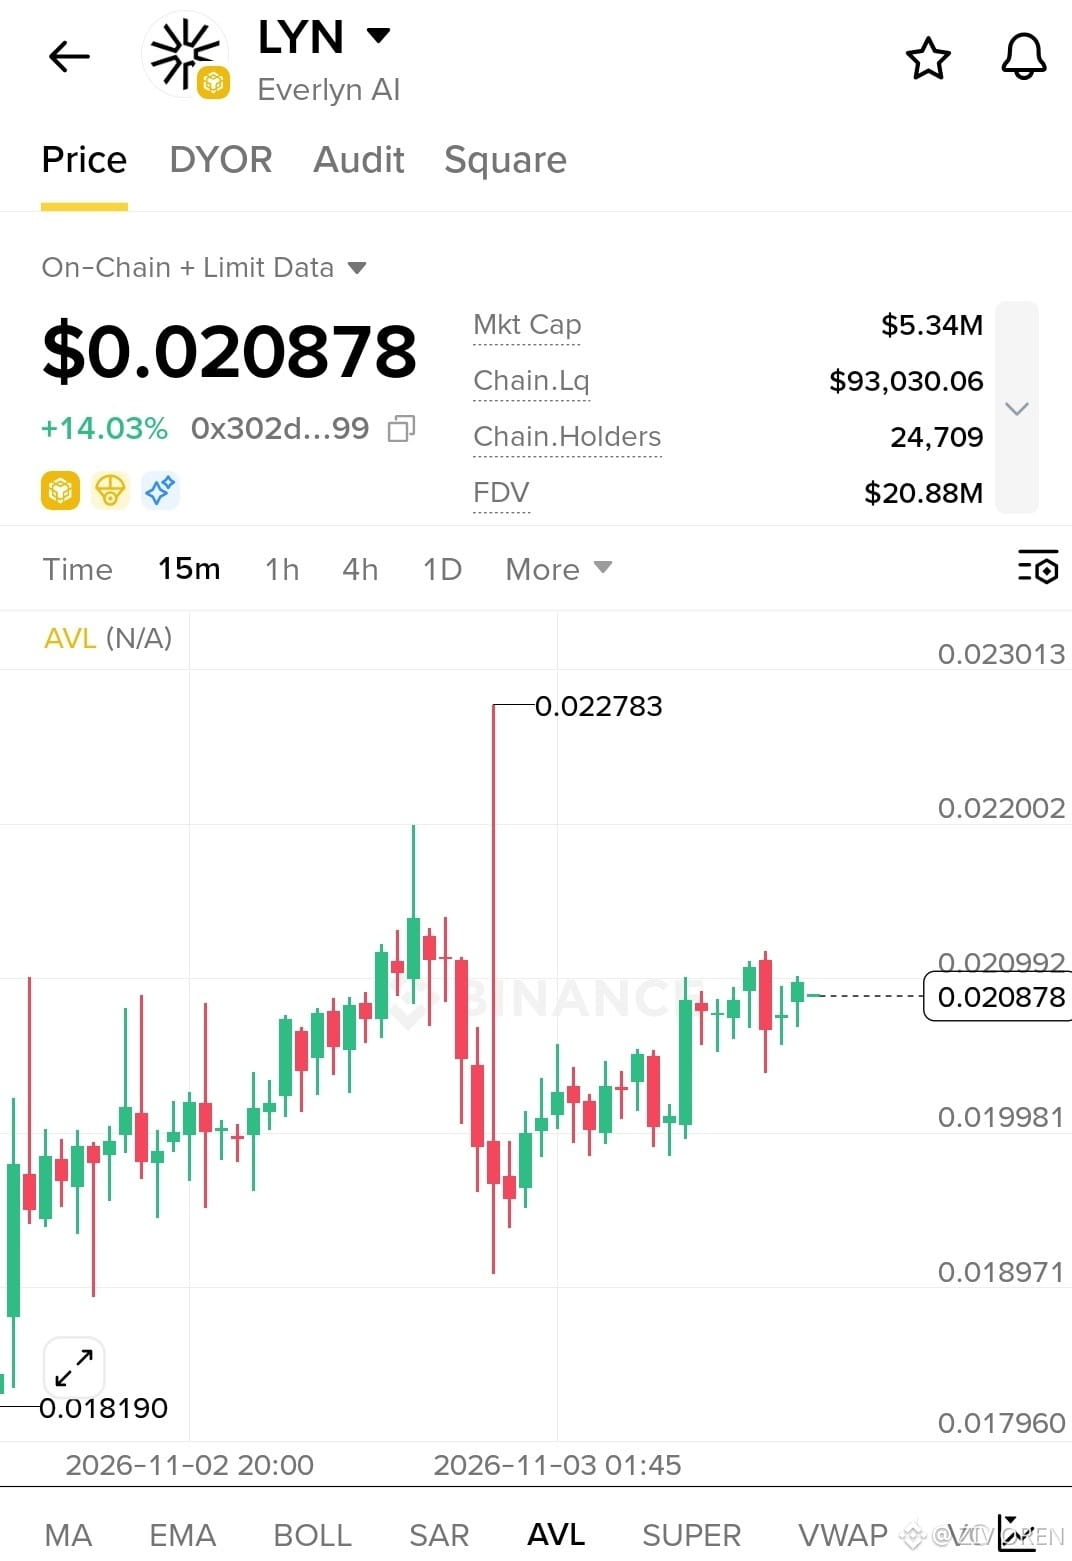
$LYN JUMPS 14.03% — BULLISH MOMENTUM BUILDS!
Everlyn AI ($LYN) is pushing higher!
Price: $0.020878 24H Change: +14.03% Market Cap: $5.34M On-Chain Liquidity: $93.03K FDV: $20.88M
Resistance: $0.0210–$0.0220 🛡️ Support: $0.0200, then $0.0190
A clean breakout could extend the rally, but rejection near resistance may trigger a pullback.
Will $LYN break higher or lose momentum? The next move matters!
$LYN JUMPS 14.03% — BULLISH MOMENTUM BUILDS!
Everlyn AI ($LYN ) is pushing higher!
Price: $0.020878 24H Change: +14.03% Market Cap: $5.34M On-Chain Liquidity: $93.03K FDV: $20.88M
Resistance: $0.0210–$0.0220 🛡️ Support: $0.0200, then $0.0190
A clean breakout could extend the rally, but rejection near resistance may trigger a pullback.
Will $LYN break higher or lose momentum? The next move matters!
Everlyn AI ($LYN ) is pushing higher!
Price: $0.020878 24H Change: +14.03% Market Cap: $5.34M On-Chain Liquidity: $93.03K FDV: $20.88M
Resistance: $0.0210–$0.0220 🛡️ Support: $0.0200, then $0.0190
A clean breakout could extend the rally, but rejection near resistance may trigger a pullback.
Will $LYN break higher or lose momentum? The next move matters!
329
·
--
Bullish
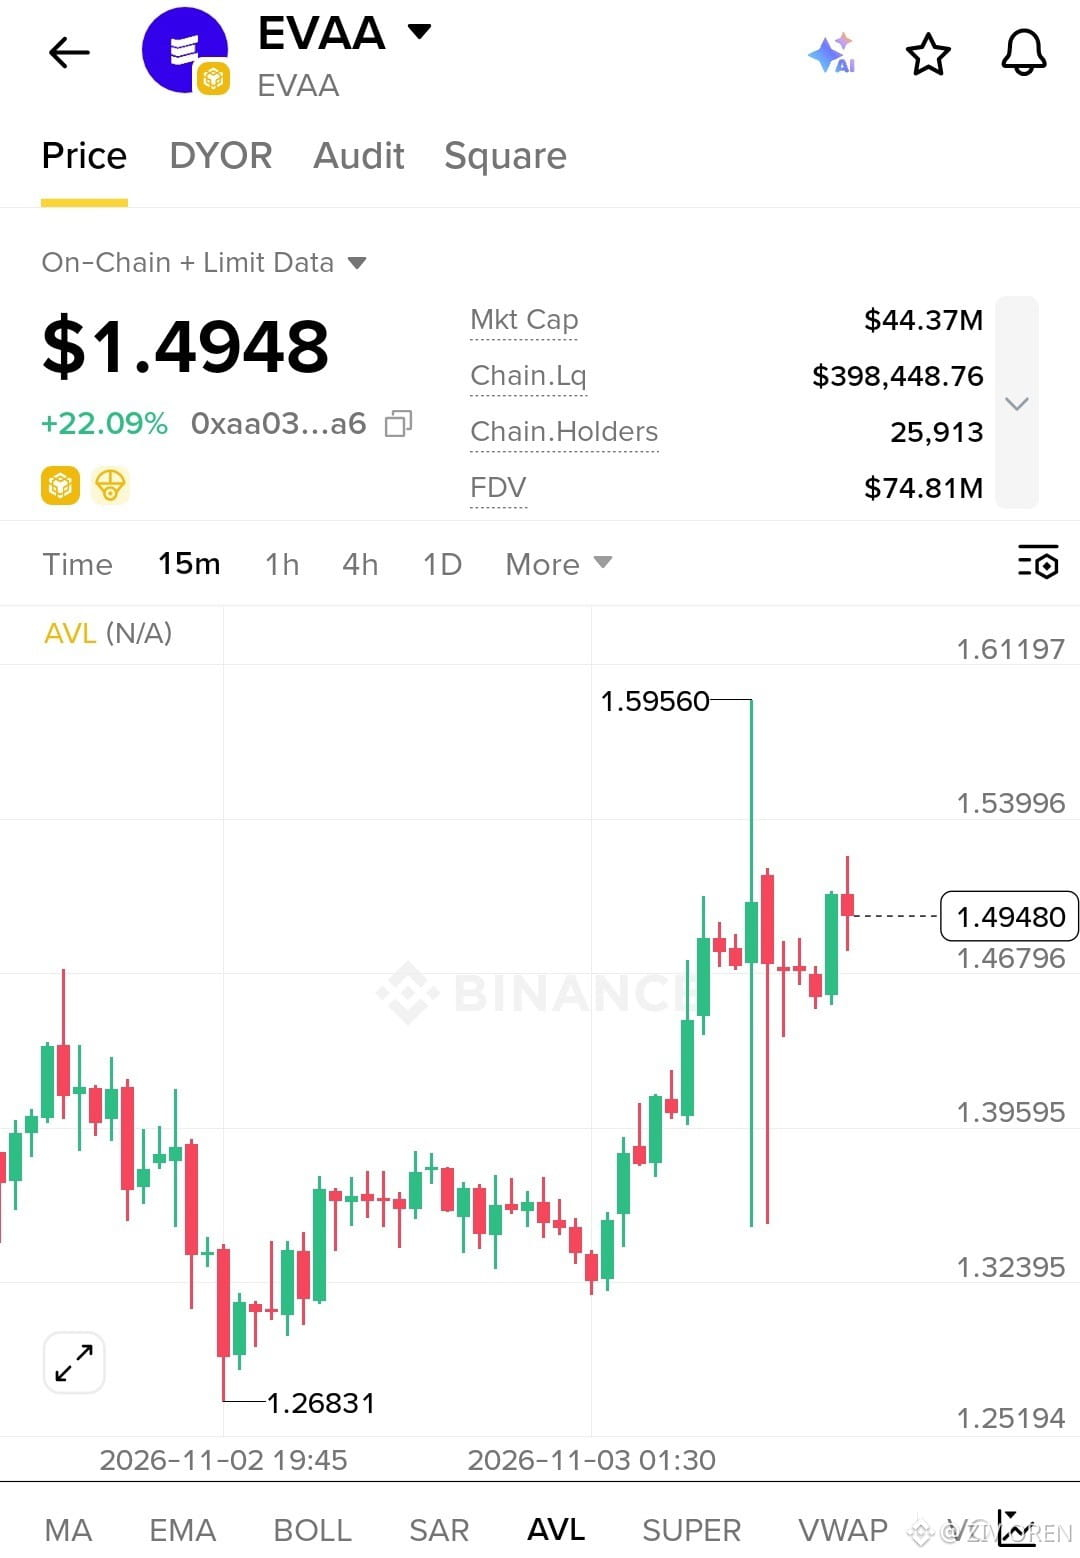
$EVAA SURGES 22.09% — BULLS TAKE CONTROL!
$EVAA is making a powerful move!
Price: $1.4948 24H Move: +22.09% Market Cap: $44.37M On-Chain Liquidity: $398.45K Recent High: $1.5956
Bullish Watch: A breakout above $1.50 could bring the $1.54–$1.60 resistance zone into focus.
Support to watch: $1.468. Losing this level could trigger a pullback.
Momentum is heating up, but volatility remains high. Can $EVAA break higher and extend the rally?
$EVAA SURGES 22.09% — BULLS TAKE CONTROL!
$EVAA is making a powerful move!
Price: $1.4948 24H Move: +22.09% Market Cap: $44.37M On-Chain Liquidity: $398.45K Recent High: $1.5956
Bullish Watch: A breakout above $1.50 could bring the $1.54–$1.60 resistance zone into focus.
Support to watch: $1.468. Losing this level could trigger a pullback.
Momentum is heating up, but volatility remains high. Can $EVAA break higher and extend the rally?
$EVAA is making a powerful move!
Price: $1.4948 24H Move: +22.09% Market Cap: $44.37M On-Chain Liquidity: $398.45K Recent High: $1.5956
Bullish Watch: A breakout above $1.50 could bring the $1.54–$1.60 resistance zone into focus.
Support to watch: $1.468. Losing this level could trigger a pullback.
Momentum is heating up, but volatility remains high. Can $EVAA break higher and extend the rally?
279
·
--
Bullish
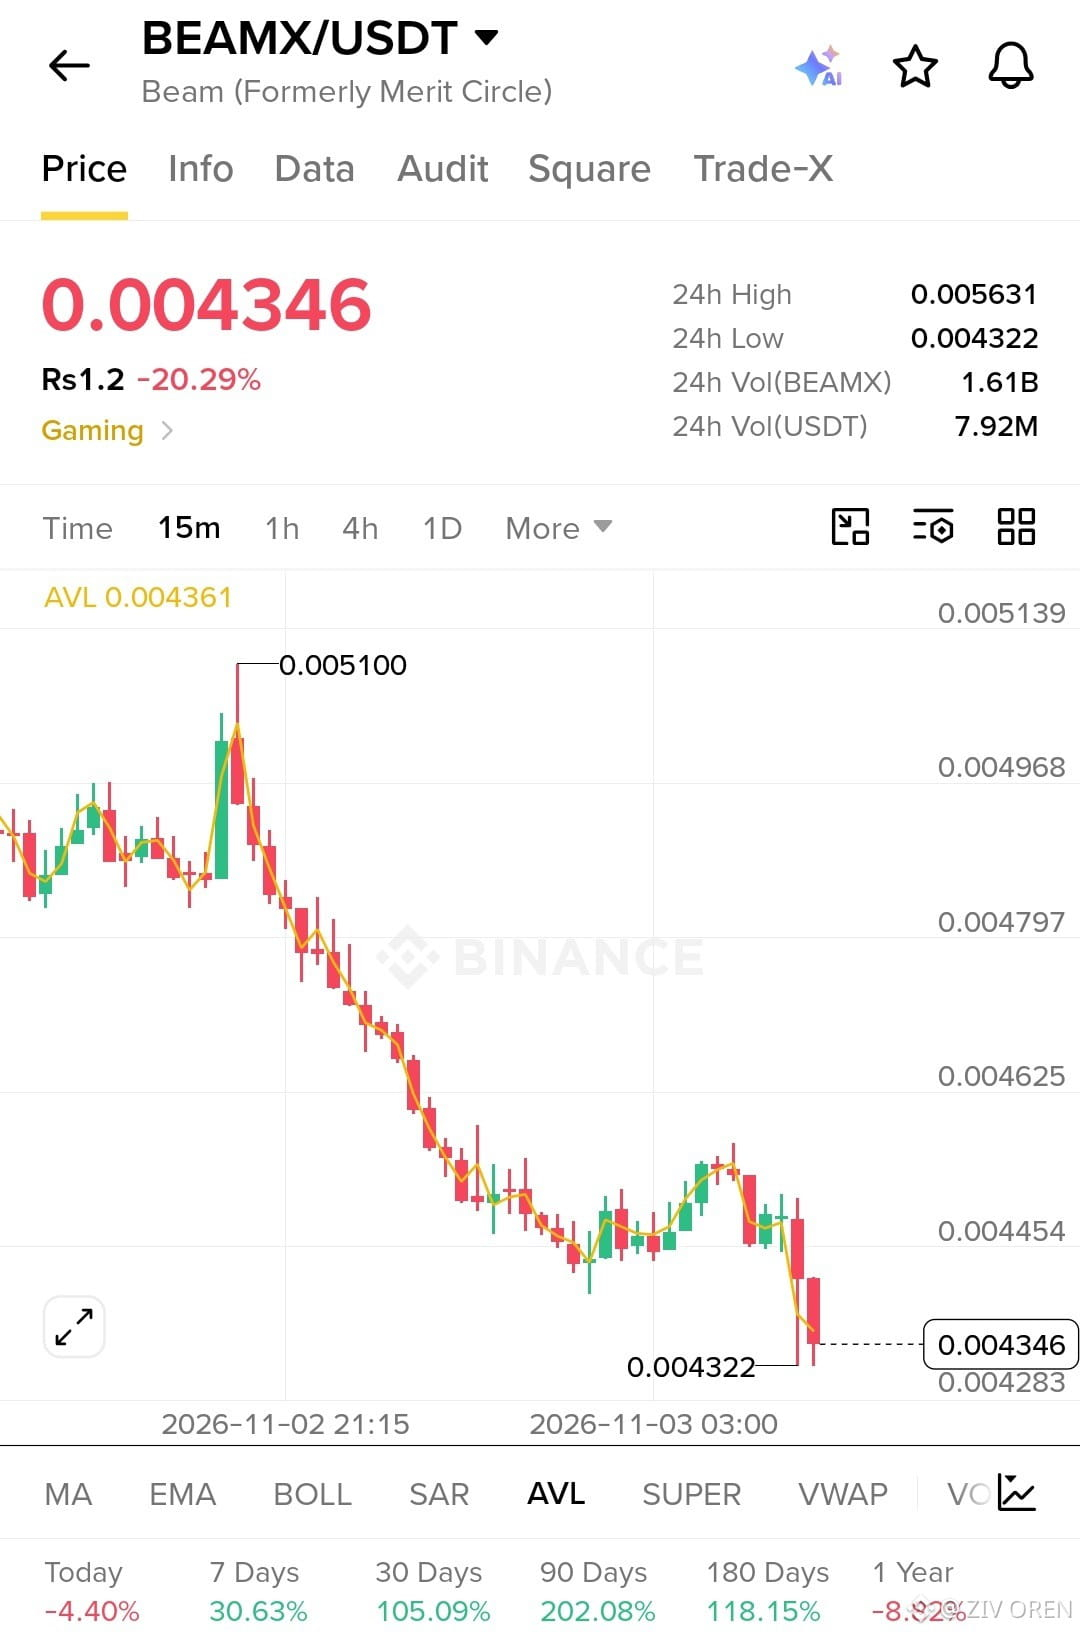
$BEAMX CRASHES 20.29% — SELLING PRESSURE INTENSIFIES!
$BEAMX is trading at $0.004346, down 20.29% in 24 hours!
24H High: $0.005631 24H Low: $0.004322 24H Volume: $7.92M
Price is hovering near its 24-hour low as bearish momentum dominates the 15-minute chart.
Key Level: $0.004322 — a breakdown could bring further downside, while a strong recovery may signal a short-term bounce.
Will $BEAMX bounce back or plunge lower? The next move is critical!
$BEAMX CRASHES 20.29% — SELLING PRESSURE INTENSIFIES!
$BEAMX is trading at $0.004346, down 20.29% in 24 hours!
24H High: $0.005631 24H Low: $0.004322 24H Volume: $7.92M
Price is hovering near its 24-hour low as bearish momentum dominates the 15-minute chart.
Key Level: $0.004322 — a breakdown could bring further downside, while a strong recovery may signal a short-term bounce.
Will $BEAMX bounce back or plunge lower? The next move is critical!
$BEAMX is trading at $0.004346, down 20.29% in 24 hours!
24H High: $0.005631 24H Low: $0.004322 24H Volume: $7.92M
Price is hovering near its 24-hour low as bearish momentum dominates the 15-minute chart.
Key Level: $0.004322 — a breakdown could bring further downside, while a strong recovery may signal a short-term bounce.
Will $BEAMX bounce back or plunge lower? The next move is critical!
1
434
·
--
Bullish
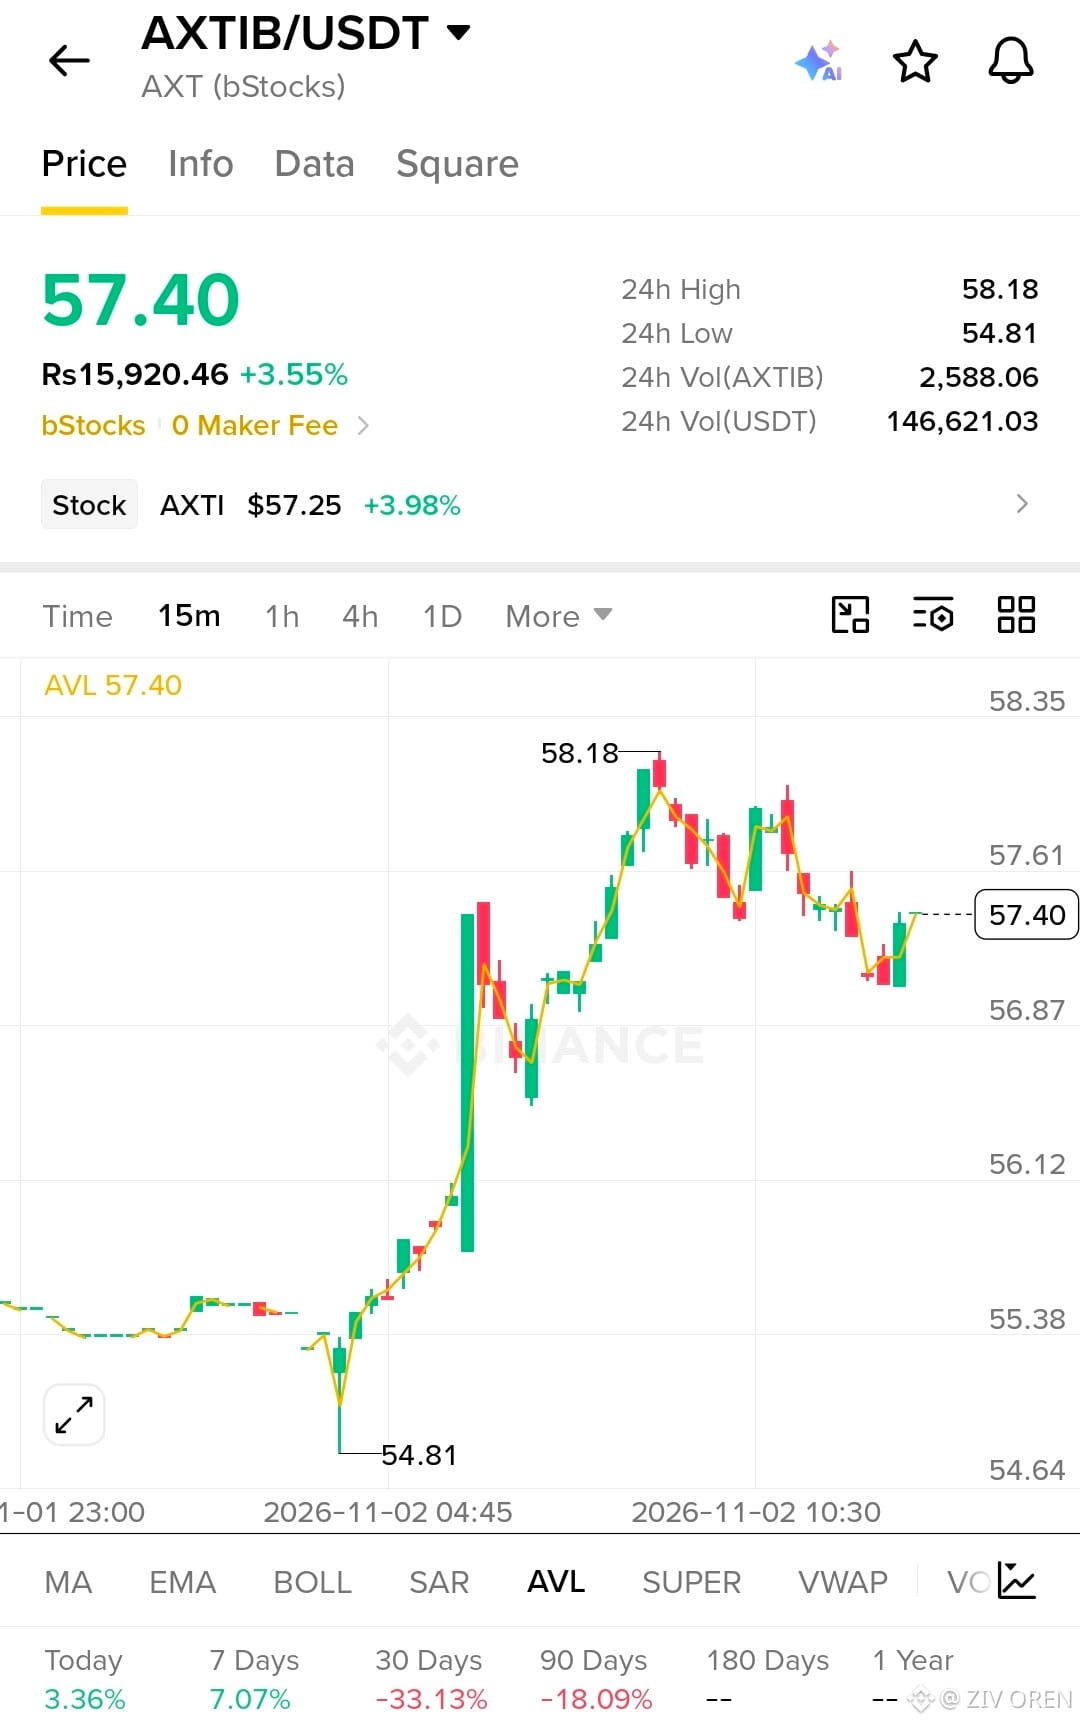
$AXTI SURGES 3.55% — BULLS TARGET $58.18!
AXTIB is heating up! The token is trading at $57.40, up 3.55%, after bouncing strongly from its 24H low of $54.81.
Key Levels:
* Current Price: $57.40
* 24H High: $58.18
* Support: $56.87
* Resistance: $58.18
Market Impact: A breakout above $58.18 could signal another bullish push, while rejection may trigger a pullback toward support.
Bulls are testing the ceiling — will $58.18 break or reject?
$AXTI SURGES 3.55% — BULLS TARGET $58.18!
AXTIB is heating up! The token is trading at $57.40, up 3.55%, after bouncing strongly from its 24H low of $54.81.
Key Levels:
* Current Price: $57.40
* 24H High: $58.18
* Support: $56.87
* Resistance: $58.18
Market Impact: A breakout above $58.18 could signal another bullish push, while rejection may trigger a pullback toward support.
Bulls are testing the ceiling — will $58.18 break or reject?
AXTIB is heating up! The token is trading at $57.40, up 3.55%, after bouncing strongly from its 24H low of $54.81.
Key Levels:
* Current Price: $57.40
* 24H High: $58.18
* Support: $56.87
* Resistance: $58.18
Market Impact: A breakout above $58.18 could signal another bullish push, while rejection may trigger a pullback toward support.
Bulls are testing the ceiling — will $58.18 break or reject?
532
Log in to explore more content
Join global crypto users on Binance Square
⚡️ Get latest and useful information about crypto.
💬 Trusted by the world’s largest crypto exchange.
👍 Discover real insights from verified creators.
Email / Phone number
Trending Topics
JobsReportRaisesHikeOdds
365,848 views
2,739 Discussing
TradFi News | US Adds 165,000 Jobs in October, More Than Double the 65,000 Forecast, as Unemployment Falls to 4.1%
Binance News
·39 Likes
·23.7k views
CPITestsDecemberRateOutlook
77,506 views
751 Discussing
BitcoinRebounds$75KAsChipsLead
31,240 views
273 Discussing