
zidanff41
495 Posts

zidanff41
Report
Block User
429 Following
34 Followers
69 Liked
Posts
All
Quotes
·
--
$BNB $BTC
The whole market is falling in the same way... How far have we come?
Since the U.S. market opened, we’ve seen that the decline wasn’t limited to a single currency—it was widespread:
• BNB fell from $599 to $578 • COIN fell from $116 to $111, then rebounded • SOL fell from $74.98 to $73.37 • U.S. stocks such as IGV and SOXX fell in the same way
This isn’t a random decline, but a **collective sell-off**, caused by liquidity outflows and traders’ fear at the opening.
What does this mean?
When the whole market falls in the same way, it means sellers are in control at that moment, while buyers are waiting below, near the lows, to gather liquidity.
The bottom isn’t a place to be afraid; it’s where rebounds begin. We saw that today:
Those who entered at the bottom made a profit on the rebound.$AMZNB
Those who entered at the top left at a loss.
The takeaway:
Don’t enter in the middle of the sell-off, and don’t sell at the bottom.
Wait for the decline to stop and a new bottom to form, then enter calmly, with a clear stop-loss and a clear target.
$BNB $BTC
The whole market is falling in the same way... How far have we come?
Since the U.S. market opened, we’ve seen that the decline wasn’t limited to a single currency—it was widespread:
• BNB fell from $599 to $578 • COIN fell from $116 to $111, then rebounded • SOL fell from $74.98 to $73.37 • U.S. stocks such as IGV and SOXX fell in the same way
This isn’t a random decline, but a **collective sell-off**, caused by liquidity outflows and traders’ fear at the opening.
What does this mean?
When the whole market falls in the same way, it means sellers are in control at that moment, while buyers are waiting below, near the lows, to gather liquidity.
The bottom isn’t a place to be afraid; it’s where rebounds begin. We saw that today:
Those who entered at the bottom made a profit on the rebound.$AMZNB
Those who entered at the top left at a loss.
The takeaway:
Don’t enter in the middle of the sell-off, and don’t sell at the bottom.
Wait for the decline to stop and a new bottom to form, then enter calmly, with a clear stop-loss and a clear target.
The whole market is falling in the same way... How far have we come?
Since the U.S. market opened, we’ve seen that the decline wasn’t limited to a single currency—it was widespread:
• BNB fell from $599 to $578 • COIN fell from $116 to $111, then rebounded • SOL fell from $74.98 to $73.37 • U.S. stocks such as IGV and SOXX fell in the same way
This isn’t a random decline, but a **collective sell-off**, caused by liquidity outflows and traders’ fear at the opening.
What does this mean?
When the whole market falls in the same way, it means sellers are in control at that moment, while buyers are waiting below, near the lows, to gather liquidity.
The bottom isn’t a place to be afraid; it’s where rebounds begin. We saw that today:
Those who entered at the bottom made a profit on the rebound.$AMZNB
Those who entered at the top left at a loss.
The takeaway:
Don’t enter in the middle of the sell-off, and don’t sell at the bottom.
Wait for the decline to stop and a new bottom to form, then enter calmly, with a clear stop-loss and a clear target.
1
4
·
--
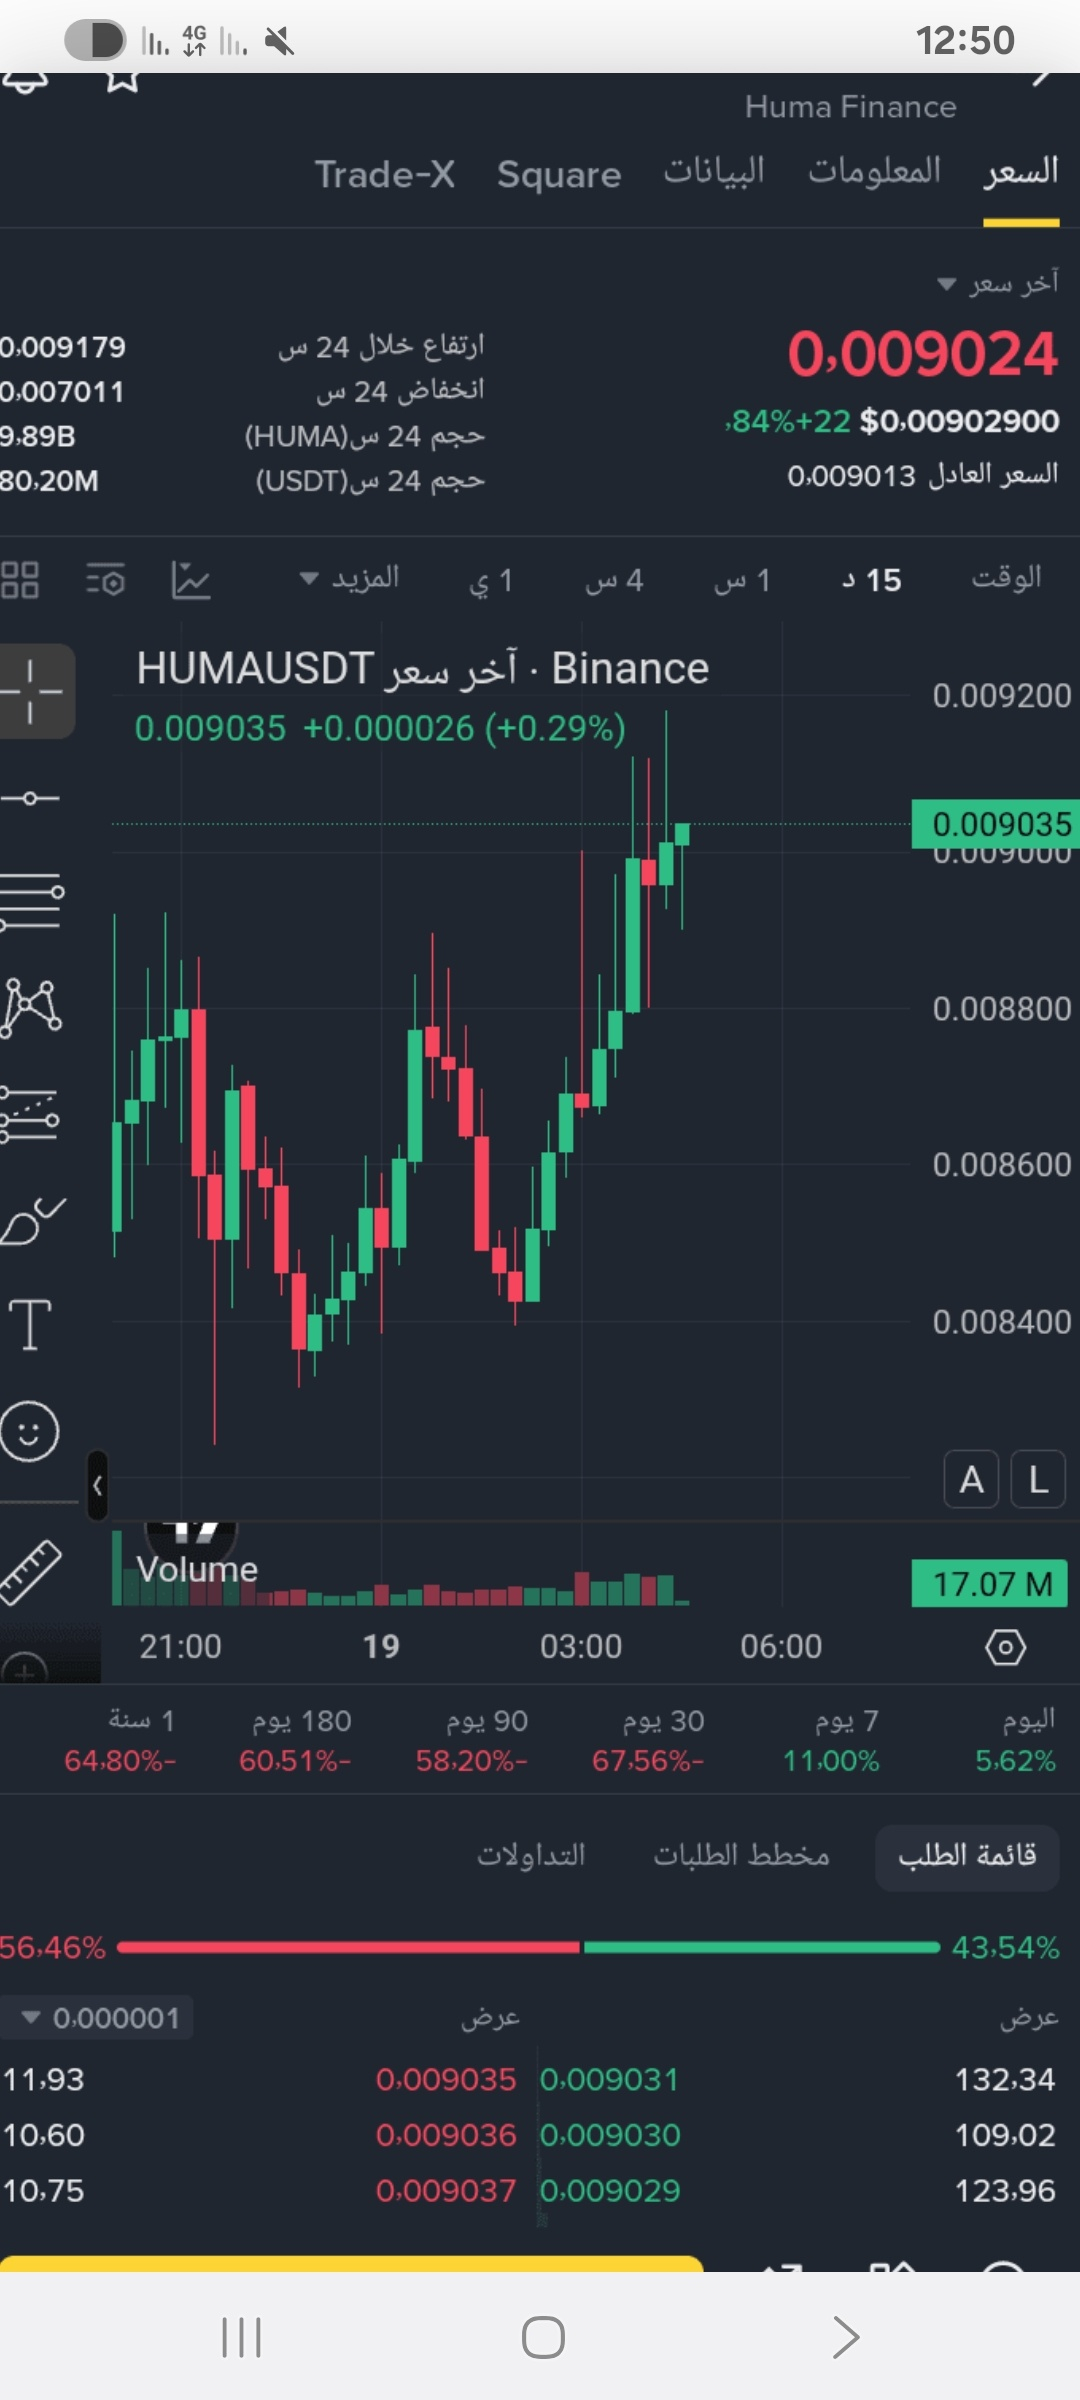
Quickly on $HUMA
{future}(HUMAUSDT)
Entry now: sell from 0.09050 or 0.09200
First target 0.08800
Second 0.08600
Third 0.08400
Last 0.08200
Stop loss above 0.09750#BTCRemainsUnderPressureAfterHawkishFOMCMinutes #CanGTA6'sLaunchLiftTTWOShares? #FOMCMinutesHighlightAIDebtRisks
Quickly on $HUMA
Entry now: sell from 0.09050 or 0.09200
First target 0.08800
Second 0.08600
Third 0.08400
Last 0.08200
Stop loss above 0.09750#BTCRemainsUnderPressureAfterHawkishFOMCMinutes #CanGTA6'sLaunchLiftTTWOShares? #FOMCMinutesHighlightAIDebtRisks
Entry now: sell from 0.09050 or 0.09200
First target 0.08800
Second 0.08600
Third 0.08400
Last 0.08200
Stop loss above 0.09750#BTCRemainsUnderPressureAfterHawkishFOMCMinutes #CanGTA6'sLaunchLiftTTWOShares? #FOMCMinutesHighlightAIDebtRisks
1
36
·
--
بيع $BTW 🛑
$BTW
{future}(BTWUSDT)
دائم
0.6009
+31.17%
منطقة الدخول 0.59/0.63📊
اهداف 0.57 وتحت 🚀
ايقاف 0.77 🔐
دخول 1%#BTCRemainsUnderPressureAfterHawkishFOMCMinutes #CanGTA6'sLaunchLiftTTWOShares? #FOMCMinutesHighlightAIDebtRisks #AntInternationalLaunchesWhaleProtocol
بيع $BTW 🛑
$BTW
دائم
0.6009
+31.17%
منطقة الدخول 0.59/0.63📊
اهداف 0.57 وتحت 🚀
ايقاف 0.77 🔐
دخول 1%#BTCRemainsUnderPressureAfterHawkishFOMCMinutes #CanGTA6'sLaunchLiftTTWOShares? #FOMCMinutesHighlightAIDebtRisks #AntInternationalLaunchesWhaleProtocol
$BTW
دائم
0.6009
+31.17%
منطقة الدخول 0.59/0.63📊
اهداف 0.57 وتحت 🚀
ايقاف 0.77 🔐
دخول 1%#BTCRemainsUnderPressureAfterHawkishFOMCMinutes #CanGTA6'sLaunchLiftTTWOShares? #FOMCMinutesHighlightAIDebtRisks #AntInternationalLaunchesWhaleProtocol
97
·
--
Holding $BTC 0.6 USDT
$BTC
{future}(BTCUSDT)
Buy
Entry: 0.00004620 – 0.00004660
Target 1: 0.00004720
Target 2: 0.00004800
Target 3: 0.00004900
Stop loss: 0.00004540
Trade$QCOMB #BTCRemainsUnderPressureAfterHawkishFOMCMinutes #CapitalGroupAdds1264500StrategyShares #SouthKoreaPlansToLet3500ListedFirmsBuyBitcoin
$BTC
Buy
Entry: 0.00004620 – 0.00004660
Target 1: 0.00004720
Target 2: 0.00004800
Target 3: 0.00004900
Stop loss: 0.00004540
Trade$QCOMB #BTCRemainsUnderPressureAfterHawkishFOMCMinutes #CapitalGroupAdds1264500StrategyShares #SouthKoreaPlansToLet3500ListedFirmsBuyBitcoin
Buy
Entry: 0.00004620 – 0.00004660
Target 1: 0.00004720
Target 2: 0.00004800
Target 3: 0.00004900
Stop loss: 0.00004540
Trade$QCOMB #BTCRemainsUnderPressureAfterHawkishFOMCMinutes #CapitalGroupAdds1264500StrategyShares #SouthKoreaPlansToLet3500ListedFirmsBuyBitcoin
1
33
·
--
Buy trade (1-hour timeframe)
📍 Entry zones:$SOL
{future}(SOLUSDT)
Support retest: near $72.91–$73.10
(or near $72.22), provided a clear reversal signal appears and support is not broken by an hourly candle close.
Or confirmation entry: after a breakout, consolidation, and an hourly candle close above $73.94, with improving momentum.
🎯 Targets (Take Profit):
First target: $73.94
Second target: $74.98
Third target: $75.78–$76.02
🛑 Stop Loss:
Below $72.00 (or a clear close below the $72.22 support zone).
💡 Technical note: The MACD indicator is still negative (DIF: -0.12 / DEA: -0.06), so it is best to scale into the position and secure profits gradually while strictly adhering to risk management. #BTCRemainsUnderPressureAfterHawkishFOMCMinutes #NvidiaBoardReportedlySplitOverHuang’sReturn #CanGTA6'sLaunchLiftTTWOShares? #FOMCMinutesHighlightAIDebtRisks #AntInternationalLaunchesWhaleProtocol
Buy trade (1-hour timeframe)
📍 Entry zones:$SOL
Support retest: near $72.91–$73.10
(or near $72.22), provided a clear reversal signal appears and support is not broken by an hourly candle close.
Or confirmation entry: after a breakout, consolidation, and an hourly candle close above $73.94, with improving momentum.
🎯 Targets (Take Profit):
First target: $73.94
Second target: $74.98
Third target: $75.78–$76.02
🛑 Stop Loss:
Below $72.00 (or a clear close below the $72.22 support zone).
💡 Technical note: The MACD indicator is still negative (DIF: -0.12 / DEA: -0.06), so it is best to scale into the position and secure profits gradually while strictly adhering to risk management. #BTCRemainsUnderPressureAfterHawkishFOMCMinutes #NvidiaBoardReportedlySplitOverHuang’sReturn #CanGTA6'sLaunchLiftTTWOShares? #FOMCMinutesHighlightAIDebtRisks #AntInternationalLaunchesWhaleProtocol
📍 Entry zones:$SOL
Support retest: near $72.91–$73.10
(or near $72.22), provided a clear reversal signal appears and support is not broken by an hourly candle close.
Or confirmation entry: after a breakout, consolidation, and an hourly candle close above $73.94, with improving momentum.
🎯 Targets (Take Profit):
First target: $73.94
Second target: $74.98
Third target: $75.78–$76.02
🛑 Stop Loss:
Below $72.00 (or a clear close below the $72.22 support zone).
💡 Technical note: The MACD indicator is still negative (DIF: -0.12 / DEA: -0.06), so it is best to scale into the position and secure profits gradually while strictly adhering to risk management. #BTCRemainsUnderPressureAfterHawkishFOMCMinutes #NvidiaBoardReportedlySplitOverHuang’sReturn #CanGTA6'sLaunchLiftTTWOShares? #FOMCMinutesHighlightAIDebtRisks #AntInternationalLaunchesWhaleProtocol
1
5
·
--
$BTC
{future}(BTCUSDT)
Gives traders an exciting experience! 😳
This kind of price action isn't for the faint of heart!
First, the sudden drop caught many traders with long positions off guard. Then came a sharp recovery, putting traders with short positions in a bind.
Both sides got a painful reminder that the market can change direction when nobody expects it. 😂
Honestly, trading amid this much volatility is extremely risky. One wrong move, and you could lose your position in seconds.
Would you take a chance on $BITO at these levels, or is watching from the sidelines the smarter choice? 👀🔥#BTCRemainsUnderPressureAfterHawkishFOMCMinutes #SouthKoreaPlansToLet3500ListedFirmsBuyBitcoin #AnthropicGrayMarketSharesPointTo22%To26%Gains
$BTC
Gives traders an exciting experience! 😳
This kind of price action isn't for the faint of heart!
First, the sudden drop caught many traders with long positions off guard. Then came a sharp recovery, putting traders with short positions in a bind.
Both sides got a painful reminder that the market can change direction when nobody expects it. 😂
Honestly, trading amid this much volatility is extremely risky. One wrong move, and you could lose your position in seconds.
Would you take a chance on $BITO at these levels, or is watching from the sidelines the smarter choice? 👀🔥#BTCRemainsUnderPressureAfterHawkishFOMCMinutes #SouthKoreaPlansToLet3500ListedFirmsBuyBitcoin #AnthropicGrayMarketSharesPointTo22%To26%Gains
Gives traders an exciting experience! 😳
This kind of price action isn't for the faint of heart!
First, the sudden drop caught many traders with long positions off guard. Then came a sharp recovery, putting traders with short positions in a bind.
Both sides got a painful reminder that the market can change direction when nobody expects it. 😂
Honestly, trading amid this much volatility is extremely risky. One wrong move, and you could lose your position in seconds.
Would you take a chance on $BITO at these levels, or is watching from the sidelines the smarter choice? 👀🔥#BTCRemainsUnderPressureAfterHawkishFOMCMinutes #SouthKoreaPlansToLet3500ListedFirmsBuyBitcoin #AnthropicGrayMarketSharesPointTo22%To26%Gains
1
3
·
--
$BTC
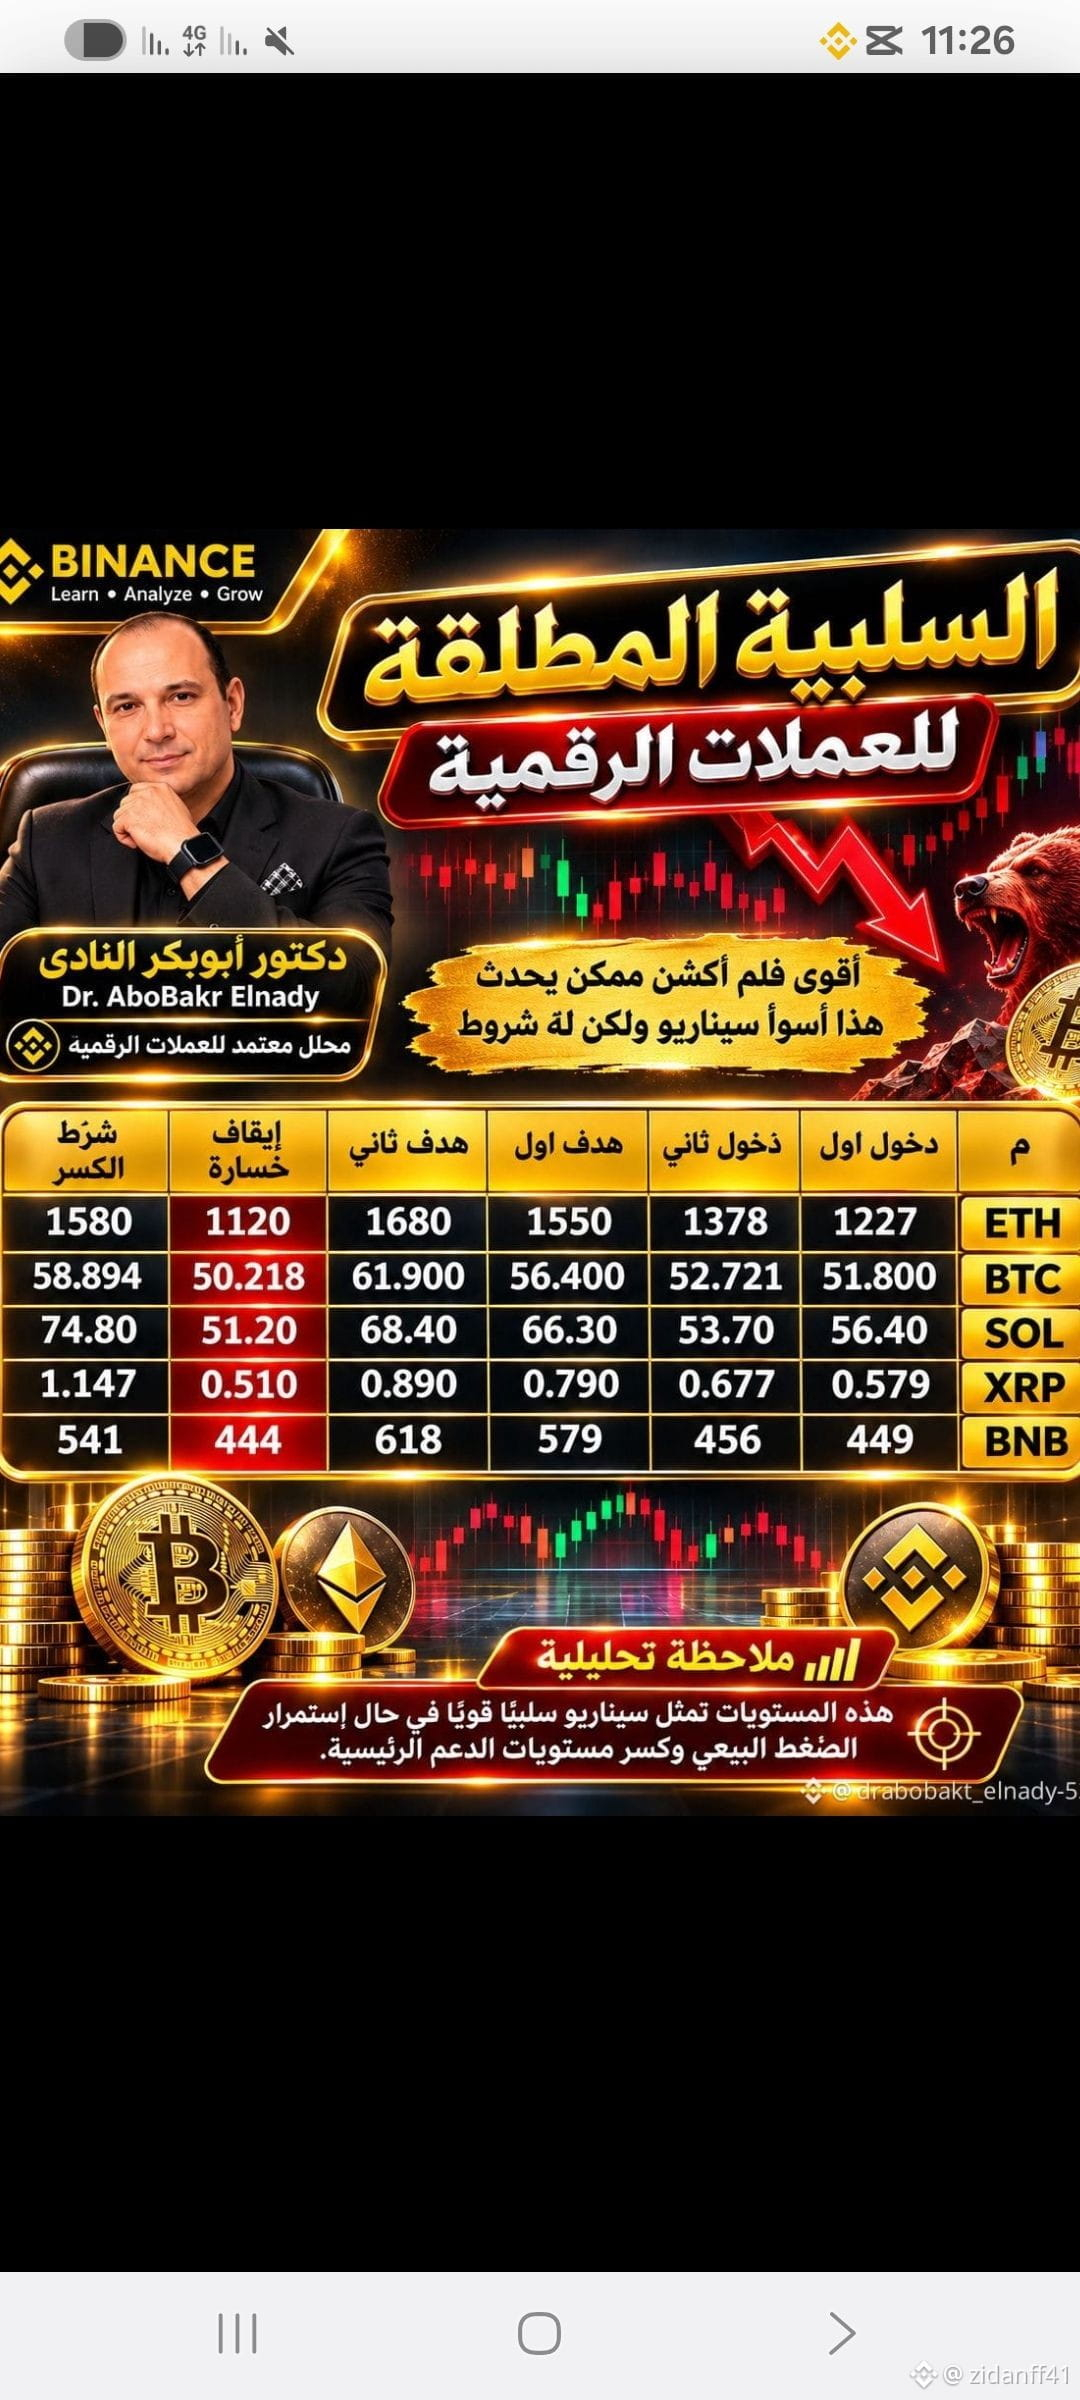
Just as we consider the bullish scenario, we need to be prepared for the bearish one. Here, the bearish scenario would involve breaking below the 61.80 level and confirming a break below Bitcoin’s electric pulse area at 56,700.
You need to be prepared for the scenario shown in this image.
$BTC
Just as we consider the bullish scenario, we need to be prepared for the bearish one. Here, the bearish scenario would involve breaking below the 61.80 level and confirming a break below Bitcoin’s electric pulse area at 56,700.
You need to be prepared for the scenario shown in this image.
Just as we consider the bullish scenario, we need to be prepared for the bearish one. Here, the bearish scenario would involve breaking below the 61.80 level and confirming a break below Bitcoin’s electric pulse area at 56,700.
You need to be prepared for the scenario shown in this image.
1
47
·
--
Heading toward another major correction
Short sell $BTW
Entry: 0.640 – 0.740
Stop loss: 0.900
Target 1: 0.5900
Target 2: 0.5600#BTCRemainsUnderPressureAfterHawkishFOMCMinutes
Target 3: 0.5150
Target 4: 0.4500
🫂 Join the Binance chat group to improve your trading skills, and let’s profit together on every trade.#FOMCMinutesHighlightAIDebtRisks #AnthropicGrayMarketSharesPointTo22%To26%Gains #NvidiaBoardReportedlySplitOverHuang’sReturn $
Trade $
Heading toward another major correction
Short sell $BTW
Entry: 0.640 – 0.740
Stop loss: 0.900
Target 1: 0.5900
Target 2: 0.5600#BTCRemainsUnderPressureAfterHawkishFOMCMinutes
Target 3: 0.5150
Target 4: 0.4500
🫂 Join the Binance chat group to improve your trading skills, and let’s profit together on every trade.#FOMCMinutesHighlightAIDebtRisks #AnthropicGrayMarketSharesPointTo22%To26%Gains #NvidiaBoardReportedlySplitOverHuang’sReturn $
Trade $
Short sell $BTW
Entry: 0.640 – 0.740
Stop loss: 0.900
Target 1: 0.5900
Target 2: 0.5600#BTCRemainsUnderPressureAfterHawkishFOMCMinutes
Target 3: 0.5150
Target 4: 0.4500
🫂 Join the Binance chat group to improve your trading skills, and let’s profit together on every trade.#FOMCMinutesHighlightAIDebtRisks #AnthropicGrayMarketSharesPointTo22%To26%Gains #NvidiaBoardReportedlySplitOverHuang’sReturn $
Trade $

FREE CRYPTO
·
--
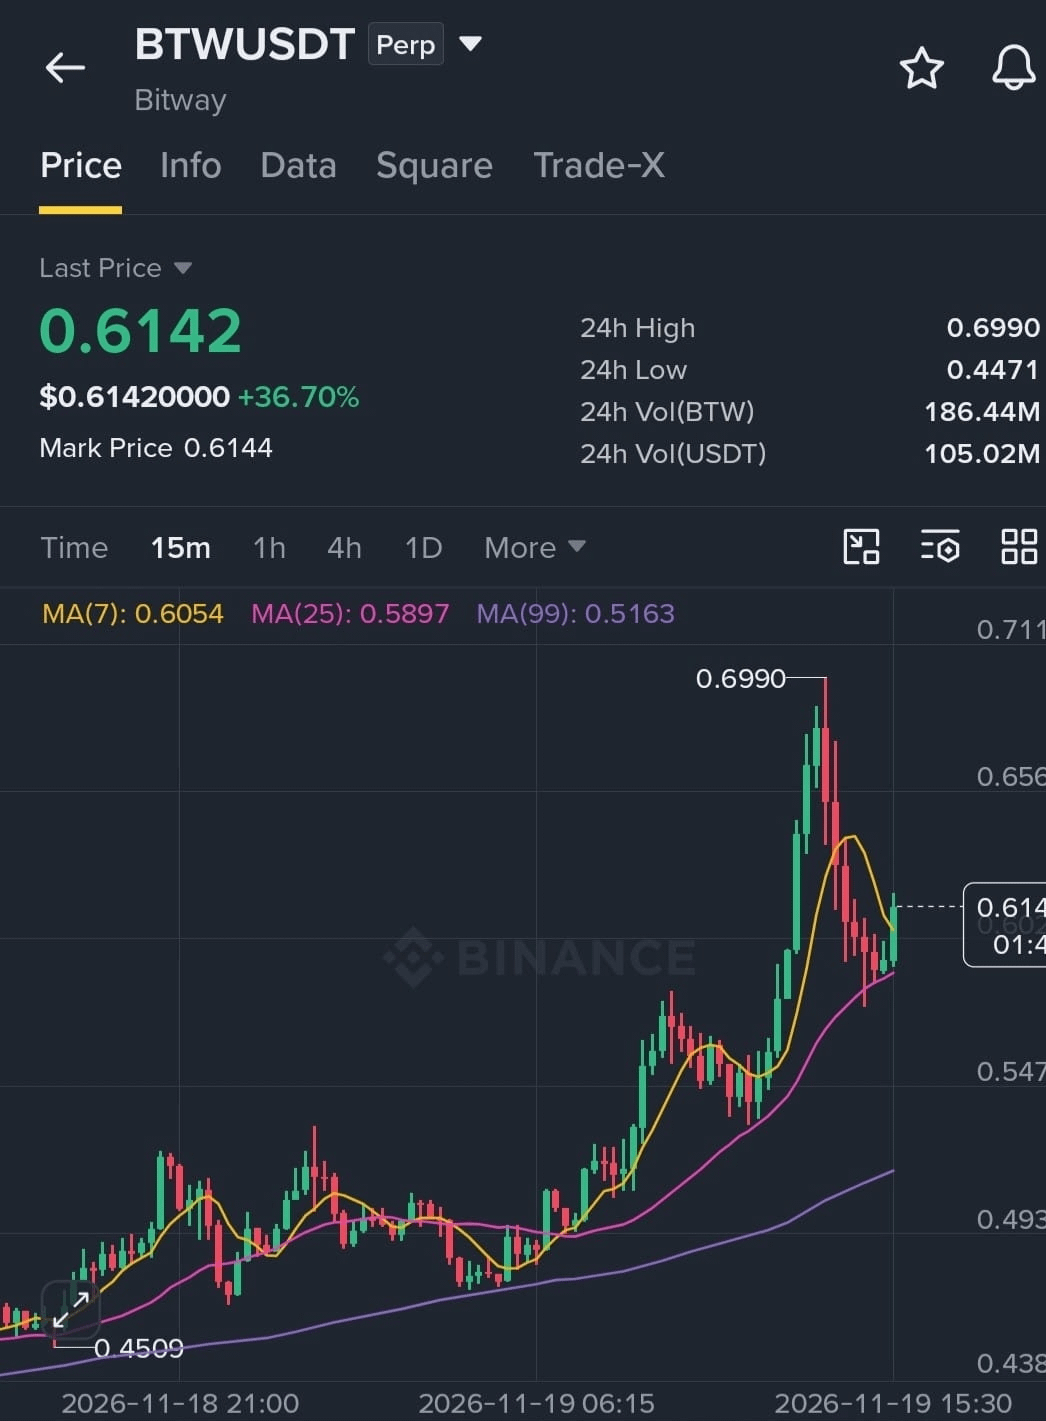
$BTW We are heading toward another major correction
Short sell $BTW
Entry: 0.640 – 0.740
Stop loss: 0.900
Target 1: 0.5900
Target 2: 0.5600
Target 3: 0.5150
Target 4: 0.4500
🫂 Join the Binance chat group to improve your trading skills, and let's profit together on every trade.
Trade $BTW #BTCRemainsUnderPressureAfterHawkishFOMCMinutes #NvidiaBoardReportedlySplitOverHuang’sReturn #CanGTA6'sLaunchLiftTTWOShares? #AnthropicGrayMarketSharesPointTo22%To26%Gains #SouthKoreaPlansToLet3500ListedFirmsBuyBitcoin
here 👇
Short sell $BTW
Entry: 0.640 – 0.740
Stop loss: 0.900
Target 1: 0.5900
Target 2: 0.5600
Target 3: 0.5150
Target 4: 0.4500
🫂 Join the Binance chat group to improve your trading skills, and let's profit together on every trade.
Trade $BTW #BTCRemainsUnderPressureAfterHawkishFOMCMinutes #NvidiaBoardReportedlySplitOverHuang’sReturn #CanGTA6'sLaunchLiftTTWOShares? #AnthropicGrayMarketSharesPointTo22%To26%Gains #SouthKoreaPlansToLet3500ListedFirmsBuyBitcoin
here 👇
1
10
·
--
$CVX.US The downward wave has ended. Bitcoin is holding firm, repeatedly rejecting drops below the 62k level. All the liquidity is accumulating to the upside... I expect a sudden upward surge to close short positions.
$CVX.US The downward wave has ended. Bitcoin is holding firm, repeatedly rejecting drops below the 62k level. All the liquidity is accumulating to the upside... I expect a sudden upward surge to close short positions.
BTC-0.65%
CVXUS+0.02%
1
32
·
--
$BTC
Entry: 63600
The price rose to test 64952 and was rejected twice, and now it’s back trading at 63618. That means the upward momentum is starting to cool, and the red candles are getting longer than the green ones.
🎯 Sell targets
62500
61200
60000
🛑 Stop loss: 65200
The idea here is that the peak is already in, and every attempt to move back up is failing. So, any sustained move below 62500 opens the way down to 61200, followed by 60000.
If the price comes back and closes a one-hour candle above 65200, exit the trade immediately, because that would mean the rejection we saw was a fake-out and the price will keep rising.
$BTC
$BTC
Entry: 63600
The price rose to test 64952 and was rejected twice, and now it’s back trading at 63618. That means the upward momentum is starting to cool, and the red candles are getting longer than the green ones.
🎯 Sell targets
62500
61200
60000
🛑 Stop loss: 65200
The idea here is that the peak is already in, and every attempt to move back up is failing. So, any sustained move below 62500 opens the way down to 61200, followed by 60000.
If the price comes back and closes a one-hour candle above 65200, exit the trade immediately, because that would mean the rejection we saw was a fake-out and the price will keep rising.
$BTC
Entry: 63600
The price rose to test 64952 and was rejected twice, and now it’s back trading at 63618. That means the upward momentum is starting to cool, and the red candles are getting longer than the green ones.
🎯 Sell targets
62500
61200
60000
🛑 Stop loss: 65200
The idea here is that the peak is already in, and every attempt to move back up is failing. So, any sustained move below 62500 opens the way down to 61200, followed by 60000.
If the price comes back and closes a one-hour candle above 65200, exit the trade immediately, because that would mean the rejection we saw was a fake-out and the price will keep rising.
$BTC
1
9
·
--
: Amazing giveaway! 🎉
Get ready for an incredible giveaway! 🚀
Don’t miss the chance to win amazing prizes. Stay active, follow the instructions, and join now!
Good luck to everyone! ❤️
#Givewaytime EAWAY #CryptoCommunitys mmunity #binanc eSquare #sol 🎁
: Amazing giveaway! 🎉
Get ready for an incredible giveaway! 🚀
Don’t miss the chance to win amazing prizes. Stay active, follow the instructions, and join now!
Good luck to everyone! ❤️
#Givewaytime EAWAY #CryptoCommunitys mmunity #binanc eSquare #sol 🎁
Get ready for an incredible giveaway! 🚀
Don’t miss the chance to win amazing prizes. Stay active, follow the instructions, and join now!
Good luck to everyone! ❤️
#Givewaytime EAWAY #CryptoCommunitys mmunity #binanc eSquare #sol 🎁

Raselvai1
·
--
🎁 Exciting Giveaway Alert! 🎉
Get ready for an amazing giveaway! 🚀
Don't miss your chance to win exciting rewards. Stay active, follow the instructions, and participate now!
Good luck, everyone! ❤️
#GIVEAWAY #CryptoCommunity #BinanceSquare #sol
Get ready for an amazing giveaway! 🚀
Don't miss your chance to win exciting rewards. Stay active, follow the instructions, and participate now!
Good luck, everyone! ❤️
#GIVEAWAY #CryptoCommunity #BinanceSquare #sol
1
7
·
--
I think over the next two days we'll see Bitcoin touch the 58,000 level, and God knows best!!tc $BNB NB $SOL L
and let's not forget its siblings, those holding Solana and BNB$NVDAB
I think over the next two days we'll see Bitcoin touch the 58,000 level, and God knows best!!tc $BNB NB $SOL L
and let's not forget its siblings, those holding Solana and BNB$NVDAB
and let's not forget its siblings, those holding Solana and BNB$NVDAB
1
8
·
--
Data | Top 5 contracts with the biggest gains in 24 hours
1.$NAORIS
{future}(NAORISUSDT)
RIS +50.66%
2. $IRYS YS +41.34%
3. $VELVET +37.13%
4. ICNT +32.22%
5. BTW +30.73%
First place: $NAORIS +50.66%, meaning the gain exceeded half.
How do you usually handle a situation like this?
#BTCRemainsUnderPressureAfterHawkishFOMCMinutes #NvidiaBoardReportedlySplitOverHuang’sReturn #NvidiaBoardReportedlySplitOverHuang’sReturn #CanGTA6'sLaunchLiftTTWOShares? ؟#SouthKoreaPlansToLet3500ListedFirmsBuyBitcoin
Data | Top 5 contracts with the biggest gains in 24 hours
1.$NAORIS
RIS +50.66%
2. $IRYS YS +41.34%
3. $VELVET +37.13%
4. ICNT +32.22%
5. BTW +30.73%
First place: $NAORIS +50.66%, meaning the gain exceeded half.
How do you usually handle a situation like this?
#BTCRemainsUnderPressureAfterHawkishFOMCMinutes #NvidiaBoardReportedlySplitOverHuang’sReturn #NvidiaBoardReportedlySplitOverHuang’sReturn #CanGTA6'sLaunchLiftTTWOShares? ؟#SouthKoreaPlansToLet3500ListedFirmsBuyBitcoin
1.$NAORIS
RIS +50.66%
2. $IRYS YS +41.34%
3. $VELVET +37.13%
4. ICNT +32.22%
5. BTW +30.73%
First place: $NAORIS +50.66%, meaning the gain exceeded half.
How do you usually handle a situation like this?
#BTCRemainsUnderPressureAfterHawkishFOMCMinutes #NvidiaBoardReportedlySplitOverHuang’sReturn #NvidiaBoardReportedlySplitOverHuang’sReturn #CanGTA6'sLaunchLiftTTWOShares? ؟#SouthKoreaPlansToLet3500ListedFirmsBuyBitcoin
2
117
·
--
BUY SI$AMZNB GNAL — $MANA A | Score: 19/100 | LOW
Bounce off support and ride the surge—buy now.
Entry: $0.06060 — $0.06102
TP1 (30min-4h): $0.06303
TP2 (1-3d): $0.06608
TP3 Swing: $0.07004
SL: $0.05822
The market shows a clear bullish bias as the asset respects its recent support zone, with momentum indicators turning positive and volume confirming buying interest. A tightening range suggests a potential breakout, while the moving averages are aligning in an upward slope, reinforcing the buy signal. Watch for a decisive move above the key l#CapitalGroupAdds1264500StrategyShares #SouthKoreaPlansToLet3500ListedFirmsBuyBitcoin #AnthropicGrayMarketSharesPointTo22%To26%Gains #CapitalGroupAdds1264500StrategyShares evel to sustain the rally, and consider scaling in on
BUY SI$AMZNB GNAL — $MANA A | Score: 19/100 | LOW
Bounce off support and ride the surge—buy now.
Entry: $0.06060 — $0.06102
TP1 (30min-4h): $0.06303
TP2 (1-3d): $0.06608
TP3 Swing: $0.07004
SL: $0.05822
The market shows a clear bullish bias as the asset respects its recent support zone, with momentum indicators turning positive and volume confirming buying interest. A tightening range suggests a potential breakout, while the moving averages are aligning in an upward slope, reinforcing the buy signal. Watch for a decisive move above the key l#CapitalGroupAdds1264500StrategyShares #SouthKoreaPlansToLet3500ListedFirmsBuyBitcoin #AnthropicGrayMarketSharesPointTo22%To26%Gains #CapitalGroupAdds1264500StrategyShares evel to sustain the rally, and consider scaling in on
Bounce off support and ride the surge—buy now.
Entry: $0.06060 — $0.06102
TP1 (30min-4h): $0.06303
TP2 (1-3d): $0.06608
TP3 Swing: $0.07004
SL: $0.05822
The market shows a clear bullish bias as the asset respects its recent support zone, with momentum indicators turning positive and volume confirming buying interest. A tightening range suggests a potential breakout, while the moving averages are aligning in an upward slope, reinforcing the buy signal. Watch for a decisive move above the key l#CapitalGroupAdds1264500StrategyShares #SouthKoreaPlansToLet3500ListedFirmsBuyBitcoin #AnthropicGrayMarketSharesPointTo22%To26%Gains #CapitalGroupAdds1264500StrategyShares evel to sustain the rally, and consider scaling in on
1
8
·
--
I entered a trade on $BNB at a price of 577, and it rose to 586. I made $BNB a 106% profit, but the actual profit was only $0.17 because I started with $3.
Honestly, trading with 75x leverage is very risky. One bad trade can wipe out all your capital.
I’m still learning, and I prefer to start with a small amount and learn without taking on too much risk.
What do you think?
Do you prefer leveraged trading or spot trading without leverage?
And do you expect $BNB to rise or fall from here? $ #SouthKoreaPlansToLet3500ListedFirmsBuyBitcoin #SouthKoreaPlansToLet3500ListedFirmsBuyBitcoin #NvidiaBoardReportedlySplitOverHuang’sReturn #AnthropicGrayMarketSharesPointTo22%To26%Gains
I entered a trade on $BNB at a price of 577, and it rose to 586. I made $BNB a 106% profit, but the actual profit was only $0.17 because I started with $3.
Honestly, trading with 75x leverage is very risky. One bad trade can wipe out all your capital.
I’m still learning, and I prefer to start with a small amount and learn without taking on too much risk.
What do you think?
Do you prefer leveraged trading or spot trading without leverage?
And do you expect $BNB to rise or fall from here? $ #SouthKoreaPlansToLet3500ListedFirmsBuyBitcoin #SouthKoreaPlansToLet3500ListedFirmsBuyBitcoin #NvidiaBoardReportedlySplitOverHuang’sReturn #AnthropicGrayMarketSharesPointTo22%To26%Gains
Honestly, trading with 75x leverage is very risky. One bad trade can wipe out all your capital.
I’m still learning, and I prefer to start with a small amount and learn without taking on too much risk.
What do you think?
Do you prefer leveraged trading or spot trading without leverage?
And do you expect $BNB to rise or fall from here? $ #SouthKoreaPlansToLet3500ListedFirmsBuyBitcoin #SouthKoreaPlansToLet3500ListedFirmsBuyBitcoin #NvidiaBoardReportedlySplitOverHuang’sReturn #AnthropicGrayMarketSharesPointTo22%To26%Gains
1
1
·
--
$PPLI.US Enter a buy trade immediately! The price has risen significantly today, #BTCRemainsUnderPressureAfterHawkishFOMCMinutes and nearly doubled! It reached its peak in the evening and then fell. The decline has now stopped, and the price has started rising again, with a continuous upward trend on the one-hour chart despite the opposite market trend. This indicates that the correction may be over; hurry and enter a buy trade! Its price will reach a new high$NVDA
$PPLI.US Enter a buy trade immediately! The price has risen significantly today, #BTCRemainsUnderPressureAfterHawkishFOMCMinutes and nearly doubled! It reached its peak in the evening and then fell. The decline has now stopped, and the price has started rising again, with a continuous upward trend on the one-hour chart despite the opposite market trend. This indicates that the correction may be over; hurry and enter a buy trade! Its price will reach a new high$NVDA
PPLIUS+0.05%
NVDA-4.23%
1
6
·
--
Question for Binance (Spot) traders 🤔:$NVDAB
If you had $100 (USDT) in your spot wallet right now, which cryptocurrency would you buy and hold for the medium term?
1️⃣ Bitcoin (BTC)
2️⃣ Ethereum (ETH)
3️⃣ Solana (SOL)
4️⃣ Another coin (write it in the comments 👇)
(Note: This post is for discussion and sharing opinions, not investment advice)
#BTCRemainsUnderPressureAfterHawkishFOMCMinutes #NvidiaBoardReportedlySplitOverHuang’sReturn #CanGTA6'sLaunchLiftTTWOShares? #SouthKoreaPlansToLet3500ListedFirmsBuyBitcoin $BTC
$BNB
Question for Binance (Spot) traders 🤔:$NVDAB
If you had $100 (USDT) in your spot wallet right now, which cryptocurrency would you buy and hold for the medium term?
1️⃣ Bitcoin (BTC)
2️⃣ Ethereum (ETH)
3️⃣ Solana (SOL)
4️⃣ Another coin (write it in the comments 👇)
(Note: This post is for discussion and sharing opinions, not investment advice)
#BTCRemainsUnderPressureAfterHawkishFOMCMinutes #NvidiaBoardReportedlySplitOverHuang’sReturn #CanGTA6'sLaunchLiftTTWOShares? #SouthKoreaPlansToLet3500ListedFirmsBuyBitcoin $BTC
$BNB
If you had $100 (USDT) in your spot wallet right now, which cryptocurrency would you buy and hold for the medium term?
1️⃣ Bitcoin (BTC)
2️⃣ Ethereum (ETH)
3️⃣ Solana (SOL)
4️⃣ Another coin (write it in the comments 👇)
(Note: This post is for discussion and sharing opinions, not investment advice)
#BTCRemainsUnderPressureAfterHawkishFOMCMinutes #NvidiaBoardReportedlySplitOverHuang’sReturn #CanGTA6'sLaunchLiftTTWOShares? #SouthKoreaPlansToLet3500ListedFirmsBuyBitcoin $BTC
$BNB
1
13
·
--
# Buyers and sellers have not yet made up their minds, so don't chase the price randomly from the middle #$PYTH .
Candle timeframe: 1h
My bias: wait and see (I trade only with the trend and don't fight market movements out of emotion)
$PYTH #PYTH Execution: Wait for confirmation first, then add to the position after the pivot level is confirmed.
Main reasons: 1) The 24h percentage change for PYTHUSDT is 6.708%, the current price is around 0.056720, and the 24h trading volume is around 12.50M; 2) No directional consensus has formed between the main timeframe and the 4h timeframe. 3) The 4h timeframe closed at 0.056790, down from 0.057300, current open interest is around 98.46M, and the funding rate is around -0.0029%.
Risk management level: If the 1h timeframe drops below 0.056340 again, don't rush into a trade.
$PYTH #PYTH Conclusion: The trend is clear, and execution requires discipline. This content is for informational purposes only and does not constitute investment advice.#AnthropicGrayMarketSharesPointTo22%To26%Gains #FedMinutesShowAlmostAllOfficialsExpectMoreHikes
# Buyers and sellers have not yet made up their minds, so don't chase the price randomly from the middle #$PYTH .
Candle timeframe: 1h
My bias: wait and see (I trade only with the trend and don't fight market movements out of emotion)
$PYTH #PYTH Execution: Wait for confirmation first, then add to the position after the pivot level is confirmed.
Main reasons: 1) The 24h percentage change for PYTHUSDT is 6.708%, the current price is around 0.056720, and the 24h trading volume is around 12.50M; 2) No directional consensus has formed between the main timeframe and the 4h timeframe. 3) The 4h timeframe closed at 0.056790, down from 0.057300, current open interest is around 98.46M, and the funding rate is around -0.0029%.
Risk management level: If the 1h timeframe drops below 0.056340 again, don't rush into a trade.
$PYTH #PYTH Conclusion: The trend is clear, and execution requires discipline. This content is for informational purposes only and does not constitute investment advice.#AnthropicGrayMarketSharesPointTo22%To26%Gains #FedMinutesShowAlmostAllOfficialsExpectMoreHikes
Candle timeframe: 1h
My bias: wait and see (I trade only with the trend and don't fight market movements out of emotion)
$PYTH #PYTH Execution: Wait for confirmation first, then add to the position after the pivot level is confirmed.
Main reasons: 1) The 24h percentage change for PYTHUSDT is 6.708%, the current price is around 0.056720, and the 24h trading volume is around 12.50M; 2) No directional consensus has formed between the main timeframe and the 4h timeframe. 3) The 4h timeframe closed at 0.056790, down from 0.057300, current open interest is around 98.46M, and the funding rate is around -0.0029%.
Risk management level: If the 1h timeframe drops below 0.056340 again, don't rush into a trade.
$PYTH #PYTH Conclusion: The trend is clear, and execution requires discipline. This content is for informational purposes only and does not constitute investment advice.#AnthropicGrayMarketSharesPointTo22%To26%Gains #FedMinutesShowAlmostAllOfficialsExpectMoreHikes
1
37
·
--
is trading$SNT
) currently near $0.10 amid high volatility following the latest security breach, which led to a temporary network shutdown and a price drop from around $0.30.
The key technical support and resistance zones, based on current price action, are as follows:
Support levels (expected demand zones)
• First and nearest support ($0.094–$0.095). This is the first area for an immediate bounce to maintain the current price stability.
• Second support ($0.090). This level aligns with classic pivot points and forms an important barrier to further declines.
• Major and strong support ($0.082–$0.085). This is the long-term 200-day moving average zone. A break below it could open the way for a further decline toward $0.075.
Resistance levels (supply and selling zones)
• First and nearest resistance ($0.101–$0.105). This is the first immediate ceiling that the price needs to break through and hold above to confirm the start of a technical rebound.
• Second resistance ($0.113–$0.115). A clear selling zone on shorter timeframes; moving above it on high trading volume would strengthen positive momentum.
• Third and major resistance ($0.129–$0.134). This zone coincides with the 20-day and 50-day moving averages and is considered the most important barrier to changing the current short-term downtrend.
$SINT.US
is trading$SNT
) currently near $0.10 amid high volatility following the latest security breach, which led to a temporary network shutdown and a price drop from around $0.30.
The key technical support and resistance zones, based on current price action, are as follows:
Support levels (expected demand zones)
• First and nearest support ($0.094–$0.095). This is the first area for an immediate bounce to maintain the current price stability.
• Second support ($0.090). This level aligns with classic pivot points and forms an important barrier to further declines.
• Major and strong support ($0.082–$0.085). This is the long-term 200-day moving average zone. A break below it could open the way for a further decline toward $0.075.
Resistance levels (supply and selling zones)
• First and nearest resistance ($0.101–$0.105). This is the first immediate ceiling that the price needs to break through and hold above to confirm the start of a technical rebound.
• Second resistance ($0.113–$0.115). A clear selling zone on shorter timeframes; moving above it on high trading volume would strengthen positive momentum.
• Third and major resistance ($0.129–$0.134). This zone coincides with the 20-day and 50-day moving averages and is considered the most important barrier to changing the current short-term downtrend.
$SINT.US
) currently near $0.10 amid high volatility following the latest security breach, which led to a temporary network shutdown and a price drop from around $0.30.
The key technical support and resistance zones, based on current price action, are as follows:
Support levels (expected demand zones)
• First and nearest support ($0.094–$0.095). This is the first area for an immediate bounce to maintain the current price stability.
• Second support ($0.090). This level aligns with classic pivot points and forms an important barrier to further declines.
• Major and strong support ($0.082–$0.085). This is the long-term 200-day moving average zone. A break below it could open the way for a further decline toward $0.075.
Resistance levels (supply and selling zones)
• First and nearest resistance ($0.101–$0.105). This is the first immediate ceiling that the price needs to break through and hold above to confirm the start of a technical rebound.
• Second resistance ($0.113–$0.115). A clear selling zone on shorter timeframes; moving above it on high trading volume would strengthen positive momentum.
• Third and major resistance ($0.129–$0.134). This zone coincides with the 20-day and 50-day moving averages and is considered the most important barrier to changing the current short-term downtrend.
$SINT.US
SINTUS+0.00%
1
29
·
--
Stay tuned $AAPLB
$BTC #LedgerHardwareImplantReportsExtendToDubai
Perpetual
12.77
-2.74%
One of my favorite cryptocurrencies, it has a low circulating supply and great potential for a good rise. In my personal opinion, it’s suitable for quietly opening a long position with x7 leverage in the short term (6 months), but also hold it in case of making two additional purchases if the price drops $BTC
Stay tuned $AAPLB
$BTC #LedgerHardwareImplantReportsExtendToDubai
Perpetual
12.77
-2.74%
One of my favorite cryptocurrencies, it has a low circulating supply and great potential for a good rise. In my personal opinion, it’s suitable for quietly opening a long position with x7 leverage in the short term (6 months), but also hold it in case of making two additional purchases if the price drops $BTC
$BTC #LedgerHardwareImplantReportsExtendToDubai
Perpetual
12.77
-2.74%
One of my favorite cryptocurrencies, it has a low circulating supply and great potential for a good rise. In my personal opinion, it’s suitable for quietly opening a long position with x7 leverage in the short term (6 months), but also hold it in case of making two additional purchases if the price drops $BTC
2
124
Log in to explore more content
Join global crypto users on Binance Square
⚡️ Get latest and useful information about crypto.
💬 Trusted by the world’s largest crypto exchange.
👍 Discover real insights from verified creators.
Email / Phone number
Trending Topics
AnthropicToDebutAfter$83IPOPricing
15,333 views
130 Discussing
Stock Futures Hold Near Flat as Anthropic Prices IPO at $83 Ahead of Debut
Binance News
·8 Likes
·7.4k views
BTCRemainsUnderPressureAfterHawkishFOMCMinutes
57,463 views
1,122 Discussing
NvidiaBoardReportedlySplitOverHuang’sReturn
19,065 views
535 Discussing