
加密315
130 Posts

加密315
想和大家一起发财
Open Trade
Frequent Trader
3 Years
52 Following
153 Followers
99 Liked
Posts
Portfolio
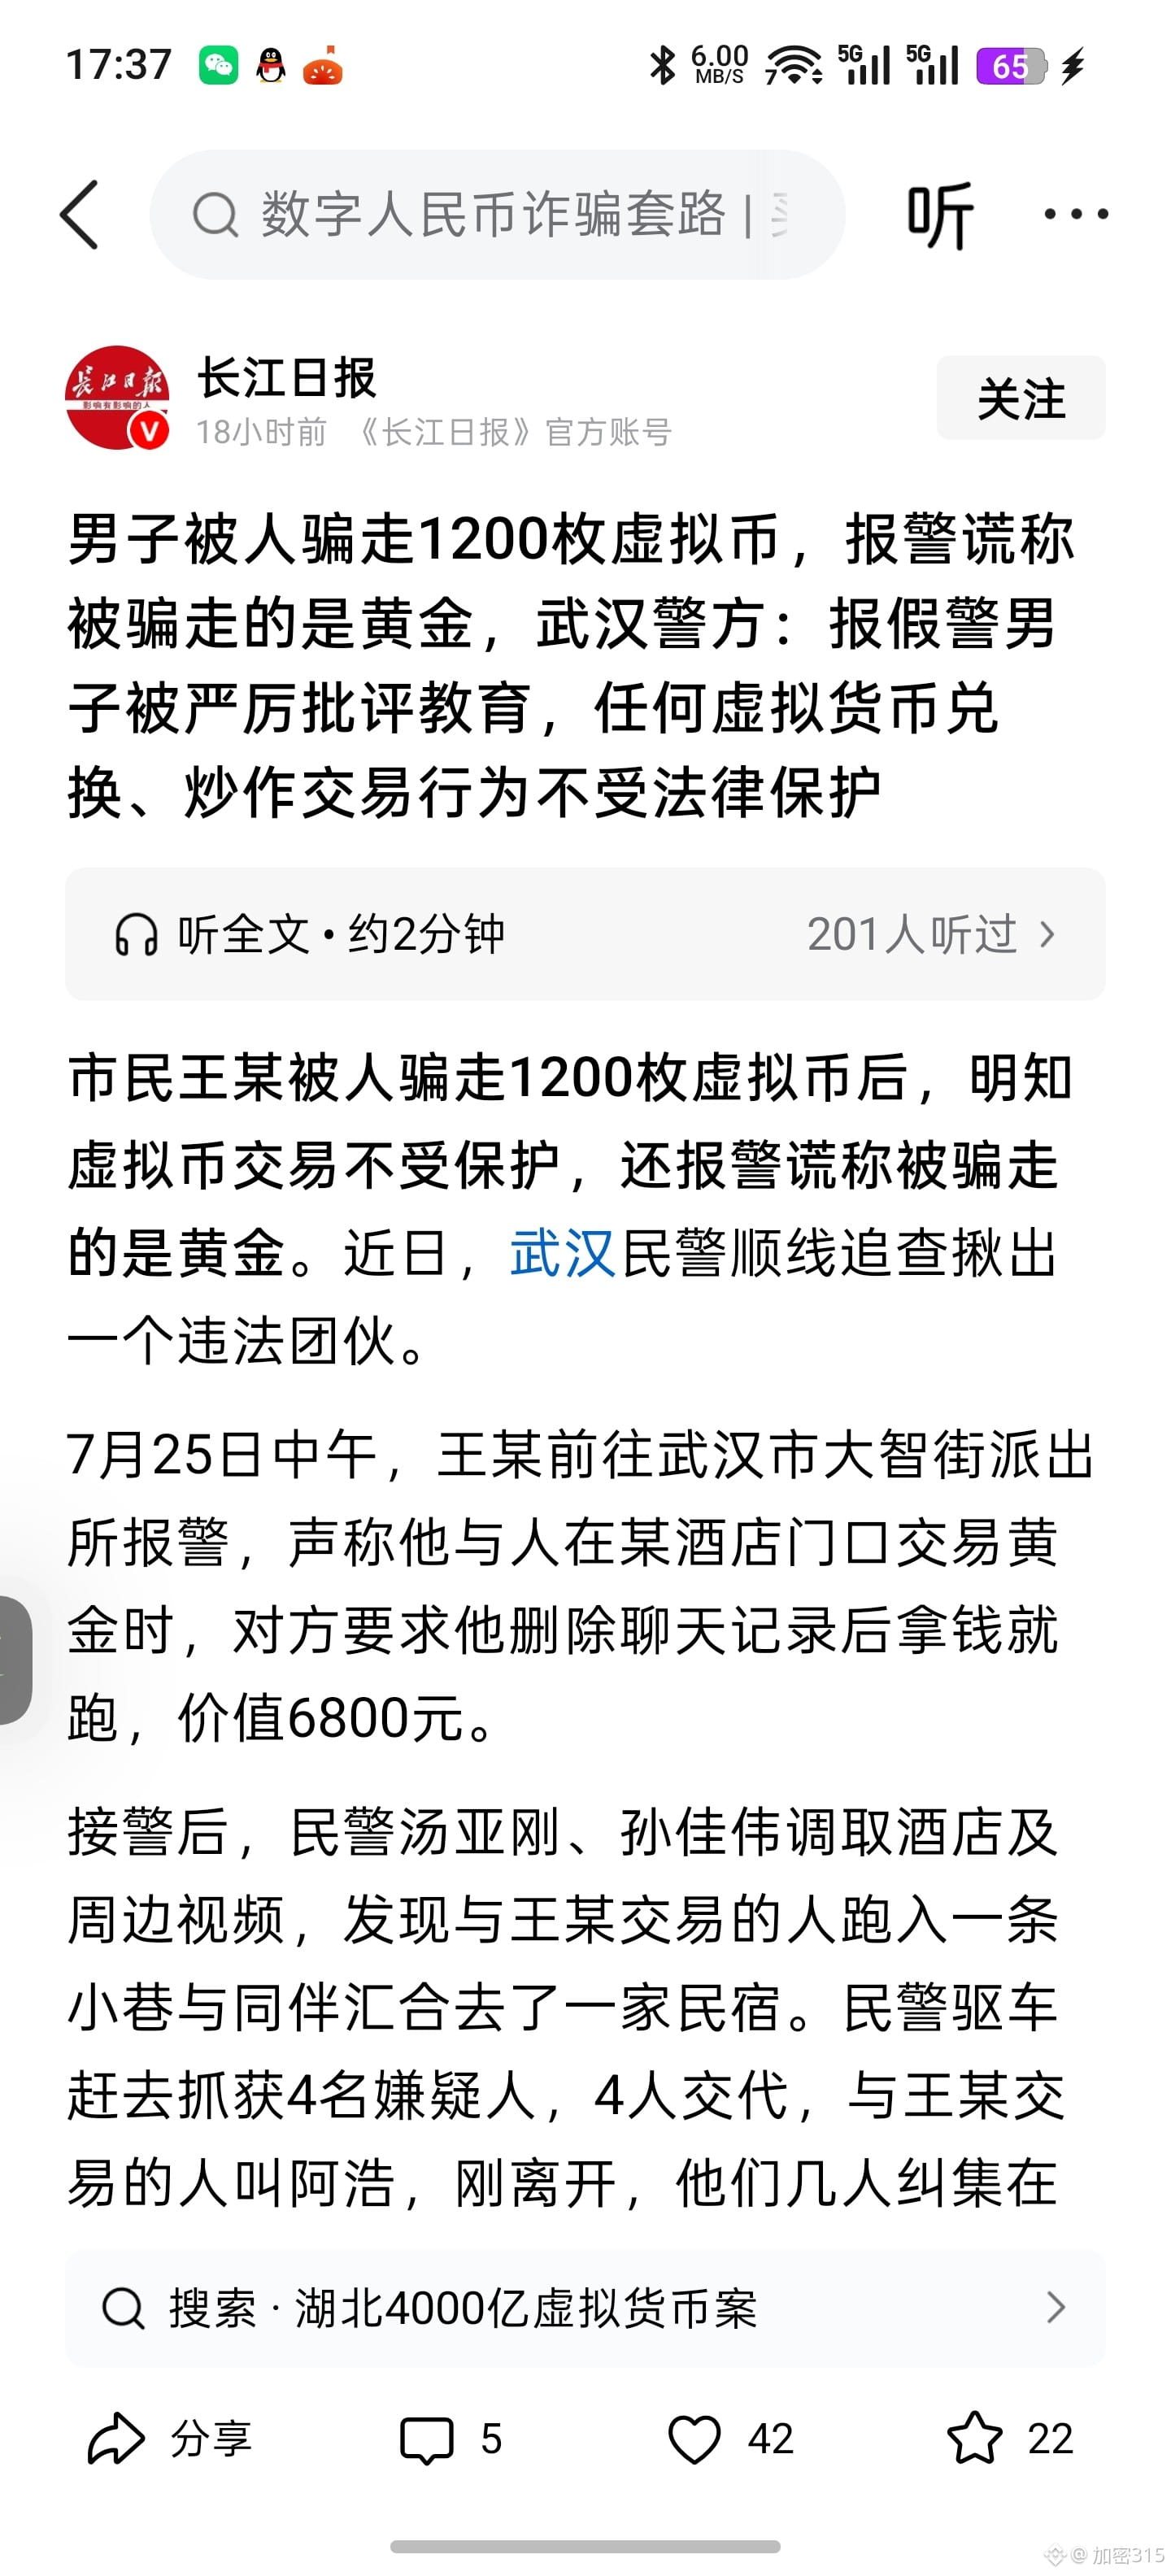
Wuhan young guy sold U offline and got scammed.
Angered, he reported it to the police, but he wasn’t even brave enough to say he was selling U—he only dared to say he was selling gold.
The people who ran away have now been caught and brought back, but whether that U can be recovered later is still uncertain.
Angered, he reported it to the police, but he wasn’t even brave enough to say he was selling U—he only dared to say he was selling gold.
The people who ran away have now been caught and brought back, but whether that U can be recovered later is still uncertain.
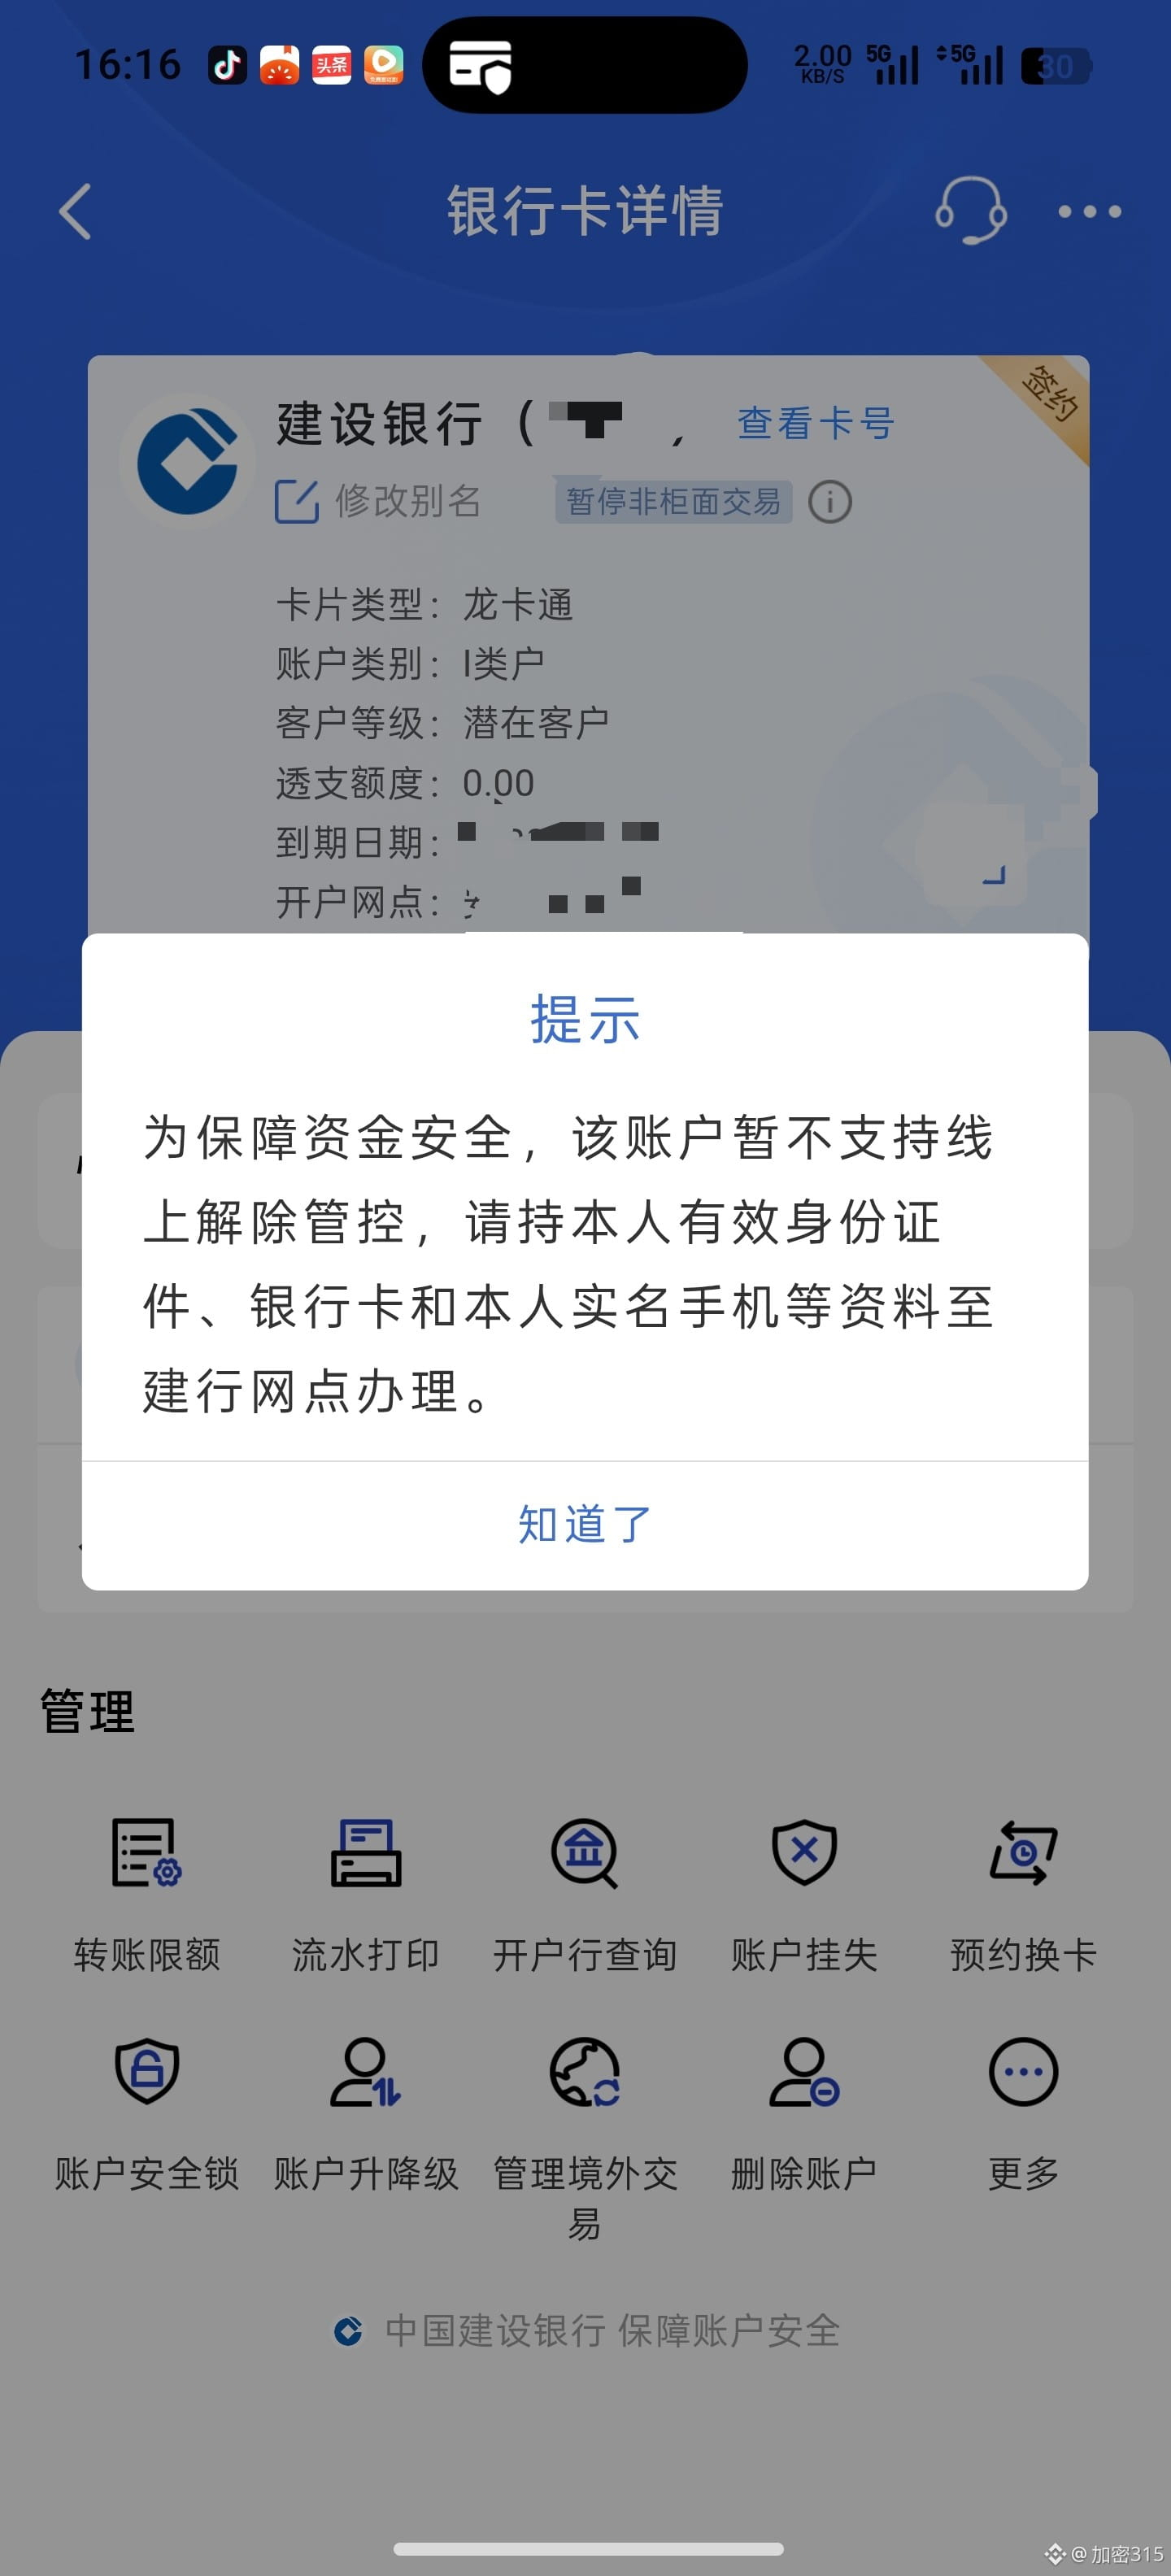
Most users in the crypto world have basically had their bank cards frozen, right?
They freeze your card for no reason and make you open all kinds of proofs.
When you were depositing money, why didn’t you need proof?
In China’s anti-fraud environment, it’s really hard for individuals to buy and sell $USDT .
They freeze your card for no reason and make you open all kinds of proofs.
When you were depositing money, why didn’t you need proof?
In China’s anti-fraud environment, it’s really hard for individuals to buy and sell $USDT .
#termmax Recently I took a deeper look into @TermMax ’s fixed-rate borrowing and Alpha products, and I truly feel that I’ve found certainty in the DeFi volatile market. Traditional lending and borrowing interest rates fluctuate unpredictably, but TermMax lets you lock in the interest rate and term in advance—your borrowing costs are clear at a glance, and your loan yield is also secured. What’s even more surprising is the Alpha feature: it supports leveraged long/short positions on Binance Alpha tokens without liquidation, requiring only a fixed premium, with the maximum loss kept under control. At the same time, holders can earn high APY and XP points through dual-coin investing. Right now, it happens to coincide with the Binance Wallet Booster campaign—by posting, you have a chance to share in $TMX. Multi-chain deployment is supported, including on BNB Chain. The operations are smooth and secure. Personally, I think this mechanism simplifies complex strategies into a one-click process, which is ideal for friends who want stability but also want to amplify their returns. I’ll continue to follow the V2 updates and TGE progress.#TermMax
From the perspective of institutions adopting it, Dusk’s direction is worth paying attention to. Traditional financial assets moving on-chain is not just “moving assets to the blockchain”; it also requires privacy protection, compliance rules, and a verifiable transaction environment. Dusk is building infrastructure around these core needs, with a clear application narrative especially in the RWA and security tokenization fields. $DUSK @Dusk #dusk
I want to review and evaluate the private-domain lead-generation teachers and strategy analysts on the square and X to see if they actually have real substance or if it's just a scam.
Dusk is working to bridge the gap between compliant privacy and real-world asset tokenization. With a verifiable, compliant, and privacy-preserving infrastructure, Dusk aims to provide a blockchain environment that is more suitable for institutional adoption by financial institutions looking to bring real-world assets on-chain. As RWA and compliant financial infrastructure continue to evolve, the application value of $DUSK is worth ongoing attention.@Dusk @Dusk #dusk
CPI cooling combined with AI sector earnings boosts, Nasdaq 100 keeps rising
In July, the CPI data is finally out, and the slowdown in inflation fully meets expectations. Tech stocks have continued to surge sharply, and market sentiment is running high, making it easy to think that the threat of Fed rate hikes has completely disappeared.
$PEOPLE According to the story of crossing the river by cutting the boat’s rope, this time will keep falling for a long time.
In July, the CPI data is finally out, and the slowdown in inflation fully meets expectations. Tech stocks have continued to surge sharply, and market sentiment is running high, making it easy to think that the threat of Fed rate hikes has completely disappeared.
$PEOPLE According to the story of crossing the river by cutting the boat’s rope, this time will keep falling for a long time.
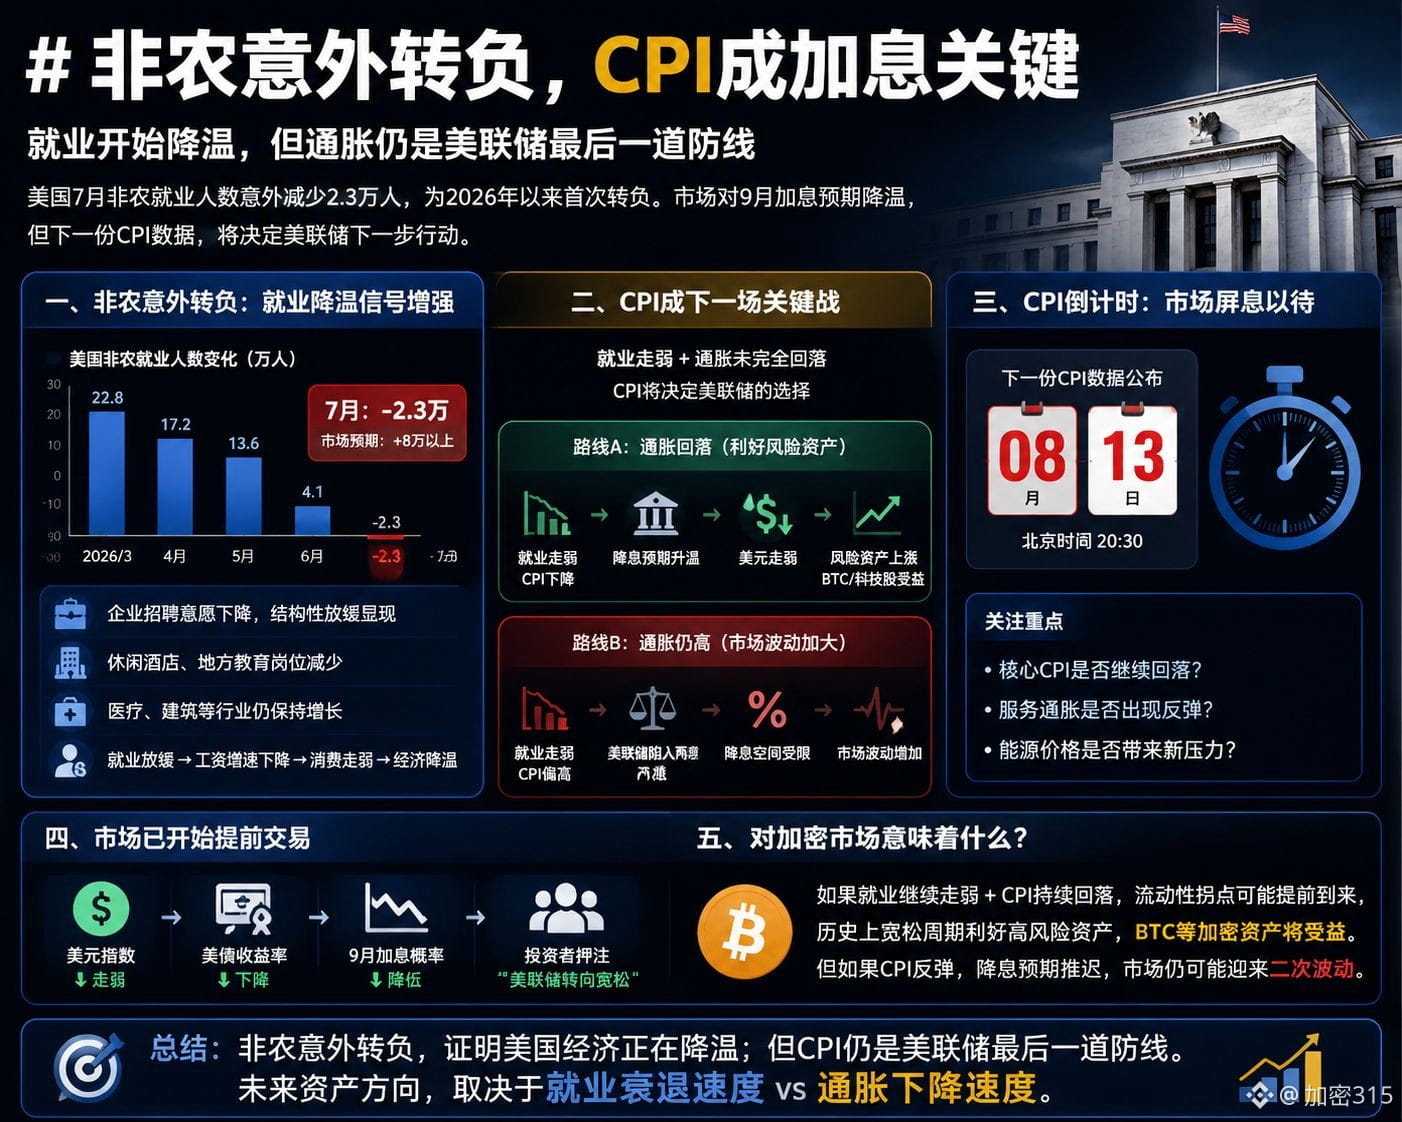
#US Nonfarm unexpectedly turns negative, CPI becomes the key to further rate hikes
US nonfarm employment unexpectedly fell, with CPI becoming the Fed’s next trump card
In July, the number of US nonfarm jobs fell unexpectedly by 23,000, marking the first negative growth this year.
The focus for the market is not just the data itself, but the signal behind it:
The US labor market is cooling.
Hiring by companies is slowing, consumption pressure may gradually increase, and the Fed’s policy balance is starting to shift.
But you still can’t directly bet on rate cuts right now.
Because what truly determines the Fed’s next move is CPI.
Employment determines economic pressure.
Inflation determines policy room.
If employment continues to weaken while CPI keeps falling:
The dollar and US Treasury yields may come under pressure, the market may start pricing in improving liquidity earlier, and risk assets such as BTC could benefit.
If CPI rebounds again:
Rate-cut expectations may cool, and market volatility could be amplified once more.
From a trading perspective, the biggest variable right now isn’t nonfarm, but rather:
Whether the pace of US economic cooling exceeds the pace of the decline in inflation.
Nonfarm has delivered a cooling signal—next, CPI will provide the answer.
US nonfarm employment unexpectedly fell, with CPI becoming the Fed’s next trump card
In July, the number of US nonfarm jobs fell unexpectedly by 23,000, marking the first negative growth this year.
The focus for the market is not just the data itself, but the signal behind it:
The US labor market is cooling.
Hiring by companies is slowing, consumption pressure may gradually increase, and the Fed’s policy balance is starting to shift.
But you still can’t directly bet on rate cuts right now.
Because what truly determines the Fed’s next move is CPI.
Employment determines economic pressure.
Inflation determines policy room.
If employment continues to weaken while CPI keeps falling:
The dollar and US Treasury yields may come under pressure, the market may start pricing in improving liquidity earlier, and risk assets such as BTC could benefit.
If CPI rebounds again:
Rate-cut expectations may cool, and market volatility could be amplified once more.
From a trading perspective, the biggest variable right now isn’t nonfarm, but rather:
Whether the pace of US economic cooling exceeds the pace of the decline in inflation.
Nonfarm has delivered a cooling signal—next, CPI will provide the answer.
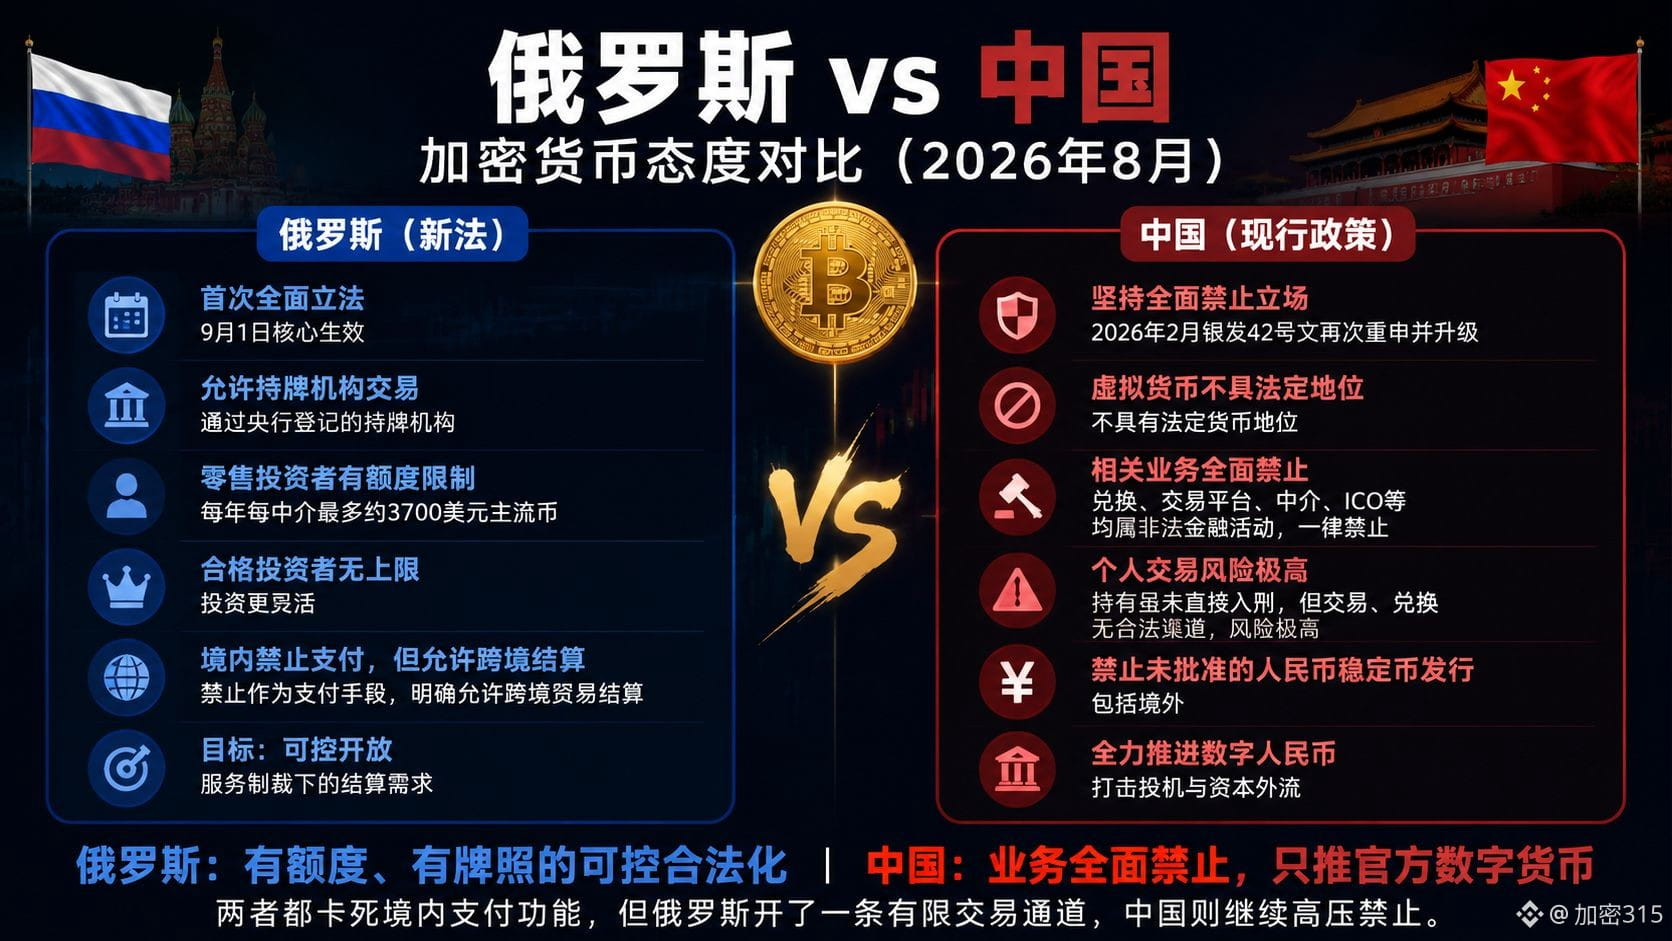
🇷🇺 Russia vs 🇨🇳 China: Comparison of Crypto Attitudes (Aug 2026)
Russia (New Law):
- First comprehensive legislation; core provisions take effect on Sept 1
- Allows trading through licensed institutions registered with the central bank
- Retail investors can buy mainstream coins up to about US$3,700 per year per intermediary
- No limits for qualified investors
- Banned within the country from being used as a means of payment, but clearly allows cross-border trade settlement
- Goal: controlled openness + settlement needs under sanctions management
China (Current Policy):
- Adheres to a comprehensive prohibition (the Feb 2026 “Document No. 42” from the State Administration of Foreign Exchange further reiterated and upgraded the policy)
- Virtual currencies do not have the status of legal tender
- All related activities within the country (exchanging, trading platforms, intermediaries, ICOs, etc.) are illegal financial activities and are strictly prohibited
- Individuals holding crypto is not directly criminalized, but trading and exchanging have no legal channels, making the risk extremely high
- Prohibits the issuance of unapproved RMB stablecoins (including from abroad)
- Fully promotes the digital yuan and cracks down on speculation and capital outflow
One-sentence comparison:
Russia is “controlled legalization with limits and licenses”;
China is “comprehensively bans business and only promotes official digital currency.”
Both block domestic payment functions, but Russia opened a limited trading channel, while China continues to intensify the crackdown.
China initially had over 70% of global Bitcoin hashrate; now it’s down to 14%.
Russia (New Law):
- First comprehensive legislation; core provisions take effect on Sept 1
- Allows trading through licensed institutions registered with the central bank
- Retail investors can buy mainstream coins up to about US$3,700 per year per intermediary
- No limits for qualified investors
- Banned within the country from being used as a means of payment, but clearly allows cross-border trade settlement
- Goal: controlled openness + settlement needs under sanctions management
China (Current Policy):
- Adheres to a comprehensive prohibition (the Feb 2026 “Document No. 42” from the State Administration of Foreign Exchange further reiterated and upgraded the policy)
- Virtual currencies do not have the status of legal tender
- All related activities within the country (exchanging, trading platforms, intermediaries, ICOs, etc.) are illegal financial activities and are strictly prohibited
- Individuals holding crypto is not directly criminalized, but trading and exchanging have no legal channels, making the risk extremely high
- Prohibits the issuance of unapproved RMB stablecoins (including from abroad)
- Fully promotes the digital yuan and cracks down on speculation and capital outflow
One-sentence comparison:
Russia is “controlled legalization with limits and licenses”;
China is “comprehensively bans business and only promotes official digital currency.”
Both block domestic payment functions, but Russia opened a limited trading channel, while China continues to intensify the crackdown.
China initially had over 70% of global Bitcoin hashrate; now it’s down to 14%.
🇷🇺 Putin signed Russia’s first comprehensive encryption law
On August 4, he signed the “Digital Currency and Digital Rights Law,” with the core provisions taking effect on September 1.
✅ Retail investors: each year, each intermediary may buy no more than 300,000 rubles (about $3,700) of mainstream coins
✅ Qualified investors: no upper limit; may buy any coin
❌ Crypto payments are banned within the country
✅ Cross-border trade settlement is clearly recognized as legal
Exchanges and custodial institutions must register with the central bank, with minimum capital of 15 million rubles.
Summary: not a full opening, but “controlled legalization”—quotas tightly limit retail access, while keeping cross-border settlement tools under sanctions.
#俄罗斯加密合规 #普京 #加密监管
On August 4, he signed the “Digital Currency and Digital Rights Law,” with the core provisions taking effect on September 1.
✅ Retail investors: each year, each intermediary may buy no more than 300,000 rubles (about $3,700) of mainstream coins
✅ Qualified investors: no upper limit; may buy any coin
❌ Crypto payments are banned within the country
✅ Cross-border trade settlement is clearly recognized as legal
Exchanges and custodial institutions must register with the central bank, with minimum capital of 15 million rubles.
Summary: not a full opening, but “controlled legalization”—quotas tightly limit retail access, while keeping cross-border settlement tools under sanctions.
#俄罗斯加密合规 #普京 #加密监管
$BTC Stuck in a 64,000–65,000 range with oscillations; inflows into ETFs are still coming, but they can’t keep up with the pace of the US stock market.
$ETH is relatively stronger, holding above around 1900. Overall sentiment is still rather timid, with the fear index staying low.
Everyone is waiting for tomorrow’s Fed meeting outcome. At this point, the highest likelihood is that the current interest rate will be kept unchanged.
$ETH is relatively stronger, holding above around 1900. Overall sentiment is still rather timid, with the fear index staying low.
Everyone is waiting for tomorrow’s Fed meeting outcome. At this point, the highest likelihood is that the current interest rate will be kept unchanged.
Important signal from the latest U.S. economic data:
PCE turns negative month-on-month, and GDP growth slows to 1.5%
The market is re-pricing a core logic:
Inflation is cooling, but the economy is also slowing.
Over the past two years, the Fed has been working to solve one problem:
how to curb inflation while avoiding a recession.
Now it appears the data is moving in the direction of a “soft landing.”
A negative PCE reading means:
inflation pressure continues to ease, and the Fed’s room for further rate cuts is opening up.
Market logic may shift from:
high inflation → rate hikes → tighter liquidity
to:
falling inflation → rate-cut expectations → improved liquidity.
And while GDP growth has slowed to 1.5%, it doesn’t mean the economy is collapsing.
What it resembles now is a normal cooling in a high-interest-rate environment.
Consumption remains resilient, and business investment has not shown any clear stall—especially AI infrastructure investment, which is still strong.
For the market, the key isn’t that GDP is falling, but whether the economy will continue to deteriorate in the future.
If:
PCE continues to decline
employment stays stable
the Fed signals rate cuts
then the market may enter a new liquidity cycle.
Beneficiary directions:
U.S. tech stocks
growth assets
the crypto market
especially BTC, where in historical cycles, liquidity easing has often been an important driver of upward moves.
Next, the focus should be on:
changes in U.S. employment data
the trend of core PCE
the market’s expectations for Fed rate cuts
One-sentence summary:
The U.S. economy is transitioning from the “high inflation + high interest rates” stage to a “low growth + low inflation” phase.
The real market opportunity isn’t about how much the economy can still grow—it’s about when the liquidity turning point arrives.
PCE turns negative month-on-month, and GDP growth slows to 1.5%
The market is re-pricing a core logic:
Inflation is cooling, but the economy is also slowing.
Over the past two years, the Fed has been working to solve one problem:
how to curb inflation while avoiding a recession.
Now it appears the data is moving in the direction of a “soft landing.”
A negative PCE reading means:
inflation pressure continues to ease, and the Fed’s room for further rate cuts is opening up.
Market logic may shift from:
high inflation → rate hikes → tighter liquidity
to:
falling inflation → rate-cut expectations → improved liquidity.
And while GDP growth has slowed to 1.5%, it doesn’t mean the economy is collapsing.
What it resembles now is a normal cooling in a high-interest-rate environment.
Consumption remains resilient, and business investment has not shown any clear stall—especially AI infrastructure investment, which is still strong.
For the market, the key isn’t that GDP is falling, but whether the economy will continue to deteriorate in the future.
If:
PCE continues to decline
employment stays stable
the Fed signals rate cuts
then the market may enter a new liquidity cycle.
Beneficiary directions:
U.S. tech stocks
growth assets
the crypto market
especially BTC, where in historical cycles, liquidity easing has often been an important driver of upward moves.
Next, the focus should be on:
changes in U.S. employment data
the trend of core PCE
the market’s expectations for Fed rate cuts
One-sentence summary:
The U.S. economy is transitioning from the “high inflation + high interest rates” stage to a “low growth + low inflation” phase.
The real market opportunity isn’t about how much the economy can still grow—it’s about when the liquidity turning point arrives.
Partly True
#韩国股市因三星财报反弹
Korean stocks rebound, and the real protagonist isn’t Samsung—it’s the AI semiconductor cycle being repriced.
In Samsung Electronics’ latest earnings report, a strong signal emerges:
Demand for AI infrastructure remains robust, and high-bandwidth memory (HBM) is becoming a core resource in the global race for compute power.
Previously, the market, shaken by a plunge in the semiconductor sector, questioned the AI investment cycle—but Samsung’s performance proves:
AI isn’t just a story; it’s turning into real orders and profits.
The biggest change in the Korean stock market is that capital has started refocusing:
HBM → AI servers → data centers → compute infrastructure
This industry chain is still in an expansion phase.
As global storage giants, Samsung and SK hynix are becoming the “shovel sellers” in the AI era.
In the short term, the market will likely continue to trade valuations, capital expenditures, and competitive pressures.
But in the long run, the global AI arms race has only just begun.
In the coming years, what may truly be scarce won’t be AI models, but the chips, storage, power, and infrastructure that enable AI to run.
This rebound in the Korean stock market is, at its core, pricing in an expectation:
The AI cycle may not have ended—it’s simply getting reshuffled.
Korean stocks rebound, and the real protagonist isn’t Samsung—it’s the AI semiconductor cycle being repriced.
In Samsung Electronics’ latest earnings report, a strong signal emerges:
Demand for AI infrastructure remains robust, and high-bandwidth memory (HBM) is becoming a core resource in the global race for compute power.
Previously, the market, shaken by a plunge in the semiconductor sector, questioned the AI investment cycle—but Samsung’s performance proves:
AI isn’t just a story; it’s turning into real orders and profits.
The biggest change in the Korean stock market is that capital has started refocusing:
HBM → AI servers → data centers → compute infrastructure
This industry chain is still in an expansion phase.
As global storage giants, Samsung and SK hynix are becoming the “shovel sellers” in the AI era.
In the short term, the market will likely continue to trade valuations, capital expenditures, and competitive pressures.
But in the long run, the global AI arms race has only just begun.
In the coming years, what may truly be scarce won’t be AI models, but the chips, storage, power, and infrastructure that enable AI to run.
This rebound in the Korean stock market is, at its core, pricing in an expectation:
The AI cycle may not have ended—it’s simply getting reshuffled.
Crypto Daily|July 29
The crypto market continues to consolidate amid ongoing volatility, and BTC has entered a phase of choosing direction in the short term.
BTC:
This pullback is mainly driven by profit-taking after the prior rally. Selling pressure has eased somewhat, but we still need to observe whether chasing demand returns.
Short-term to watch:
Whether BTC can reclaim the key resistance level;
Whether trading volume shows signs of recovery;
Whether funds return to the market.
ETH:
The market continues to watch for opportunities for ETH to catch up.
If BTC stabilizes, capital may shift from mainstream assets to the ETH ecosystem, Layer 2, and other trending sectors.
SOL:
SOL remains a focus for high-risk capital in the market. On-chain activity and ecosystem heat are still key supports.
But high returns come with high volatility—so in the short term, we need to monitor fund flows.
Today’s core takeaway:
The market move isn’t over; it’s just waiting for new catalysts.
Key focus next:
BTC direction selection;
ETH catch-up signals;
Rotation of capital among popular narratives such as AI and RWA.
Opportunities always exist in the market, but the key is to follow the money—not chase emotions.
The crypto market continues to consolidate amid ongoing volatility, and BTC has entered a phase of choosing direction in the short term.
BTC:
This pullback is mainly driven by profit-taking after the prior rally. Selling pressure has eased somewhat, but we still need to observe whether chasing demand returns.
Short-term to watch:
Whether BTC can reclaim the key resistance level;
Whether trading volume shows signs of recovery;
Whether funds return to the market.
ETH:
The market continues to watch for opportunities for ETH to catch up.
If BTC stabilizes, capital may shift from mainstream assets to the ETH ecosystem, Layer 2, and other trending sectors.
SOL:
SOL remains a focus for high-risk capital in the market. On-chain activity and ecosystem heat are still key supports.
But high returns come with high volatility—so in the short term, we need to monitor fund flows.
Today’s core takeaway:
The market move isn’t over; it’s just waiting for new catalysts.
Key focus next:
BTC direction selection;
ETH catch-up signals;
Rotation of capital among popular narratives such as AI and RWA.
Opportunities always exist in the market, but the key is to follow the money—not chase emotions.
Xu Xiang was 15 years old when, with the 30,000 yuan his mother gave him, he entered the stock market and began his legendary rise.
At 19, he earned 3 million;
at 25, he surpassed 100 million;
by 37, his personal fortune had reached 20 billion.
He was known as the supreme leader of the “limit-up death squad,” whose private fund has long dominated the national top three rankings. There was no one in the world who could match him.
In June 2015,
Xu Xiang clearly refused to rescue the market and chose to exit by dumping the market. Then, on July 9, when the overall market had plunged to an extreme low, Xu Xiang entered the market with his entire 15 billion in funds, taking advantage of everyone’s bottom. In a short time, he rapidly doubled his money.
In November of that year, Xu Xiang was arrested and sentenced to 5 years and 6 months, with assets confiscated and fines totaling 20.337 billion. On July 9, 2021, Xu Xiang was released from prison.
Now, looking back, one wonders whether he regrets the decision he made that day to refuse to rescue the market.
At 19, he earned 3 million;
at 25, he surpassed 100 million;
by 37, his personal fortune had reached 20 billion.
He was known as the supreme leader of the “limit-up death squad,” whose private fund has long dominated the national top three rankings. There was no one in the world who could match him.
In June 2015,
Xu Xiang clearly refused to rescue the market and chose to exit by dumping the market. Then, on July 9, when the overall market had plunged to an extreme low, Xu Xiang entered the market with his entire 15 billion in funds, taking advantage of everyone’s bottom. In a short time, he rapidly doubled his money.
In November of that year, Xu Xiang was arrested and sentenced to 5 years and 6 months, with assets confiscated and fines totaling 20.337 billion. On July 9, 2021, Xu Xiang was released from prison.
Now, looking back, one wonders whether he regrets the decision he made that day to refuse to rescue the market.

The core reasons behind this round of decline (a three-dimensional breakdown of technicals + capital + news)
Technicals: short-term structure has been broken
The moving average system is forming suppression.
At present, the price around 63300 (currently $BTC ) has fallen rapidly and broken below short-term moving average support. The original choppy upward structure has been disrupted.
MA5, MA10, and MA20 are starting to form short-term overhead pressure, and the 63300–63400 zone has become the current battleground between bulls and bears.
MACD is repairing from low levels, but a reversal has not been confirmed.
MACD is still below the 0 axis. Although the green bars are shrinking and bearish momentum has been released somewhat, this is more of a technical rebound/repair after the drop.
Only if price regains and holds above the key resistance level can the trend reversal be confirmed.
Market trend judgment
Short term (15-minute timeframe):
Currently, it’s a choppy-to-bearish structure. On rebounds, focus on the resistance zones first; it’s not advisable to chase long positions blindly.
Medium term (4-hour timeframe):
Right now, it’s in a pullback phase after an advance. As long as key support has not been broken, the logic of the larger uptrend has not yet changed.
Key support and resistance levels
Resistance zones:
First resistance: 63450–63600
This is within the short-term moving average resistance area. If price can’t break through on a rebound, it is likely to fall again.
Second resistance: 64000–64200
If price can stand back above this zone, short-term bearish pressure will ease noticeably.
Strong resistance: 64800–65000
Only after a breakout will the market have a chance to turn stronger again.
Support zones:
First support: 63000
If it breaks, watch 62500.
Second support: 62400–62500
Short-term capital may start to step in.
Strong support: 61200–61500
If this breaks, the medium-term uptrend structure will be affected.
Trading strategy reference
Primary strategy: sell the rebound (go short on rallies)
Entry zone:
63450–63600
Stop loss:
63750
Targets:
63000
62500
Secondary strategy: go long briefly at lower levels
Watch zone:
62400–62500
Condition:
A candle pattern indicating a bottoming out, with shrinking trading volume.
Stop loss:
62000
Target:
63400–63600
Risk reminder
The current market is still in a high-volatility phase.
63000 is the short-term bulls-versus-bears lifeline.
Until 64000 is regained and held, keep strategies cautious.
Trading core:
Trade in the direction of the trend—don’t fight against it by holding positions against momentum.
Technicals: short-term structure has been broken
The moving average system is forming suppression.
At present, the price around 63300 (currently $BTC ) has fallen rapidly and broken below short-term moving average support. The original choppy upward structure has been disrupted.
MA5, MA10, and MA20 are starting to form short-term overhead pressure, and the 63300–63400 zone has become the current battleground between bulls and bears.
MACD is repairing from low levels, but a reversal has not been confirmed.
MACD is still below the 0 axis. Although the green bars are shrinking and bearish momentum has been released somewhat, this is more of a technical rebound/repair after the drop.
Only if price regains and holds above the key resistance level can the trend reversal be confirmed.
Market trend judgment
Short term (15-minute timeframe):
Currently, it’s a choppy-to-bearish structure. On rebounds, focus on the resistance zones first; it’s not advisable to chase long positions blindly.
Medium term (4-hour timeframe):
Right now, it’s in a pullback phase after an advance. As long as key support has not been broken, the logic of the larger uptrend has not yet changed.
Key support and resistance levels
Resistance zones:
First resistance: 63450–63600
This is within the short-term moving average resistance area. If price can’t break through on a rebound, it is likely to fall again.
Second resistance: 64000–64200
If price can stand back above this zone, short-term bearish pressure will ease noticeably.
Strong resistance: 64800–65000
Only after a breakout will the market have a chance to turn stronger again.
Support zones:
First support: 63000
If it breaks, watch 62500.
Second support: 62400–62500
Short-term capital may start to step in.
Strong support: 61200–61500
If this breaks, the medium-term uptrend structure will be affected.
Trading strategy reference
Primary strategy: sell the rebound (go short on rallies)
Entry zone:
63450–63600
Stop loss:
63750
Targets:
63000
62500
Secondary strategy: go long briefly at lower levels
Watch zone:
62400–62500
Condition:
A candle pattern indicating a bottoming out, with shrinking trading volume.
Stop loss:
62000
Target:
63400–63600
Risk reminder
The current market is still in a high-volatility phase.
63000 is the short-term bulls-versus-bears lifeline.
Until 64000 is regained and held, keep strategies cautious.
Trading core:
Trade in the direction of the trend—don’t fight against it by holding positions against momentum.
$BTC Once again stepping into a key position.
But what truly affects the market isn't just a price breakout, but whether funds are returning.
If ETF inflows continue to increase, the market may keep trading expectations for a new round of upside.
#以太坊逼近2000美元
But what truly affects the market isn't just a price breakout, but whether funds are returning.
If ETF inflows continue to increase, the market may keep trading expectations for a new round of upside.
#以太坊逼近2000美元
Log in to explore more content