
BM Trading
20 Posts

BM Trading
Report
Block User
Crypto & Fx Trader
Open Trade
Occasional Trader
5.1 Years
1 Following
23 Followers
40 Liked
Posts
Portfolio
All
Quotes
·
--
Bullish
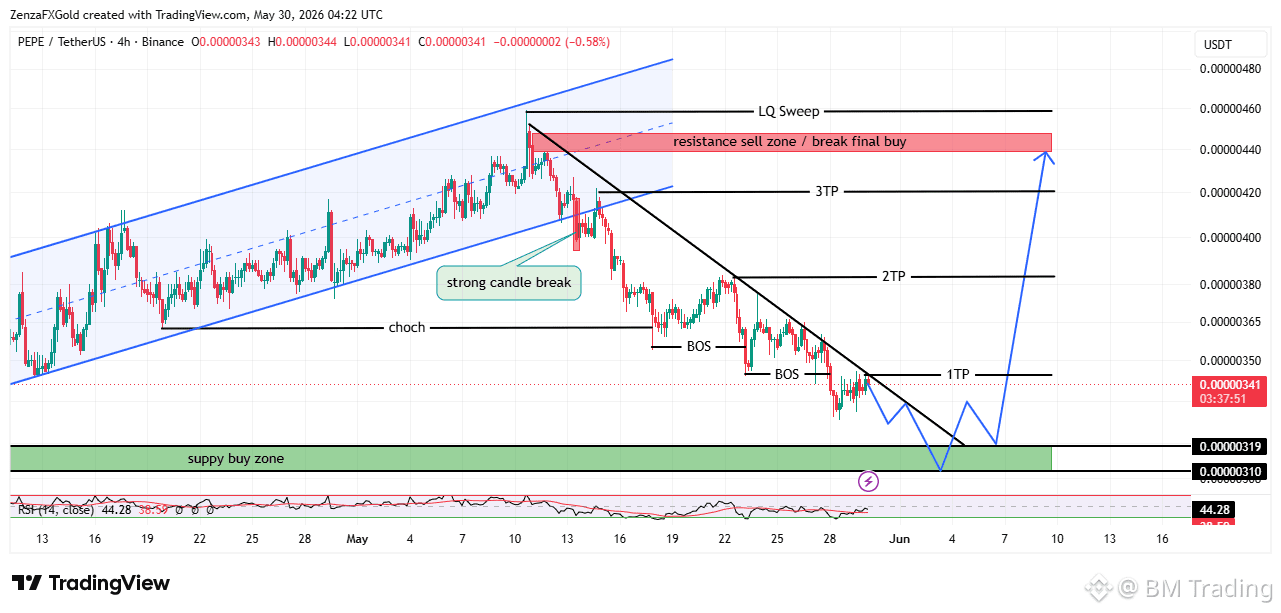
🐸 PEPE/USDT (4H Chart) - Potential Reversal Setup 🚀
Hey guys! Here is a detailed technical breakdown of the PEPE/USDT 4-hour chart based on Smart Money Concepts (SMC) and price action. We are looking at a potential major reversal setup ahead.
🔍 Market Structure Analysis (What Happened?)
Ascending Channel & LQ Sweep: Price was initially moving inside a strong bullish ascending channel. It then hit a major liquidity sweep (LQ Sweep) at the top, capturing buy-side liquidity.
CHoCH & Strong Candle Break: After the sweep, a aggressive bearish momentum triggered a Change of Character (CHoCH) with a strong candle break below the channel's support line.
Break of Structure (BOS): The bearish trend was confirmed by consecutive Breaks of Structure (BOS) on the way down, establishing a clear short-term downtrend.
📉 Current Situation
Price is currently following a descending trendline (resistance). However, it is steadily approaching a critical demand area.
The Supply/Buy Zone: A major institutional demand zone is sitting between 0.00000310 and 0.00000319. This is where we expect smart money to step in.
🎯 The Game Plan (Bullish Reversal Setup)
We are waiting for the price to mitigate the green Supply/Buy Zone before looking for a long opportunity.
1 Entry Zone: Look for entries inside the 0.00000310 – 0.00000319 area (Watch for a bullish confirmation/reversal pattern on lower timeframes once it hits this zone).
2 Take Profit (TP) Targets:
1st TP: 0.00000350 (Recent minor lower high / trendline break confirmation)
2nd TP: 0.00000380
3rd TP: 0.00000420
Final Target: 0.00000440+ (The Resistance Sell Zone / Break Final Buy area)
⚠️ Note: Always practice proper risk management. Wait for the price to drop into the buy zone and show signs of rejection before jumping in!
What are your thoughts on PEPE? Let me know in the comments! 👇#PEPE #usdt #BTC #NewsAboutCrypto
🐸 PEPE/USDT (4H Chart) - Potential Reversal Setup 🚀
Hey guys! Here is a detailed technical breakdown of the PEPE/USDT 4-hour chart based on Smart Money Concepts (SMC) and price action. We are looking at a potential major reversal setup ahead.
🔍 Market Structure Analysis (What Happened?)
Ascending Channel & LQ Sweep: Price was initially moving inside a strong bullish ascending channel. It then hit a major liquidity sweep (LQ Sweep) at the top, capturing buy-side liquidity.
CHoCH & Strong Candle Break: After the sweep, a aggressive bearish momentum triggered a Change of Character (CHoCH) with a strong candle break below the channel's support line.
Break of Structure (BOS): The bearish trend was confirmed by consecutive Breaks of Structure (BOS) on the way down, establishing a clear short-term downtrend.
📉 Current Situation
Price is currently following a descending trendline (resistance). However, it is steadily approaching a critical demand area.
The Supply/Buy Zone: A major institutional demand zone is sitting between 0.00000310 and 0.00000319. This is where we expect smart money to step in.
🎯 The Game Plan (Bullish Reversal Setup)
We are waiting for the price to mitigate the green Supply/Buy Zone before looking for a long opportunity.
1 Entry Zone: Look for entries inside the 0.00000310 – 0.00000319 area (Watch for a bullish confirmation/reversal pattern on lower timeframes once it hits this zone).
2 Take Profit (TP) Targets:
1st TP: 0.00000350 (Recent minor lower high / trendline break confirmation)
2nd TP: 0.00000380
3rd TP: 0.00000420
Final Target: 0.00000440+ (The Resistance Sell Zone / Break Final Buy area)
⚠️ Note: Always practice proper risk management. Wait for the price to drop into the buy zone and show signs of rejection before jumping in!
What are your thoughts on PEPE? Let me know in the comments! 👇#PEPE #usdt #BTC #NewsAboutCrypto
Hey guys! Here is a detailed technical breakdown of the PEPE/USDT 4-hour chart based on Smart Money Concepts (SMC) and price action. We are looking at a potential major reversal setup ahead.
🔍 Market Structure Analysis (What Happened?)
Ascending Channel & LQ Sweep: Price was initially moving inside a strong bullish ascending channel. It then hit a major liquidity sweep (LQ Sweep) at the top, capturing buy-side liquidity.
CHoCH & Strong Candle Break: After the sweep, a aggressive bearish momentum triggered a Change of Character (CHoCH) with a strong candle break below the channel's support line.
Break of Structure (BOS): The bearish trend was confirmed by consecutive Breaks of Structure (BOS) on the way down, establishing a clear short-term downtrend.
📉 Current Situation
Price is currently following a descending trendline (resistance). However, it is steadily approaching a critical demand area.
The Supply/Buy Zone: A major institutional demand zone is sitting between 0.00000310 and 0.00000319. This is where we expect smart money to step in.
🎯 The Game Plan (Bullish Reversal Setup)
We are waiting for the price to mitigate the green Supply/Buy Zone before looking for a long opportunity.
1 Entry Zone: Look for entries inside the 0.00000310 – 0.00000319 area (Watch for a bullish confirmation/reversal pattern on lower timeframes once it hits this zone).
2 Take Profit (TP) Targets:
1st TP: 0.00000350 (Recent minor lower high / trendline break confirmation)
2nd TP: 0.00000380
3rd TP: 0.00000420
Final Target: 0.00000440+ (The Resistance Sell Zone / Break Final Buy area)
⚠️ Note: Always practice proper risk management. Wait for the price to drop into the buy zone and show signs of rejection before jumping in!
What are your thoughts on PEPE? Let me know in the comments! 👇#PEPE #usdt #BTC #NewsAboutCrypto
1
115
·
--
Bullish
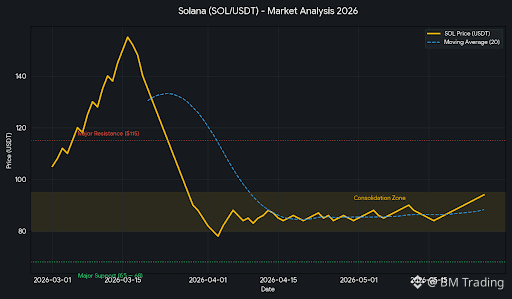
🚀 SOL/USDT Technical Analysis: Navigating the Consolidation Phase
Solana ($SOL) is currently exhibiting a strategic consolidation pattern, signaling a potential buildup for its next major move. After experiencing volatility earlier in the year, the price action is now stabilizing within a defined range.
📊 Key Technical Indicators:
Current Trend: $SOL is currently trading within a Consolidation Zone between $80 and $95. This sideways movement suggests that the market is absorbing previous sell-offs and preparing for a breakout.
Moving Averages: The 20-day Moving Average is beginning to flatten, indicating a temporary equilibrium between buyers and sellers.
Support Level: A rock-solid Major Support exists between $65 - $68. This zone has historically acted as a strong demand area where buyers step in aggressively.
Resistance Level: The immediate hurdle for a bullish reversal is the $115 Major Resistance. A clean daily close above this level with high volume is required to confirm a trend shift.
💡 Trading Strategy:
Bullish Case: If $SOL breaks and holds above $115, we could see a rapid move toward the $140 - $160 targets.
Bearish Case: A breakdown below the $80 mark might lead to a "re-test" of the $65 support level before the next leg up.
Conclusion: This is an ideal time for "accumulation" for long-term holders, while swing traders should wait for a confirmed breakout above resistance.
Disclaimer: This analysis is for educational purposes only and does not constitute financial advice. Always perform your own research (DYOR) before trading.
Hashtags: #SOL #Solana #CryptoAnalysis #BinanceSquare #Altcoins #TradingSignals
🚀 SOL/USDT Technical Analysis: Navigating the Consolidation Phase
Solana ($SOL) is currently exhibiting a strategic consolidation pattern, signaling a potential buildup for its next major move. After experiencing volatility earlier in the year, the price action is now stabilizing within a defined range.
📊 Key Technical Indicators:
Current Trend: $SOL is currently trading within a Consolidation Zone between $80 and $95. This sideways movement suggests that the market is absorbing previous sell-offs and preparing for a breakout.
Moving Averages: The 20-day Moving Average is beginning to flatten, indicating a temporary equilibrium between buyers and sellers.
Support Level: A rock-solid Major Support exists between $65 - $68. This zone has historically acted as a strong demand area where buyers step in aggressively.
Resistance Level: The immediate hurdle for a bullish reversal is the $115 Major Resistance. A clean daily close above this level with high volume is required to confirm a trend shift.
💡 Trading Strategy:
Bullish Case: If $SOL breaks and holds above $115, we could see a rapid move toward the $140 - $160 targets.
Bearish Case: A breakdown below the $80 mark might lead to a "re-test" of the $65 support level before the next leg up.
Conclusion: This is an ideal time for "accumulation" for long-term holders, while swing traders should wait for a confirmed breakout above resistance.
Disclaimer: This analysis is for educational purposes only and does not constitute financial advice. Always perform your own research (DYOR) before trading.
Hashtags: #SOL #Solana #CryptoAnalysis #BinanceSquare #Altcoins #TradingSignals
Solana ($SOL) is currently exhibiting a strategic consolidation pattern, signaling a potential buildup for its next major move. After experiencing volatility earlier in the year, the price action is now stabilizing within a defined range.
📊 Key Technical Indicators:
Current Trend: $SOL is currently trading within a Consolidation Zone between $80 and $95. This sideways movement suggests that the market is absorbing previous sell-offs and preparing for a breakout.
Moving Averages: The 20-day Moving Average is beginning to flatten, indicating a temporary equilibrium between buyers and sellers.
Support Level: A rock-solid Major Support exists between $65 - $68. This zone has historically acted as a strong demand area where buyers step in aggressively.
Resistance Level: The immediate hurdle for a bullish reversal is the $115 Major Resistance. A clean daily close above this level with high volume is required to confirm a trend shift.
💡 Trading Strategy:
Bullish Case: If $SOL breaks and holds above $115, we could see a rapid move toward the $140 - $160 targets.
Bearish Case: A breakdown below the $80 mark might lead to a "re-test" of the $65 support level before the next leg up.
Conclusion: This is an ideal time for "accumulation" for long-term holders, while swing traders should wait for a confirmed breakout above resistance.
Disclaimer: This analysis is for educational purposes only and does not constitute financial advice. Always perform your own research (DYOR) before trading.
Hashtags: #SOL #Solana #CryptoAnalysis #BinanceSquare #Altcoins #TradingSignals
1
110
·
--
344
·
--

Article
Hello Guys Binance Giveaway 🏆️🏆️🇬🇧Hello Guys 🏆️
[https://app.binance.com/uni-qr/Lqp3F7Ud?utm_medium=web_share_copy](https://app.binance.com/uni-qr/Lqp3F7Ud?utm_medium=web_share_copy)
Go to this link and get your 10000USDC.
At the same time, I will give you a free Giveaway, everyone, enter your binance ID / Email / Phone No.
Hello Guys Binance Giveaway 🏆️🏆️🇬🇧
Hello Guys 🏆️
https://app.binance.com/uni-qr/Lqp3F7Ud?utm_medium=web_share_copy
Go to this link and get your 10000USDC.
At the same time, I will give you a free Giveaway, everyone, enter your binance ID / Email / Phone No.
https://app.binance.com/uni-qr/Lqp3F7Ud?utm_medium=web_share_copy
Go to this link and get your 10000USDC.
At the same time, I will give you a free Giveaway, everyone, enter your binance ID / Email / Phone No.
15

·
--

Article
XRP Surges Amid SEC Appeal Speculation and Strategic Reserve TalksMarch 6, 2025 – The Latest on XRP
XRP is making headlines today as speculation grows over the U.S. Securities and Exchange Commission’s (SEC) next move in its ongoing legal battle with Ripple. This comes alongside reports that the White House is considering XRP as part of a U.S. Crypto Strategic Reserve Asset, a development that could significantly impact the cryptocurrency’s future.
SEC Appeal: Will It Be Dropped?
The SEC is expected to discuss its appeal against Ripple in a closed meeting today, March 6. This follows previous legal victories for Ripple, where the court ruled that programmatic sales of XRP do not constitute securities offerings. If the SEC decides to withdraw its appeal, it could clear regulatory uncertainty and trigger a major rally for XRP. On the flip side, if the appeal proceeds, XRP could experience increased volatility (FXEmpire).
XRP in the U.S. Crypto Reserve?
Adding to the excitement, the White House's upcoming Crypto Summit on March 8 is expected to provide more details on the U.S. Crypto Strategic Reserve Asset, which could include allocations for XRP, Bitcoin, Ethereum, and other major cryptocurrencies. If XRP receives a significant allocation, it could attract institutional investors and boost its price further (FXEmpire).
XRP Price Trends and Market Reaction
XRP experienced a price spike earlier this week, briefly hitting $3.00 before retracing to $2.21. Currently, XRP is trading around $2.45, up 2.83% in the past 24 hours. Analysts suggest that if the SEC drops its appeal and the strategic reserve plan moves forward, XRP could break its previous all-time high of $3.55 and potentially aim for $5.00. However, continued legal uncertainty could push prices below $1.50 (FXEmpire, CoinEdition).
{spot}(XRPUSDT)
$XRP
XRP Surges Amid SEC Appeal Speculation and Strategic Reserve Talks
March 6, 2025 – The Latest on XRP
XRP is making headlines today as speculation grows over the U.S. Securities and Exchange Commission’s (SEC) next move in its ongoing legal battle with Ripple. This comes alongside reports that the White House is considering XRP as part of a U.S. Crypto Strategic Reserve Asset, a development that could significantly impact the cryptocurrency’s future.
SEC Appeal: Will It Be Dropped?
The SEC is expected to discuss its appeal against Ripple in a closed meeting today, March 6. This follows previous legal victories for Ripple, where the court ruled that programmatic sales of XRP do not constitute securities offerings. If the SEC decides to withdraw its appeal, it could clear regulatory uncertainty and trigger a major rally for XRP. On the flip side, if the appeal proceeds, XRP could experience increased volatility (FXEmpire).
XRP in the U.S. Crypto Reserve?
Adding to the excitement, the White House's upcoming Crypto Summit on March 8 is expected to provide more details on the U.S. Crypto Strategic Reserve Asset, which could include allocations for XRP, Bitcoin, Ethereum, and other major cryptocurrencies. If XRP receives a significant allocation, it could attract institutional investors and boost its price further (FXEmpire).
XRP Price Trends and Market Reaction
XRP experienced a price spike earlier this week, briefly hitting $3.00 before retracing to $2.21. Currently, XRP is trading around $2.45, up 2.83% in the past 24 hours. Analysts suggest that if the SEC drops its appeal and the strategic reserve plan moves forward, XRP could break its previous all-time high of $3.55 and potentially aim for $5.00. However, continued legal uncertainty could push prices below $1.50 (FXEmpire, CoinEdition).
$XRP
XRP is making headlines today as speculation grows over the U.S. Securities and Exchange Commission’s (SEC) next move in its ongoing legal battle with Ripple. This comes alongside reports that the White House is considering XRP as part of a U.S. Crypto Strategic Reserve Asset, a development that could significantly impact the cryptocurrency’s future.
SEC Appeal: Will It Be Dropped?
The SEC is expected to discuss its appeal against Ripple in a closed meeting today, March 6. This follows previous legal victories for Ripple, where the court ruled that programmatic sales of XRP do not constitute securities offerings. If the SEC decides to withdraw its appeal, it could clear regulatory uncertainty and trigger a major rally for XRP. On the flip side, if the appeal proceeds, XRP could experience increased volatility (FXEmpire).
XRP in the U.S. Crypto Reserve?
Adding to the excitement, the White House's upcoming Crypto Summit on March 8 is expected to provide more details on the U.S. Crypto Strategic Reserve Asset, which could include allocations for XRP, Bitcoin, Ethereum, and other major cryptocurrencies. If XRP receives a significant allocation, it could attract institutional investors and boost its price further (FXEmpire).
XRP Price Trends and Market Reaction
XRP experienced a price spike earlier this week, briefly hitting $3.00 before retracing to $2.21. Currently, XRP is trading around $2.45, up 2.83% in the past 24 hours. Analysts suggest that if the SEC drops its appeal and the strategic reserve plan moves forward, XRP could break its previous all-time high of $3.55 and potentially aim for $5.00. However, continued legal uncertainty could push prices below $1.50 (FXEmpire, CoinEdition).
$XRP
1
1
8
6.7k
·
--

Article
Bitcoin Faces Pressure as U.S. Moves to Sell $6.5 Billion in BTC HoldingsBitcoin markets are on edge today as news breaks that the U.S. government has been cleared to sell a massive $6.5 billion worth of Bitcoin. This sale, tied to seized crypto assets, has sparked fears of a price downturn due to the large volume hitting the market. BTC briefly dipped but is showing resilience as investors assess the situation. Analysts are watching closely for further developments that could impact Bitcoin’s price action in the coming days.
Bitcoin Faces Pressure as U.S. Moves to Sell $6.5 Billion in BTC Holdings
Bitcoin markets are on edge today as news breaks that the U.S. government has been cleared to sell a massive $6.5 billion worth of Bitcoin. This sale, tied to seized crypto assets, has sparked fears of a price downturn due to the large volume hitting the market. BTC briefly dipped but is showing resilience as investors assess the situation. Analysts are watching closely for further developments that could impact Bitcoin’s price action in the coming days.
1
209
·
--

Article
Today PEPE Price AlertPepe (PEPE) Price Prediction: Where is PEPE Headed Today?
March 5, 2025
Pepe (PEPE) is currently trading at $0.0000065, showing a slight increase of 4.46% in the past 24 hours. The meme coin continues to ride the wave of speculative interest, but analysts predict both upward momentum and potential corrections in the short term.
Market Overview
24-hour high: $0.000006624-hour low: $0.00000637-day high: $0.00000707-day low: $0.0000061All-time high: $0.0000098
Technical Analysis
PEPE has been holding steady within its support and resistance range, with short-term volatility likely. If PEPE can maintain its current bullish momentum, it could test the $0.0000072 resistance level. However, a failure to sustain gains might push it toward the $0.0000061 support.
Support and Resistance Levels
Key Support: $0.0000061Key Resistance: $0.0000072Bearish Scenario: If PEPE falls below $0.0000061, it could dip further to $0.0000058.Bullish Scenario: A breakout above $0.0000072 could lead to a run toward $0.0000080 or beyond.
Market Sentiment
Bullish Bias: 52%Bearish Bias: 48%Investor Outlook: Cautiously optimistic, with a focus on speculative momentum.
Short-Term Forecast
March 5 Close Prediction: $0.0000065March 6 Expected Price: $0.0000064 (-1.54%)March 7 Expected Price: $0.0000063 (-1.56%)
Conclusion
Pepe remains a volatile asset, driven by hype and community sentiment. If market optimism holds, PEPE could see further upside. However, traders should be mindful of key support levels, as a breakdown could trigger a deeper pullback
{spot}(PEPEUSDT)
Today PEPE Price Alert
Pepe (PEPE) Price Prediction: Where is PEPE Headed Today?
March 5, 2025
Pepe (PEPE) is currently trading at $0.0000065, showing a slight increase of 4.46% in the past 24 hours. The meme coin continues to ride the wave of speculative interest, but analysts predict both upward momentum and potential corrections in the short term.
Market Overview
24-hour high: $0.000006624-hour low: $0.00000637-day high: $0.00000707-day low: $0.0000061All-time high: $0.0000098
Technical Analysis
PEPE has been holding steady within its support and resistance range, with short-term volatility likely. If PEPE can maintain its current bullish momentum, it could test the $0.0000072 resistance level. However, a failure to sustain gains might push it toward the $0.0000061 support.
Support and Resistance Levels
Key Support: $0.0000061Key Resistance: $0.0000072Bearish Scenario: If PEPE falls below $0.0000061, it could dip further to $0.0000058.Bullish Scenario: A breakout above $0.0000072 could lead to a run toward $0.0000080 or beyond.
Market Sentiment
Bullish Bias: 52%Bearish Bias: 48%Investor Outlook: Cautiously optimistic, with a focus on speculative momentum.
Short-Term Forecast
March 5 Close Prediction: $0.0000065March 6 Expected Price: $0.0000064 (-1.54%)March 7 Expected Price: $0.0000063 (-1.56%)
Conclusion
Pepe remains a volatile asset, driven by hype and community sentiment. If market optimism holds, PEPE could see further upside. However, traders should be mindful of key support levels, as a breakdown could trigger a deeper pullback
March 5, 2025
Pepe (PEPE) is currently trading at $0.0000065, showing a slight increase of 4.46% in the past 24 hours. The meme coin continues to ride the wave of speculative interest, but analysts predict both upward momentum and potential corrections in the short term.
Market Overview
24-hour high: $0.000006624-hour low: $0.00000637-day high: $0.00000707-day low: $0.0000061All-time high: $0.0000098
Technical Analysis
PEPE has been holding steady within its support and resistance range, with short-term volatility likely. If PEPE can maintain its current bullish momentum, it could test the $0.0000072 resistance level. However, a failure to sustain gains might push it toward the $0.0000061 support.
Support and Resistance Levels
Key Support: $0.0000061Key Resistance: $0.0000072Bearish Scenario: If PEPE falls below $0.0000061, it could dip further to $0.0000058.Bullish Scenario: A breakout above $0.0000072 could lead to a run toward $0.0000080 or beyond.
Market Sentiment
Bullish Bias: 52%Bearish Bias: 48%Investor Outlook: Cautiously optimistic, with a focus on speculative momentum.
Short-Term Forecast
March 5 Close Prediction: $0.0000065March 6 Expected Price: $0.0000064 (-1.54%)March 7 Expected Price: $0.0000063 (-1.56%)
Conclusion
Pepe remains a volatile asset, driven by hype and community sentiment. If market optimism holds, PEPE could see further upside. However, traders should be mindful of key support levels, as a breakdown could trigger a deeper pullback
1
1
3
3k
·
--

Article
Today Bitcoin Price AlertBitcoin Price Prediction: Where is BTC Headed Today?
March 5, 2025
As of today, Bitcoin (BTC) is trading at $90,338.65, experiencing a strong bullish trend following recent market corrections. With a total market cap of $1.79 trillion, Bitcoin continues to dominate the crypto space.
Market Overview
24-hour high: $88,10724-hour low: $82,6707-day high: $90,8807-day low: $82,038All-time high: $109,021
Technical Analysis
Bitcoin has recently formed a bullish engulfing pattern, signaling a potential uptrend. This pattern indicates strong buyer momentum and suggests that BTC may challenge its all-time high of $109,021 in the coming days. However, analysts predict short-term price fluctuations before a decisive breakout.
Support and Resistance Levels
Key Support: $88,000Key Resistance: $92,500Bearish Scenario: If BTC fails to hold above $88,000, it may dip toward the $85,000 level.Bullish Scenario: If BTC breaks $92,500, a push toward $95,000 or even $100,000 is possible.
Market Sentiment
Bullish Bias: 53%Bearish Bias: 47%Investor Outlook: Mixed, with slight bullish momentum
Short-Term Forecast
March 5 Close Prediction: $88,006.60March 6 Expected Price: $87,979.86 (-0.03%)March 7 Expected Price: $87,953.13 (-0.03%)
Conclusion
Bitcoin is currently showing bullish strength, but traders should remain cautious of minor corrections. If BTC maintains its upward momentum, it could soon retest the $100,000 mark. However, a failure to hold key support levels could lead to a temporary retracement before the next rally.
Today Bitcoin Price Alert
Bitcoin Price Prediction: Where is BTC Headed Today?
March 5, 2025
As of today, Bitcoin (BTC) is trading at $90,338.65, experiencing a strong bullish trend following recent market corrections. With a total market cap of $1.79 trillion, Bitcoin continues to dominate the crypto space.
Market Overview
24-hour high: $88,10724-hour low: $82,6707-day high: $90,8807-day low: $82,038All-time high: $109,021
Technical Analysis
Bitcoin has recently formed a bullish engulfing pattern, signaling a potential uptrend. This pattern indicates strong buyer momentum and suggests that BTC may challenge its all-time high of $109,021 in the coming days. However, analysts predict short-term price fluctuations before a decisive breakout.
Support and Resistance Levels
Key Support: $88,000Key Resistance: $92,500Bearish Scenario: If BTC fails to hold above $88,000, it may dip toward the $85,000 level.Bullish Scenario: If BTC breaks $92,500, a push toward $95,000 or even $100,000 is possible.
Market Sentiment
Bullish Bias: 53%Bearish Bias: 47%Investor Outlook: Mixed, with slight bullish momentum
Short-Term Forecast
March 5 Close Prediction: $88,006.60March 6 Expected Price: $87,979.86 (-0.03%)March 7 Expected Price: $87,953.13 (-0.03%)
Conclusion
Bitcoin is currently showing bullish strength, but traders should remain cautious of minor corrections. If BTC maintains its upward momentum, it could soon retest the $100,000 mark. However, a failure to hold key support levels could lead to a temporary retracement before the next rally.
March 5, 2025
As of today, Bitcoin (BTC) is trading at $90,338.65, experiencing a strong bullish trend following recent market corrections. With a total market cap of $1.79 trillion, Bitcoin continues to dominate the crypto space.
Market Overview
24-hour high: $88,10724-hour low: $82,6707-day high: $90,8807-day low: $82,038All-time high: $109,021
Technical Analysis
Bitcoin has recently formed a bullish engulfing pattern, signaling a potential uptrend. This pattern indicates strong buyer momentum and suggests that BTC may challenge its all-time high of $109,021 in the coming days. However, analysts predict short-term price fluctuations before a decisive breakout.
Support and Resistance Levels
Key Support: $88,000Key Resistance: $92,500Bearish Scenario: If BTC fails to hold above $88,000, it may dip toward the $85,000 level.Bullish Scenario: If BTC breaks $92,500, a push toward $95,000 or even $100,000 is possible.
Market Sentiment
Bullish Bias: 53%Bearish Bias: 47%Investor Outlook: Mixed, with slight bullish momentum
Short-Term Forecast
March 5 Close Prediction: $88,006.60March 6 Expected Price: $87,979.86 (-0.03%)March 7 Expected Price: $87,953.13 (-0.03%)
Conclusion
Bitcoin is currently showing bullish strength, but traders should remain cautious of minor corrections. If BTC maintains its upward momentum, it could soon retest the $100,000 mark. However, a failure to hold key support levels could lead to a temporary retracement before the next rally.
2
412
·
--

Article
TODAY PEPE COIN UPADTE 🇬🇧As of March 4, 2025, the Pepe Coin (PEPE) market is experiencing a slight downward trend.
Recent analyses present mixed forecasts for PEPE's performance in 2025. According to CoinGape, as of March 1, 2025, PEPE was trading at $0.00000761, with a market cap of $3.20 billion. The technical chart on the weekly timeframe showed a bullish engulfing pattern, suggesting strong momentum favoring buyers. However, despite this pattern, the price has decreased by approximately 3.88% over the past 24 hours.
Similarly, Changelly's recent price forecast indicates that PEPE's value will increase by 11.29%, reaching $0.00000866 by March 4, 2025. However, it's important to note that these forecasts are speculative and subject to market volatility.
In summary, while technical indicators have previously suggested bullish trends for PEPE, the current market data as of March 4, 2025, shows a slight decrease in price. Investors should approach such volatile assets with caution and conduct thorough research before making investment decisions.
TODAY PEPE COIN UPADTE 🇬🇧
As of March 4, 2025, the Pepe Coin (PEPE) market is experiencing a slight downward trend.
Recent analyses present mixed forecasts for PEPE's performance in 2025. According to CoinGape, as of March 1, 2025, PEPE was trading at $0.00000761, with a market cap of $3.20 billion. The technical chart on the weekly timeframe showed a bullish engulfing pattern, suggesting strong momentum favoring buyers. However, despite this pattern, the price has decreased by approximately 3.88% over the past 24 hours.
Similarly, Changelly's recent price forecast indicates that PEPE's value will increase by 11.29%, reaching $0.00000866 by March 4, 2025. However, it's important to note that these forecasts are speculative and subject to market volatility.
In summary, while technical indicators have previously suggested bullish trends for PEPE, the current market data as of March 4, 2025, shows a slight decrease in price. Investors should approach such volatile assets with caution and conduct thorough research before making investment decisions.
Recent analyses present mixed forecasts for PEPE's performance in 2025. According to CoinGape, as of March 1, 2025, PEPE was trading at $0.00000761, with a market cap of $3.20 billion. The technical chart on the weekly timeframe showed a bullish engulfing pattern, suggesting strong momentum favoring buyers. However, despite this pattern, the price has decreased by approximately 3.88% over the past 24 hours.
Similarly, Changelly's recent price forecast indicates that PEPE's value will increase by 11.29%, reaching $0.00000866 by March 4, 2025. However, it's important to note that these forecasts are speculative and subject to market volatility.
In summary, while technical indicators have previously suggested bullish trends for PEPE, the current market data as of March 4, 2025, shows a slight decrease in price. Investors should approach such volatile assets with caution and conduct thorough research before making investment decisions.
1
187
·
--
Bullish
WOW 😍😍 PEPE 1 TP STEP DONE
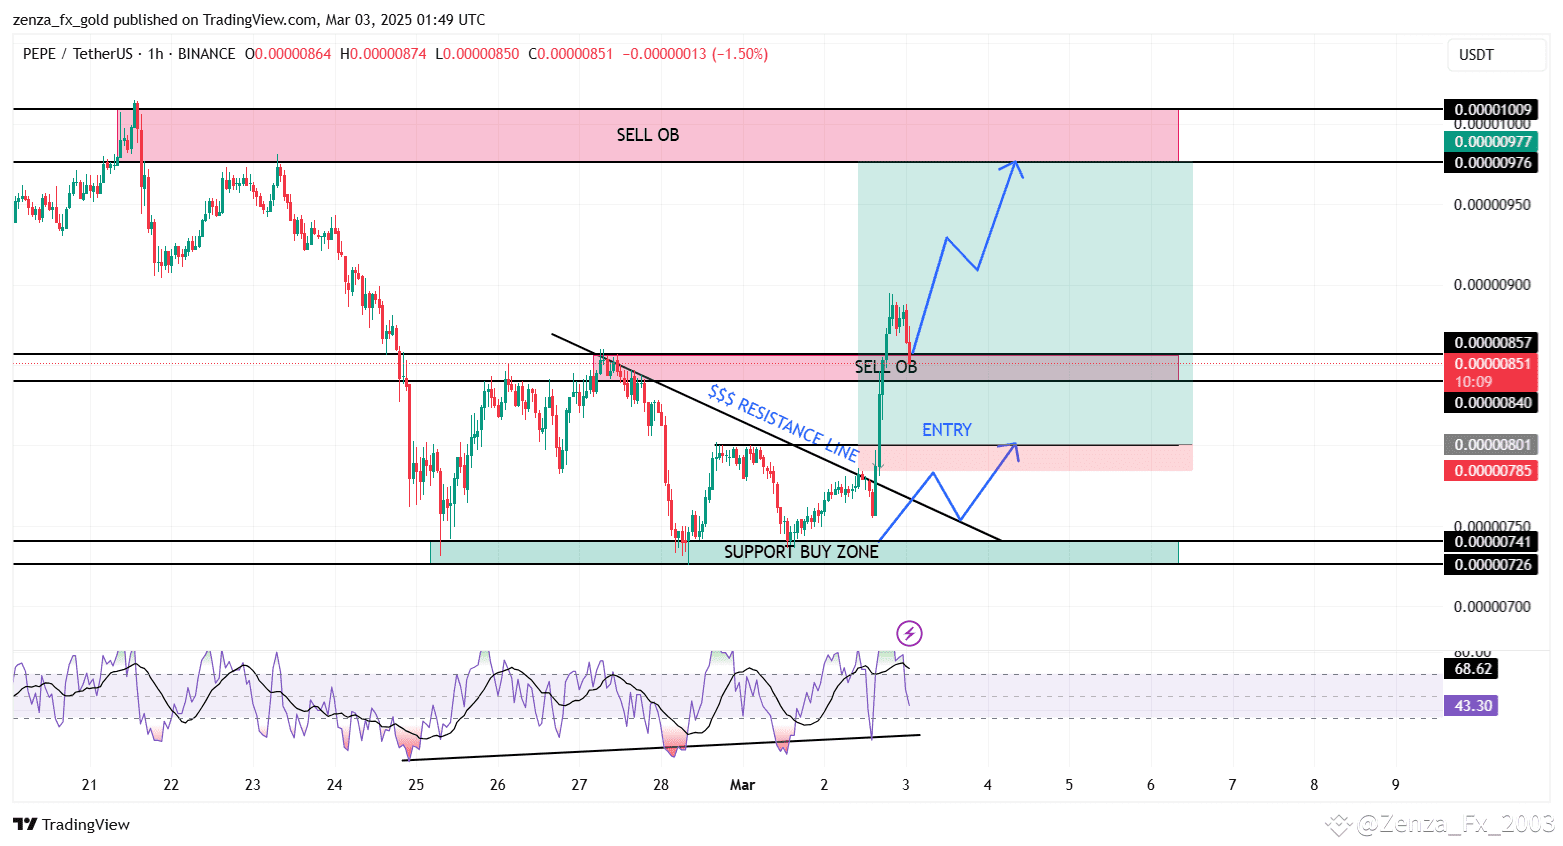
Our first TP is hit. Again our 2nd TP is our sell zone which is 0.00000976. So far the pepe traders have made a good profit. However everyone be careful. I will give a step by step update.
{spot}(PEPEUSDT)
WOW 😍😍 PEPE 1 TP STEP DONE
Our first TP is hit. Again our 2nd TP is our sell zone which is 0.00000976. So far the pepe traders have made a good profit. However everyone be careful. I will give a step by step update.
Our first TP is hit. Again our 2nd TP is our sell zone which is 0.00000976. So far the pepe traders have made a good profit. However everyone be careful. I will give a step by step update.
1
5
7.7k
·
--
Bullish
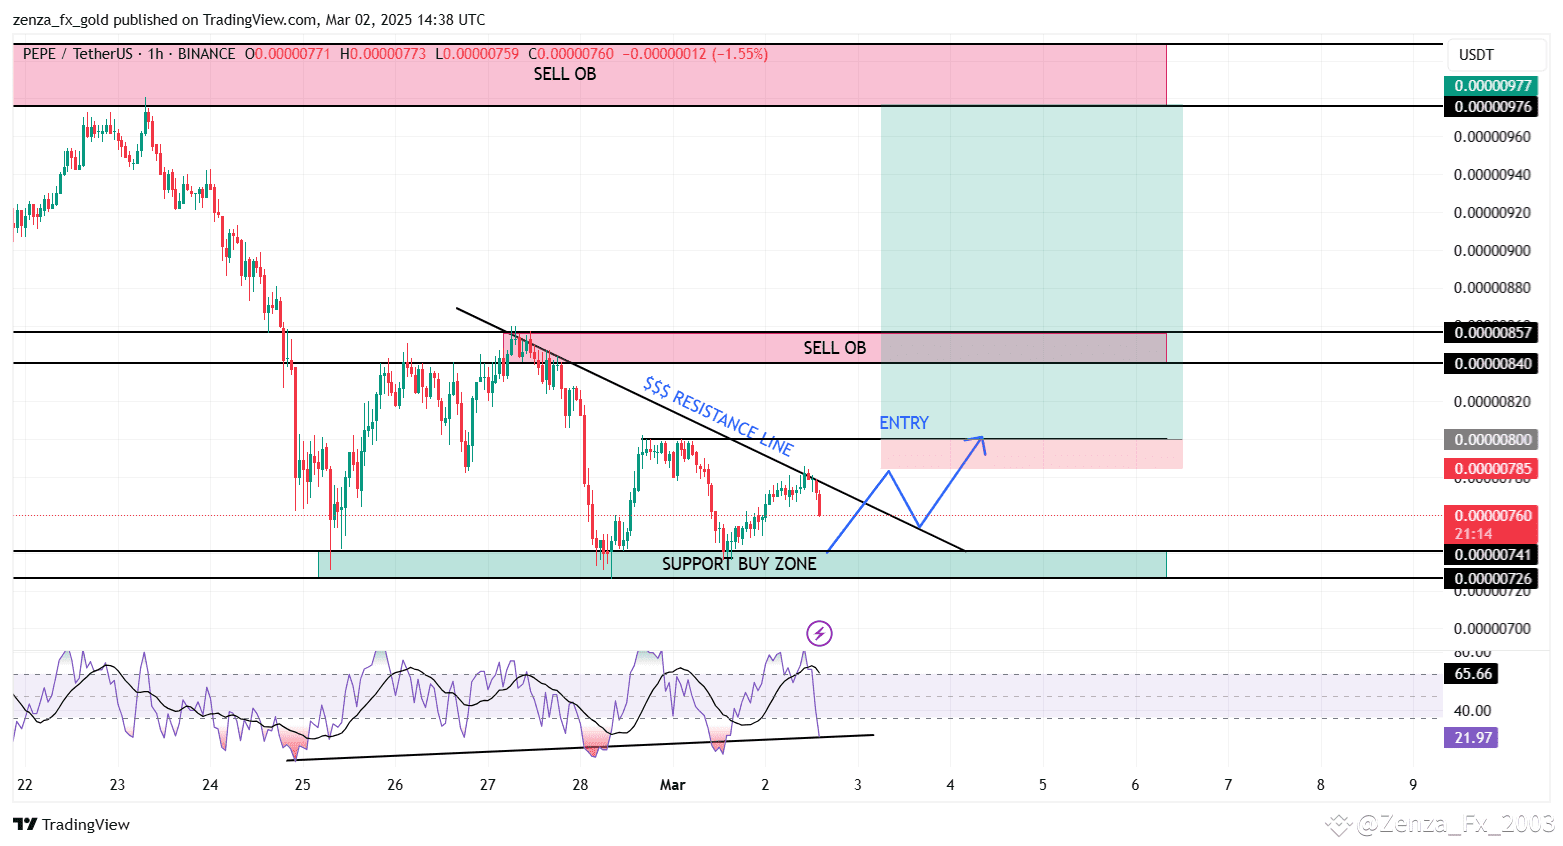
PEPE Drop 0.00000741 / Good Confirmation 0.00000800 Entry Point.
Next Target 0.00000978 $
{spot}(PEPEUSDT)
PEPE Drop 0.00000741 / Good Confirmation 0.00000800 Entry Point.
Next Target 0.00000978 $
Next Target 0.00000978 $
7
4.6k
·
--
Bullish
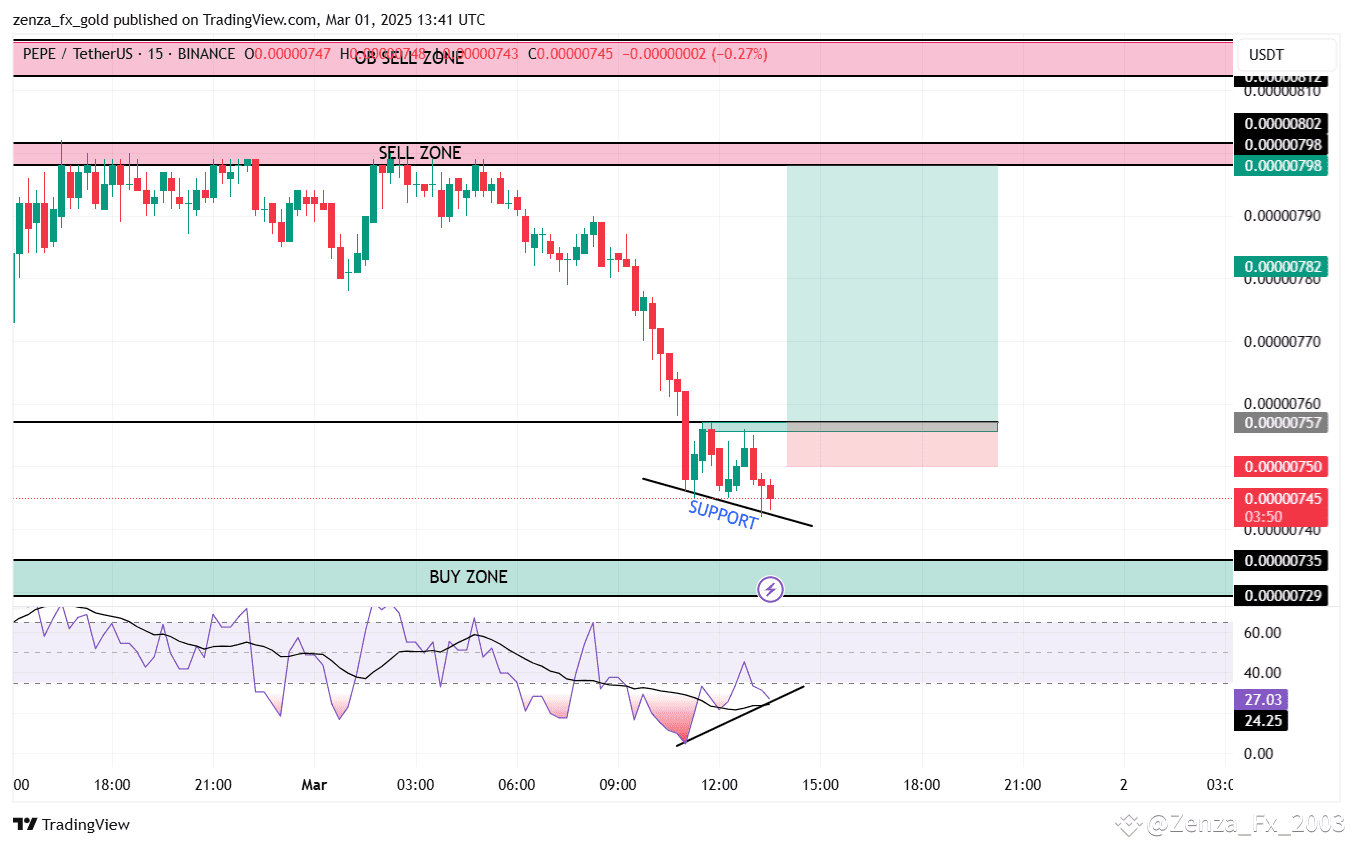
PEPE confirmed entry. future traders should wait patiently. Strong buy trade possible. Between 0.00000757
{spot}(PEPEUSDT)
PEPE confirmed entry. future traders should wait patiently. Strong buy trade possible. Between 0.00000757
2
969
·
--
Bullish
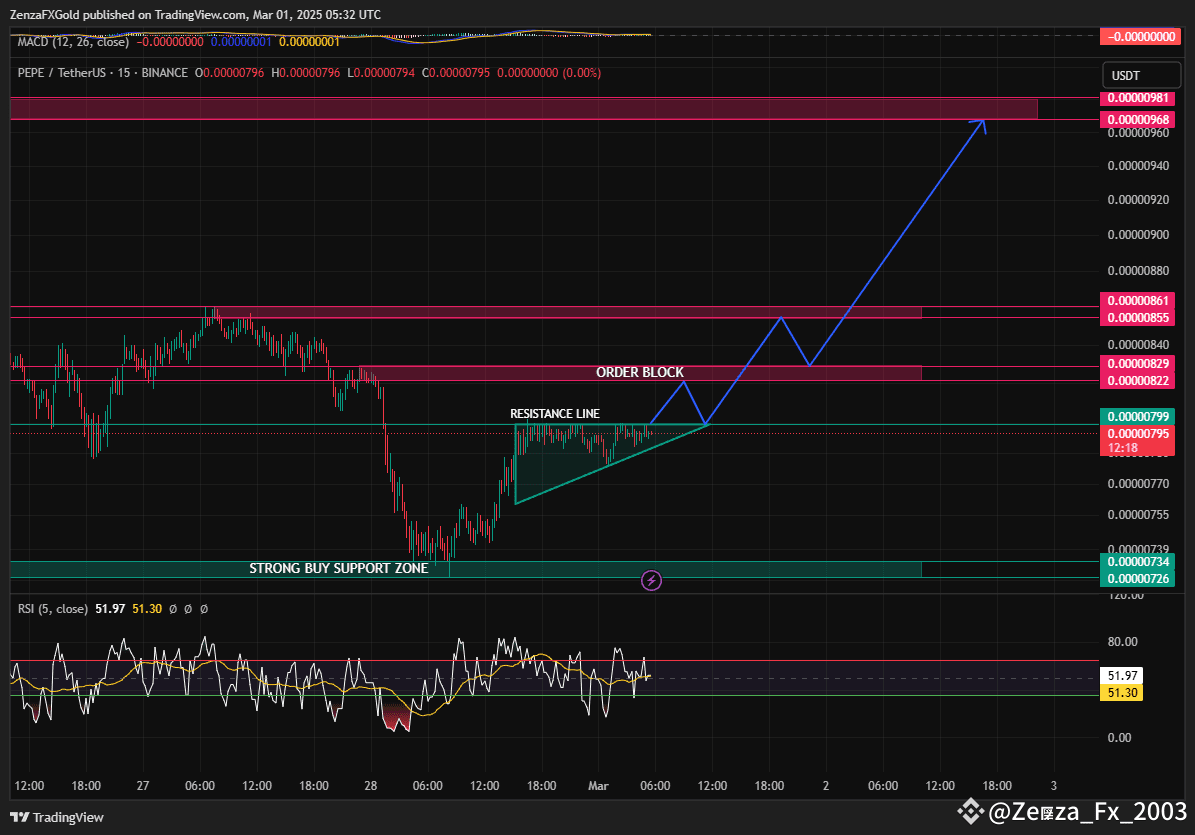
According to our analysis, there is a tendency for pepe to fly from 0.00000797 to 0.00000968 to our sell zone. Most likely, if the pepe market flies to that sell zone, there is a big tendency for the pepe market to not go back to this strong buy support zone. You can make a good profit by holding pepe coin.$
{spot}(PEPEUSDT)
According to our analysis, there is a tendency for pepe to fly from 0.00000797 to 0.00000968 to our sell zone. Most likely, if the pepe market flies to that sell zone, there is a big tendency for the pepe market to not go back to this strong buy support zone. You can make a good profit by holding pepe coin.$
2
627
·
--
Bullish
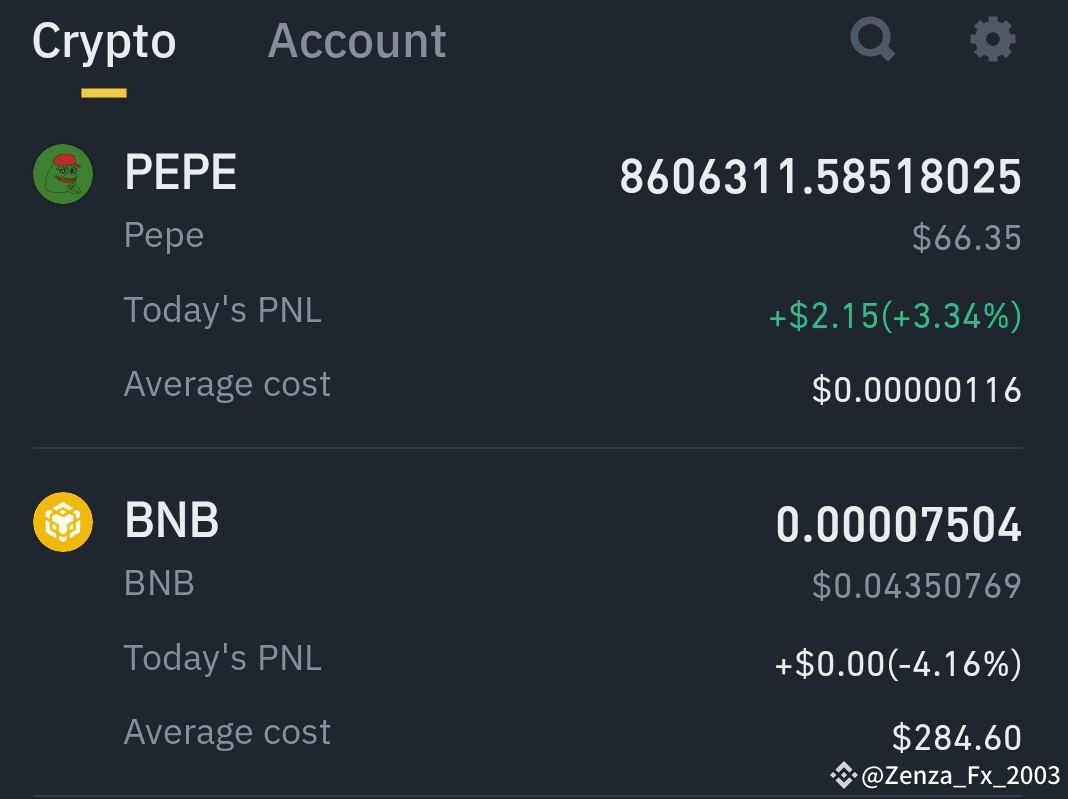
PEPE NICE REACTION 🏆️🎖️️ STRONG BUY ZONE 🏆️
PEPE NICE REACTION 🏆️🎖️️ STRONG BUY ZONE 🏆️
1
529
·
--
Bearish
PEPE SELL NOW 🧨 ENTRY PRICE 0.0000929 / 0.0000930
🎯 1TP 0.0000914
🎯 2 TP 0.0000906
🎯 3 TP 0.0000895
🧨 SL 0.0000934
{spot}(PEPEUSDT)
PEPE SELL NOW 🧨 ENTRY PRICE 0.0000929 / 0.0000930
🎯 1TP 0.0000914
🎯 2 TP 0.0000906
🎯 3 TP 0.0000895
🧨 SL 0.0000934
🎯 1TP 0.0000914
🎯 2 TP 0.0000906
🎯 3 TP 0.0000895
🧨 SL 0.0000934
1
426
·
--
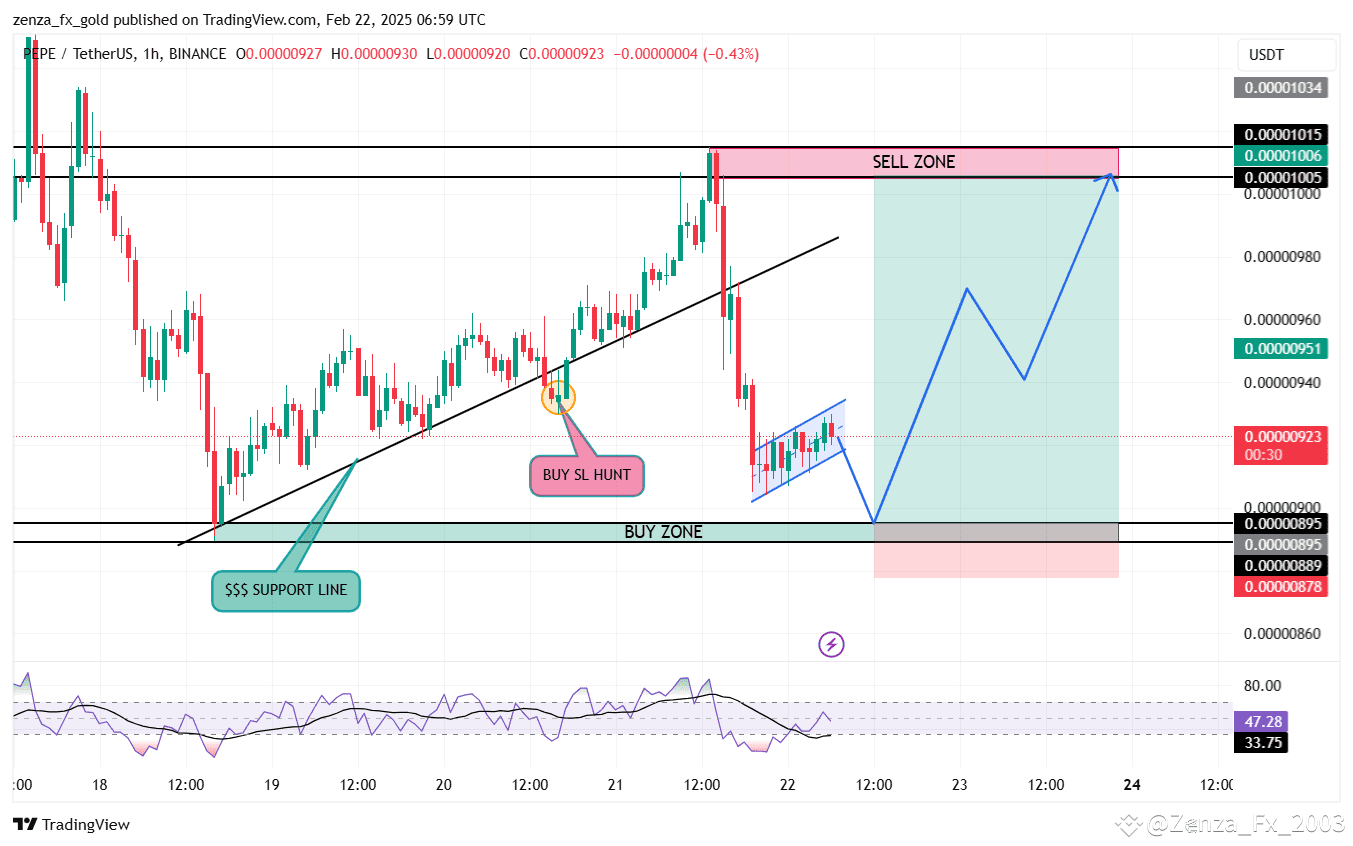
According to my analysis, the PEPE market has a strong tendency to fly back to the 0.0001005 selling zone after breaking down to a price range between 0.0000895 or 0.0000889. If that selling zone is broken, we will talk about it again with an analysis. However, everyone, trade with caution. I will look for a good entry point and give you a signal. Good luck
{spot}(PEPEUSDT)
According to my analysis, the PEPE market has a strong tendency to fly back to the 0.0001005 selling zone after breaking down to a price range between 0.0000895 or 0.0000889. If that selling zone is broken, we will talk about it again with an analysis. However, everyone, trade with caution. I will look for a good entry point and give you a signal. Good luck
1
753
·
--
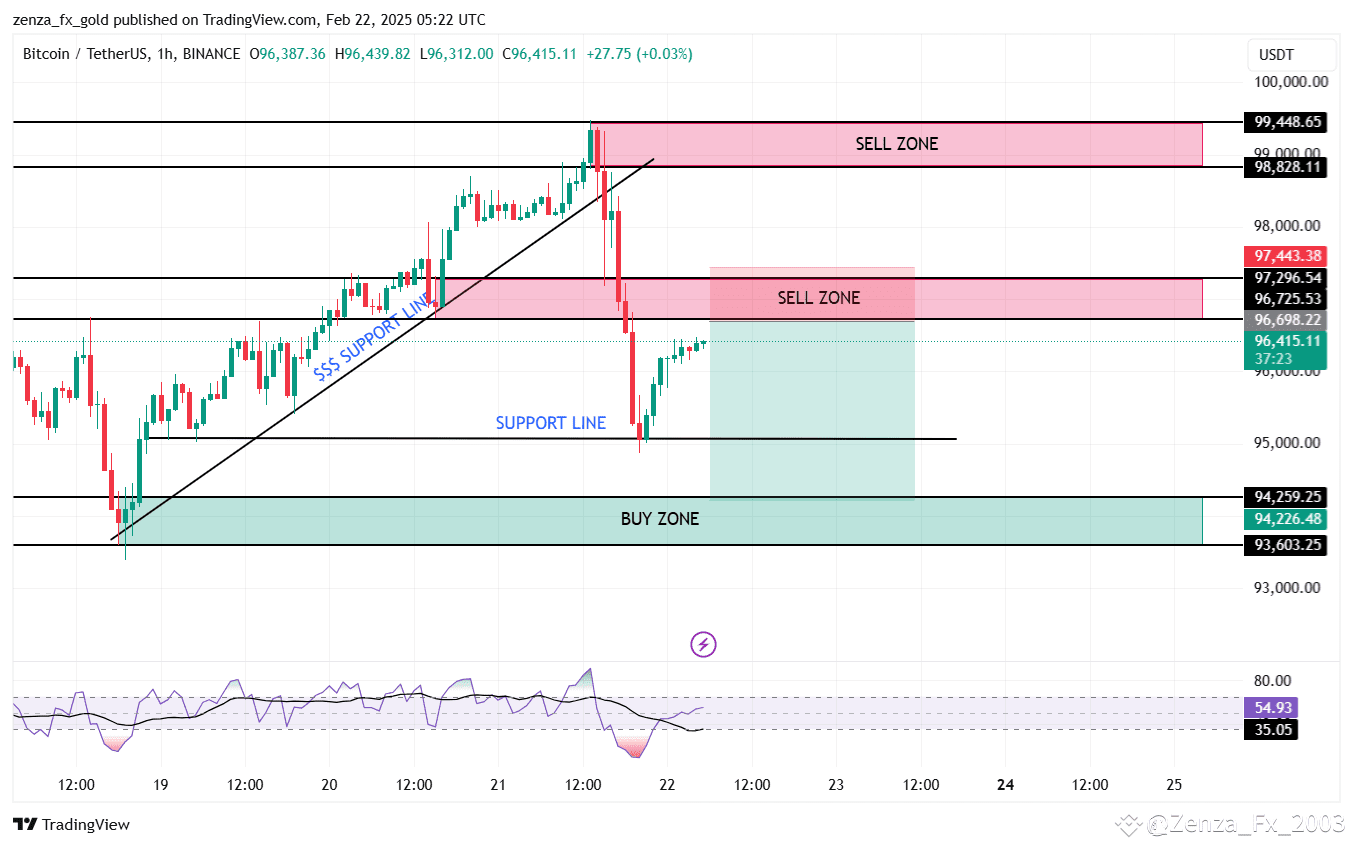
$BTC According to my analysis, the BTC market has a strong tendency to fly into a price range between 96,743 or 97,296 and then fall back to the 94,259 buy zone. If that buy zone breaks, we will talk about it again with an analysis.
{future}(BTCUSDT)
$BTC According to my analysis, the BTC market has a strong tendency to fly into a price range between 96,743 or 97,296 and then fall back to the 94,259 buy zone. If that buy zone breaks, we will talk about it again with an analysis.
4
761
Log in to explore more content
Join global crypto users on Binance Square
⚡️ Get latest and useful information about crypto.
💬 Trusted by the world’s largest crypto exchange.
👍 Discover real insights from verified creators.
Email / Phone number
Trending Topics
BTCBreaks80K
72,222 views
1,469 Discussing
$BTC
What price is BTC going to hit in 2026?
Spot is sitting at $80,748. 104 days to go
↑ $90k - 58%
↑ $100k - 24%
↓ $70k dip first - 48%
The bull case floating around the floor:
>August had a proper run from $62,275 up to $81,479 — up 31% bottom to top
>The CLARITY Act flopped its Senate cloture vote 49-50 on 15 Sept. BTC was already sliding well before the vote, touched $74,968 in that hour, and won it all back inside three days
>The Fed hiked rates on 16 Sept — first time since July 2023. Spot is currently floating 7.4% above that day's low
>The altcoins are proper outrunning it. 30-day view: SOL up 38%, XRP up 35%, ETH up 32% versus BTC up 23%
>The timeline is still packed with reasons why this ought to break down — and that’s precisely the wall of worry bull markets tend to climb
>The midterms land on 3 Nov, right smack in the middle of this market window
So, what would you put down for a punt at +24% in 104 days?
$ETH
$SOL
#BTCBreaks80K #solonapumping #ETH🔥🔥🔥🔥🔥🔥 #BullMarket📈
Wealthy bloke
·4 Likes
·4.9k views
BuffettBecomesBerkshireChairmanEmeritus
17,558 views
513 Discussing
ZcashSpotETFTops$230MMonthlyInflow
4,728 views
76 Discussing