
XTrader猫姐美股交易搬运号
268 Posts

XTrader猫姐美股交易搬运号
XTrader数据科技创始人,15年美股交易,曾驻纽交所交易大厅。五年美股收益率910%(置顶X)仅分享非投资建议。高于此向您学习,低于此我说的您可能听不懂:)油管同名。不会发私信,无telegram/WhatsApp,谨防假冒~
0 Following
190 Followers
142 Liked
Posts
All
Videos
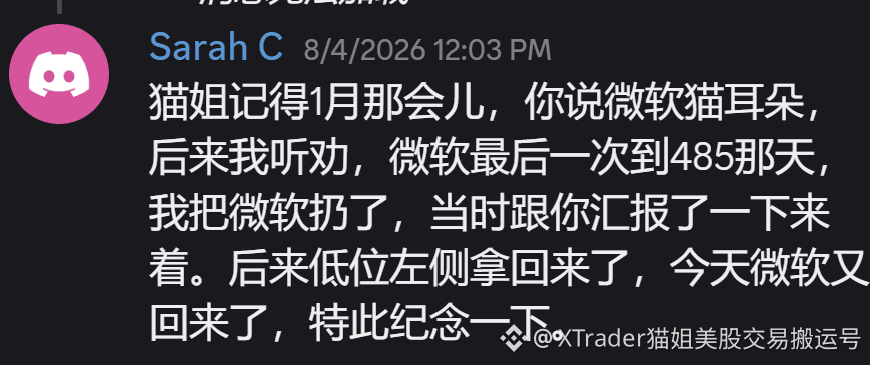
Recently, MSFT’s price action has returned to around the highs from 2025. Looking back to when the stock price was in the 500+ range, the silly cat specifically drew a cat-ear pattern in a members’ recap video to alert everyone to the top characteristics visible in that area. Thanks to the timely analysis, some of our friends successfully managed to escape at the high, and then also accurately seized the moment to open positions on the left side of the bottom trading range. Right now, Microsoft, the boss, is coming back with the momentum of a returning king and is once again catching everyone’s attention. Based on the current data and our calculation-based analysis, the future target price for this stock is expected to be far above last year’s high—so you could say the road ahead will be a long one.
The gossip uproar that recently sparked heated discussion in both the coin-circles and the entertainment industry—this in-depth analysis reveals its essence. In reality, it acts as a kind of perspective mirror that can reflect the parties’ true cognition and energy level. This matter offers us several profound insights.
First, abundant material wealth cannot conceal the emptiness at the core of one’s spirit. Even some individuals who command enormous fortunes still have a starkly barren inner world. Just pay close attention to their words and actions, and you can sense that sense of deprivation lying deep within their bones. As the saying goes, people in different “roads” cannot share the same fate—no matter how astonishing their assets may be, if the inner foundation is still made of mud, they will ultimately be unable to truly transform. In many cases, by observing the details of someone’s behavior and speech, we can roughly see through the real core of who they are.
Second, outstanding looks—if not supported by sufficient wisdom—are like a child holding gold while walking through a busy marketplace: full of risk. Beauty without the backing of intelligence and emotional intelligence often brings hidden dangers, making it easy to invite others’ envy and harm. People often say “morality and capability must match,” but here “morality” does not refer only to personal moral character; it means the overall competence of a person to manage the resources they hold and the fate they control. If their cognitive level does not match their resources, then even if external forces pour in enormous support, it will eventually all be lost. This is also the fundamental reason why, even when global efforts were used to prop them up, the expected results still could not be achieved.
Third, being too shrewd at scheming can easily cut off one’s own exit. That long online post, which appears flawless and intended to completely crush the other party on all fronts, is actually the best annotation of Sun Ge’s true level of vision for himself. The underlying logic of disregarding dignity and tearing the mask off completely ultimately severs his future opportunities to obtain relationships that are pure and sincere. What we can foresee is that the people who will be able to get close to him in the future will likely be only those who are more capable, with more sophisticated tactics and better disguises—interest seekers.
Finally, everything in the world follows the law of resonance at the same frequency, and in the end everyone will walk toward their own destination. Every trap you step into on life’s path often turns out to be one you dug yourself at the start. The clouds in the high sky and the soil on the ground each have their own destinations. The entanglement between these two people is merely a natural reflection of their respective levels of mindset and life choices. If they weren’t originally in the same kind of magnetic field, they naturally would not intersect—or tangle with each other.
First, abundant material wealth cannot conceal the emptiness at the core of one’s spirit. Even some individuals who command enormous fortunes still have a starkly barren inner world. Just pay close attention to their words and actions, and you can sense that sense of deprivation lying deep within their bones. As the saying goes, people in different “roads” cannot share the same fate—no matter how astonishing their assets may be, if the inner foundation is still made of mud, they will ultimately be unable to truly transform. In many cases, by observing the details of someone’s behavior and speech, we can roughly see through the real core of who they are.
Second, outstanding looks—if not supported by sufficient wisdom—are like a child holding gold while walking through a busy marketplace: full of risk. Beauty without the backing of intelligence and emotional intelligence often brings hidden dangers, making it easy to invite others’ envy and harm. People often say “morality and capability must match,” but here “morality” does not refer only to personal moral character; it means the overall competence of a person to manage the resources they hold and the fate they control. If their cognitive level does not match their resources, then even if external forces pour in enormous support, it will eventually all be lost. This is also the fundamental reason why, even when global efforts were used to prop them up, the expected results still could not be achieved.
Third, being too shrewd at scheming can easily cut off one’s own exit. That long online post, which appears flawless and intended to completely crush the other party on all fronts, is actually the best annotation of Sun Ge’s true level of vision for himself. The underlying logic of disregarding dignity and tearing the mask off completely ultimately severs his future opportunities to obtain relationships that are pure and sincere. What we can foresee is that the people who will be able to get close to him in the future will likely be only those who are more capable, with more sophisticated tactics and better disguises—interest seekers.
Finally, everything in the world follows the law of resonance at the same frequency, and in the end everyone will walk toward their own destination. Every trap you step into on life’s path often turns out to be one you dug yourself at the start. The clouds in the high sky and the soil on the ground each have their own destinations. The entanglement between these two people is merely a natural reflection of their respective levels of mindset and life choices. If they weren’t originally in the same kind of magnetic field, they naturally would not intersect—or tangle with each other.
The appeal of a midline investment layout often lies in the thick accumulation and thin emergence after stretching the time horizon. Day to day, watching the market may not seem to bring any obvious change. But after weeks or even months of buildup, the eventual abundant results will become apparent. COIN, which the guy has been keeping an eye on, is precisely a real-life example of this strategy paying off.
This steady, down-to-earth pace is also vividly reflected in NOW’s recent performance. Thanks to the overall positive sentiment released by the software sector, NOW surged by nearly 10% during Thursday’s intraday trading phase. In fact, we’ve been paying close attention since the stock was trading along the lower bound of its box-range throughout the summer; as of today, its cumulative gains have already exceeded 50%. During this period, whenever we do our weekly market recap on our YouTube channel, almost every episode has mentioned this particular target.
From the current technical setup, NOW is now moving near the short-term resistance zone. As long as it can complete the breakout smoothly, the subsequent upside potential will inevitably be fully opened. At the same time, another stock we are monitoring has also successfully finished its hour-chart-level pullback phase and is now steadily returning to its original operating trend.
This steady, down-to-earth pace is also vividly reflected in NOW’s recent performance. Thanks to the overall positive sentiment released by the software sector, NOW surged by nearly 10% during Thursday’s intraday trading phase. In fact, we’ve been paying close attention since the stock was trading along the lower bound of its box-range throughout the summer; as of today, its cumulative gains have already exceeded 50%. During this period, whenever we do our weekly market recap on our YouTube channel, almost every episode has mentioned this particular target.
From the current technical setup, NOW is now moving near the short-term resistance zone. As long as it can complete the breakout smoothly, the subsequent upside potential will inevitably be fully opened. At the same time, another stock we are monitoring has also successfully finished its hour-chart-level pullback phase and is now steadily returning to its original operating trend.
There’s been a lot of heated discussion lately about whether artificial intelligence will truly deliver a massive shock to software stocks. After much deliberation, I believe this pessimistic view is worth questioning. In fact, large capital has already begun making practical moves with real money. Just last night, the latest earnings reports from CRM and CRWD—backed by extremely strong fundamental data—directly shattered the bearish talking points in the market that claim AI will destroy software companies.
For ordinary individual investors, due to relatively limited due-diligence capabilities and resources, they often only see one side of how the industry is developing, making them vulnerable to the limitation of seeing the whole from a single aspect. Earnings reports, however, provide us with a very objective analytical tool. In addition, large funds’ moves can actually be judged with fairly high accuracy through technical charts—this is precisely the logic behind our selection of two software stocks in Q3.
Let’s start by looking at CRM. In the age of AI, the rewriting of code, data migration, and even the mapping and seamless integration of API, workflows, and even the entire CRM permission system can all be handled quickly by AI. Therefore, the company’s real moat hasn’t disappeared—it has evolved into a new logic: customers may of course choose to replace the existing systems, but there is absolutely no need to, because in the AI era, keeping all the Agents here to do their work is the most efficient approach. As long as this business path can run smoothly, AI is not undermining Salesforce—it is amplifying Salesforce’s core value many times over.
Steady revenue figures are the best rebuttal to the bears. Judging from CRM’s financial performance, its adjusted EPS reached an astonishing $5.9—far above Wall Street’s prior expectation of $3.27, with the upside coming in at a massive $2.63. Meanwhile, the company’s revenue also reached approximately $11.3 billion, again comfortably exceeding market expectations.
Next, let’s look at CRWD. This company’s development path is very clear: the stronger the AI technology becomes, the larger the accompanying attack surface will become, the number of agents within systems will increase day by day, and identity recognition and management will become increasingly complex. Against this backdrop, enterprise demand for high-quality security assurance will surge—naturally, CRWD’s importance will rise just as sharply.
This is perfectly reflected in CRWD’s strong earnings report. The company delivered revenue of $1.47 billion, representing a 26% year-over-year growth rate. Its adjusted EPS was $0.31. Both key metrics exceeded market expectations. As the digital security foundation layer, this rapid growth fully confirms that, amid the AI wave sweeping through the market, security infrastructure remains an absolute must-have.
If you’re interested in this area, I highly recommend spending some time to dig deeper into the specific business adjustments and changes these companies reveal in their earnings reports. Understanding how they ride the AI wave is both highly interesting and genuinely enlightening.
For ordinary individual investors, due to relatively limited due-diligence capabilities and resources, they often only see one side of how the industry is developing, making them vulnerable to the limitation of seeing the whole from a single aspect. Earnings reports, however, provide us with a very objective analytical tool. In addition, large funds’ moves can actually be judged with fairly high accuracy through technical charts—this is precisely the logic behind our selection of two software stocks in Q3.
Let’s start by looking at CRM. In the age of AI, the rewriting of code, data migration, and even the mapping and seamless integration of API, workflows, and even the entire CRM permission system can all be handled quickly by AI. Therefore, the company’s real moat hasn’t disappeared—it has evolved into a new logic: customers may of course choose to replace the existing systems, but there is absolutely no need to, because in the AI era, keeping all the Agents here to do their work is the most efficient approach. As long as this business path can run smoothly, AI is not undermining Salesforce—it is amplifying Salesforce’s core value many times over.
Steady revenue figures are the best rebuttal to the bears. Judging from CRM’s financial performance, its adjusted EPS reached an astonishing $5.9—far above Wall Street’s prior expectation of $3.27, with the upside coming in at a massive $2.63. Meanwhile, the company’s revenue also reached approximately $11.3 billion, again comfortably exceeding market expectations.
Next, let’s look at CRWD. This company’s development path is very clear: the stronger the AI technology becomes, the larger the accompanying attack surface will become, the number of agents within systems will increase day by day, and identity recognition and management will become increasingly complex. Against this backdrop, enterprise demand for high-quality security assurance will surge—naturally, CRWD’s importance will rise just as sharply.
This is perfectly reflected in CRWD’s strong earnings report. The company delivered revenue of $1.47 billion, representing a 26% year-over-year growth rate. Its adjusted EPS was $0.31. Both key metrics exceeded market expectations. As the digital security foundation layer, this rapid growth fully confirms that, amid the AI wave sweeping through the market, security infrastructure remains an absolute must-have.
If you’re interested in this area, I highly recommend spending some time to dig deeper into the specific business adjustments and changes these companies reveal in their earnings reports. Understanding how they ride the AI wave is both highly interesting and genuinely enlightening.
Recently, many friends have been very curious about the specific use of our Club’s Zen Movement buy/sell point indicator. Here, we will clarify for everyone: this indicator is currently deployed on our specially built, standalone server environment. Members only need to log in to the Club’s dedicated channel and submit their instructions to instantly view the corresponding analysis results.
Based on actual running records from the backend, the system’s query requests cover almost the entire day. During US stock trading hours, most people’s search focus tends to be on US stock assets; whereas during Asian market trading hours, query instructions involving A-shares and Hong Kong stocks become extremely frequent. In addition, this system can also support investment instruments across different markets such as foreign exchange and precious metals.
To ensure the long-term and stable operation of the entire service architecture, we have set a mechanism to perform regular maintenance about once every month. During the roughly thirty minutes of maintenance, system access will be temporarily suspended.
Coincidentally, today we just carried out one such routine inspection, and I also captured a picture as a record. In everyday use, what everyone experiences is often only the fast feedback from the front-end interface; but behind these convenient operations, there has always been an entire layer of underlying technical support—running continuously, with real-time monitoring and periodic repairs.
Based on actual running records from the backend, the system’s query requests cover almost the entire day. During US stock trading hours, most people’s search focus tends to be on US stock assets; whereas during Asian market trading hours, query instructions involving A-shares and Hong Kong stocks become extremely frequent. In addition, this system can also support investment instruments across different markets such as foreign exchange and precious metals.
To ensure the long-term and stable operation of the entire service architecture, we have set a mechanism to perform regular maintenance about once every month. During the roughly thirty minutes of maintenance, system access will be temporarily suspended.
Coincidentally, today we just carried out one such routine inspection, and I also captured a picture as a record. In everyday use, what everyone experiences is often only the fast feedback from the front-end interface; but behind these convenient operations, there has always been an entire layer of underlying technical support—running continuously, with real-time monitoring and periodic repairs.
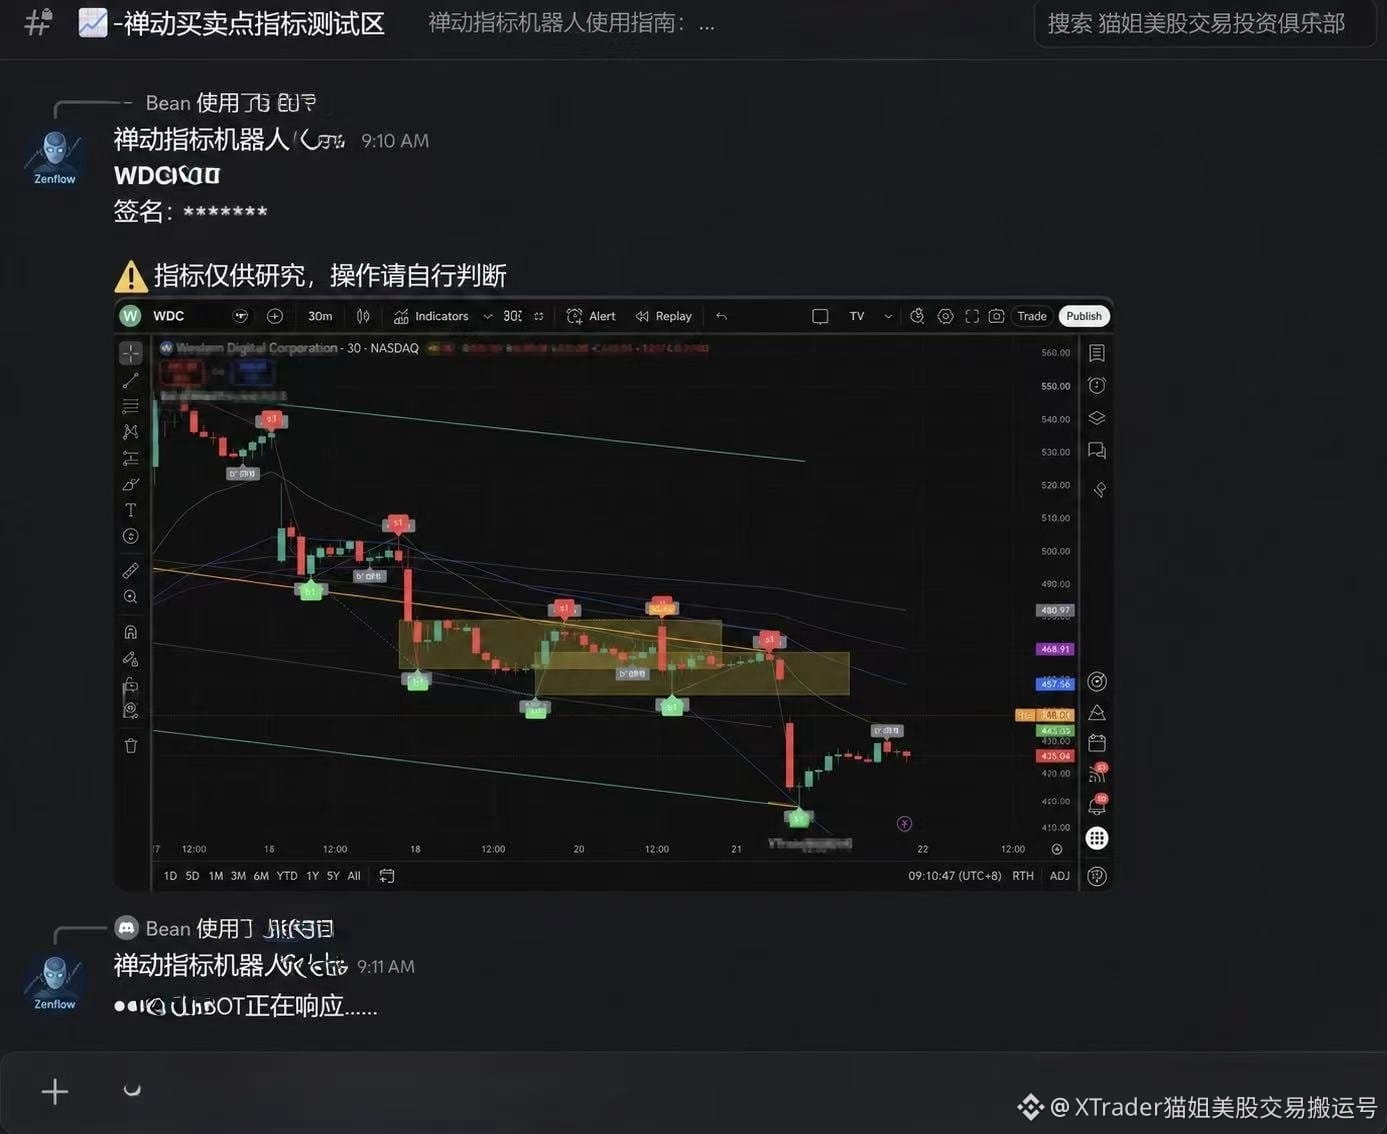
Many friends have recently been asking how exactly to operate the Zen Momentum buy/sell point indicator for Club. Taking advantage of the fact that today we just completed a routine system maintenance and seized the opportunity to screenshot and archive the process, I’ll provide everyone with a straightforward explanation.
To ensure this indicator delivers maximum effectiveness, we built it a dedicated backend service. In terms of the user journey, we chose a Discord-exclusive channel as the core for interaction and output. Members simply need to enter a simple command in the chat box, along with the specific stock or investment instrument code, and they can directly call up and view the indicator results.
Based on the current real-world operation, user query needs cover almost the entire day. During U.S. stock trading hours, most users focus on U.S. market instruments; and when it’s Asia time, searches for A-shares and Hong Kong stocks also frequently appear. In addition, our system fully supports queries for a variety of instruments across different markets, including forex and precious metals.
What everyone typically experiences is that after typing in a code, you can get instant feedback within just a few seconds. Behind this convenience, however, there is a whole set of continuously running underlying infrastructure that also requires ongoing maintenance. To keep this backend service stable and running smoothly, we schedule regular server and system maintenance. This routine upkeep is usually performed about once per month, and during maintenance the service will temporarily stop for around 30 minutes.
To ensure this indicator delivers maximum effectiveness, we built it a dedicated backend service. In terms of the user journey, we chose a Discord-exclusive channel as the core for interaction and output. Members simply need to enter a simple command in the chat box, along with the specific stock or investment instrument code, and they can directly call up and view the indicator results.
Based on the current real-world operation, user query needs cover almost the entire day. During U.S. stock trading hours, most users focus on U.S. market instruments; and when it’s Asia time, searches for A-shares and Hong Kong stocks also frequently appear. In addition, our system fully supports queries for a variety of instruments across different markets, including forex and precious metals.
What everyone typically experiences is that after typing in a code, you can get instant feedback within just a few seconds. Behind this convenience, however, there is a whole set of continuously running underlying infrastructure that also requires ongoing maintenance. To keep this backend service stable and running smoothly, we schedule regular server and system maintenance. This routine upkeep is usually performed about once per month, and during maintenance the service will temporarily stop for around 30 minutes.
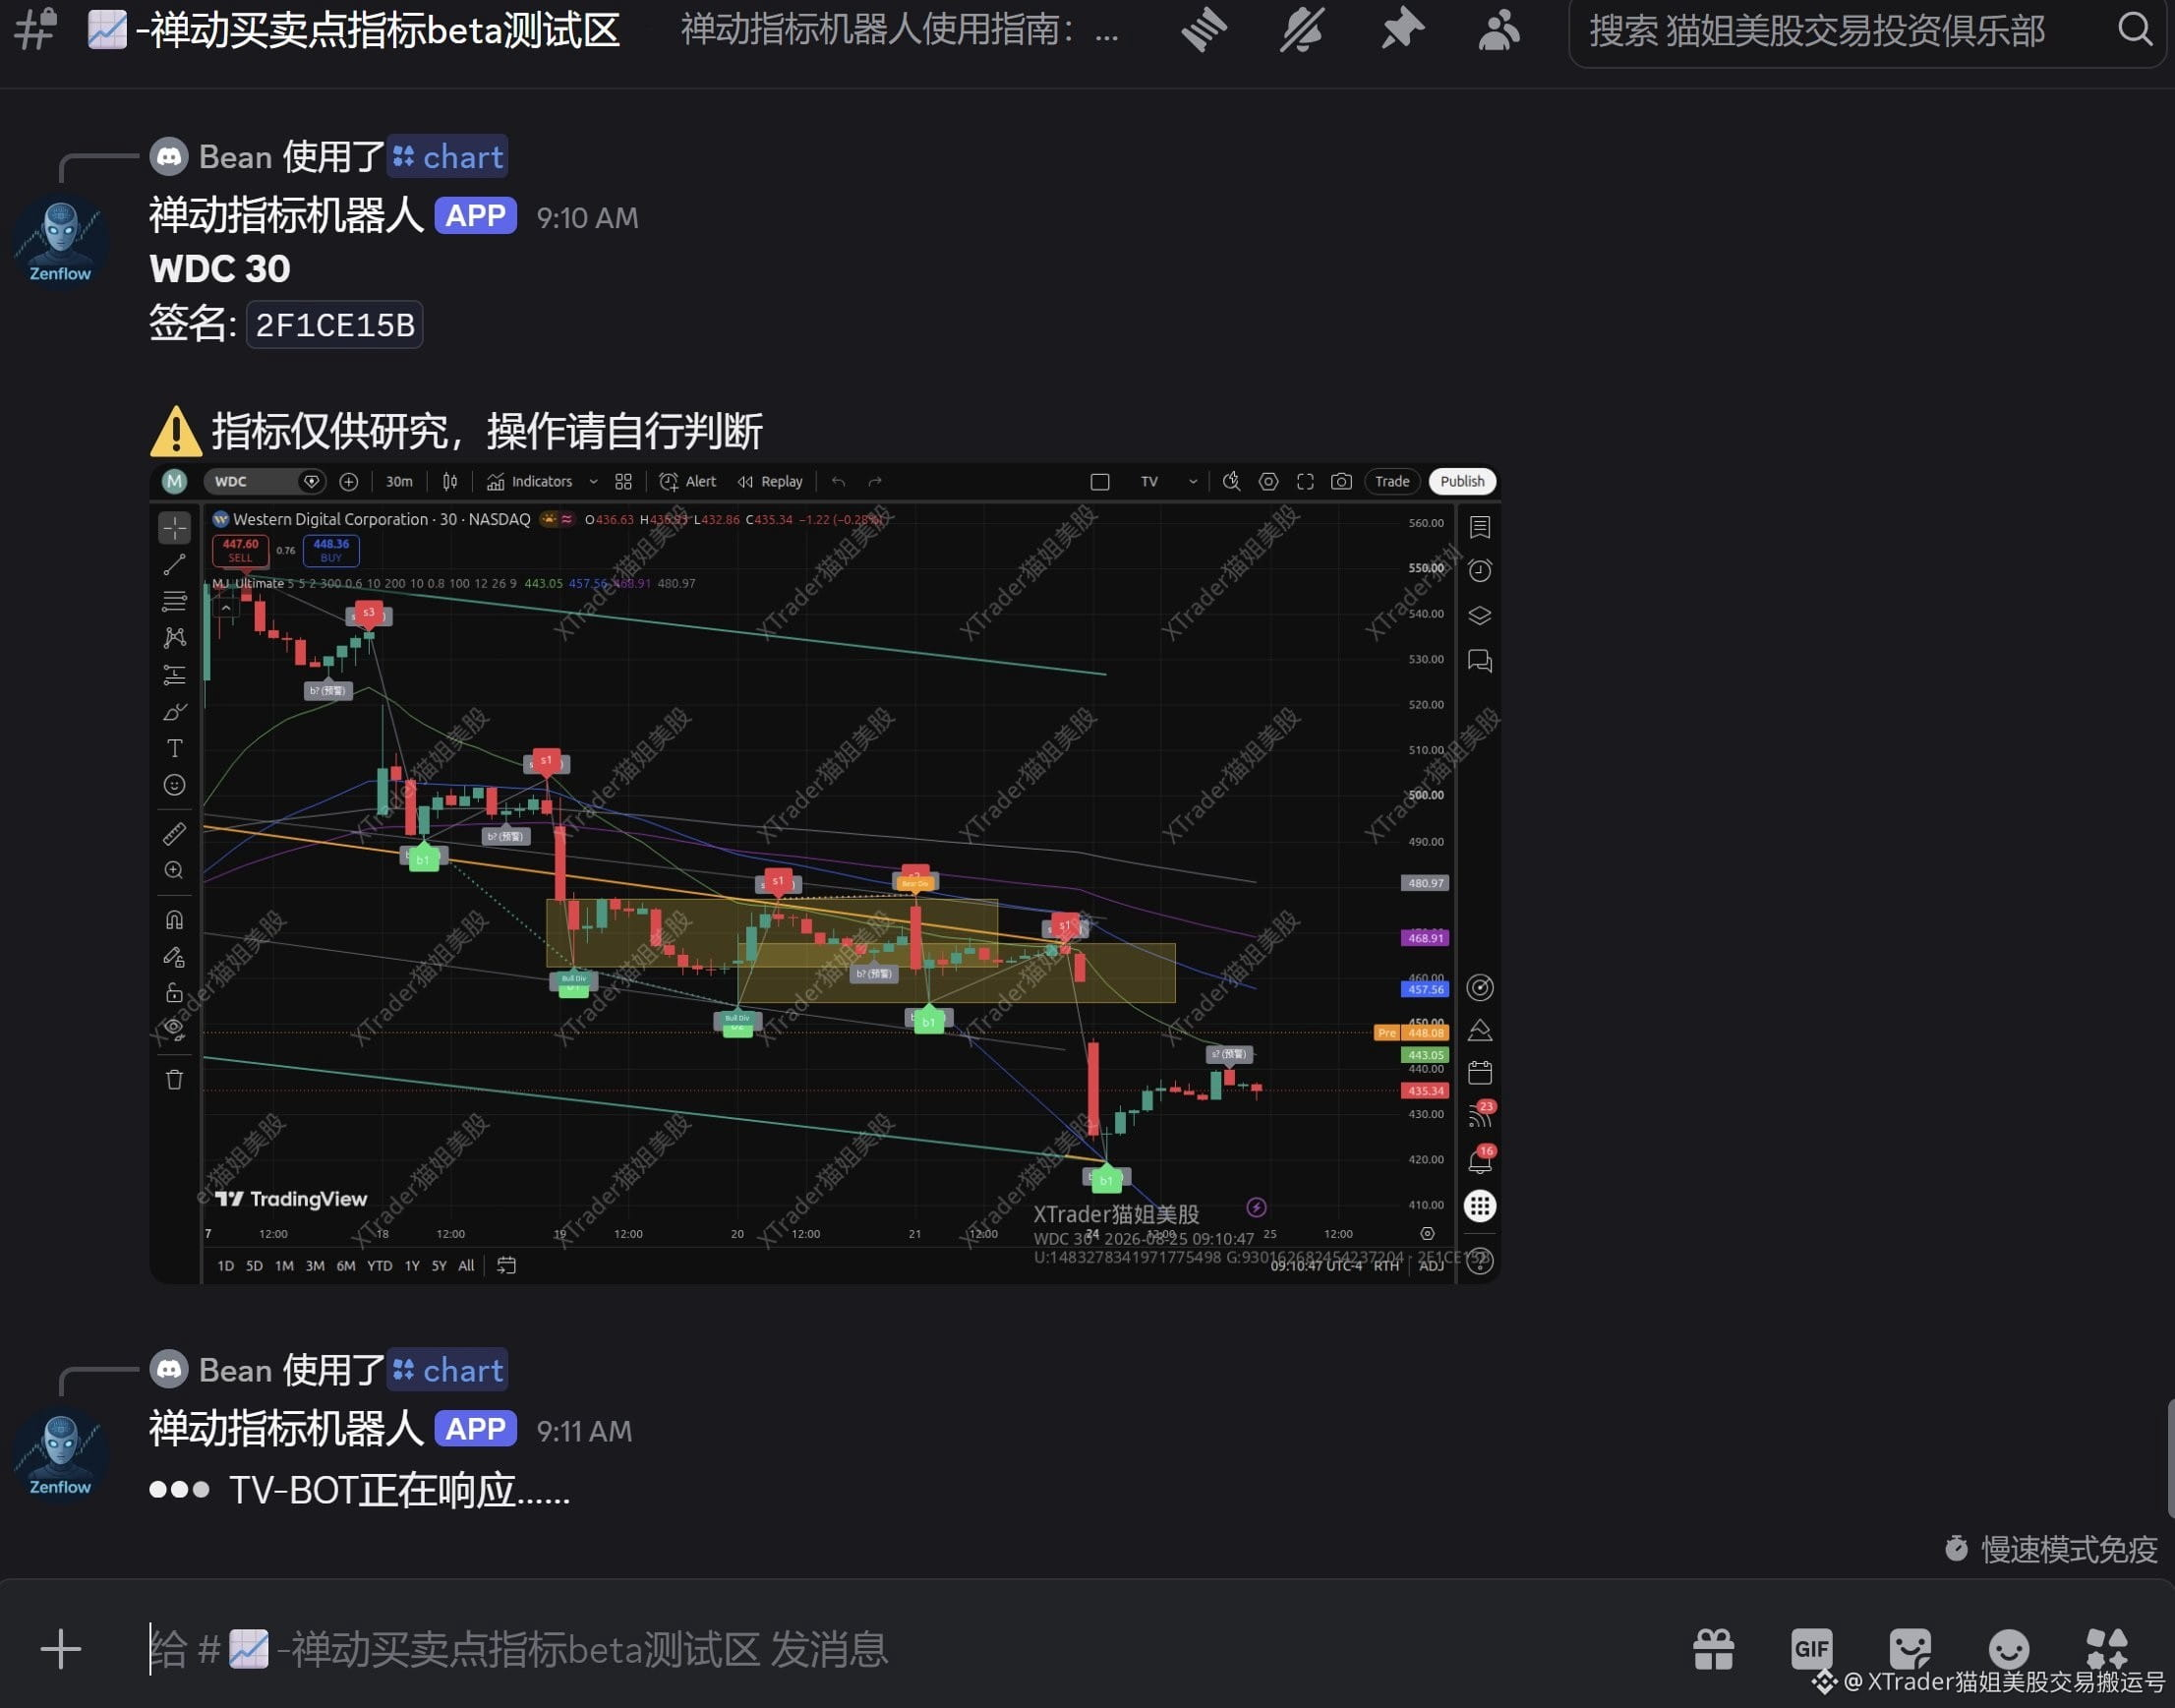
Stupidly, cats usually don’t recommend that everyone rely solely on a single price indicator to make market judgments, because that can easily lead to misunderstandings—for example, accidentally falling into the trap of the main players pushing the price up to distribute or smashing the market to accumulate. However, if we set aside other complex factors and focus specifically on how to confirm a daily-level reversal through the K-line chart, there are actually a few very simple and practical dimensions to observe.
First, the key point is to confirm that the market has stopped creating new lows. In this process, the most ideal chart condition is to see the market attempt a downside probe—a lower low—but fail.
Second, on the chart, there must be a highly indicative reversal large K-line. And the upward portion of this K-line must completely engulf the real body of the previous day’s or the day before yesterday’s bearish (down) K-line.
Finally, the third and equally crucial link: the second point just mentioned cannot be used as a standalone basis for judgment. After this reversal large K-line forms, within the next 4–6 trading hours, the price must remain strong and must not again encounter selling that causes a sharp drop. At the same time, the price needs to稳稳 (steadily) regain and stand above the short-term moving average. From the logic of technical patterns, the faster this pattern repair occurs and the more forceful the rebound is, the more often it indicates stronger underlying support for the market reversal.
First, the key point is to confirm that the market has stopped creating new lows. In this process, the most ideal chart condition is to see the market attempt a downside probe—a lower low—but fail.
Second, on the chart, there must be a highly indicative reversal large K-line. And the upward portion of this K-line must completely engulf the real body of the previous day’s or the day before yesterday’s bearish (down) K-line.
Finally, the third and equally crucial link: the second point just mentioned cannot be used as a standalone basis for judgment. After this reversal large K-line forms, within the next 4–6 trading hours, the price must remain strong and must not again encounter selling that causes a sharp drop. At the same time, the price needs to稳稳 (steadily) regain and stand above the short-term moving average. From the logic of technical patterns, the faster this pattern repair occurs and the more forceful the rebound is, the more often it indicates stronger underlying support for the market reversal.
After the market trading ended on Monday, the overall performance on the board is basically consistent with the situation we discussed in our YouTube recap video last Friday, and there has been no substantive change. There are mainly two areas that everyone should pay attention to.
First, the MU/SNDK sector is still undergoing the momentum test mentioned in the video. The combined effect of large investors’ selling and the automated trading by quantitative bots has brought the market to its current state, and this has also, in turn, completed the short-term technical indicator repair.
Second, regarding the coins/crcl positions we reduced and took profit on last Friday: the prior overbought pressure has now been fully released. This kind of healthy easing is very beneficial for medium-term development. The most critical task for everyone right now is simply to wait patiently for the next suitable entry point to appear.
First, the MU/SNDK sector is still undergoing the momentum test mentioned in the video. The combined effect of large investors’ selling and the automated trading by quantitative bots has brought the market to its current state, and this has also, in turn, completed the short-term technical indicator repair.
Second, regarding the coins/crcl positions we reduced and took profit on last Friday: the prior overbought pressure has now been fully released. This kind of healthy easing is very beneficial for medium-term development. The most critical task for everyone right now is simply to wait patiently for the next suitable entry point to appear.
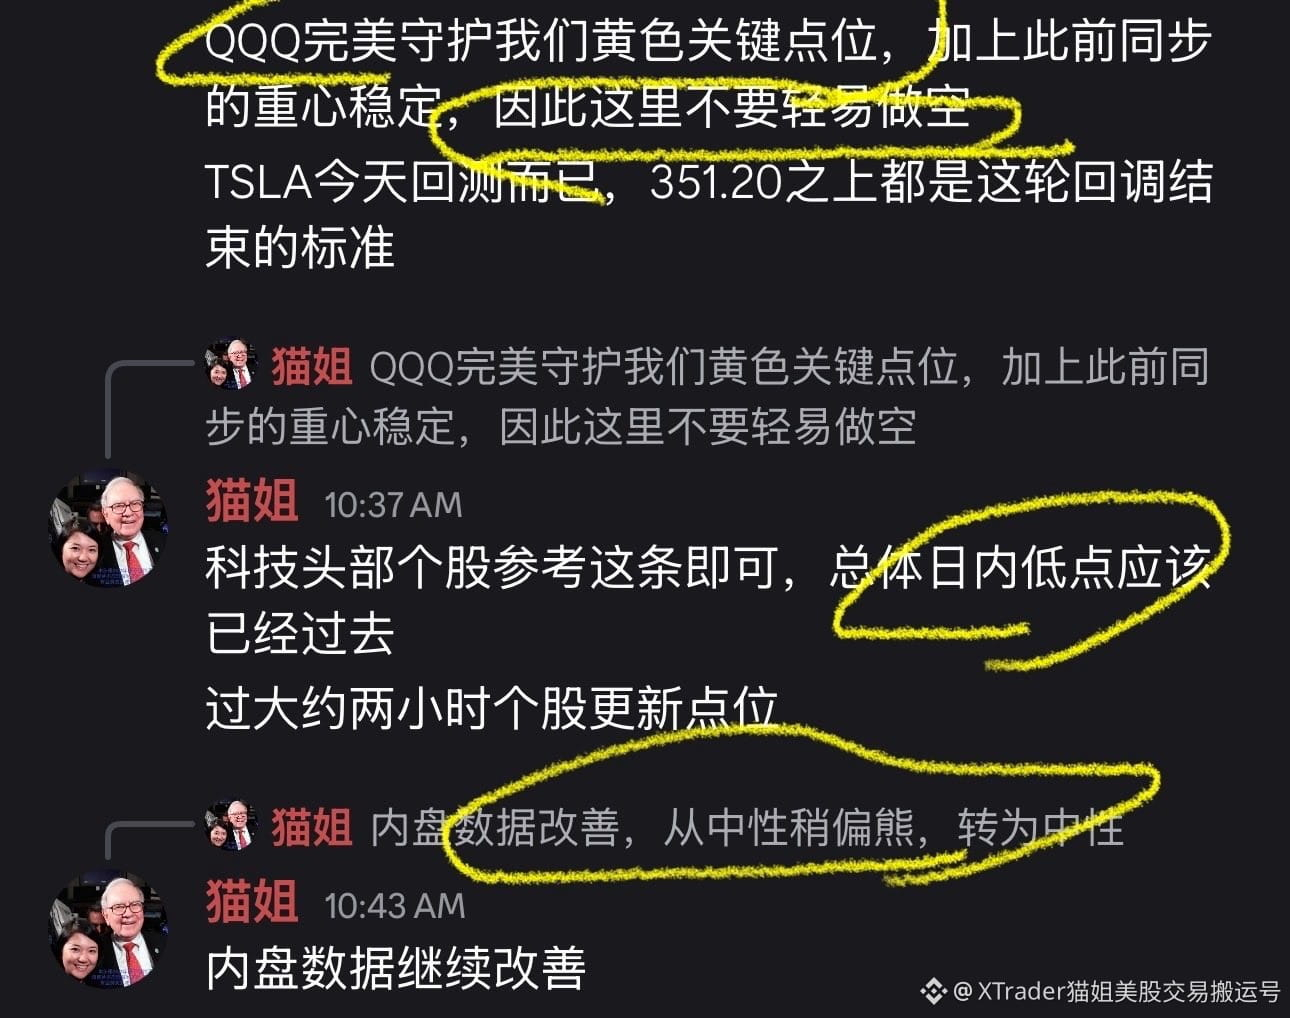
Hello everyone, friends. Here, we will walk you through a few core intraday trading points we provided within about the first hour after today’s morning market opened.
Looking back at the morning’s trend: just twenty minutes after the open, we promptly signaled that the market’s focus had stabilized. As the on-exchange data improved gradually afterward, this undoubtedly gave everyone peace of mind. Then, about one hour into the open, we precisely pointed out the intraday low for the entire day. During that period, the key yellow levels for the “stupid cat” were tested multiple times and held perfectly. In addition, we clearly indicated at the time that the major technology stocks had already completed their bottoming out within the day.
From the perspective of the system’s operating logic: the moment the trading system detects that the data center of gravity has stabilized, we can basically confirm the bottom formation. However, to be even more cautious, we deliberately waited for three rounds of retesting—only after confirming that the support was effective did we officially share the above intraday information with everyone. The time window when we issued the alert also happened to coincide with today’s intraday low-point range.
Looking back at the morning’s trend: just twenty minutes after the open, we promptly signaled that the market’s focus had stabilized. As the on-exchange data improved gradually afterward, this undoubtedly gave everyone peace of mind. Then, about one hour into the open, we precisely pointed out the intraday low for the entire day. During that period, the key yellow levels for the “stupid cat” were tested multiple times and held perfectly. In addition, we clearly indicated at the time that the major technology stocks had already completed their bottoming out within the day.
From the perspective of the system’s operating logic: the moment the trading system detects that the data center of gravity has stabilized, we can basically confirm the bottom formation. However, to be even more cautious, we deliberately waited for three rounds of retesting—only after confirming that the support was effective did we officially share the above intraday information with everyone. The time window when we issued the alert also happened to coincide with today’s intraday low-point range.
Due to the final cut length of this week’s YouTube U.S. stock recap video exceeding expectations, I had no choice but to trim the segment analyzing SPCX. However, this part has already been thoroughly analyzed, so I’m deliberately publishing it here to provide you with relevant reference. I’d also like to add one detail: in addition to the key points covered in the video, if the price action can stabilize and does not fall back into the downward channel shown in the chart, that is also a very encouraging positive signal.
The COIN that everyone has been watching has finally delivered a strong surge. Looking back at the past two weeks, this asset has arguably been the most underwhelming performer among all the items on our watchlists this year. Back then, even die-hard fans like “stupid cat” were somewhat frustrated with it. However, as we analyzed in our YouTube Weekly US Stock Public Recap videos from the previous two episodes, it had already precisely triggered a weekly-level buy signal at that time. In addition, in our analysis last Friday, we also clearly pointed out that CRCL showed a similar buy signal as well. As long as you remember these key cues and patiently hold until now, we believe you have successfully seized this bottom-start breakout opportunity. Next, let’s let the “bullets” fly a bit longer and wait for the market to evolve naturally. Our current position strategy remains unchanged. Our floor is very clear: we will continue to hold with peace of mind unless the price breaks below the critical level of 137—in which case we need to fully exit.
The market displayed a rather intriguing situation on Thursday. As the QQQ saw a significant pullback, the stocks in our Q3 list showed very strong resilience—most were either up or had only experienced minor pullbacks. The only one that fell noticeably that day was MDB, which recorded a decline of -4.64%. However, based on the time point when we initially published the Q3 list, the cumulative gain this stock had already reached 50%+.
Long-time friends who have been following along must be very familiar with these circumstances. Just looking at the past month alone, on the X platform we have already shared with you the updates of many different tickers, including NOW, MU, SNDK, LITE, CRCL, and more.
Long-time friends who have been following along must be very familiar with these circumstances. Just looking at the past month alone, on the X platform we have already shared with you the updates of many different tickers, including NOW, MU, SNDK, LITE, CRCL, and more.
Recently, the performance of BTC—Bitcoin—has been nothing short of soaring. We shared with you on Tuesday the buying signals at the weekly level, and immediately after that, the market saw two consecutive days of gains on Wednesday and Thursday. Its price has now successfully broken through the 70,000 mark.
Looking back at the starting point of this rally, we must mention our member, “Moon Brother.” It was he who at the time keenly sensed that BTC was about to move and issued an early warning. After that, “Beng Cat” conducted a careful analysis of the technical charts, confirming that this is indeed a major move at the weekly level—and that everything we’re seeing right now is only the prelude.
As for the overall direction in 2026, we already discussed it several times at the beginning of the year. Our core judgment is very clear: the room for further downside is extremely limited. The low point that was touched below 60k was the limit of the correction. Even though the current price has already made a significant breakout, it still has some distance to go before reaching our predefined target price.
Looking back at the starting point of this rally, we must mention our member, “Moon Brother.” It was he who at the time keenly sensed that BTC was about to move and issued an early warning. After that, “Beng Cat” conducted a careful analysis of the technical charts, confirming that this is indeed a major move at the weekly level—and that everything we’re seeing right now is only the prelude.
As for the overall direction in 2026, we already discussed it several times at the beginning of the year. Our core judgment is very clear: the room for further downside is extremely limited. The low point that was touched below 60k was the limit of the correction. Even though the current price has already made a significant breakout, it still has some distance to go before reaching our predefined target price.
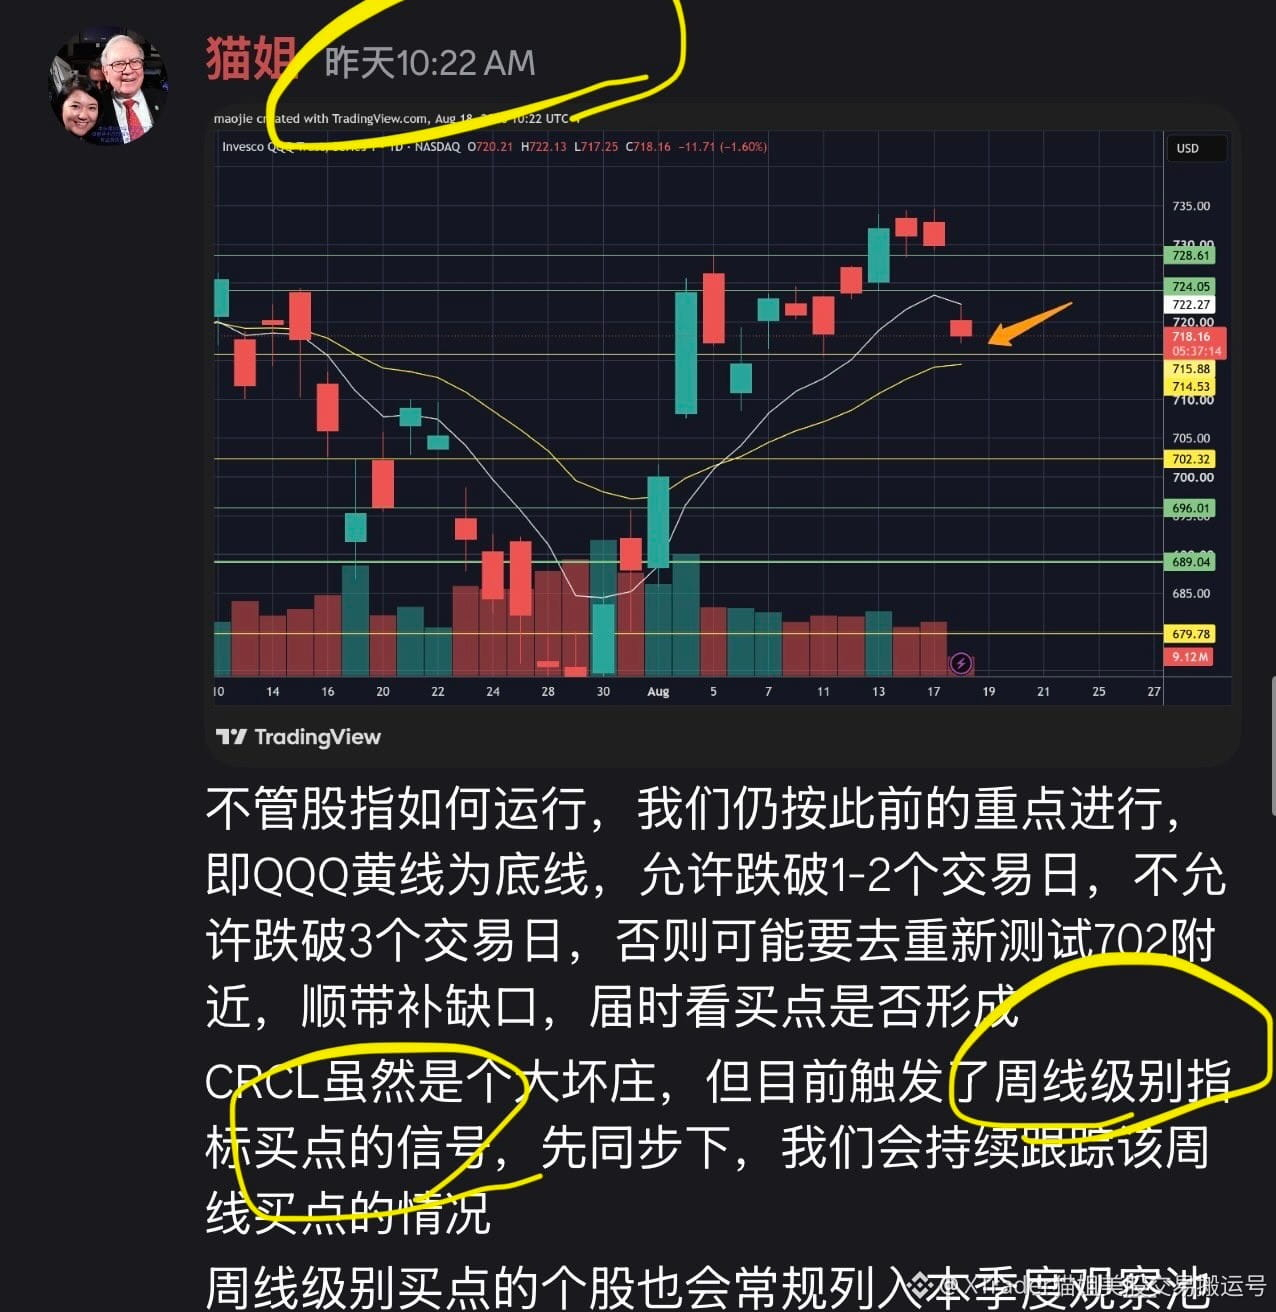
Yesterday as well, that is, on Wednesday, CRCL successfully triggered a weekly-level buy signal. Just half an hour after the market opened, we quickly issued the relevant alert. By today, the following day, the asset’s rise is now close to 10%, and it has finally delivered a satisfactory result.
In addition, all of this week’s planned swing trades have been completed as scheduled. We reduced our position on Monday, and we added back on Wednesday. In the face of the market, we should always maintain a sense of respect and awe, basing every decision on objective data. If there is one factor that is most unreliable in trading, it is undoubtedly human subjective emotions.
In addition, all of this week’s planned swing trades have been completed as scheduled. We reduced our position on Monday, and we added back on Wednesday. In the face of the market, we should always maintain a sense of respect and awe, basing every decision on objective data. If there is one factor that is most unreliable in trading, it is undoubtedly human subjective emotions.
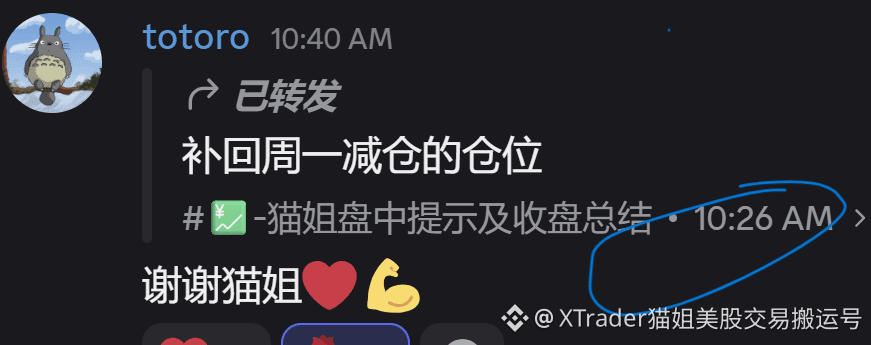
About an hour after the market opened on Wednesday, I had already re-established the positions I had sold off on Monday. For the specific actions taken on Monday, everyone can review the updates I posted earlier on the X platform. With this additional buy order successfully completed, this recent round of swing trading is now officially wrapped up. Overall, I’m fairly satisfied with the spread-to-profit ratio from this swing trade.
What’s interesting is that shortly after I bought back the positions, the broader market then saw a rise and rebound.
Taking advantage of this opportunity, I’d also like to lay out the three key reasons that led me to decide to enter long. First, according to the monitoring data from the Bbm Cat system, its centrality indicator has remained stable throughout, with absolutely no signs of weakening or decline. Second, yesterday I highlighted several key levels to everyone, and the fact has proven that the defensive support at these levels is very solid. Finally, related assets led by BTC have shown relatively strong short-term technical indicators this week.
What’s interesting is that shortly after I bought back the positions, the broader market then saw a rise and rebound.
Taking advantage of this opportunity, I’d also like to lay out the three key reasons that led me to decide to enter long. First, according to the monitoring data from the Bbm Cat system, its centrality indicator has remained stable throughout, with absolutely no signs of weakening or decline. Second, yesterday I highlighted several key levels to everyone, and the fact has proven that the defensive support at these levels is very solid. Finally, related assets led by BTC have shown relatively strong short-term technical indicators this week.
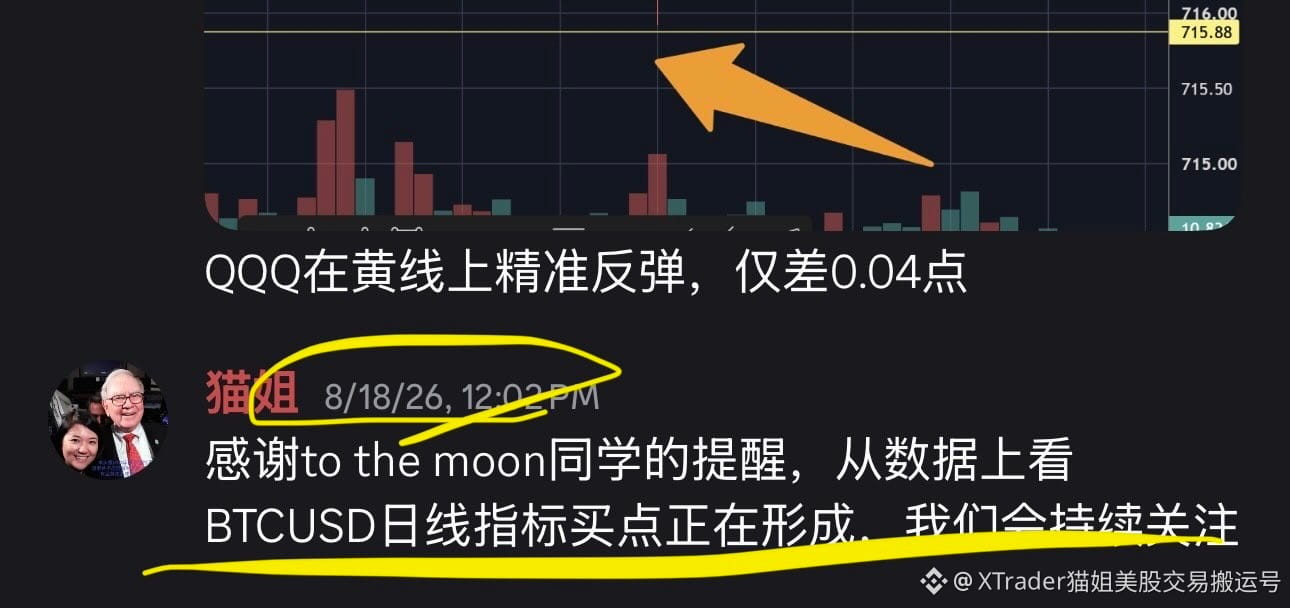
Recently, on the weekly timeframe, Bitcoin’s buying opportunity is gradually taking shape. This is undoubtedly a crucial indicator for investors who are bullish on the market. Here, we would like to offer our sincere thanks to our member friends for the timely and warm reminders from To the moon.
By the way, let’s look back: as early as last week, we already noticed some unusual movements in BTC’s price action and advised everyone in advance to closely monitor its market developments during the first three days of this week. Looking at the recent trading screen, COIN and CRCL have both performed quite well. Over the medium-term horizon, no matter how the market fluctuates and rises or falls, Benmao’s views and approach remain consistent. In reality, everyone doesn’t need to waste precious time, energy, and emotions during market turbulence—just stay calm and follow the established plan to execute accordingly.
By the way, let’s look back: as early as last week, we already noticed some unusual movements in BTC’s price action and advised everyone in advance to closely monitor its market developments during the first three days of this week. Looking at the recent trading screen, COIN and CRCL have both performed quite well. Over the medium-term horizon, no matter how the market fluctuates and rises or falls, Benmao’s views and approach remain consistent. In reality, everyone doesn’t need to waste precious time, energy, and emotions during market turbulence—just stay calm and follow the established plan to execute accordingly.

At the beginning of our journey of inner exploration, we often go through setbacks before arriving at an insight: the core task of life is to properly maintain the bond between the self and the external environment—so that we can achieve both forgiveness and peace with the surrounding world as well as with our inner soul.
As we keep delving deeper along this path of growth, there may come a moment when everything suddenly becomes clear. We realize that the so-called individual and the outside world have never, from the very beginning, had any real barriers or lines of division between them.
Friends who are also walking this road—right now, what kind of mindset are you experiencing in the process of moving forward?
As we keep delving deeper along this path of growth, there may come a moment when everything suddenly becomes clear. We realize that the so-called individual and the outside world have never, from the very beginning, had any real barriers or lines of division between them.
Friends who are also walking this road—right now, what kind of mindset are you experiencing in the process of moving forward?
I just noticed a piece of the latest interview with TOM LEE, in which he pointed out that the U.S. stock market is expected to continue its upward momentum in August, pushing toward the 8,000-point threshold.
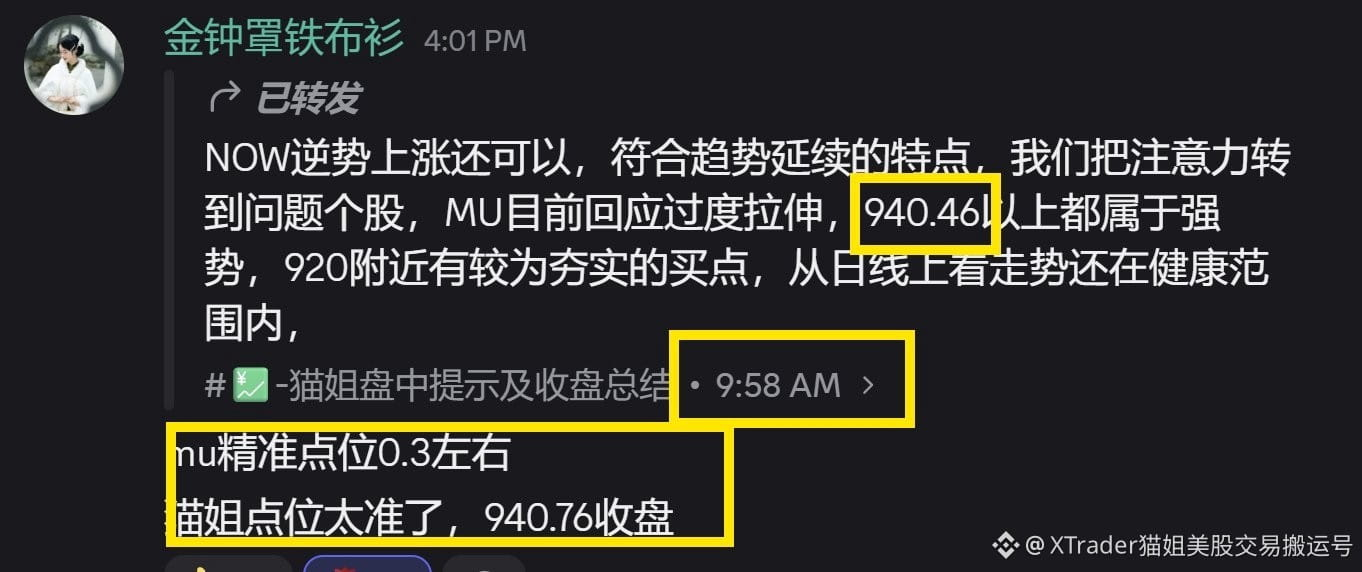
Next, let’s take a look at how individual stocks are performing in the market. MU’s closing performance is truly something to reflect on. The stock ended up extremely precisely at the price level predicted by the “stupid cat” about half an hour after the open—down to the last detail, with no deviation at all. Objectively speaking, MU is still in a relatively strong range on the daily chart, especially since it can steadily hold above the 8-day moving average. Let’s discuss together: tomorrow, will its price actually fall and break below the 8-day line?
Next, let’s take a look at how individual stocks are performing in the market. MU’s closing performance is truly something to reflect on. The stock ended up extremely precisely at the price level predicted by the “stupid cat” about half an hour after the open—down to the last detail, with no deviation at all. Objectively speaking, MU is still in a relatively strong range on the daily chart, especially since it can steadily hold above the 8-day moving average. Let’s discuss together: tomorrow, will its price actually fall and break below the 8-day line?
In recent times, the sharp fluctuations in the bond market have put significant and sustained pressure on the U.S. stock market. You may have noticed a phenomenon: while short-term 2-year yields are currently relatively stable, U.S. long-end yields for 10 years and 30 years have surged rapidly. In financial terms, when long-end yields rise sharply while short-end rates remain stable, this pattern is professionally known as a typical Bear Steepening.
This macro development has profound effects on the U.S. stock market in multiple ways. First, competition for capital has intensified. Sovereign states and large technology companies now have to vie for funds together in the long-end bond market. The combined pressure of heavy supply in both Treasury bonds and corporate bonds creates a noticeable crowding-out effect. This directly pushes up the long-term risk-free rate, which in turn increases financing costs for the real economy across society.
Second, this changing environment has placed a persistent restraint on traditional U.S. software stocks, causing them to swing in a seesaw dynamic against the currently highly sought-after AI hot sectors. This aligns perfectly with the price action we observed recently and during today’s trading session. At the same time, for AI hardware stocks such as MU, SNDK, and LITE, the current market environment has greatly raised the barriers for all sides’ strategic contest. Investors have become more discerning than ever—today’s bar not only requires these companies to deliver excellent financial statements, but also to continually produce performance that exceeds expectations.
Taken together, under the combined impact of the factors above, the volatility “center of gravity” of the entire U.S. stock market is being forced to move higher. In the face of this uncertainty, capital from all directions can now only try to find a sense of investment security by positioning itself in two starkly different extremes: the most core AI hardware assets and absolute hard currency.
#U.S. Treasuries #U.S. Stocks #AI #SPY #QQQ
This macro development has profound effects on the U.S. stock market in multiple ways. First, competition for capital has intensified. Sovereign states and large technology companies now have to vie for funds together in the long-end bond market. The combined pressure of heavy supply in both Treasury bonds and corporate bonds creates a noticeable crowding-out effect. This directly pushes up the long-term risk-free rate, which in turn increases financing costs for the real economy across society.
Second, this changing environment has placed a persistent restraint on traditional U.S. software stocks, causing them to swing in a seesaw dynamic against the currently highly sought-after AI hot sectors. This aligns perfectly with the price action we observed recently and during today’s trading session. At the same time, for AI hardware stocks such as MU, SNDK, and LITE, the current market environment has greatly raised the barriers for all sides’ strategic contest. Investors have become more discerning than ever—today’s bar not only requires these companies to deliver excellent financial statements, but also to continually produce performance that exceeds expectations.
Taken together, under the combined impact of the factors above, the volatility “center of gravity” of the entire U.S. stock market is being forced to move higher. In the face of this uncertainty, capital from all directions can now only try to find a sense of investment security by positioning itself in two starkly different extremes: the most core AI hardware assets and absolute hard currency.
#U.S. Treasuries #U.S. Stocks #AI #SPY #QQQ
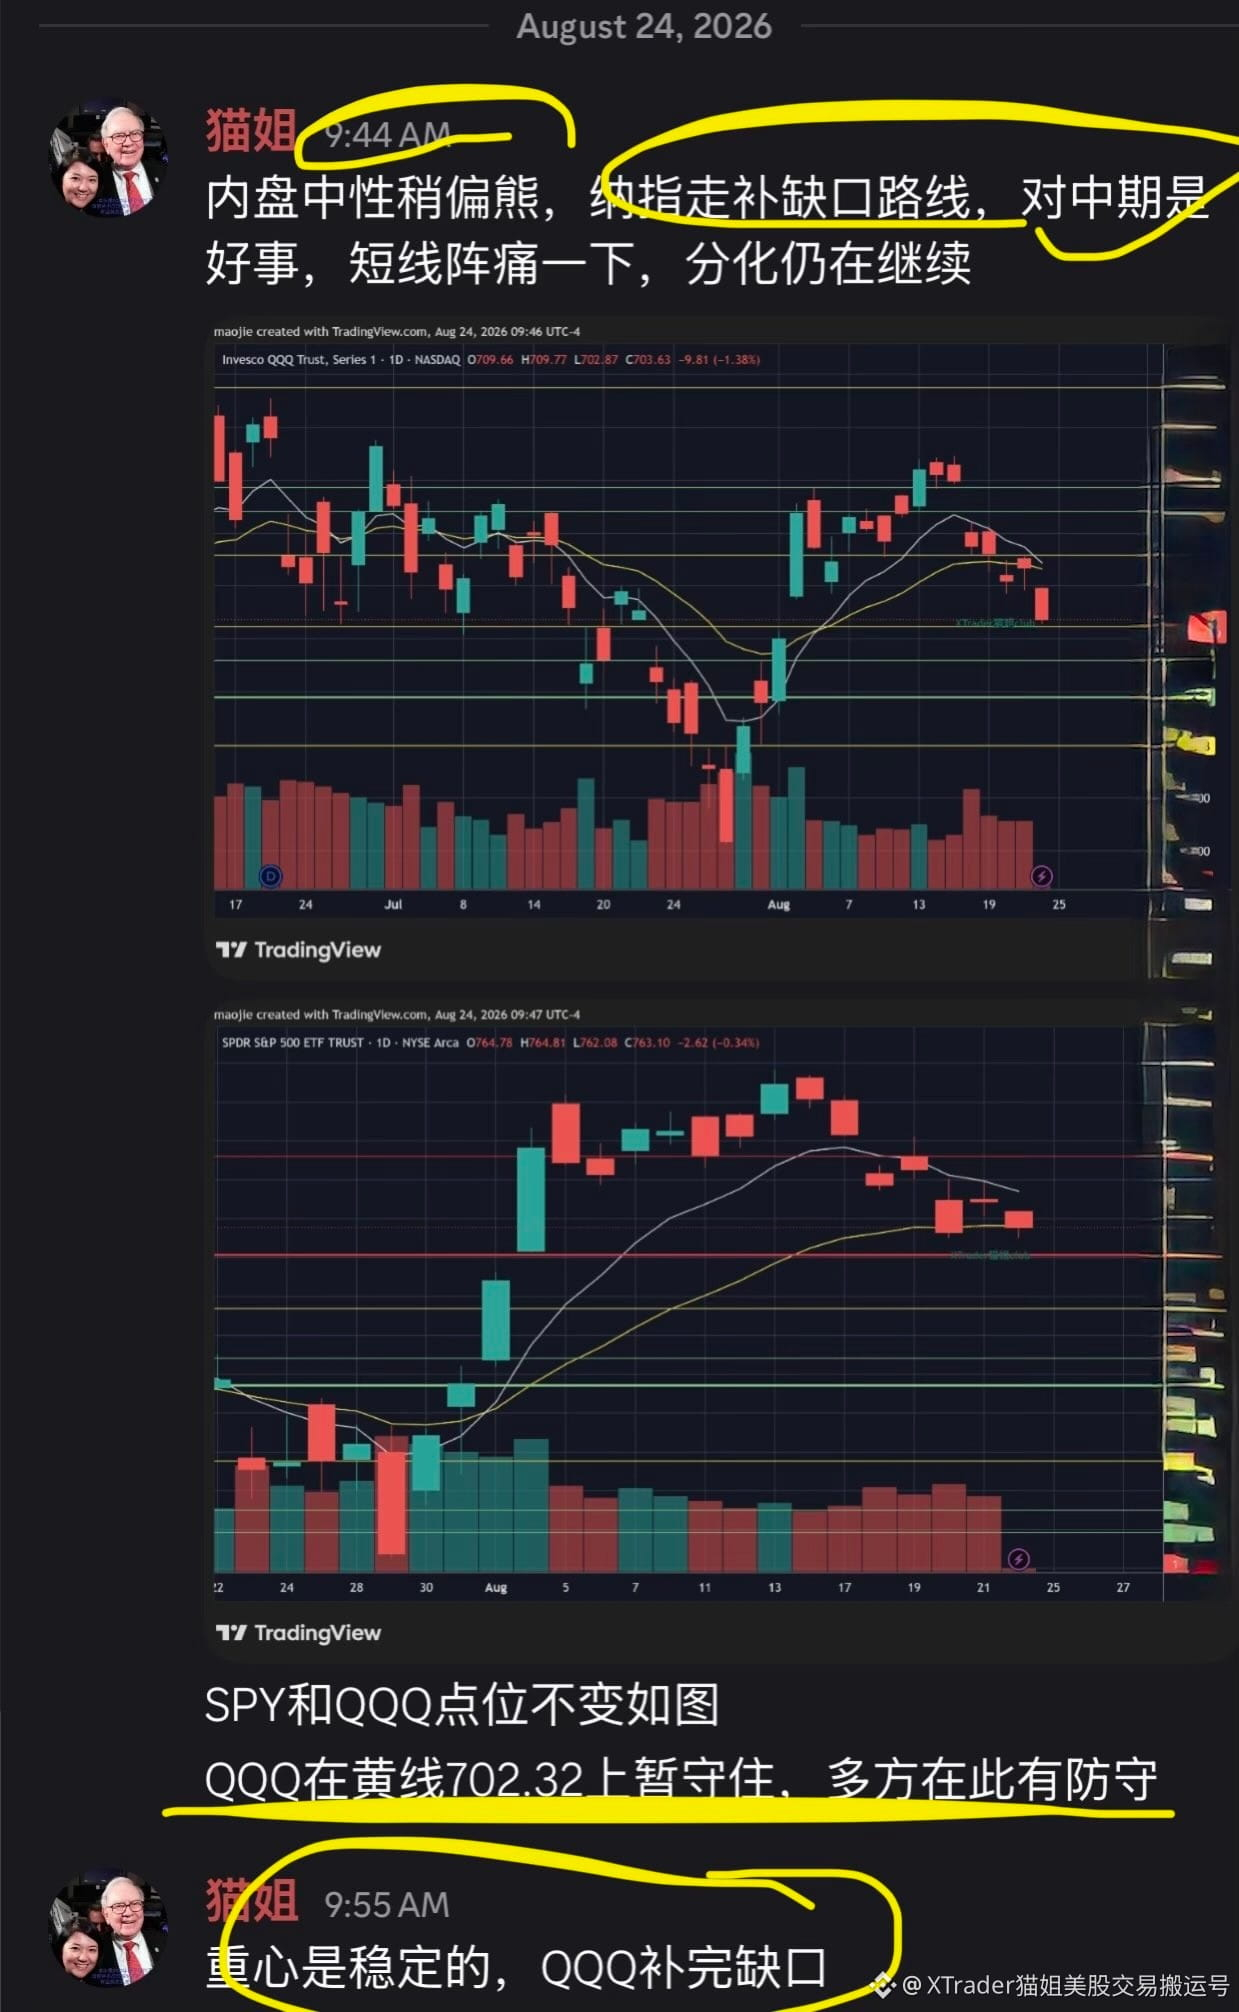
Long before a few months ago, the club had already clearly pointed out this key location internally, and the clumsy cat also提前 shared the relevant information with everyone in a recent YouTube public recap video.
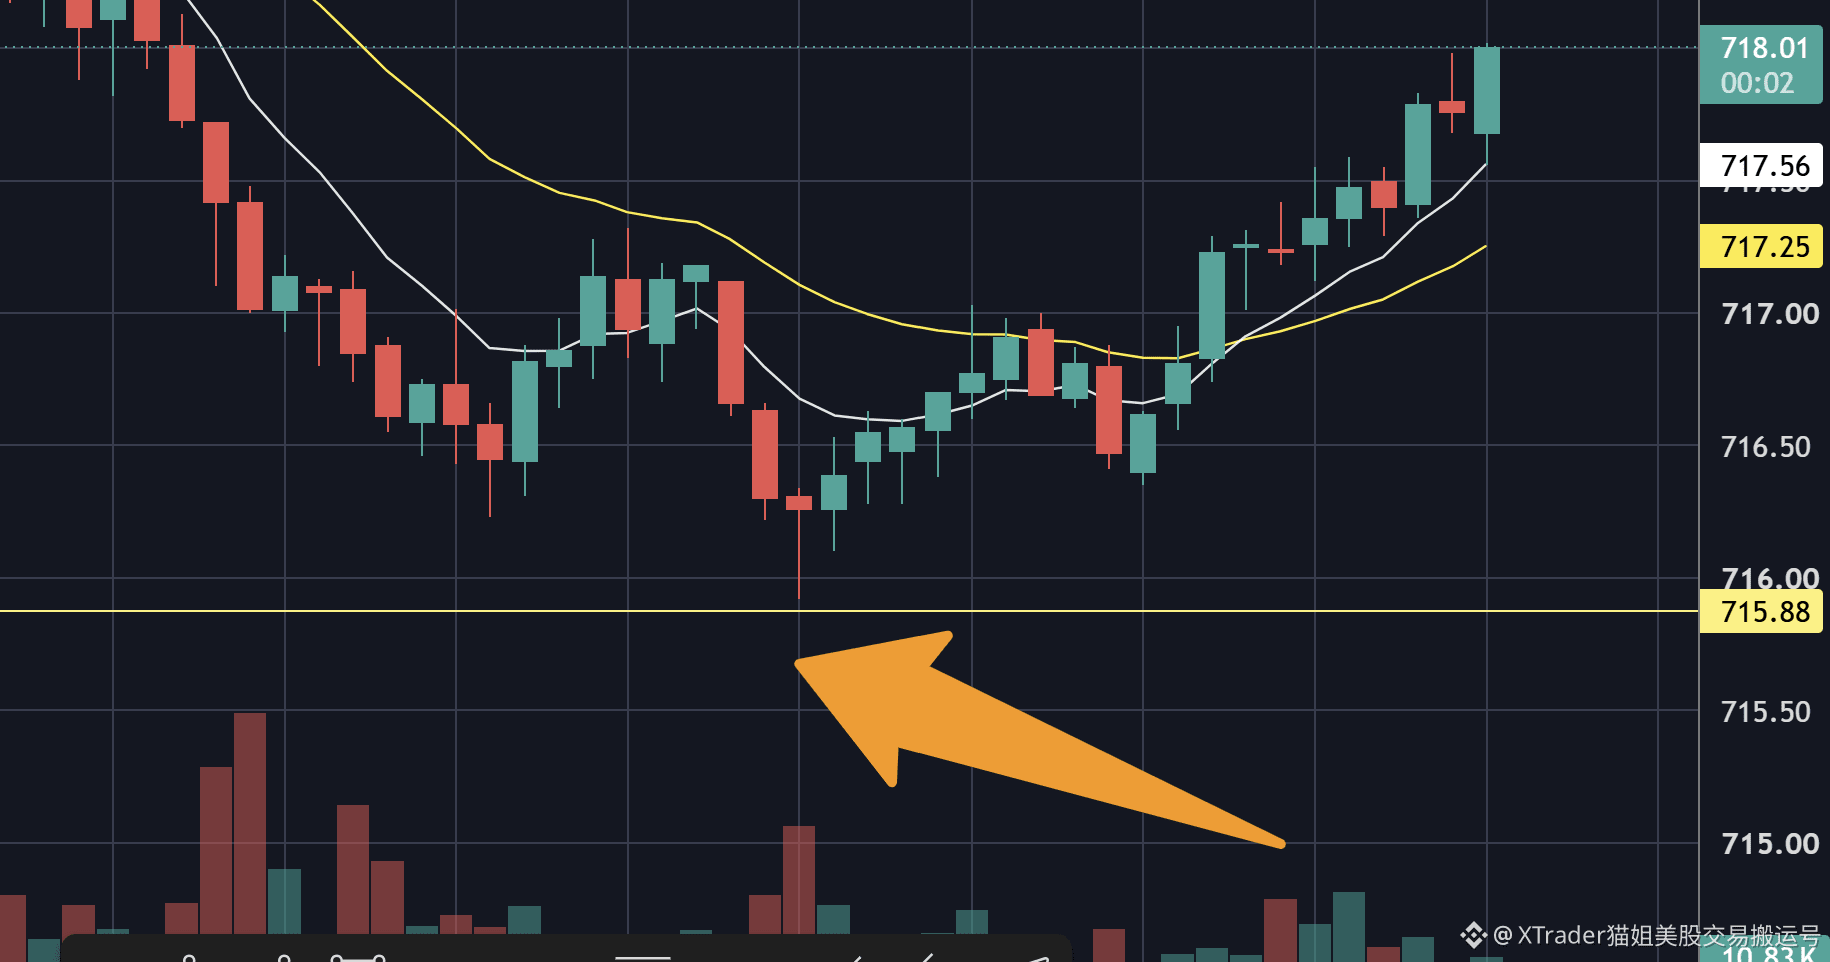
Looking back at the latest market developments, QQQ happened to deliver a precise bounce at the yellow line previously marked out by the clumsy cat. The difference between its actual intraday low and that reference line is only a negligible 0.04 points. When analyzing the overall market direction at present, it’s not hard to see that this yellow line has clearly become the core defensive line for the bulls, and it is also the only support above the current gap. Going forward, closely monitor market conditions—if this level is effectively broken to the downside, it could very likely cause the sell-off trend to expand further.
Looking back at the latest market developments, QQQ happened to deliver a precise bounce at the yellow line previously marked out by the clumsy cat. The difference between its actual intraday low and that reference line is only a negligible 0.04 points. When analyzing the overall market direction at present, it’s not hard to see that this yellow line has clearly become the core defensive line for the bulls, and it is also the only support above the current gap. Going forward, closely monitor market conditions—if this level is effectively broken to the downside, it could very likely cause the sell-off trend to expand further.
Log in to explore more content