

web3导演
639 Posts

web3导演
Report
Block User
链上刺客,擅长投研,主玩现货,高胜率低倍合约,推特:yewang2025,公众号:芯链世界,币安手续费8折邀请码:BTCSVIP
67 Following
3.4K+ Followers
2.6K+ Liked
Posts
All
Quotes
Live
PINNED
·
--
$BTC On a side note, another market is slowly gaining traction, which is NFT 2.0. Everyone should take a look; it's a new way of asset issuance. Currently, the leading token, upeg, has broken through 1500. When I mentioned it before, it was just over 100. I estimate that as it develops, we could see prices ranging from 10,000 to 30,000 each. There’s a total supply of 10,000 tokens, and it also benefits UNI, as it showcases a feature of Uniswap V4. $UNI
{spot}(UNIUSDT)
$BTC On a side note, another market is slowly gaining traction, which is NFT 2.0. Everyone should take a look; it's a new way of asset issuance. Currently, the leading token, upeg, has broken through 1500. When I mentioned it before, it was just over 100. I estimate that as it develops, we could see prices ranging from 10,000 to 30,000 each. There’s a total supply of 10,000 tokens, and it also benefits UNI, as it showcases a feature of Uniswap V4. $UNI
12
3
1.5k
·
--
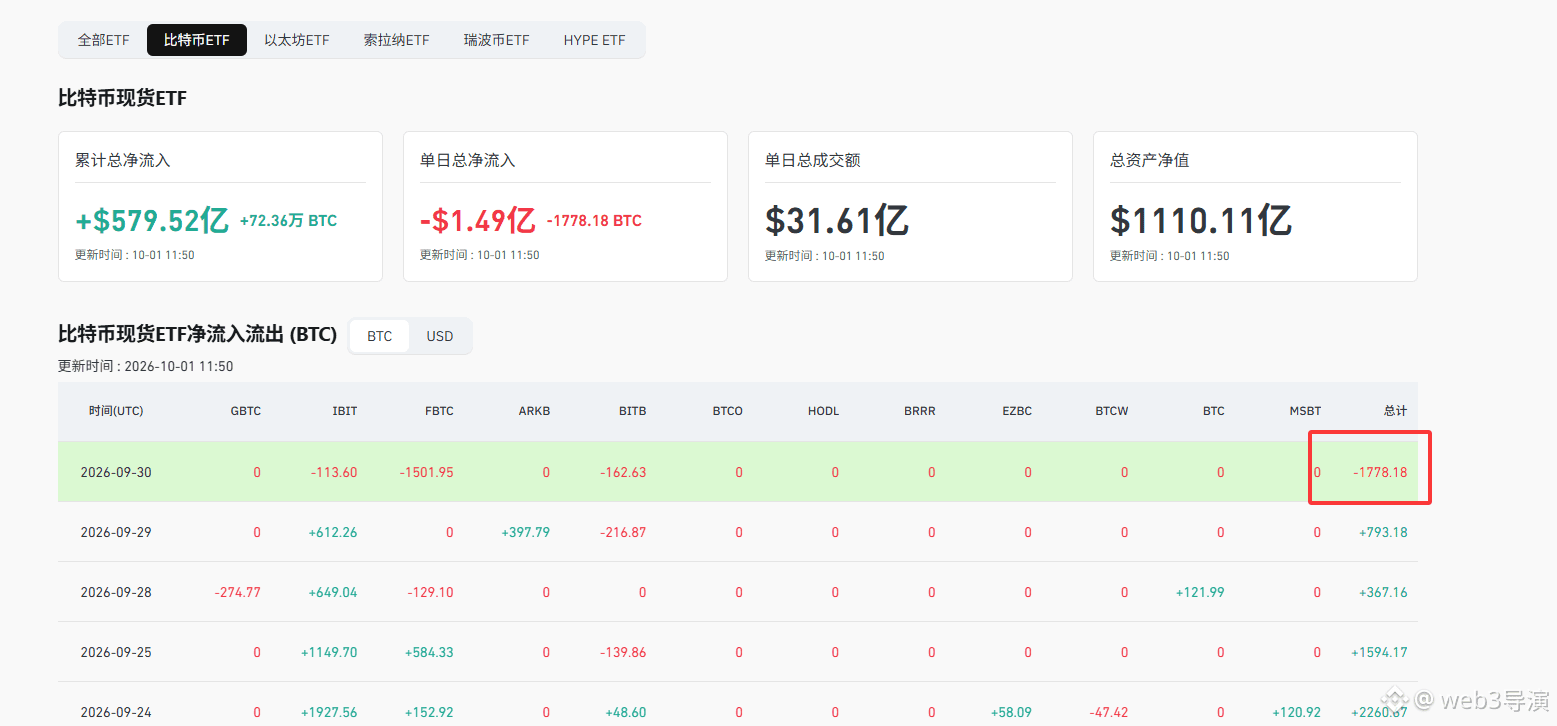
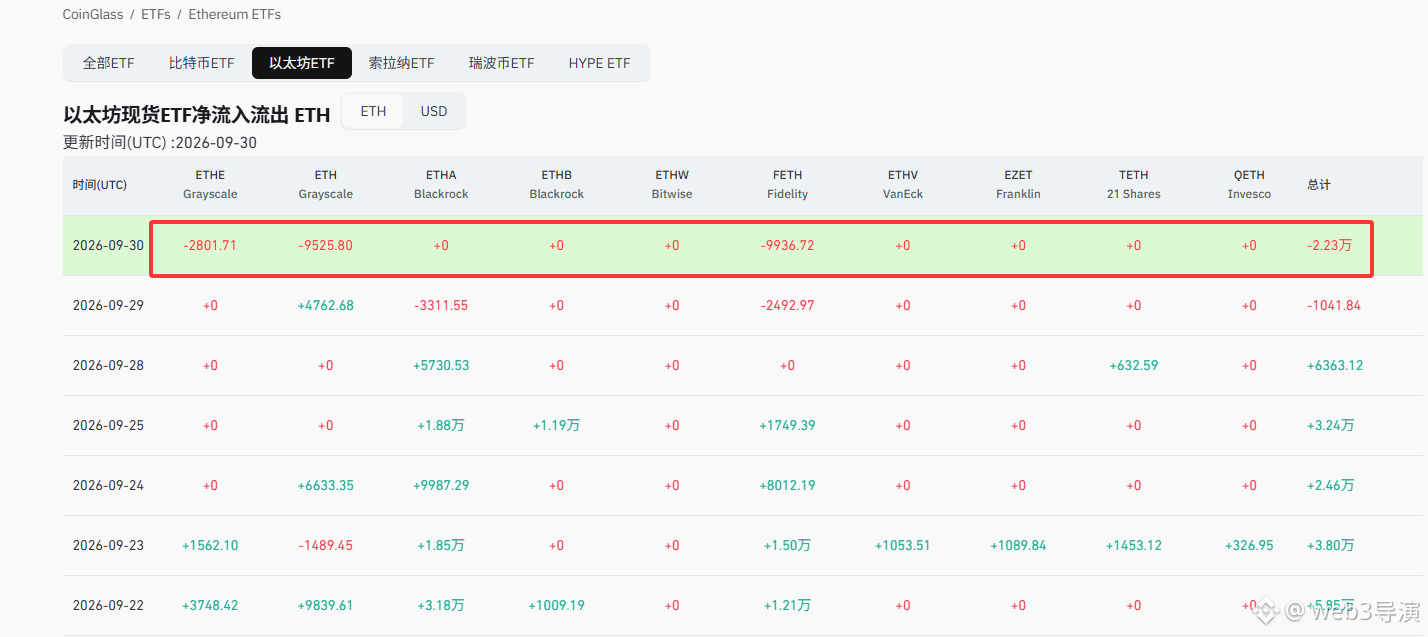
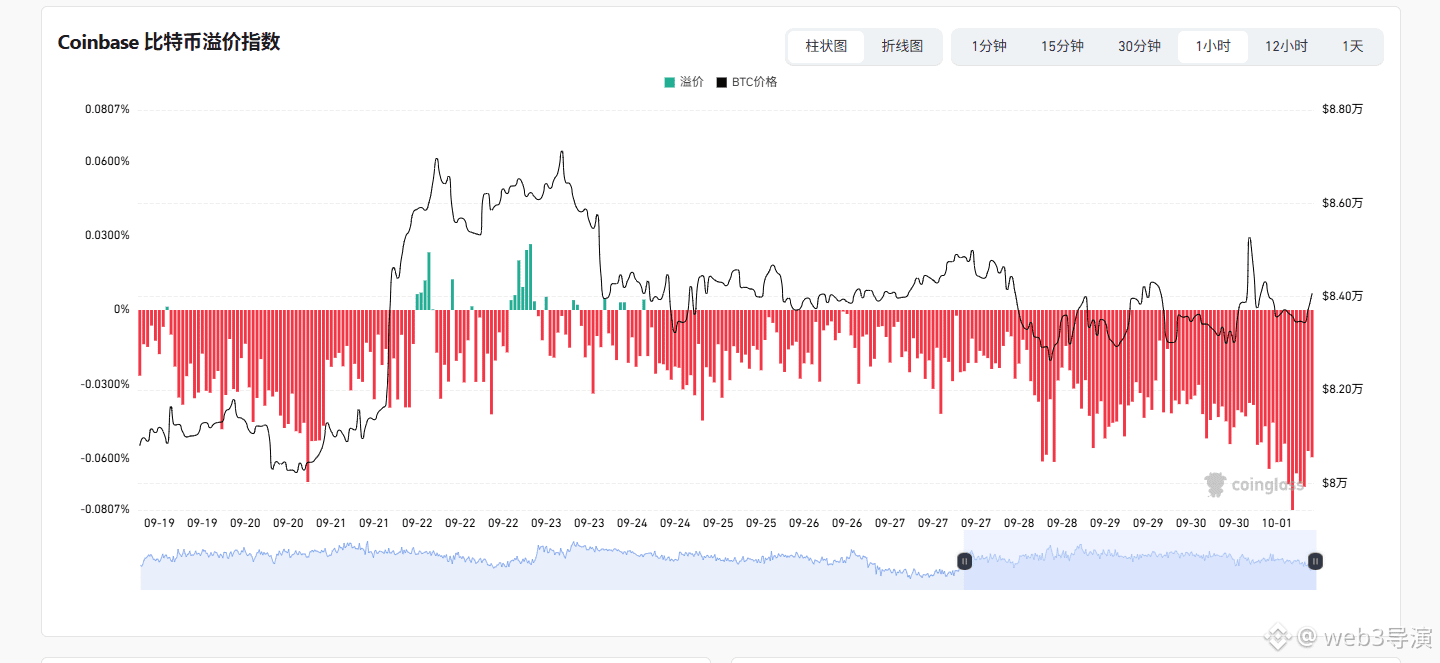
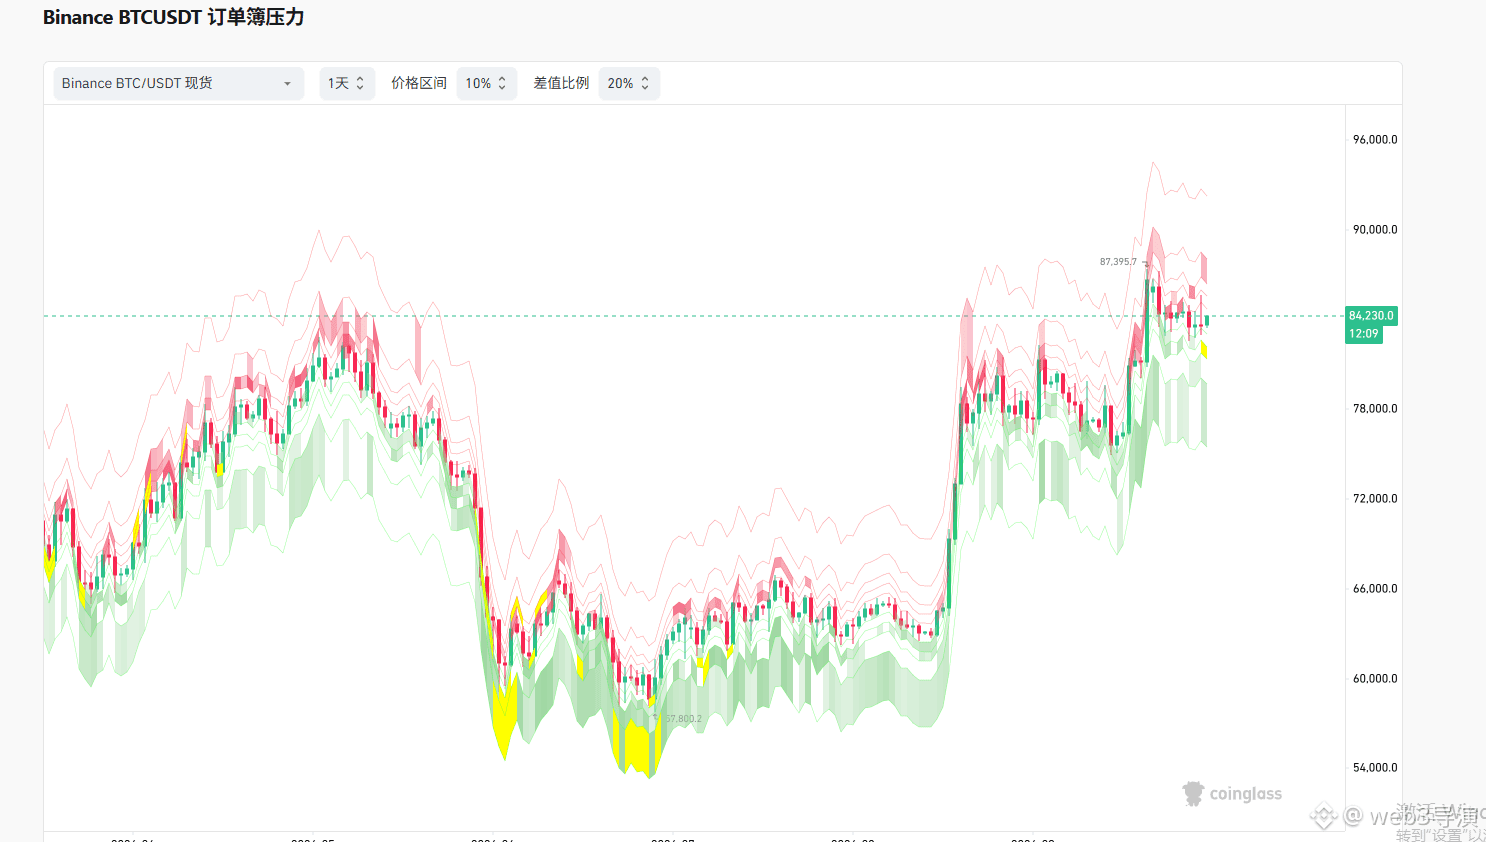
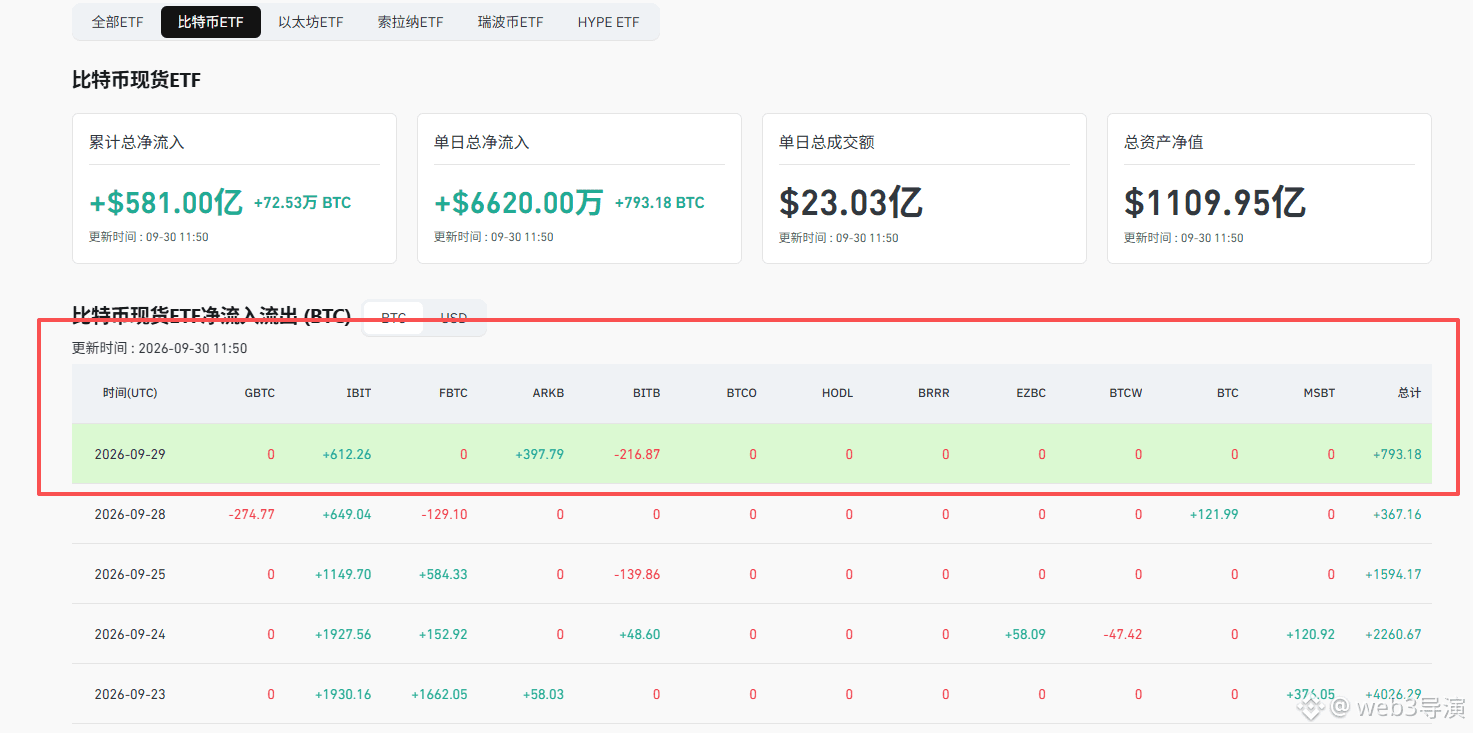
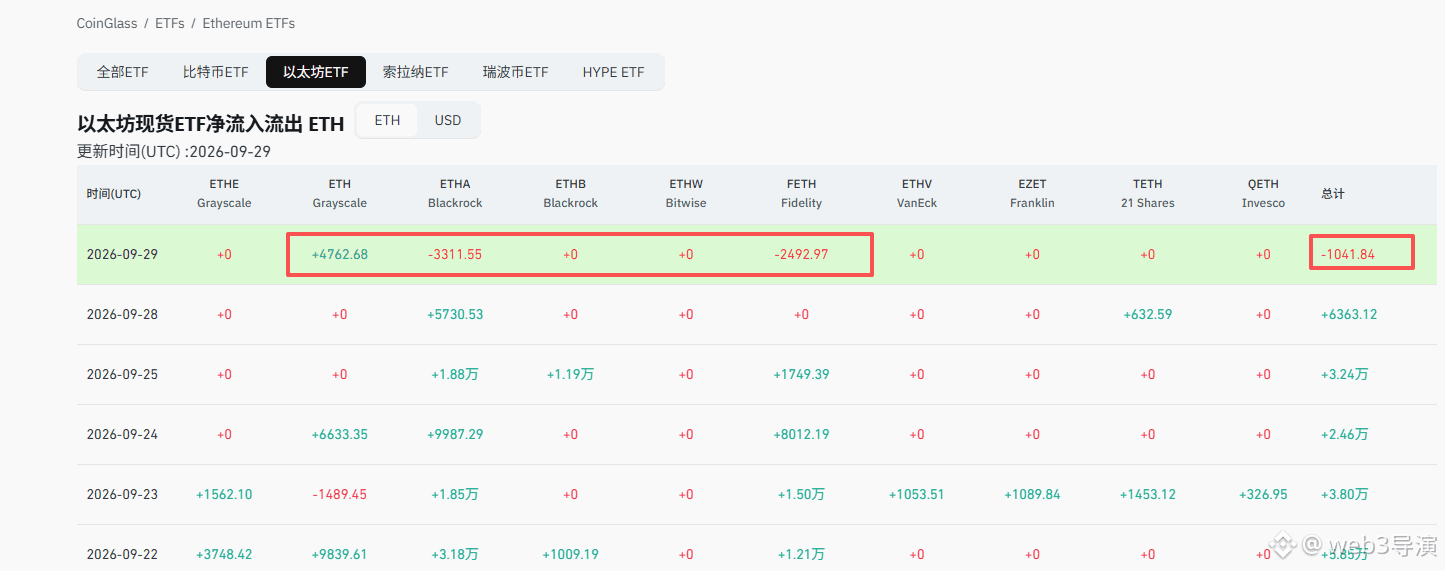
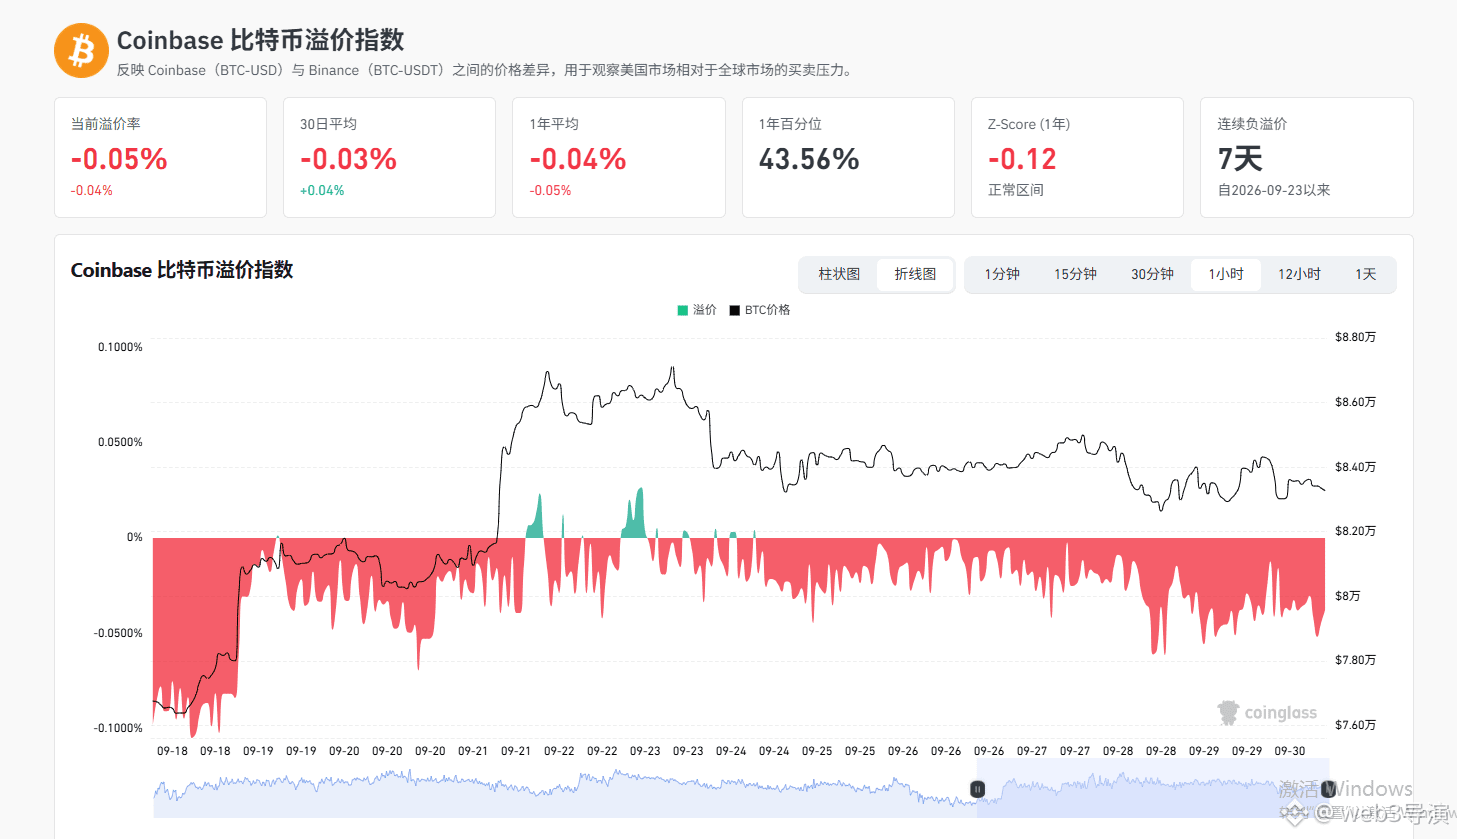
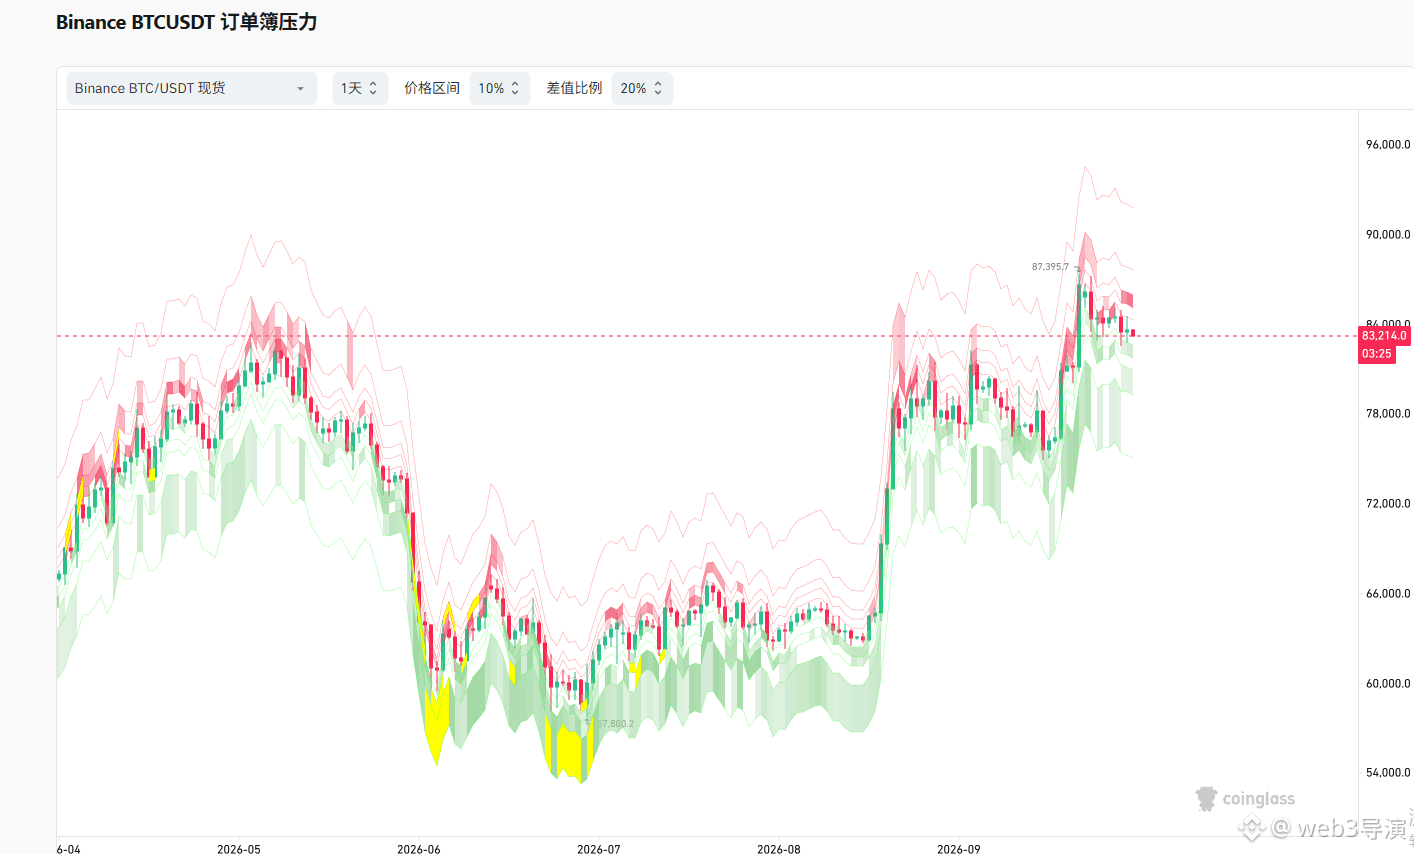
$BTC $ETH Figure 1: Last night the Bitcoin ETF saw net outflows of more than 1,700 coins. Figure 2: Last night the Ethereum ETF saw outflows of more than 20,000 coins. Overall, there were small net outflows. Figure 3: U.S. institutions continued to sell off. Figure 4: The order book data has not changed much, suggesting it may continue to trade sideways and fluctuate.
$BTC $ETH Figure 1: Last night the Bitcoin ETF saw net outflows of more than 1,700 coins. Figure 2: Last night the Ethereum ETF saw outflows of more than 20,000 coins. Overall, there were small net outflows. Figure 3: U.S. institutions continued to sell off. Figure 4: The order book data has not changed much, suggesting it may continue to trade sideways and fluctuate.
320
·
--
$BTC $ETH Figure 1: Last night, the Bitcoin ETF saw a small net inflow, only buying more than 700. Figure 2: Last night, the Ethereum ETF had a net outflow of more than 1,000, but Grayscale actually bought. Figure 3: U.S. institutions are still gradually selling off in small amounts. Figure 4: The order book hasn’t changed much; it’s likely to continue trading sideways with consolidation.
$BTC $ETH Figure 1: Last night, the Bitcoin ETF saw a small net inflow, only buying more than 700. Figure 2: Last night, the Ethereum ETF had a net outflow of more than 1,000, but Grayscale actually bought. Figure 3: U.S. institutions are still gradually selling off in small amounts. Figure 4: The order book hasn’t changed much; it’s likely to continue trading sideways with consolidation.
1.4k
·
--
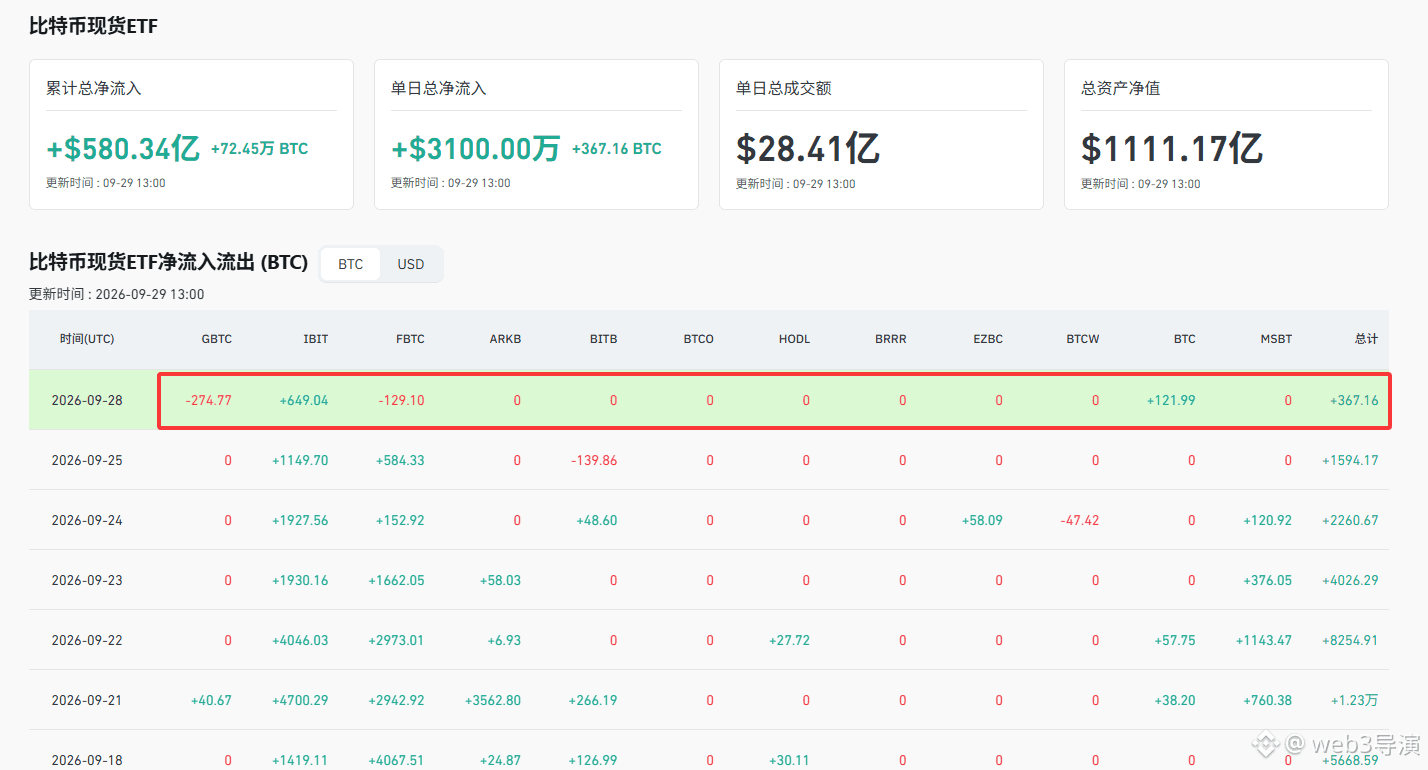
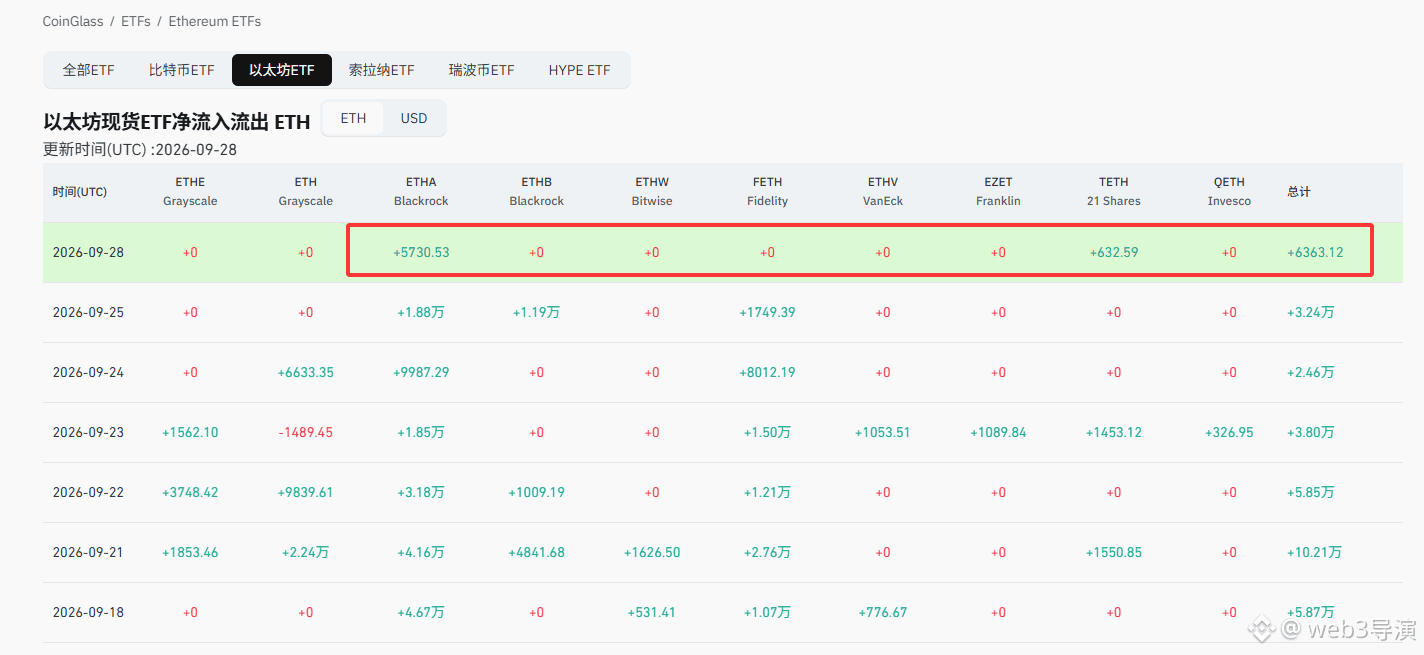
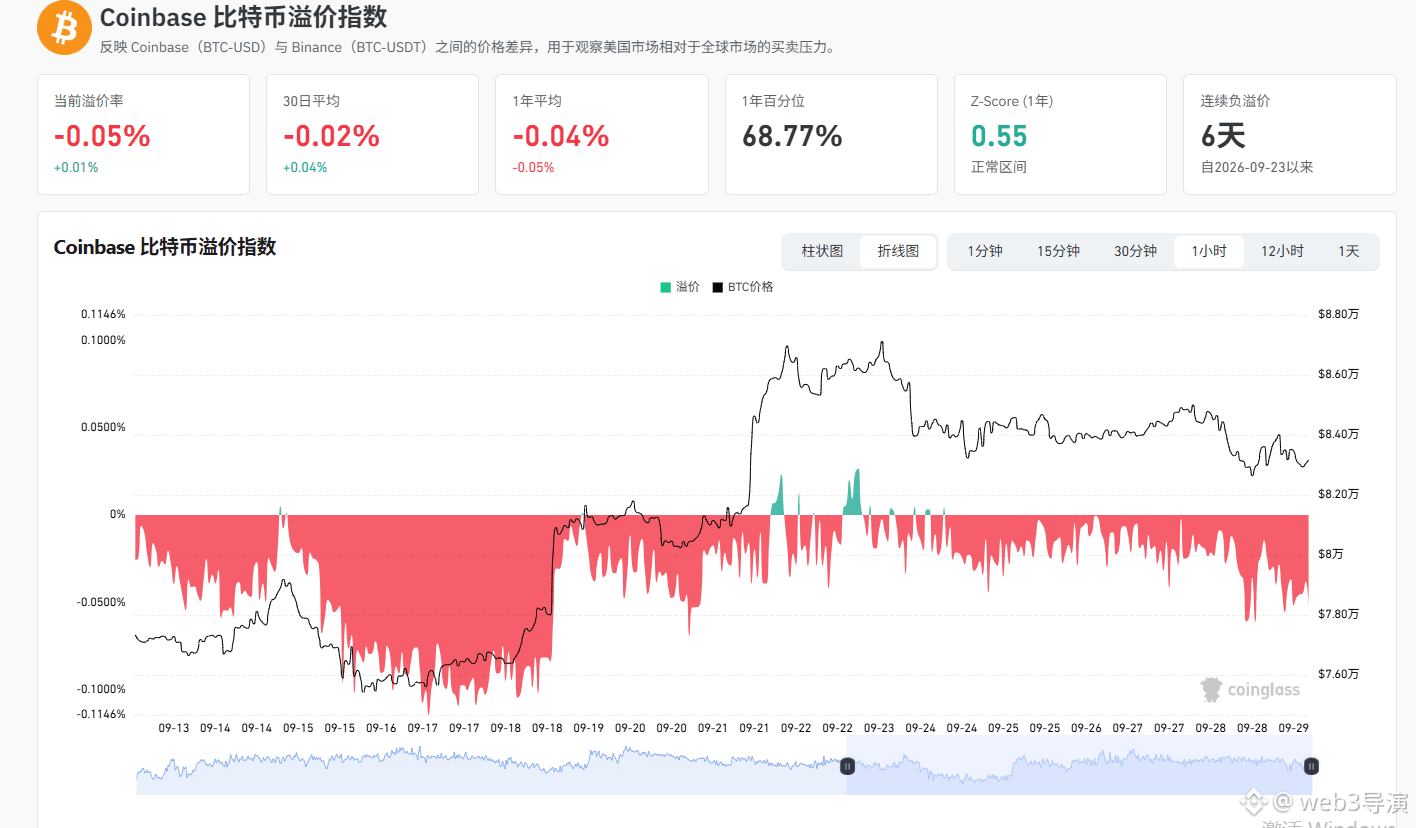
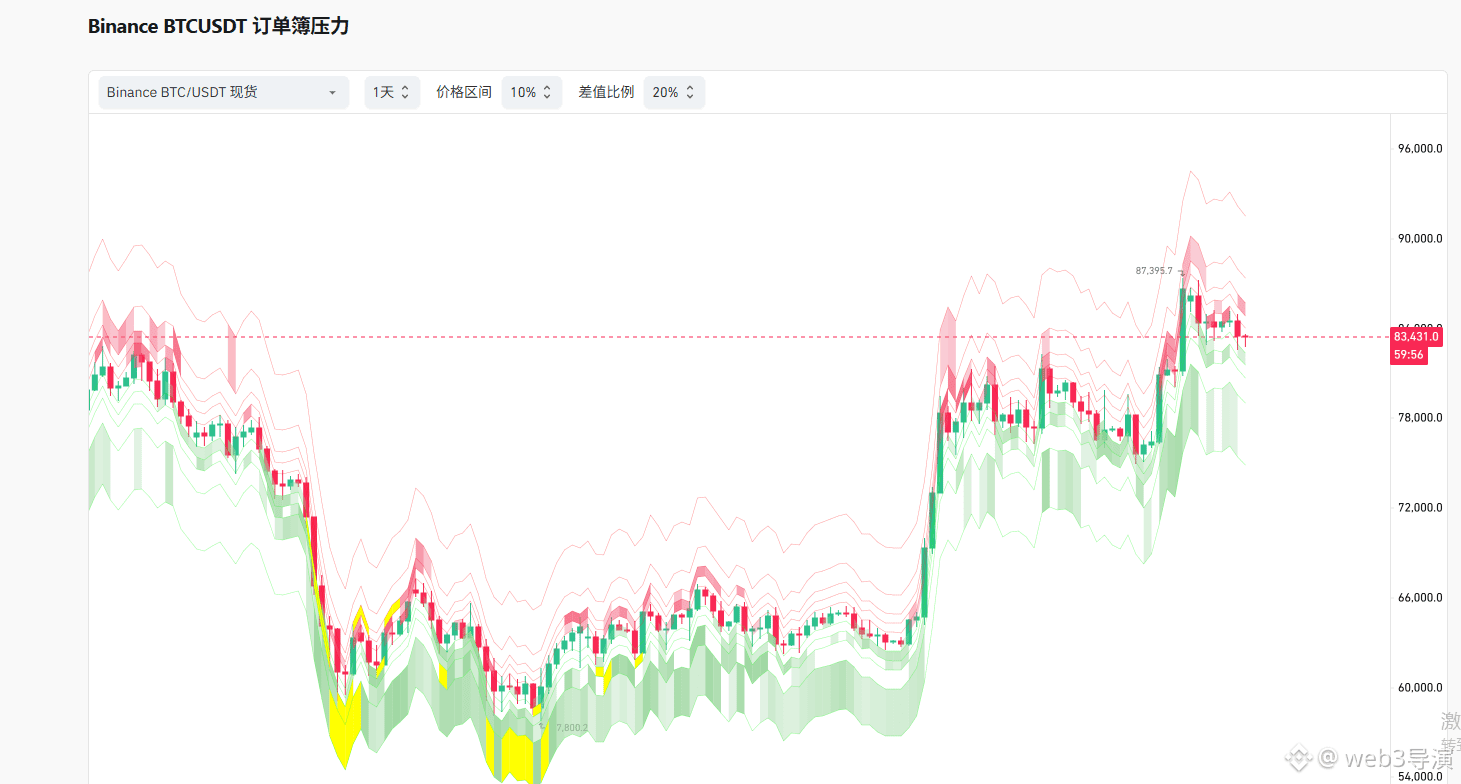
$BTC $ETH Figure 1: Last night, Bitcoin ETF net bought more than 300 shares, which was relatively little. Figure 2: Last night, Ethereum ETF net bought more than 6,000 shares. Figure 3: U.S. institutions are still selling off in small amounts. Figure 4: The order book data hasn’t changed much.
$BTC $ETH Figure 1: Last night, Bitcoin ETF net bought more than 300 shares, which was relatively little. Figure 2: Last night, Ethereum ETF net bought more than 6,000 shares. Figure 3: U.S. institutions are still selling off in small amounts. Figure 4: The order book data hasn’t changed much.
1.5k
·
--
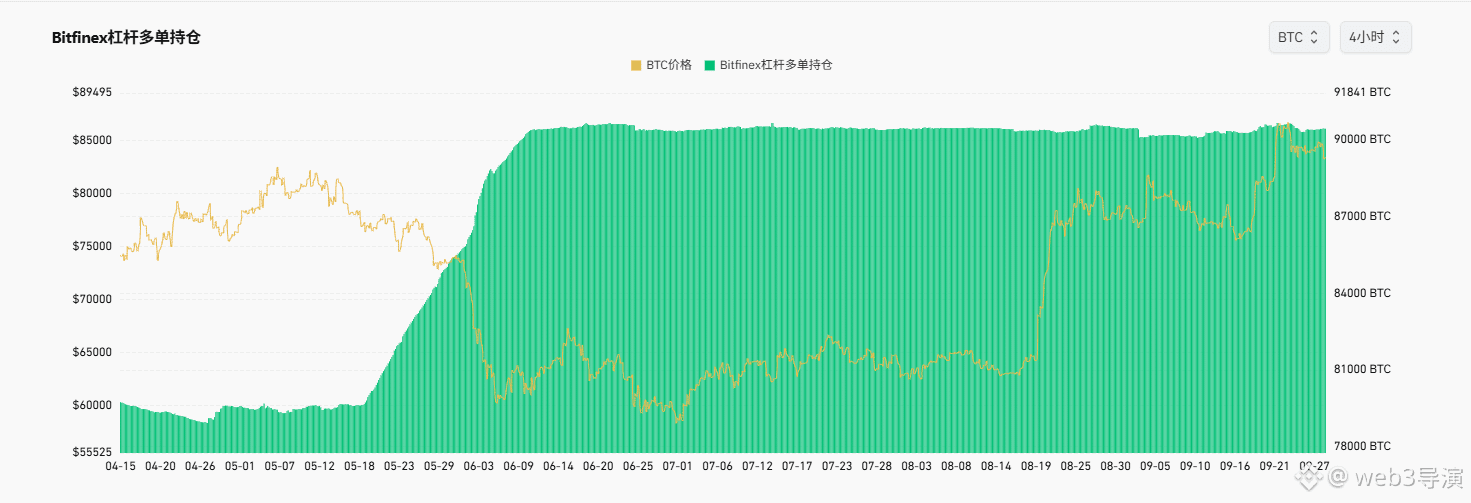
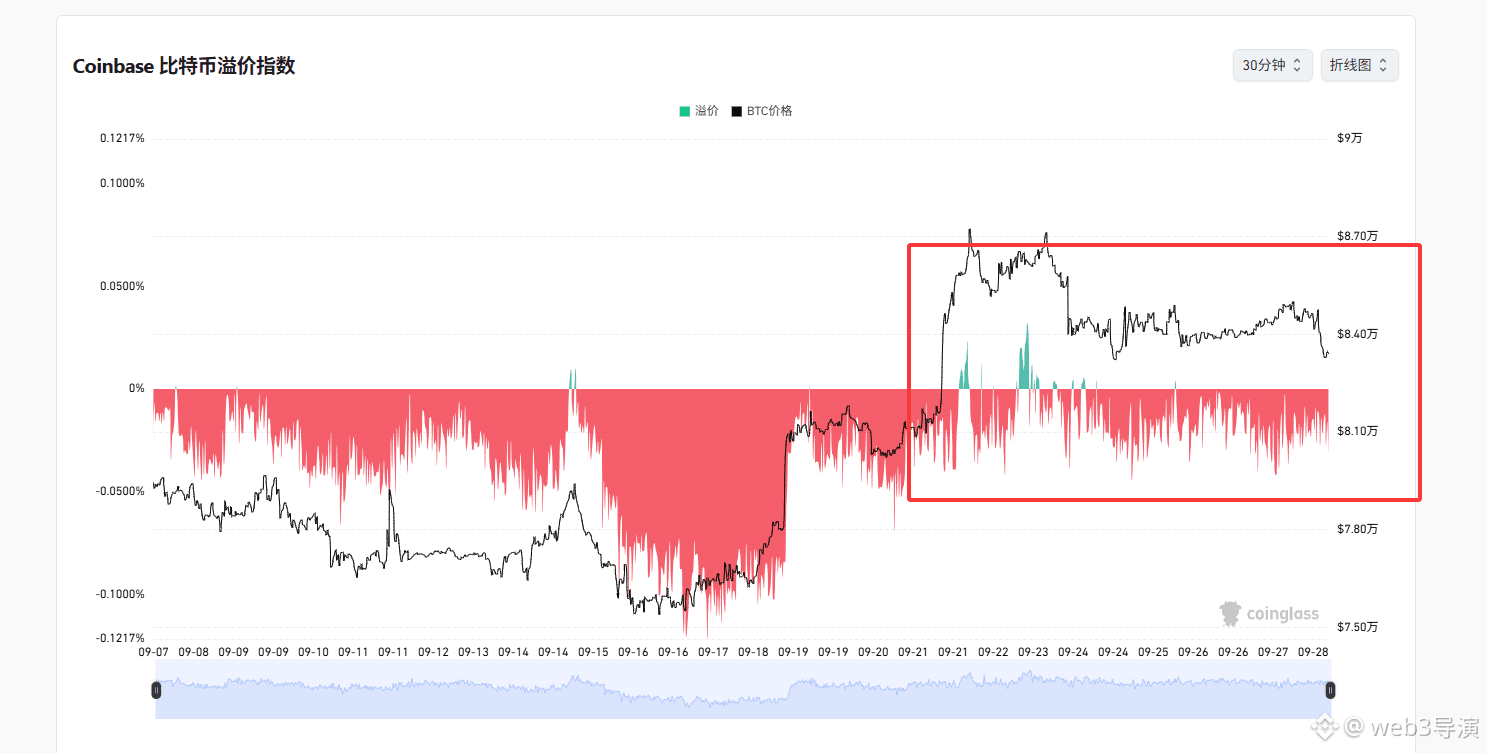
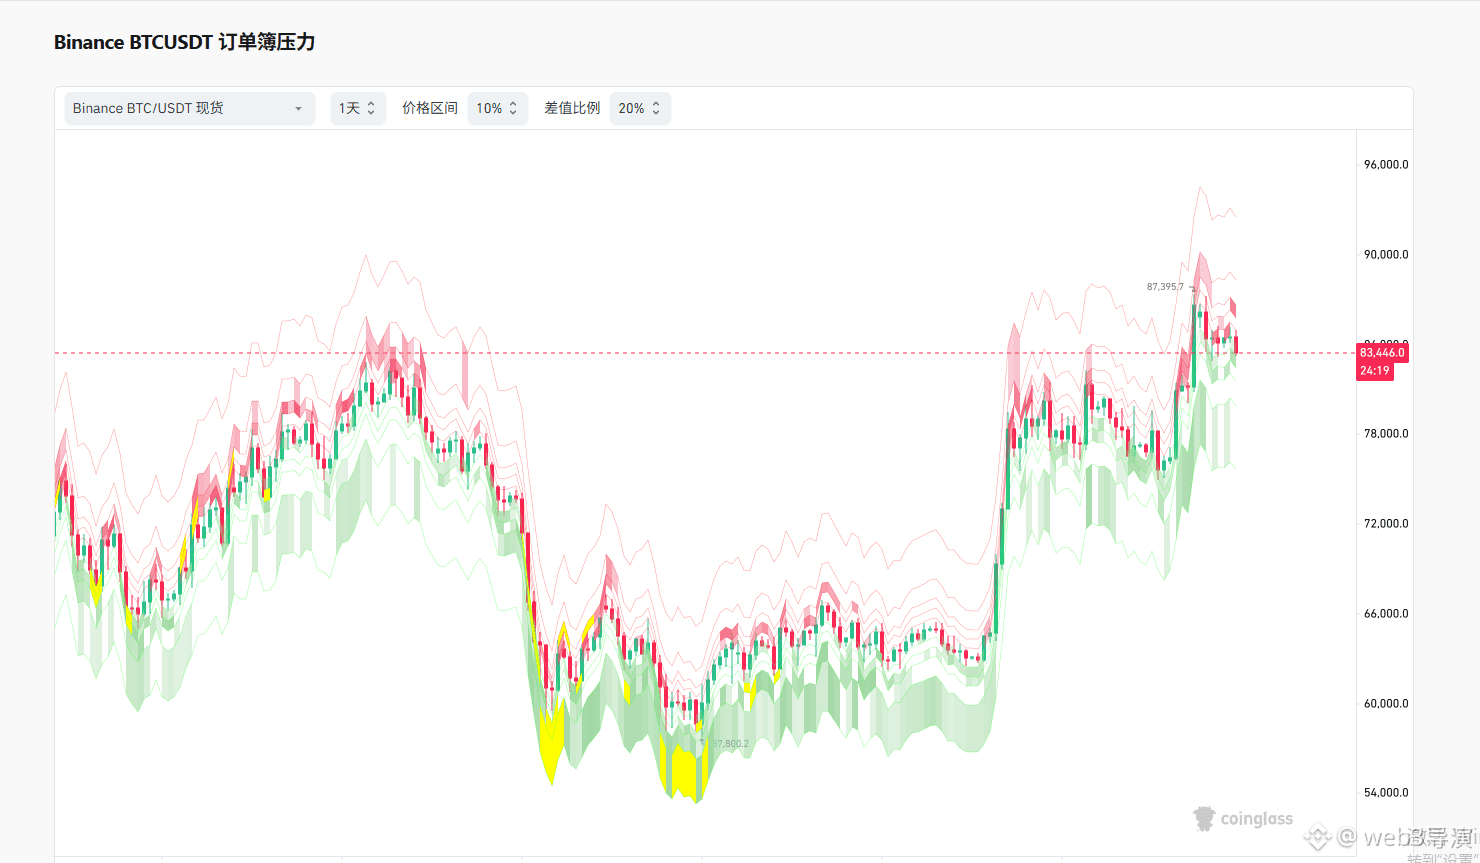
$BTC $ETH Figure 1: 90,000 BTC positions have not moved for now. Figure 2: U.S. institutions are still seeing a slight net outflow. Figure 3: Based on the order book data, buy and sell limit orders remain relatively balanced, so odds are high that trading will continue to range and consolidate.
$BTC $ETH Figure 1: 90,000 BTC positions have not moved for now. Figure 2: U.S. institutions are still seeing a slight net outflow. Figure 3: Based on the order book data, buy and sell limit orders remain relatively balanced, so odds are high that trading will continue to range and consolidate.
436
·
--
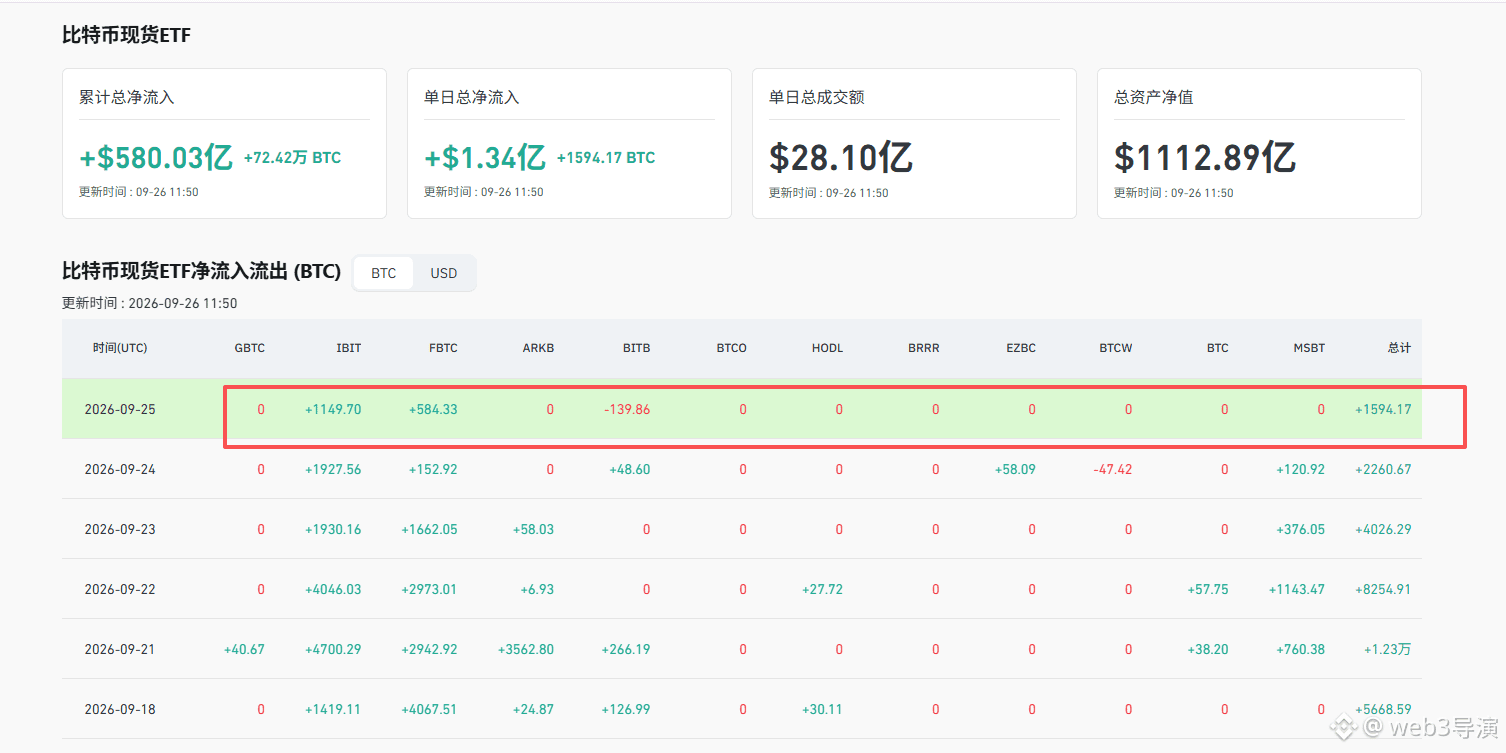
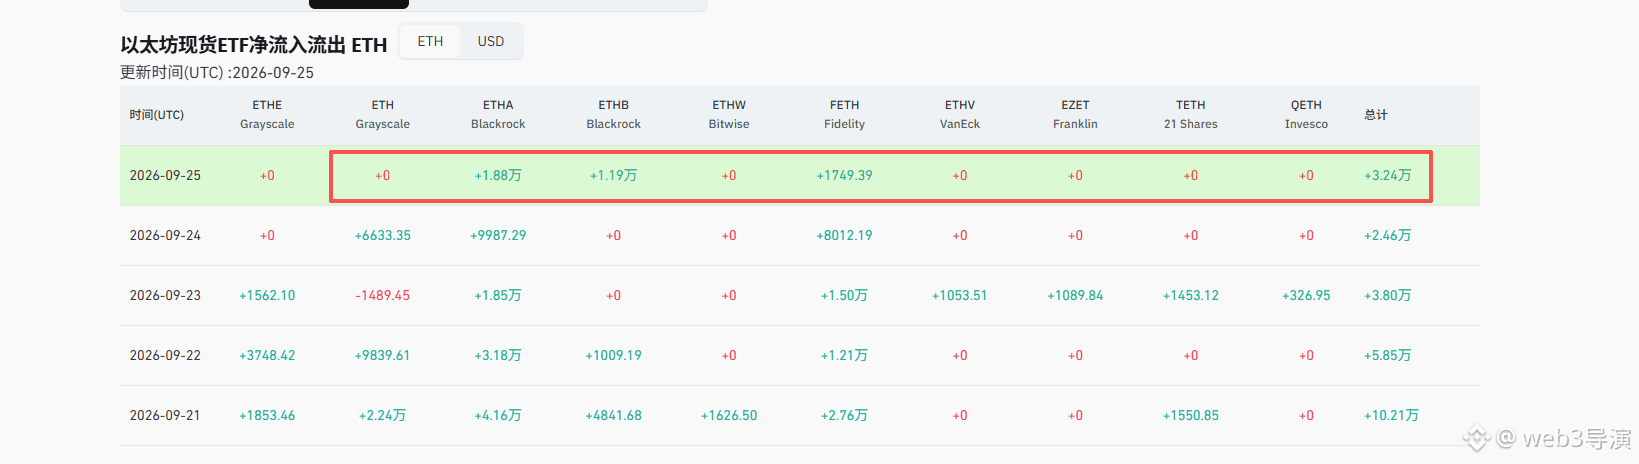
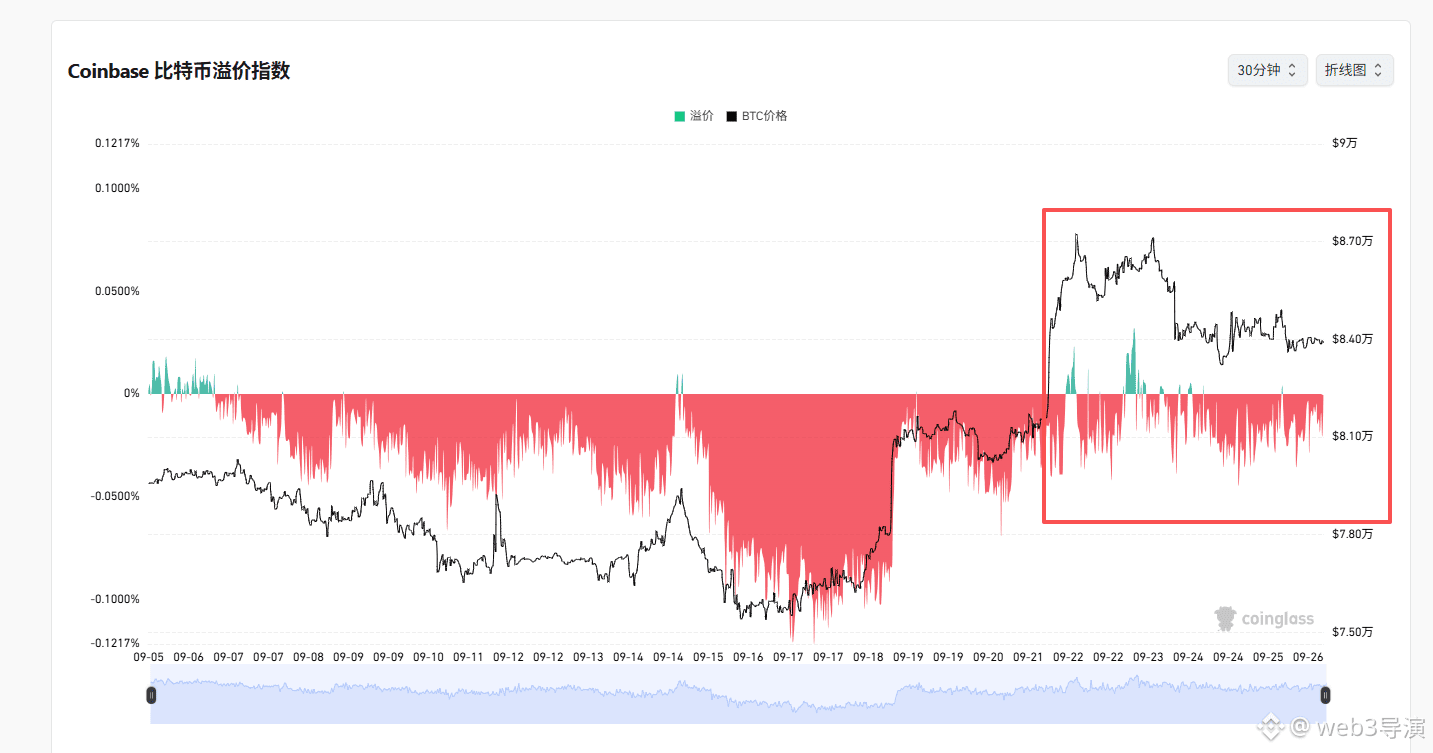
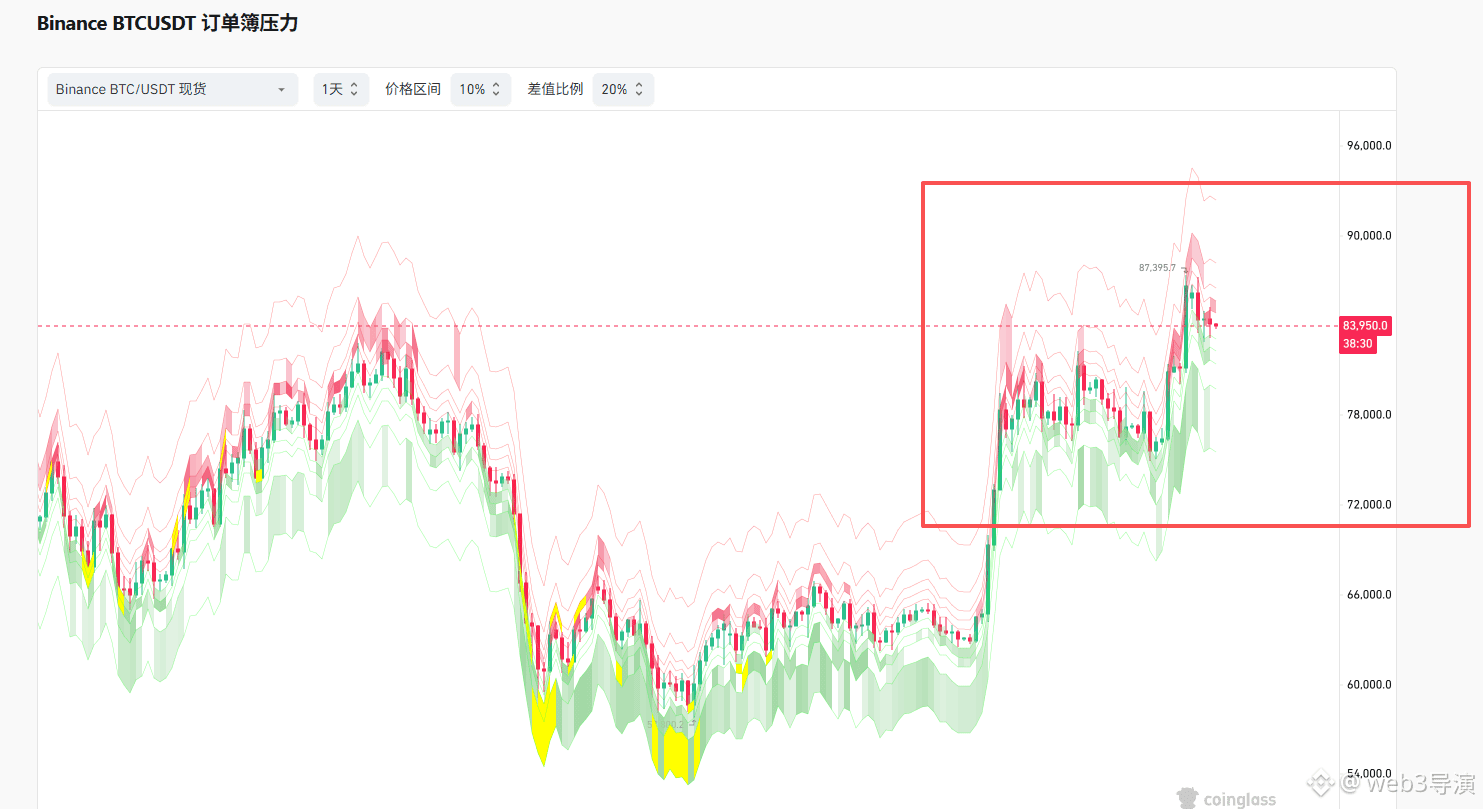
$BTC $ETH Figure 1: Last night, the Bitcoin ETF net bought over 1,000 units. Figure 2: The Ethereum ETF net bought over 30,000 units—still not much, just a small amount. Figure 3: The outflow volume from U.S. institutions is currently not large. Figure 4: The order book shows that the thickness difference between buy and sell orders is about the same. Judging solely from this data, it’s likely that volatility/sideways trading will continue.
$BTC $ETH Figure 1: Last night, the Bitcoin ETF net bought over 1,000 units. Figure 2: The Ethereum ETF net bought over 30,000 units—still not much, just a small amount. Figure 3: The outflow volume from U.S. institutions is currently not large. Figure 4: The order book shows that the thickness difference between buy and sell orders is about the same. Judging solely from this data, it’s likely that volatility/sideways trading will continue.
528
·
--
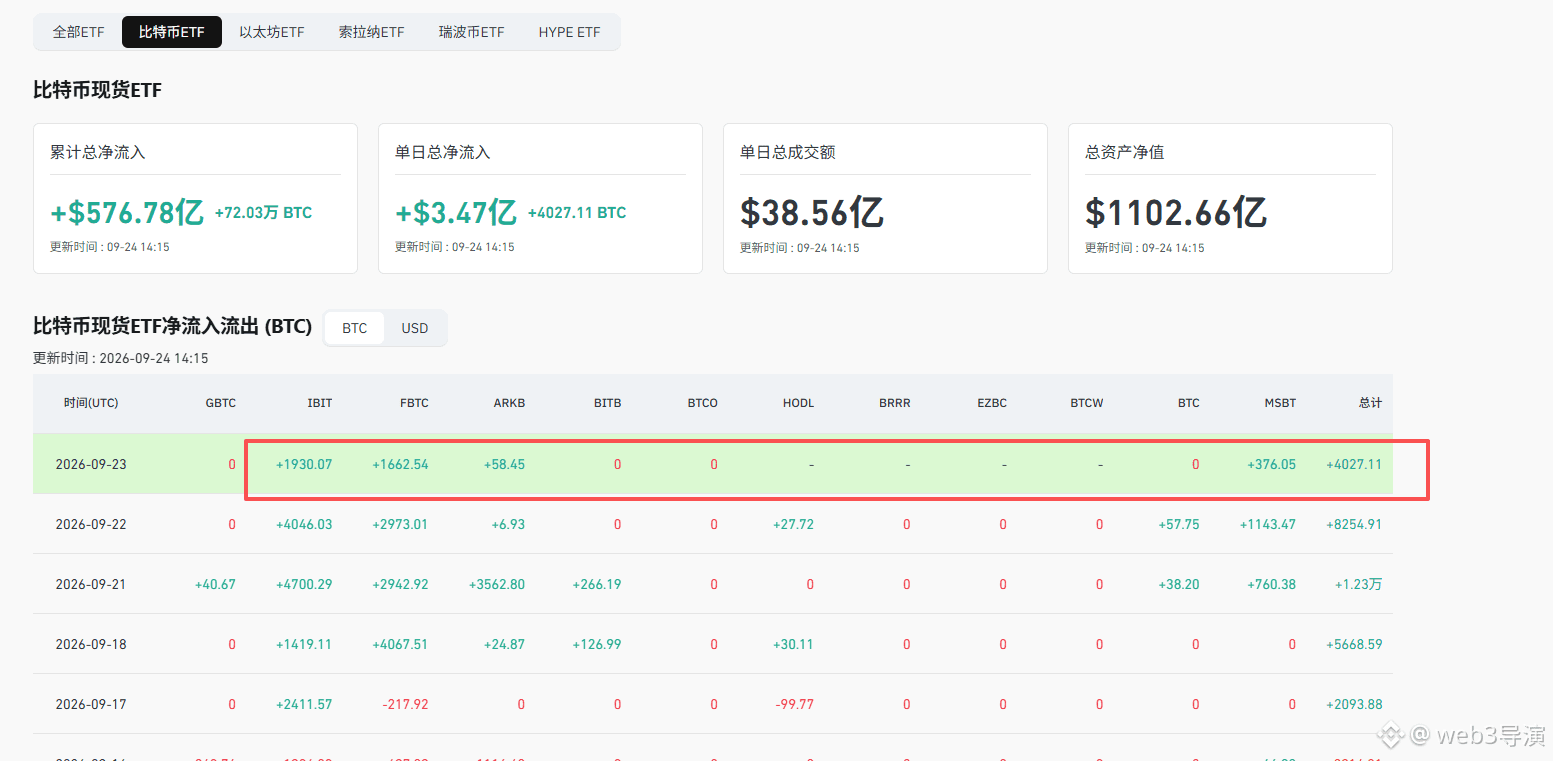
$BTC $ETH Figure 1: Last night, the Bitcoin ETF net bought 4,000 BTC. Figure 2: The Ethereum ETF saw a very small net inflow. Figure 3: US institutions are currently balanced between buying and selling. Figure 4: The order book shows both buy and sell volumes are small, so it’s likely to continue ranging.
$BTC $ETH Figure 1: Last night, the Bitcoin ETF net bought 4,000 BTC. Figure 2: The Ethereum ETF saw a very small net inflow. Figure 3: US institutions are currently balanced between buying and selling. Figure 4: The order book shows both buy and sell volumes are small, so it’s likely to continue ranging.
963
·
--
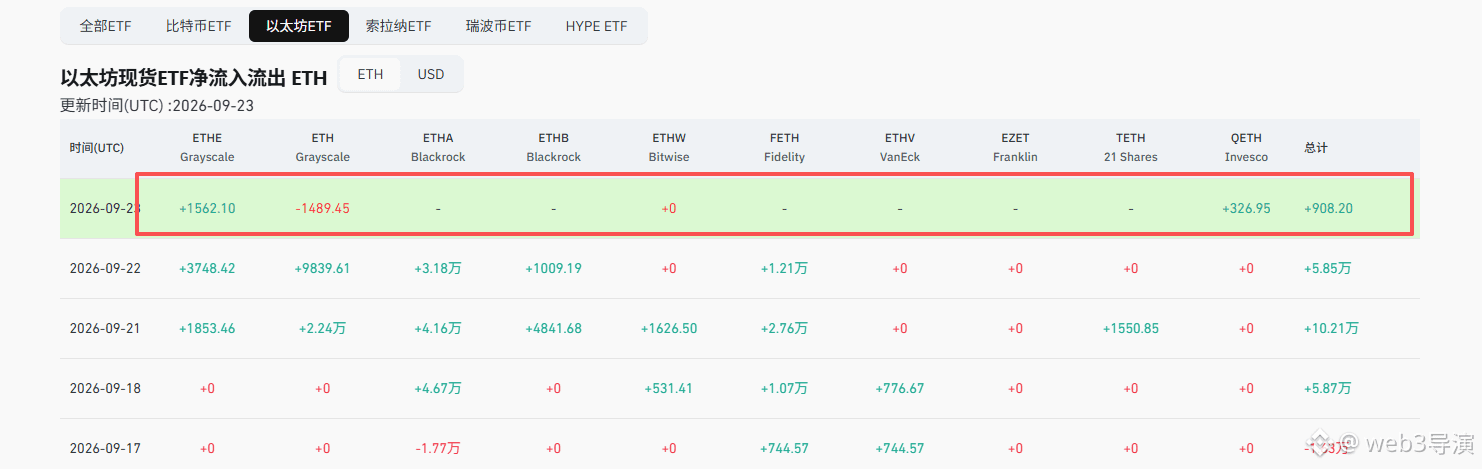
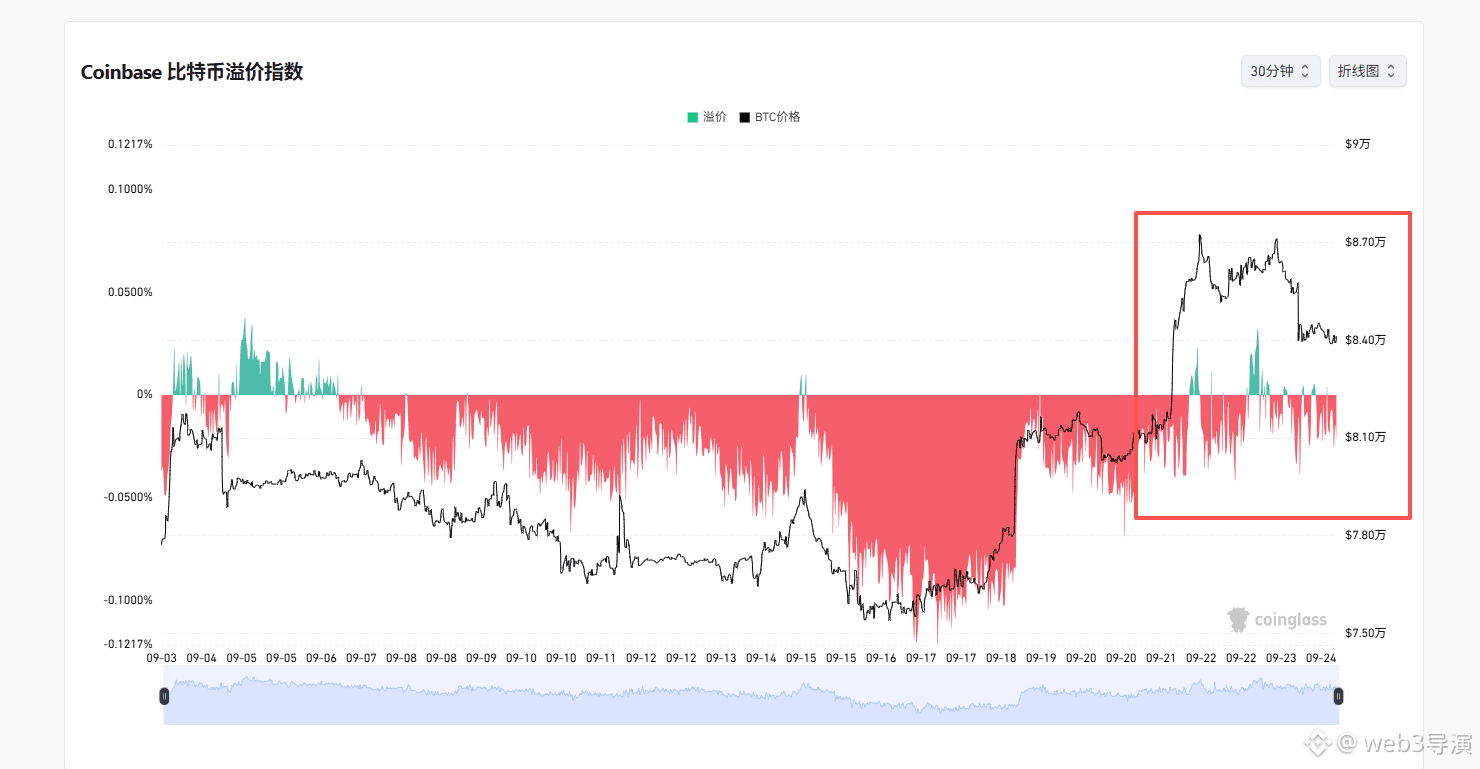
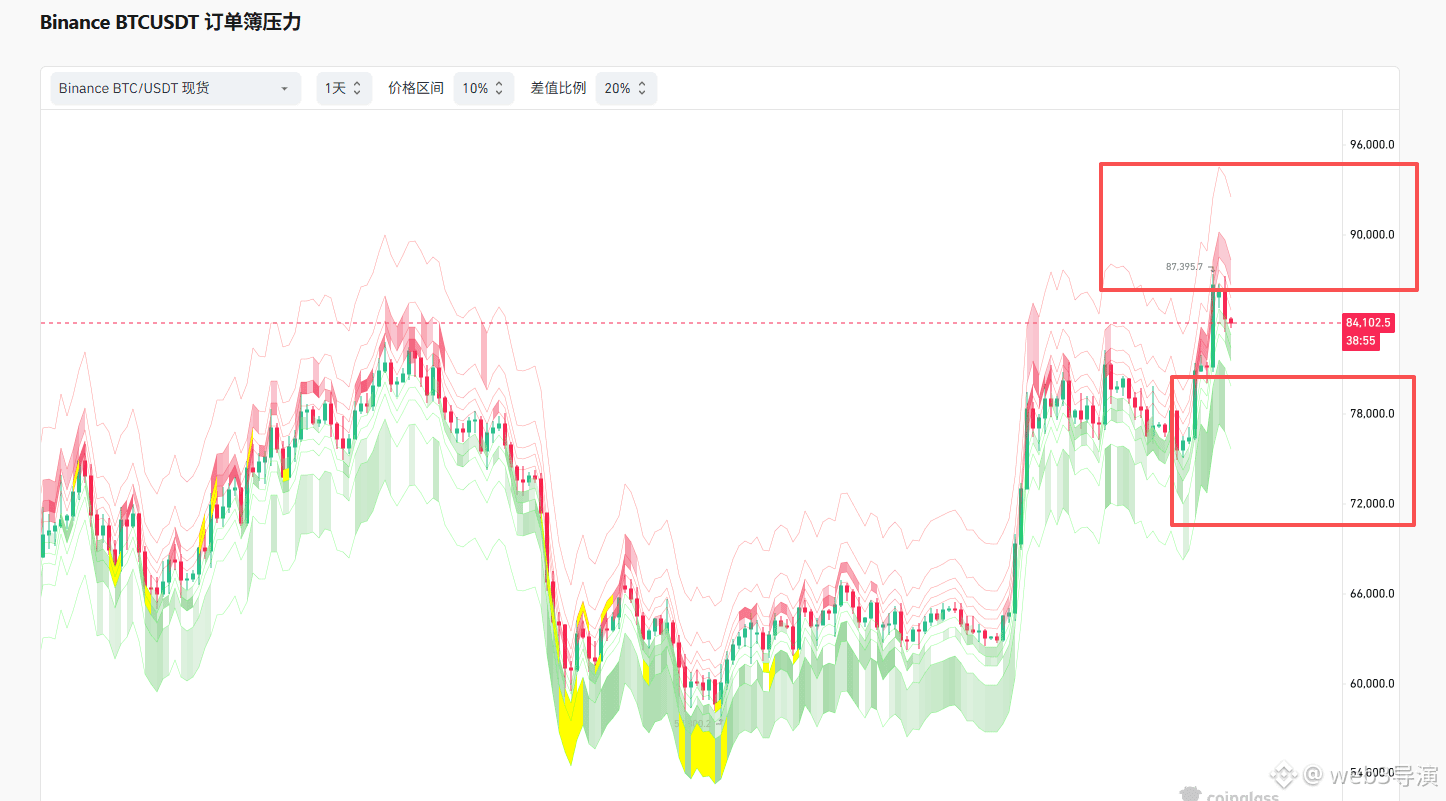
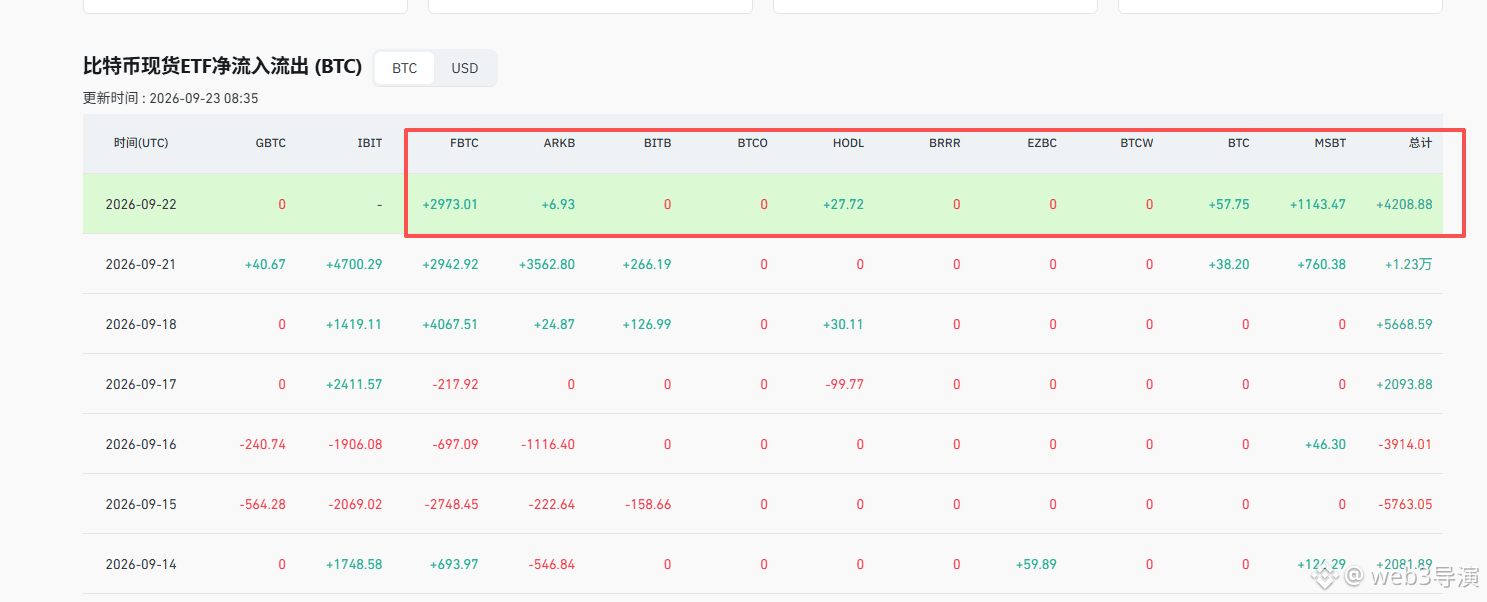
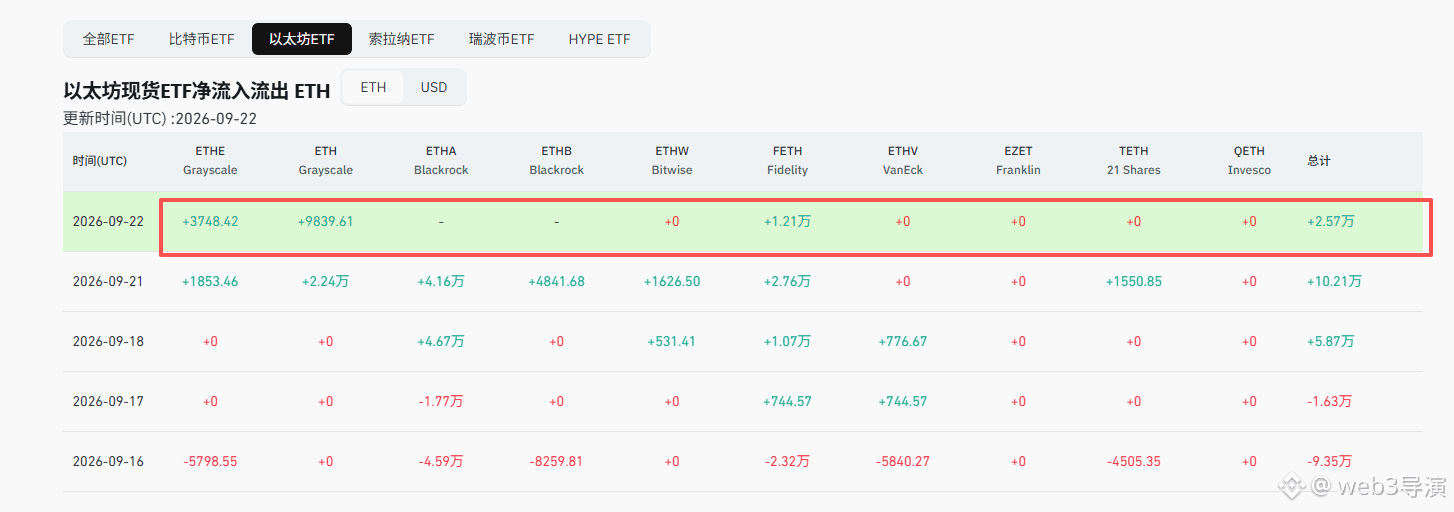
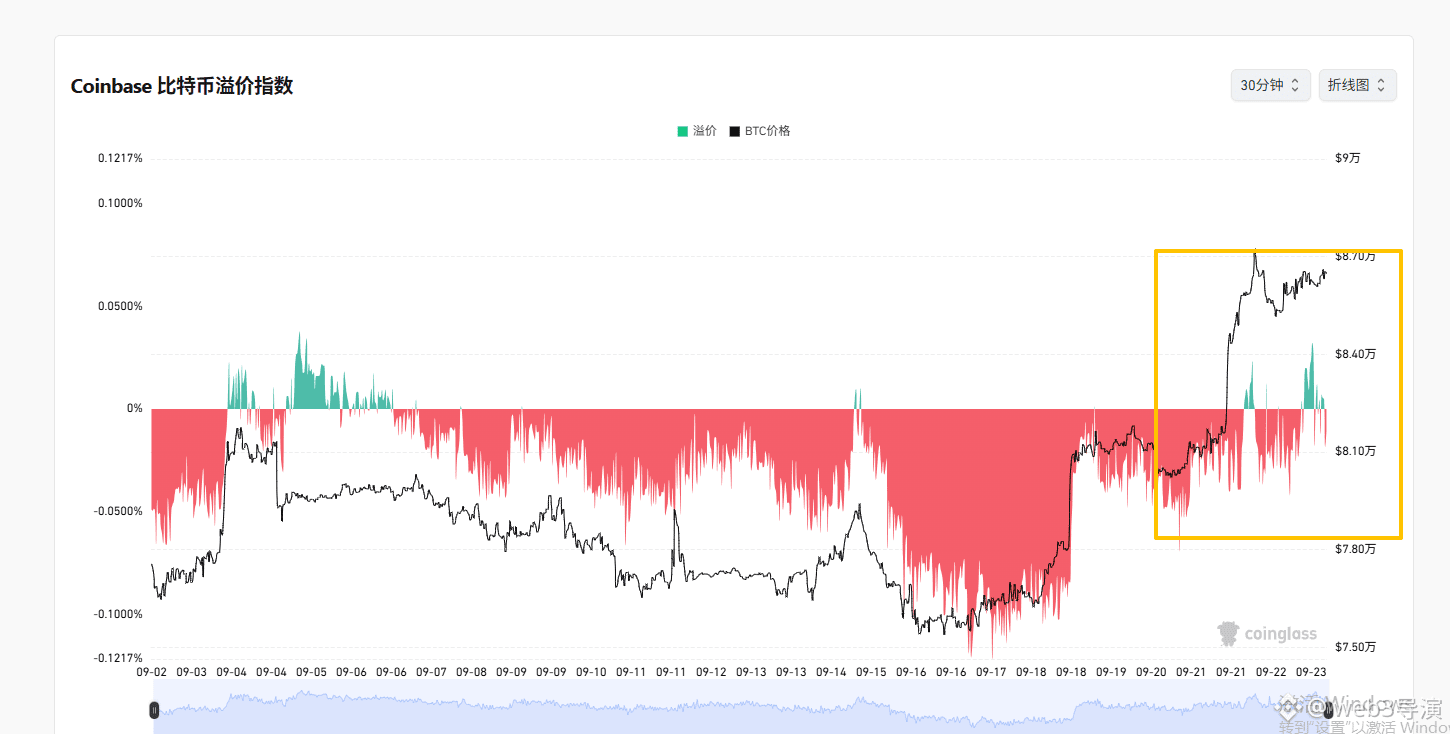
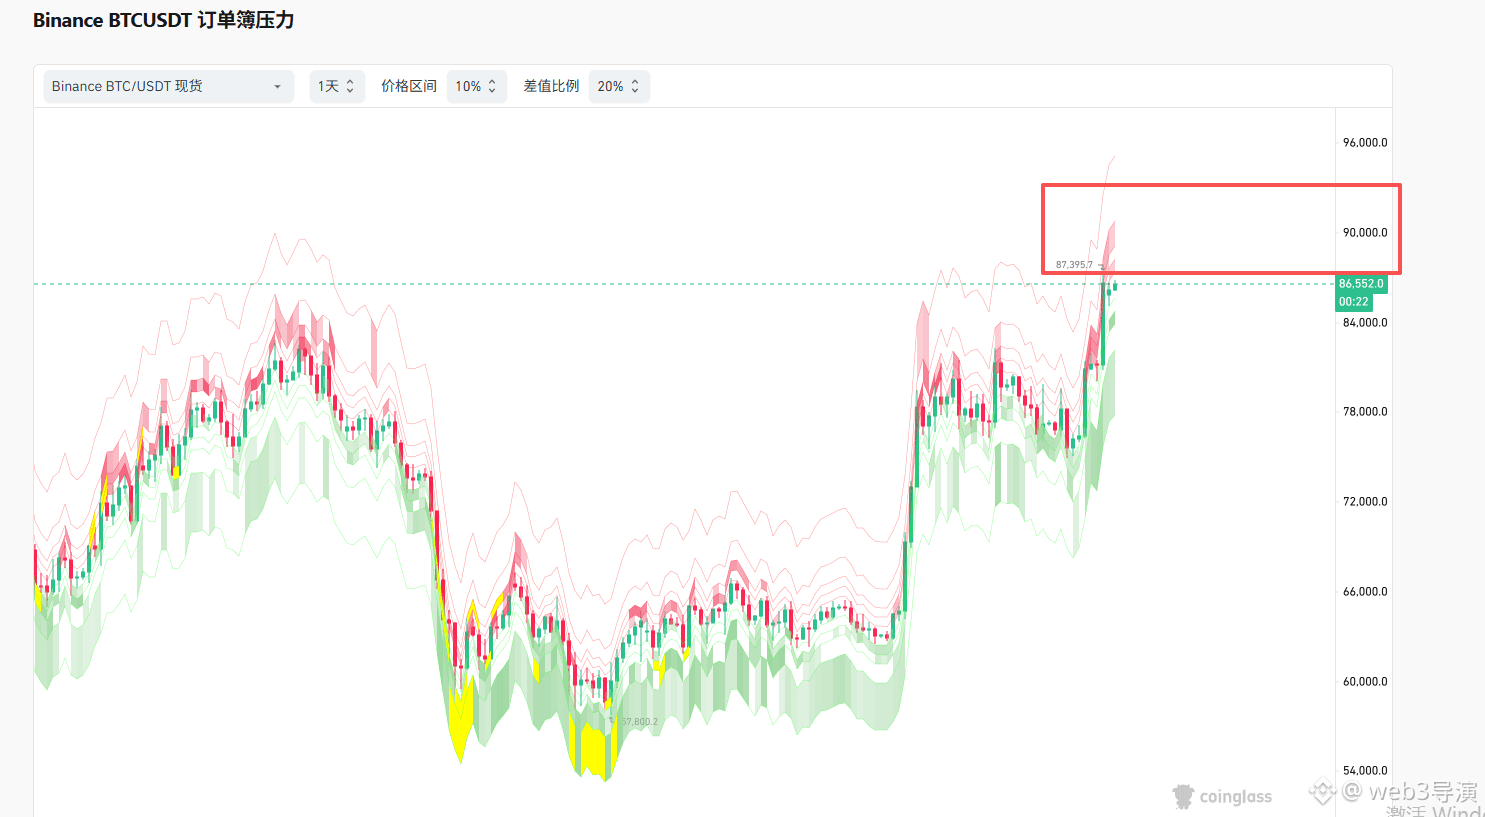
$BTC $ETH Figure 1: Last night, Bitcoin ETFs, besides BlackRock, also net bought more than 4,200. BlackRock’s data came out later; yesterday saw a big surge, so I guess their purchases weren’t much either. Figure 2: Last night, Ethereum ETFs, besides BlackRock, net bought more than 2,500. I’ll update BlackRock’s purchase data later. Figure 3: This data finally looks good. US institutions have already started net buying. Figure 4: The order book shows that the 90k sell pressure seems to be quite significant.
$BTC $ETH Figure 1: Last night, Bitcoin ETFs, besides BlackRock, also net bought more than 4,200. BlackRock’s data came out later; yesterday saw a big surge, so I guess their purchases weren’t much either. Figure 2: Last night, Ethereum ETFs, besides BlackRock, net bought more than 2,500. I’ll update BlackRock’s purchase data later. Figure 3: This data finally looks good. US institutions have already started net buying. Figure 4: The order book shows that the 90k sell pressure seems to be quite significant.
1.1k
·
--
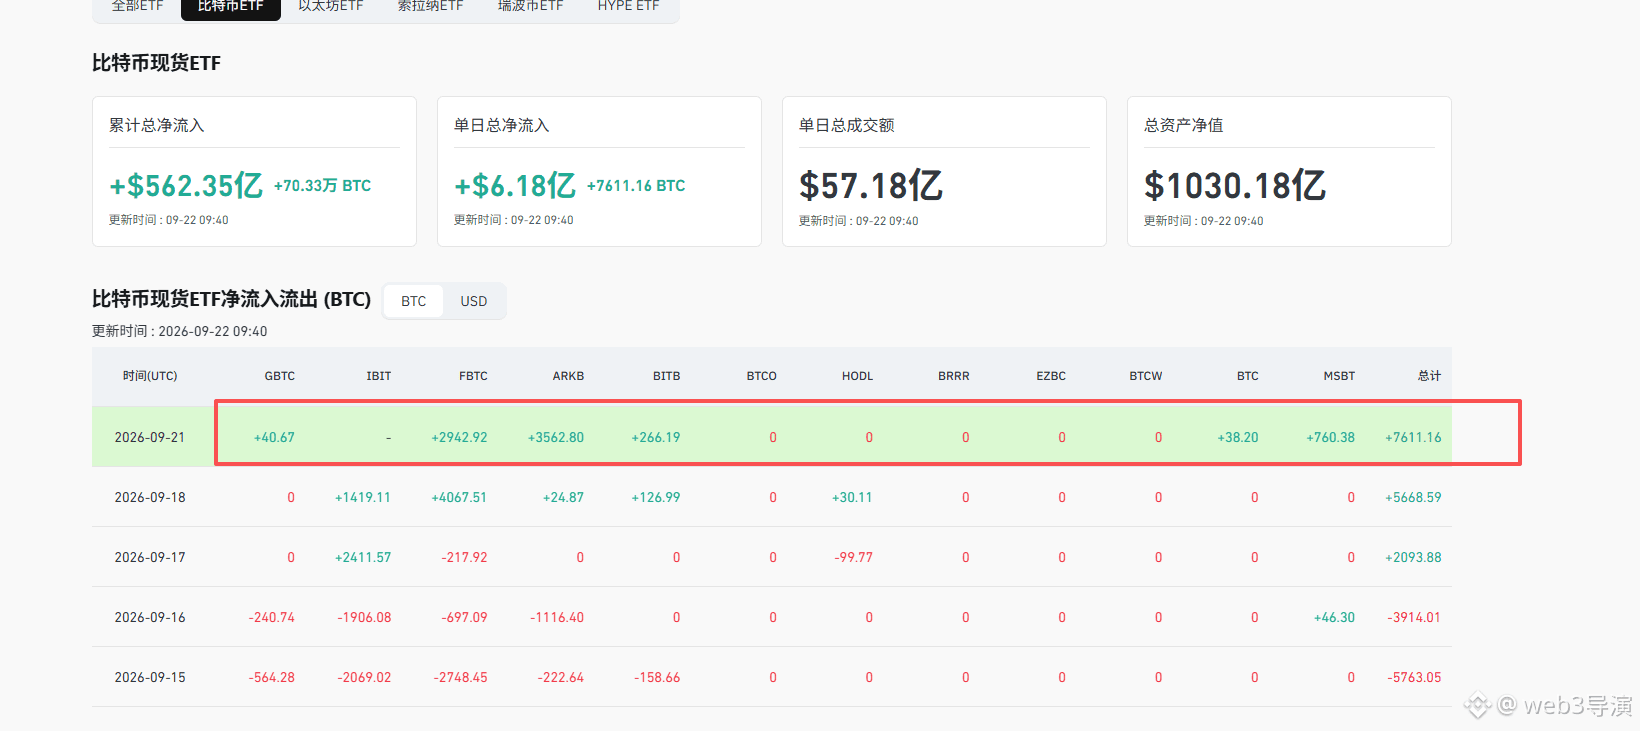
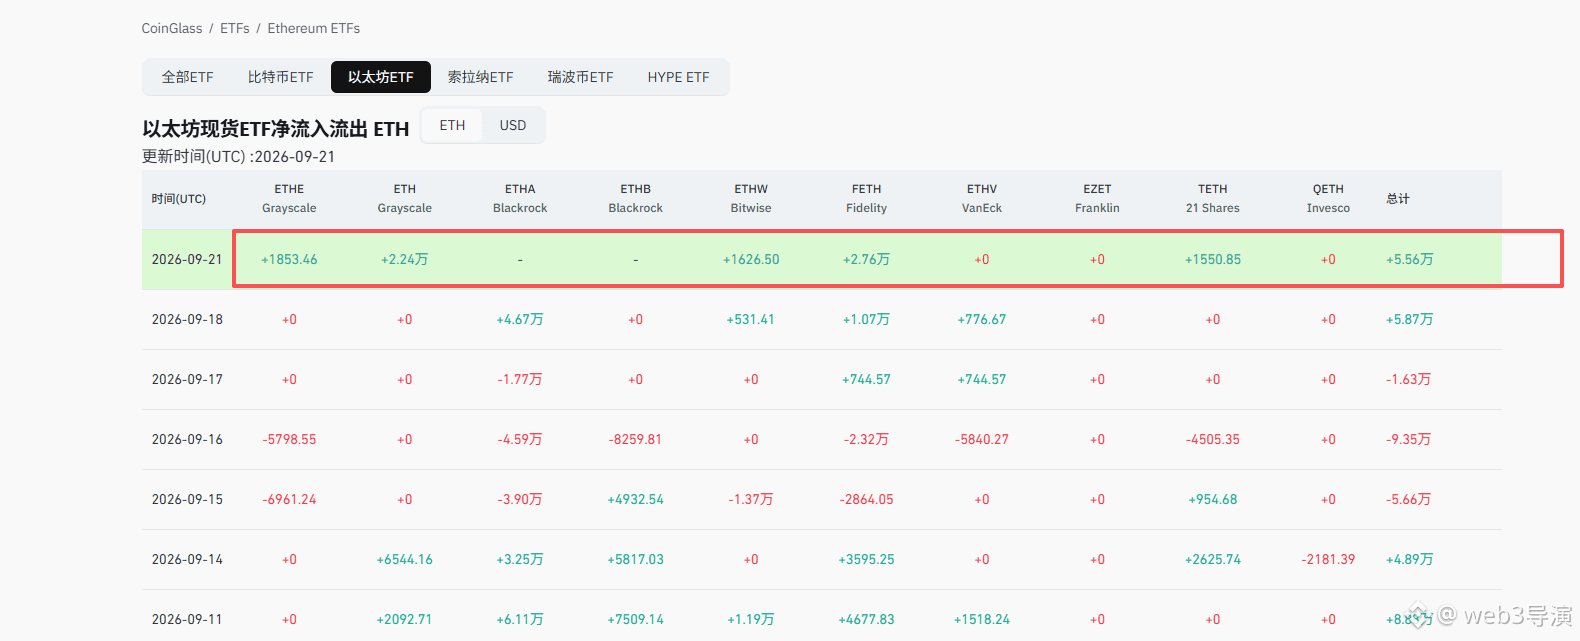
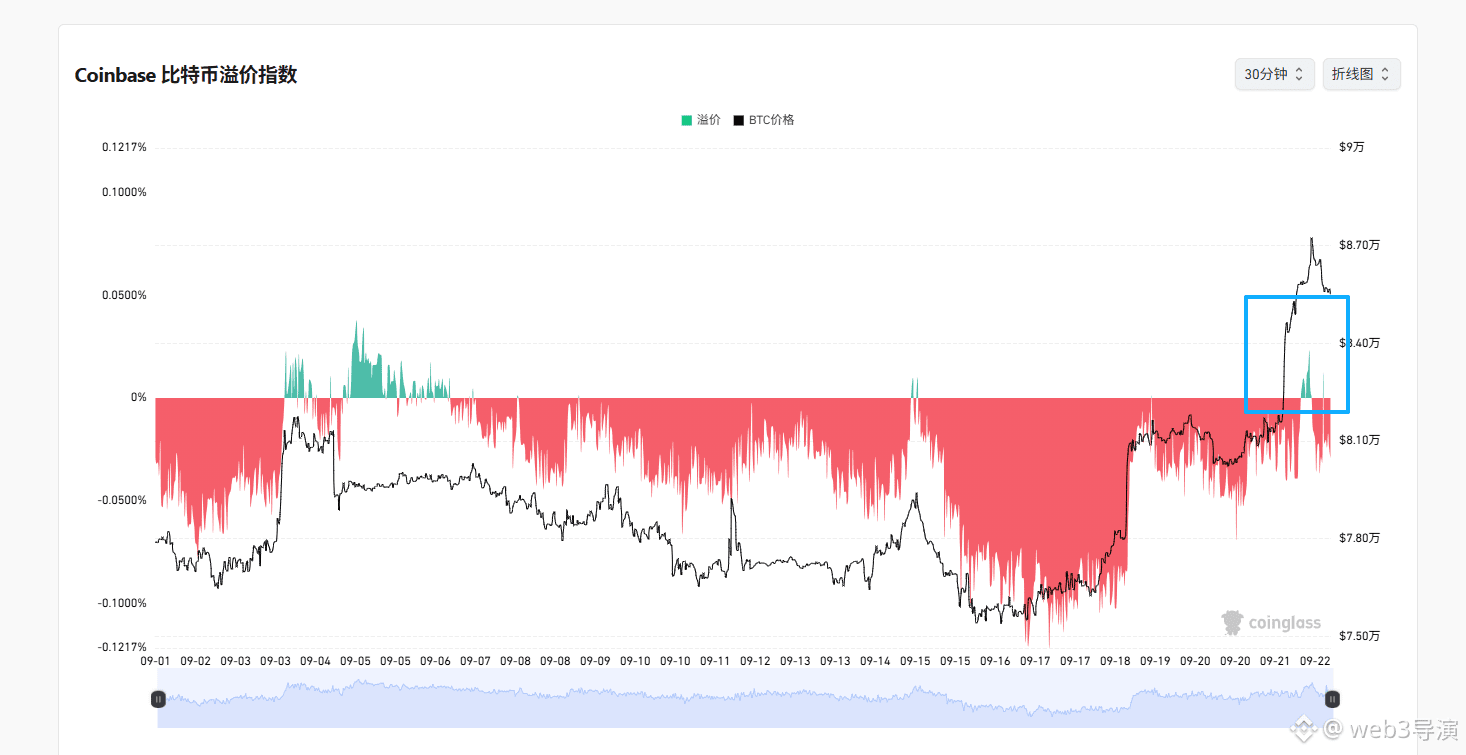
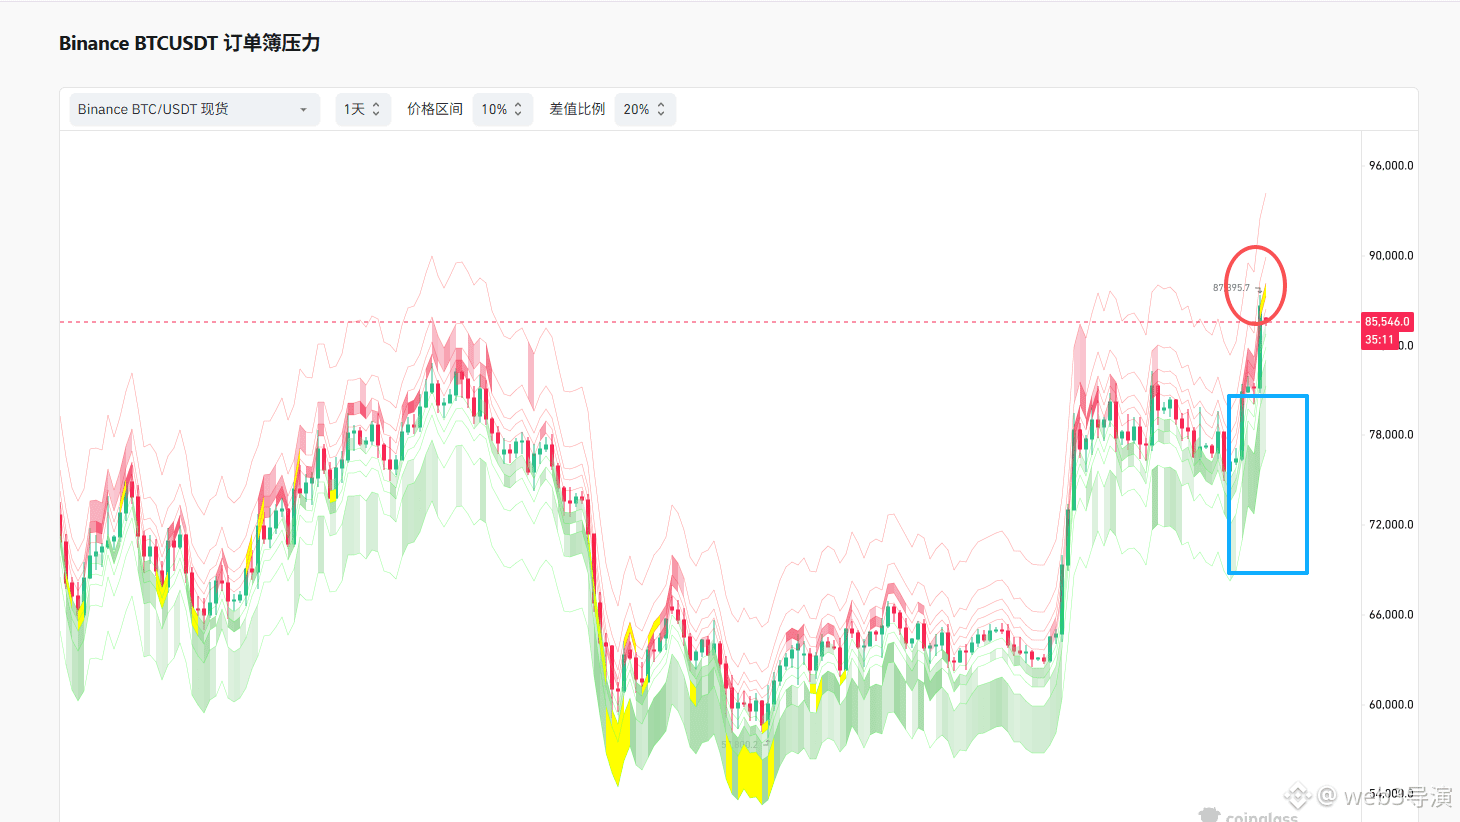
$BTC $ETH Figure 1, last night the Bitcoin ETF bought more than 7,600 shares. Looks like the reason for the big surge last night was this. Figure 2, last night the Ethereum ETF only bought over 50,000 shares—though the amount is actually not small either. Everything was bought, and none was sold. Good news. Figure 3, for a brief moment last night, U.S. institutions were net buyers. Sure enough, the price still follows what people say—it's all in their hands. Figure 4, the bid side of the order book started to shift upward slightly, but the yellow area above is the newly added sell orders. Originally, it was a choppy upward move.
$BTC $ETH Figure 1, last night the Bitcoin ETF bought more than 7,600 shares. Looks like the reason for the big surge last night was this. Figure 2, last night the Ethereum ETF only bought over 50,000 shares—though the amount is actually not small either. Everything was bought, and none was sold. Good news. Figure 3, for a brief moment last night, U.S. institutions were net buyers. Sure enough, the price still follows what people say—it's all in their hands. Figure 4, the bid side of the order book started to shift upward slightly, but the yellow area above is the newly added sell orders. Originally, it was a choppy upward move.
3
2.2k
·
--
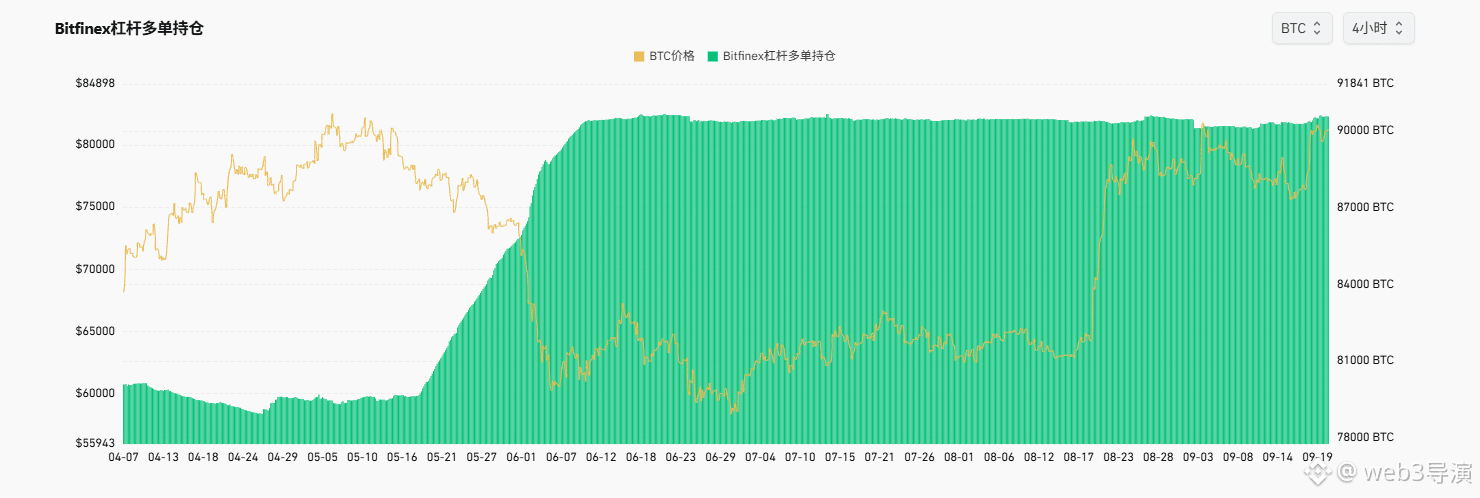
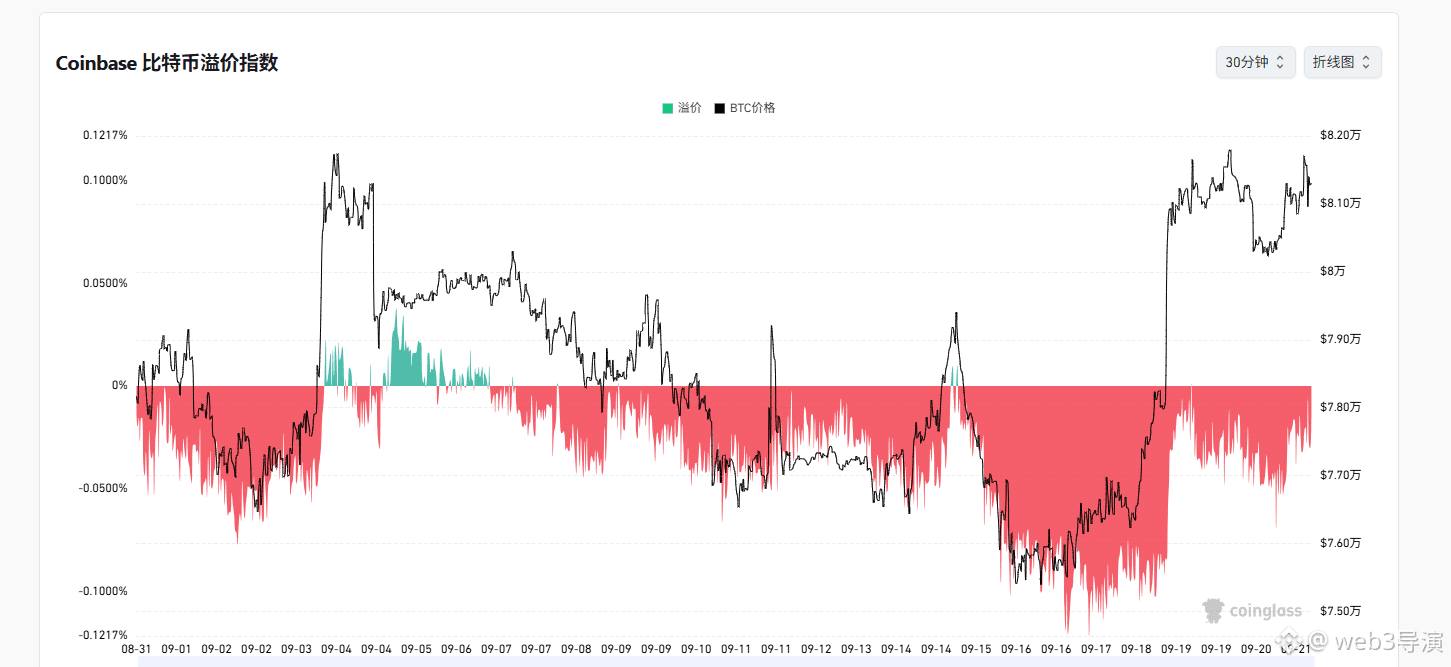
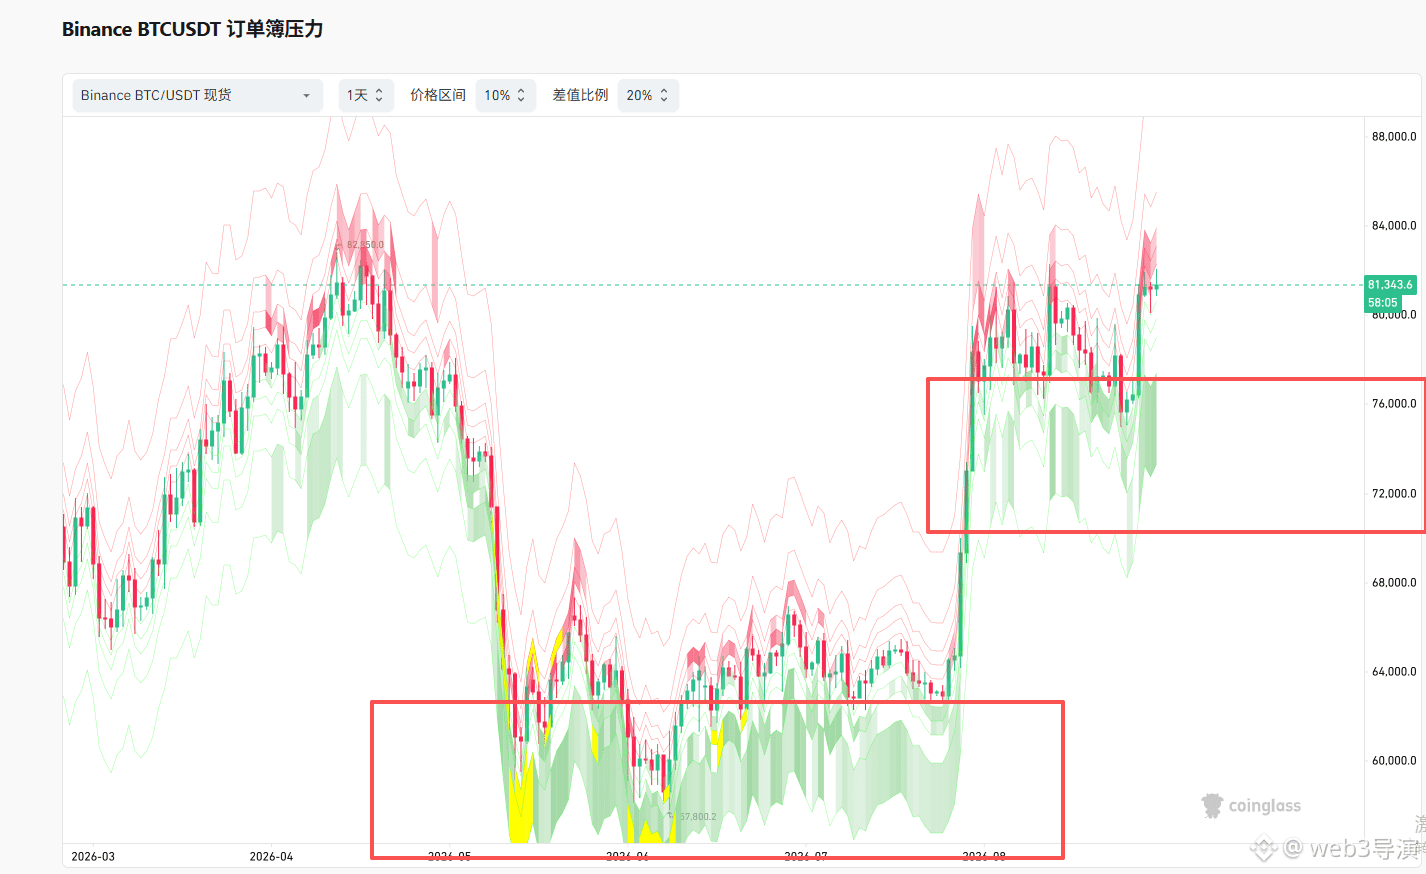
$BTC $ETH Figure 1: The institutions that borrowed money to buy 90,000 Bitcoins are really holding their nerve—they haven’t moved yet. Figure 2: U.S. institutions are still selling in tiny amounts. Figure 3: The order book data still looks good—the support below is solid. However, it hasn’t moved up. On the upside, there are sell orders sitting right up against the price pressure. Most likely, it’s still going to trade sideways. Ethereum has just been poked with a small needle. I’ll watch to see whether the ETF goes on tonight.
$BTC $ETH Figure 1: The institutions that borrowed money to buy 90,000 Bitcoins are really holding their nerve—they haven’t moved yet. Figure 2: U.S. institutions are still selling in tiny amounts. Figure 3: The order book data still looks good—the support below is solid. However, it hasn’t moved up. On the upside, there are sell orders sitting right up against the price pressure. Most likely, it’s still going to trade sideways. Ethereum has just been poked with a small needle. I’ll watch to see whether the ETF goes on tonight.
3
1.8k
·
--
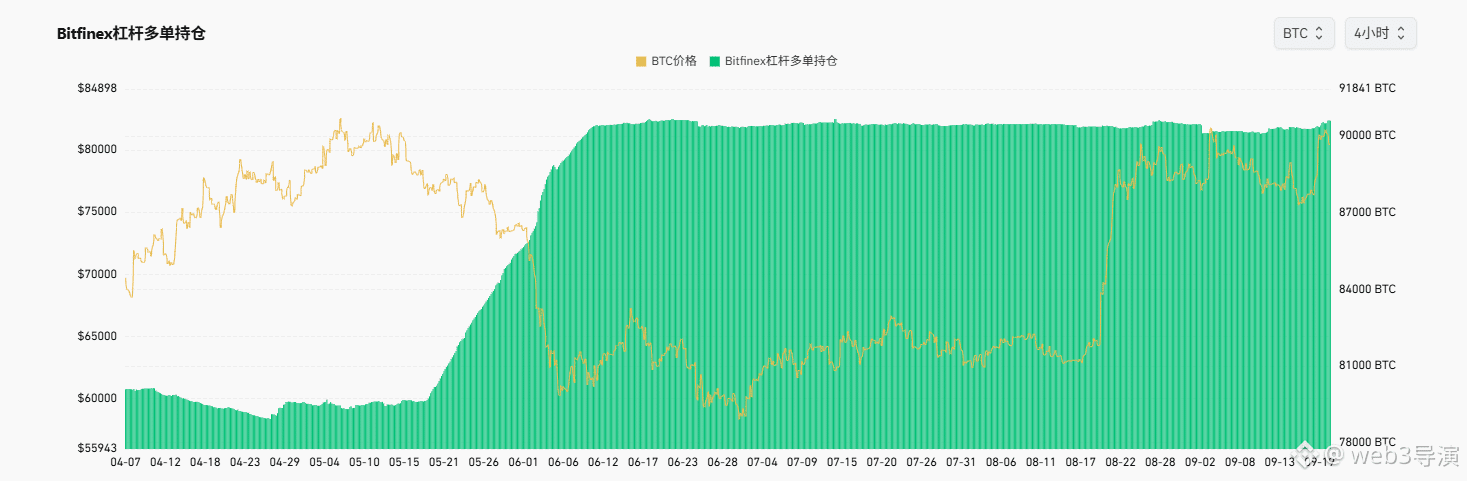
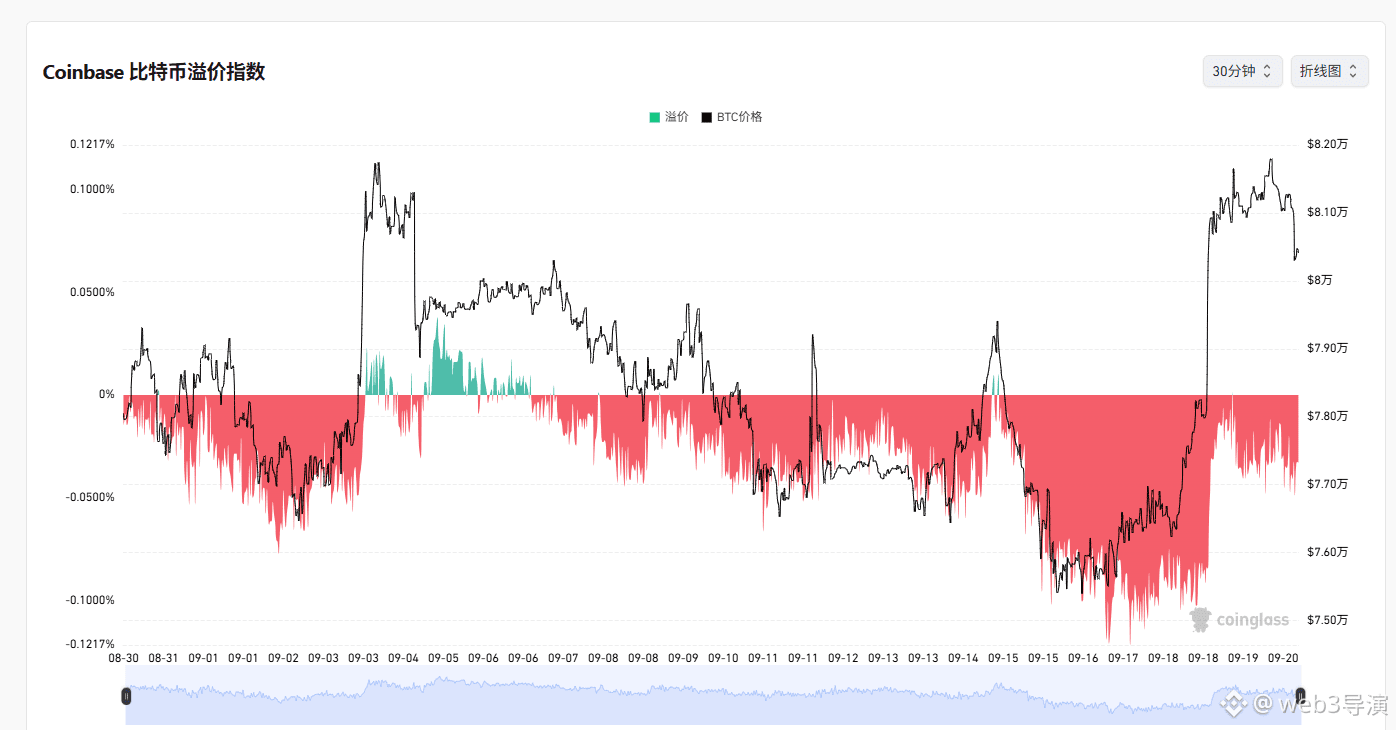
$BTC $ETH Figure 1: The institutions holding 900 million pancakes haven’t sold yet; Figure 2: US institutions are still selling only a small amount; Figure 3: Above the order book there are large sell orders, and below it there are large buy orders. Most likely, it’s still going to range-bound (consolidate).
$BTC $ETH Figure 1: The institutions holding 900 million pancakes haven’t sold yet; Figure 2: US institutions are still selling only a small amount; Figure 3: Above the order book there are large sell orders, and below it there are large buy orders. Most likely, it’s still going to range-bound (consolidate).
1.4k
·
--
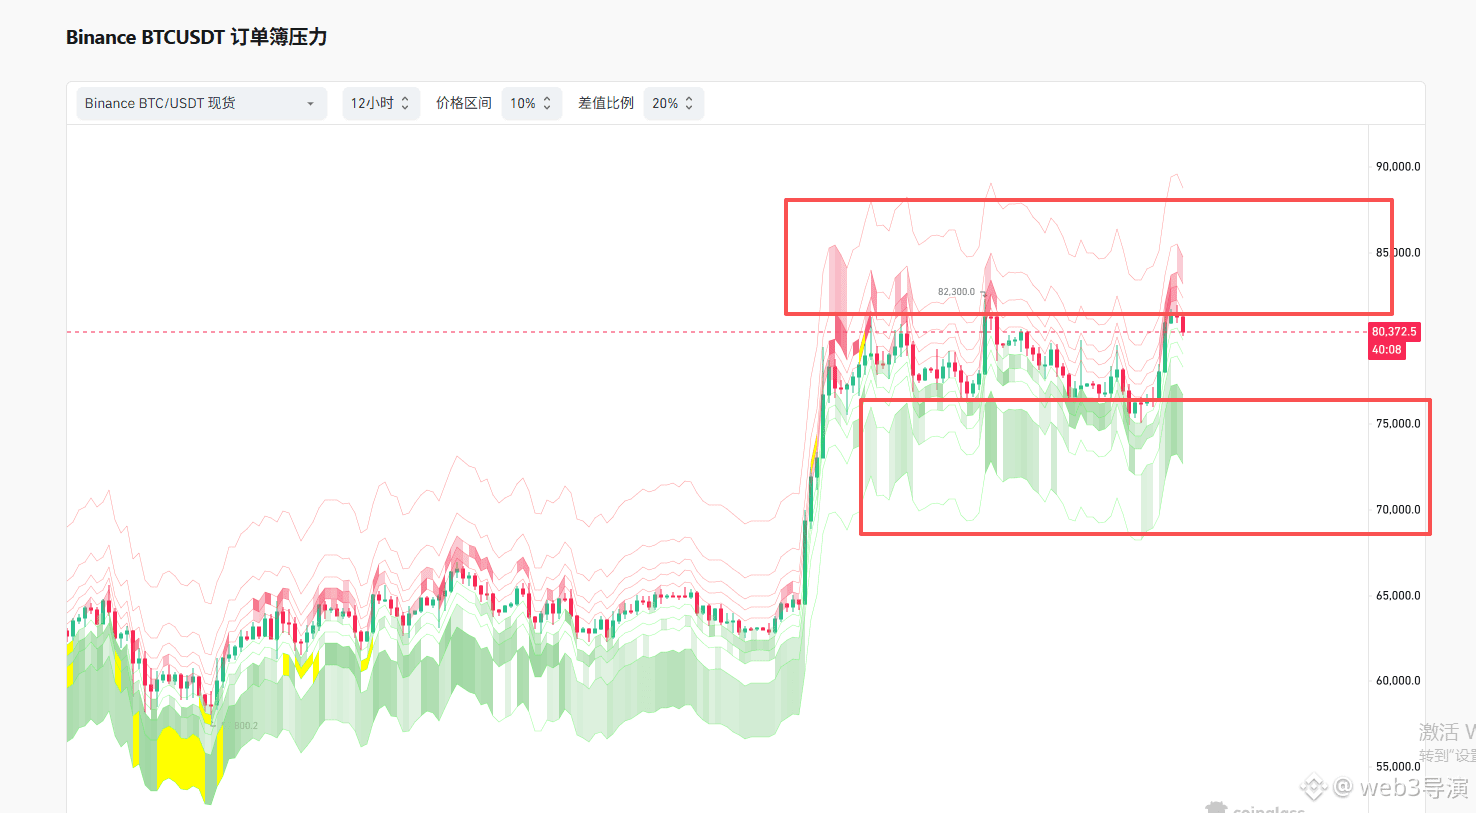
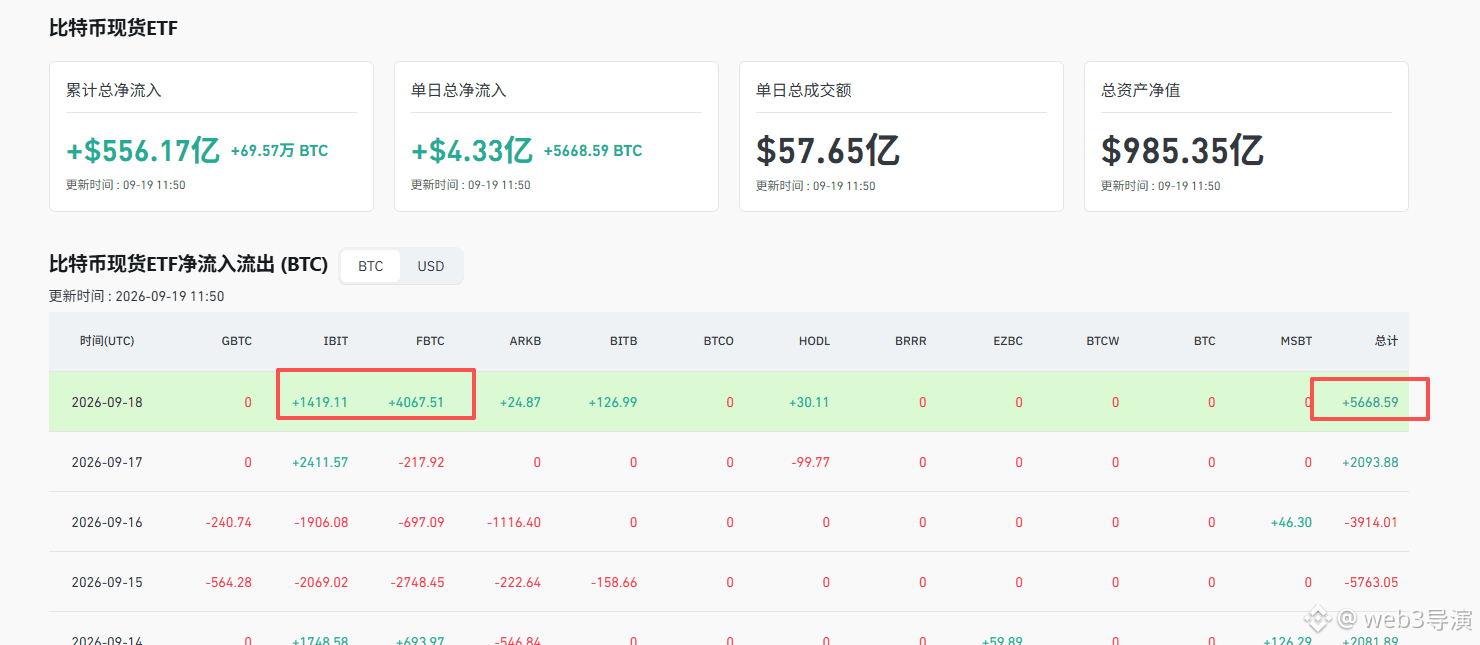
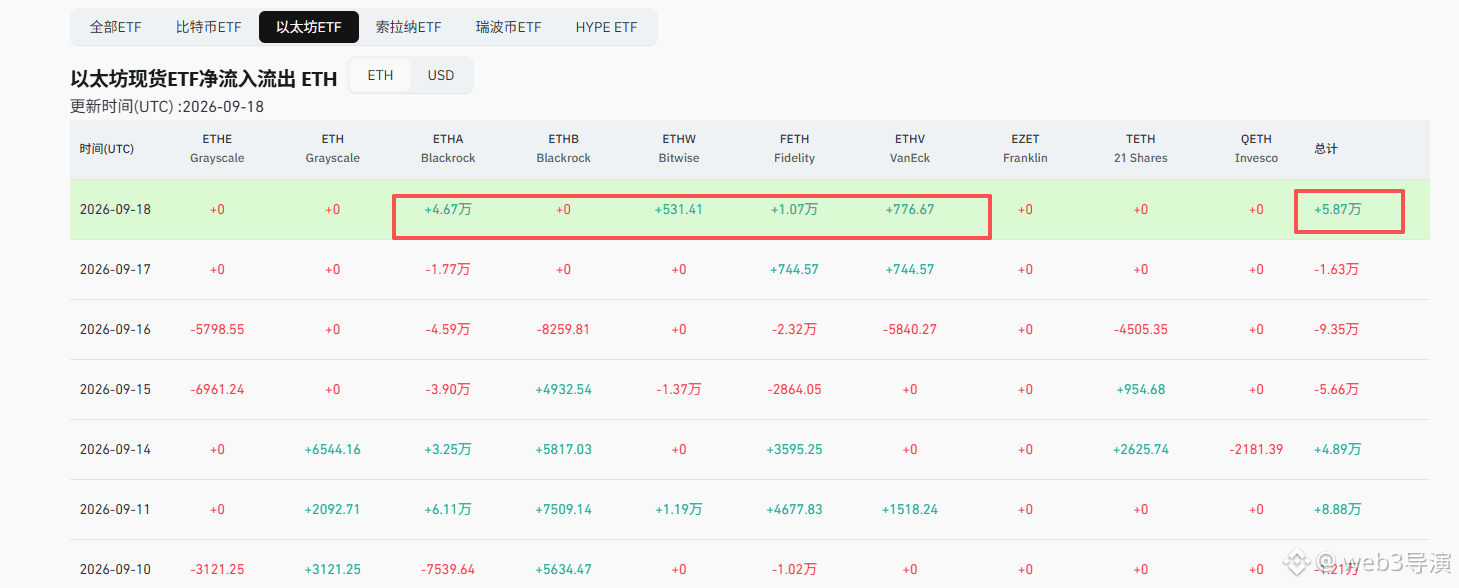
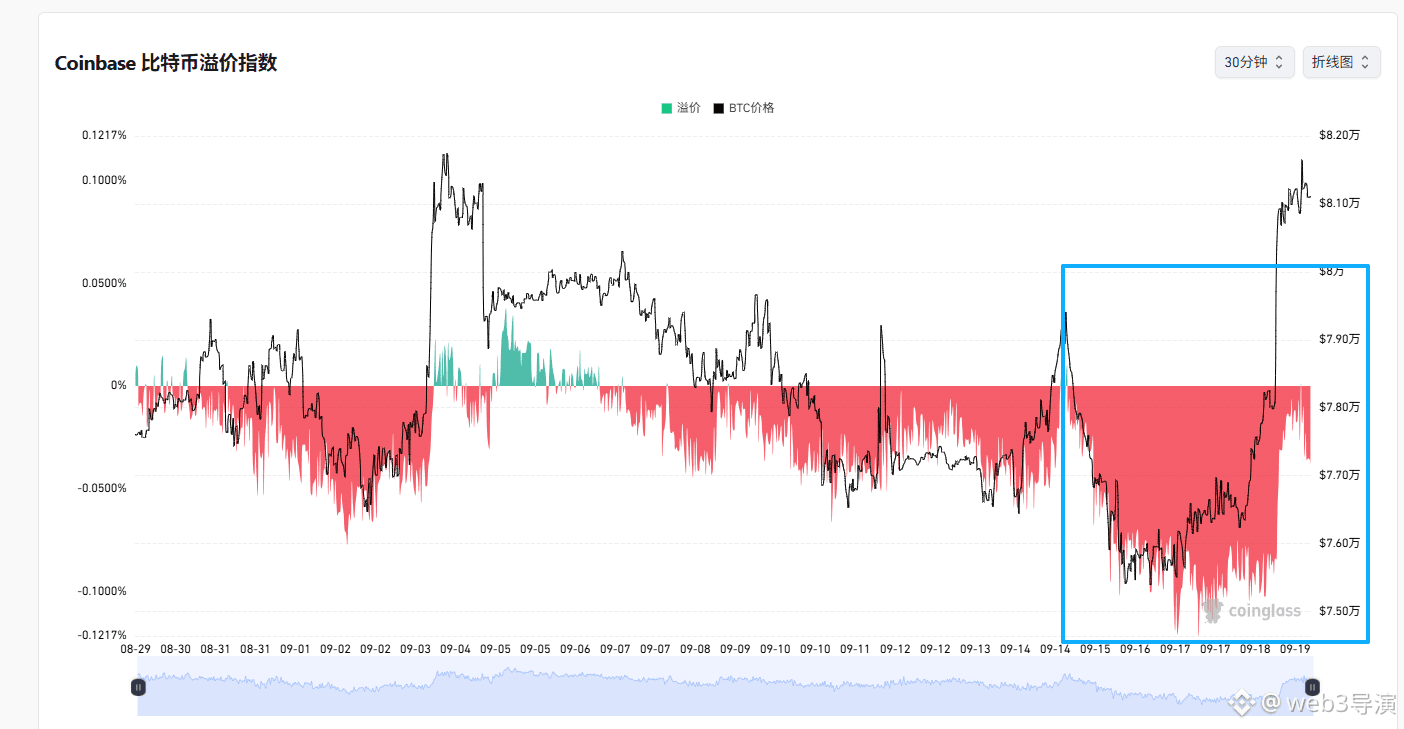
$BTC Figure 1: Last night, Bitcoin ETFs had net purchases of more than 5,000. Fidelity and BlackRock bought more. Figure 2: Last night, Ethereum ETFs had net purchases of more than 50,000, and the volume is still okay. Figure 3: Last night, it seems some institution quickly bought a lot, covering the sell volume. However, it still looks like funds are continuing to flow out. Figure 4: The order book shows increasing sell pressure starting at the top. Based on this data alone, it should continue to trade in a range.
$BTC Figure 1: Last night, Bitcoin ETFs had net purchases of more than 5,000. Fidelity and BlackRock bought more. Figure 2: Last night, Ethereum ETFs had net purchases of more than 50,000, and the volume is still okay. Figure 3: Last night, it seems some institution quickly bought a lot, covering the sell volume. However, it still looks like funds are continuing to flow out. Figure 4: The order book shows increasing sell pressure starting at the top. Based on this data alone, it should continue to trade in a range.
2
1.1k
·
--
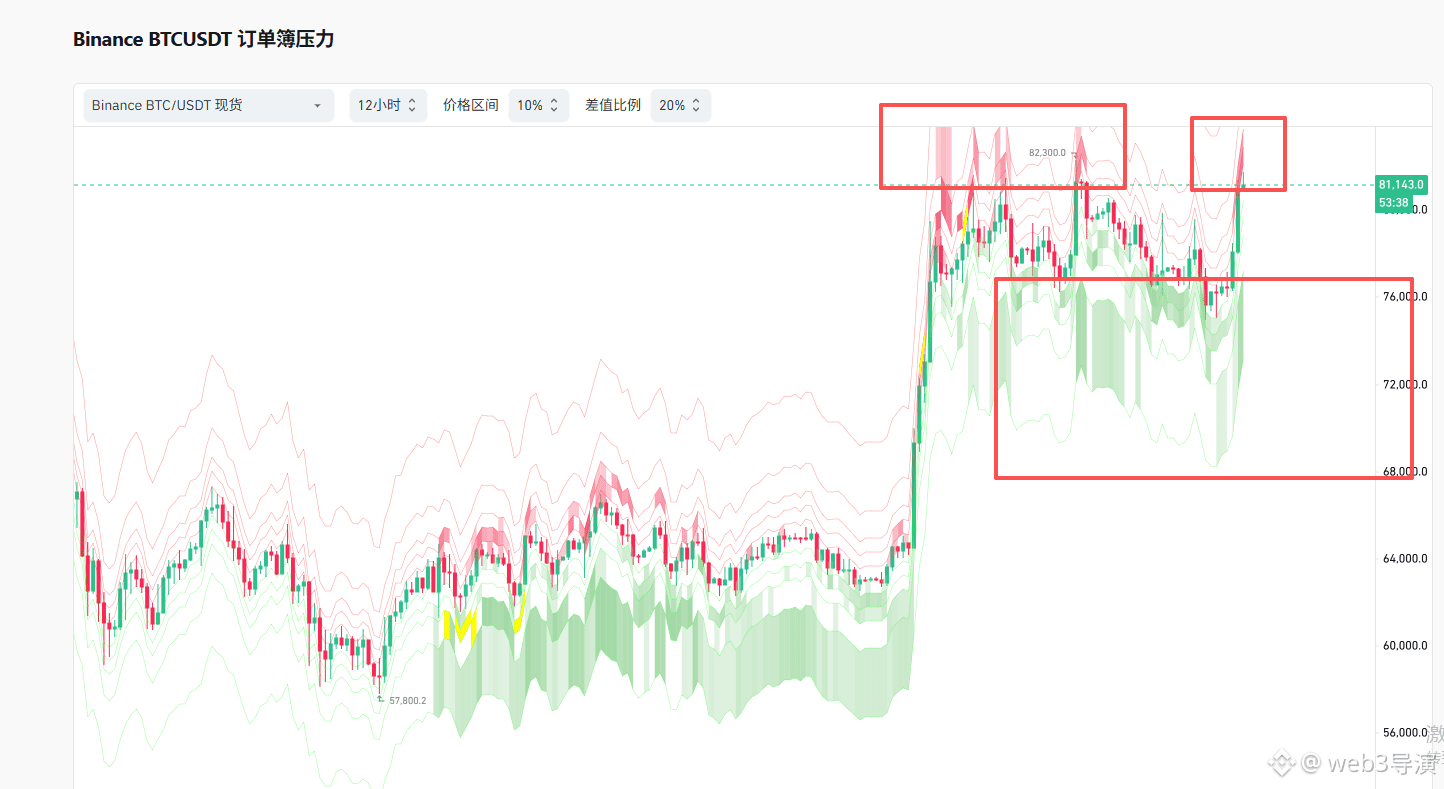
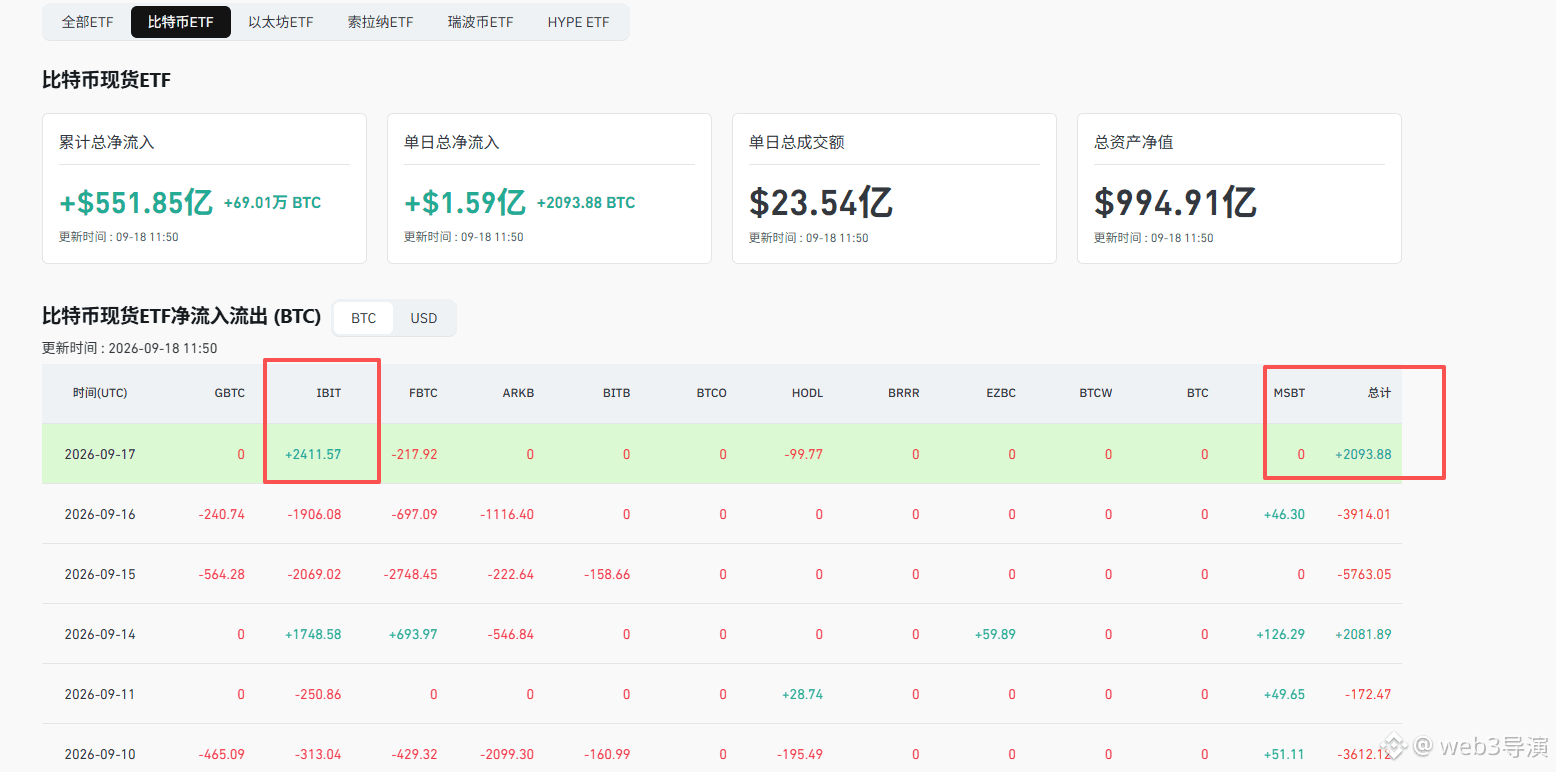
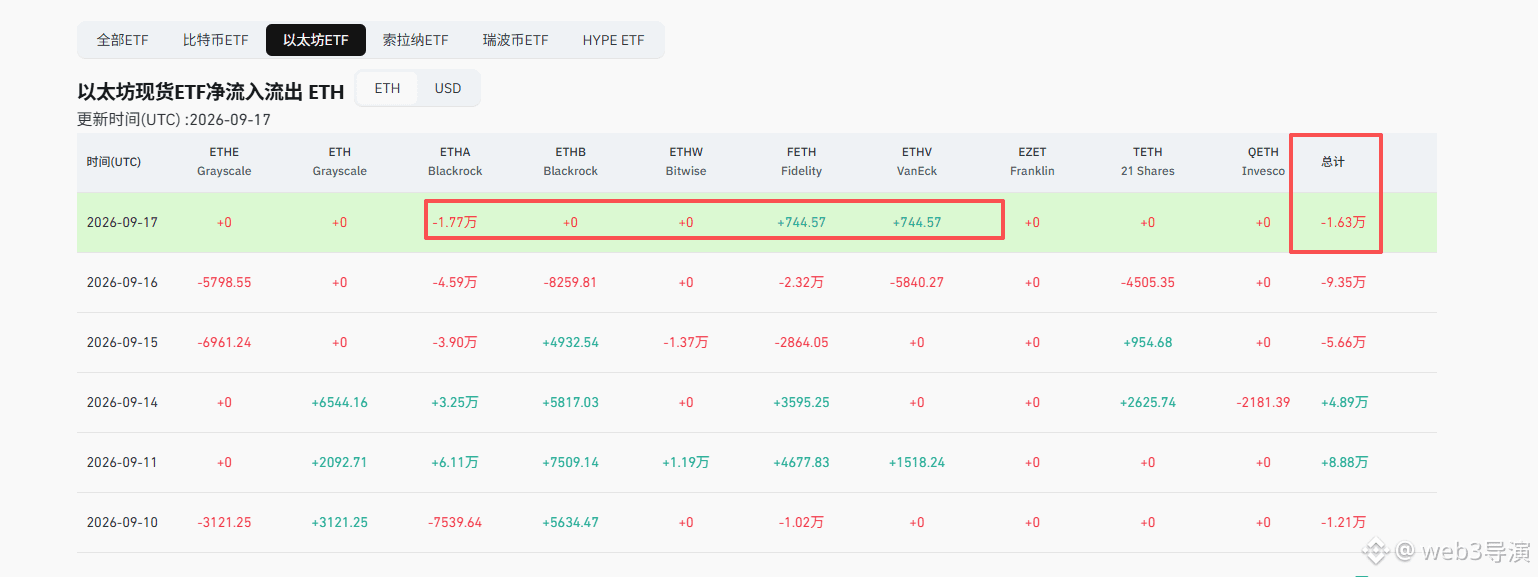
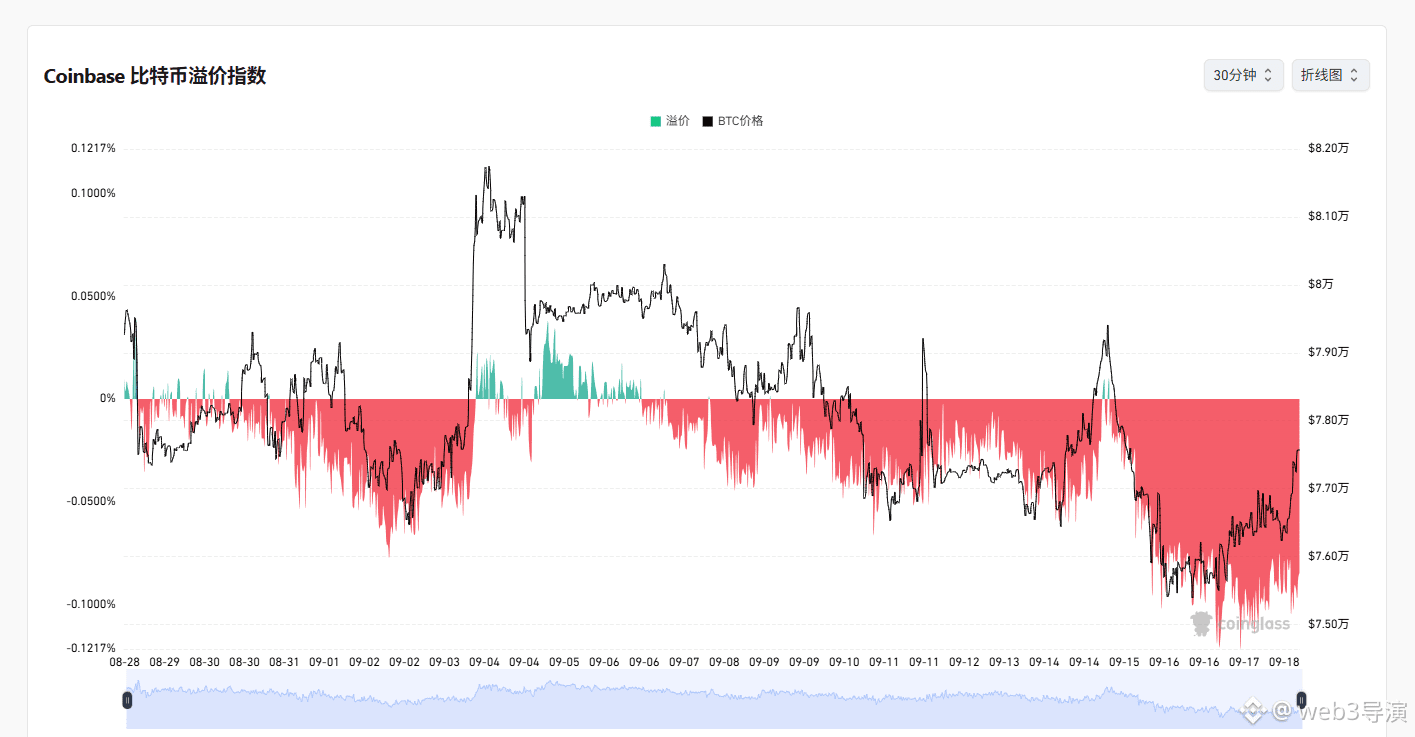
$BTC $ETH Figure 1: Last night, the Bitcoin ETF saw net purchases of about 2,000 units. BlackRock is the main buying force. Figure 2: Last night, the Ethereum ETF saw net selling of more than 10,000 units. The volume isn’t very large. Figure 3: U.S. institutions are still distributing. Figure 4: The order book shows that the buy orders at the lower level are getting thicker. This week’s big bearish news has piled up, but the price still hasn’t dropped. It seems many are waiting to pick up low-priced chips. Since the bearish factors haven’t pushed the market down, the most likely outcome is continued consolidation because the buy-side data hasn’t moved upward.
$BTC $ETH Figure 1: Last night, the Bitcoin ETF saw net purchases of about 2,000 units. BlackRock is the main buying force. Figure 2: Last night, the Ethereum ETF saw net selling of more than 10,000 units. The volume isn’t very large. Figure 3: U.S. institutions are still distributing. Figure 4: The order book shows that the buy orders at the lower level are getting thicker. This week’s big bearish news has piled up, but the price still hasn’t dropped. It seems many are waiting to pick up low-priced chips. Since the bearish factors haven’t pushed the market down, the most likely outcome is continued consolidation because the buy-side data hasn’t moved upward.
5
764
·
--
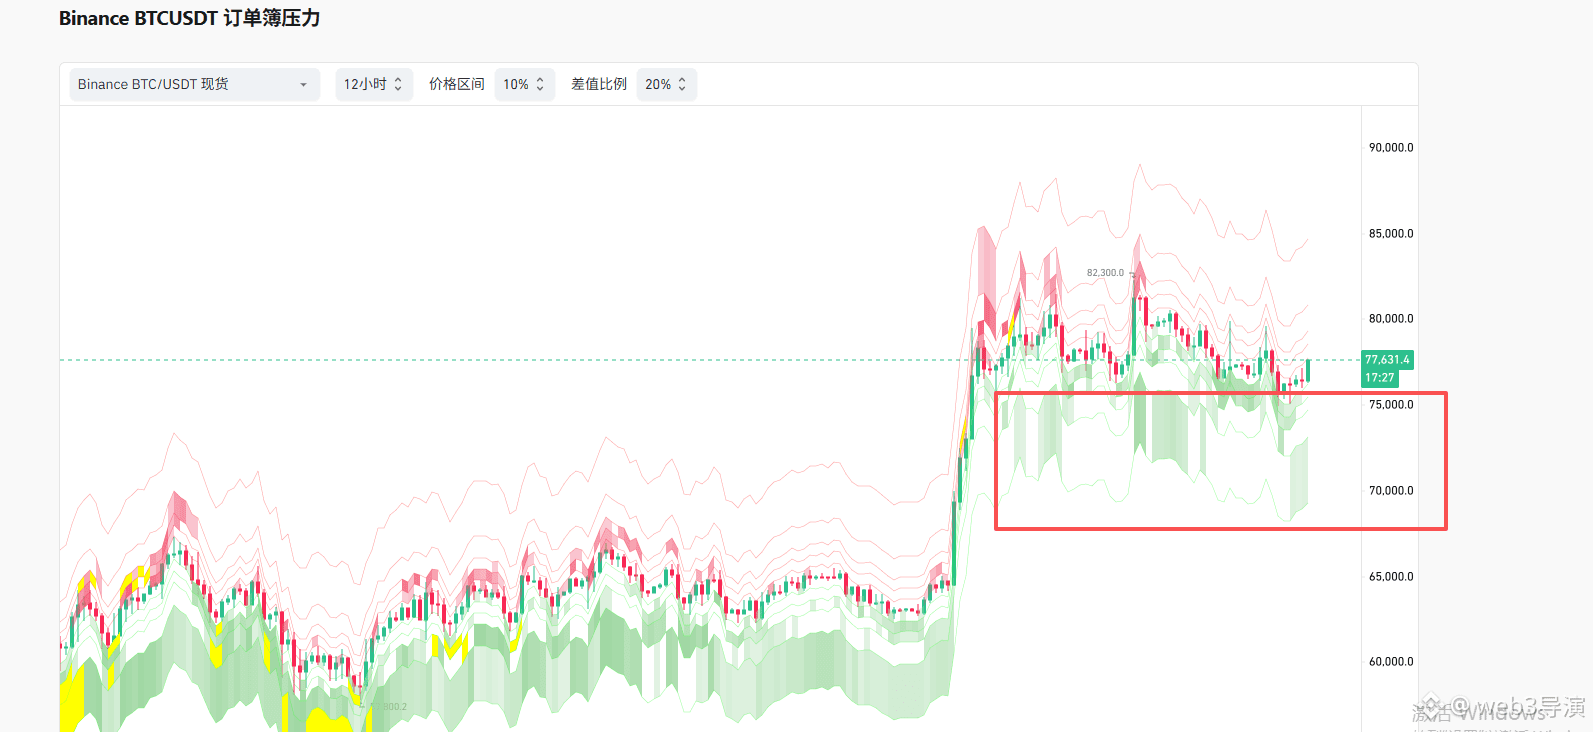
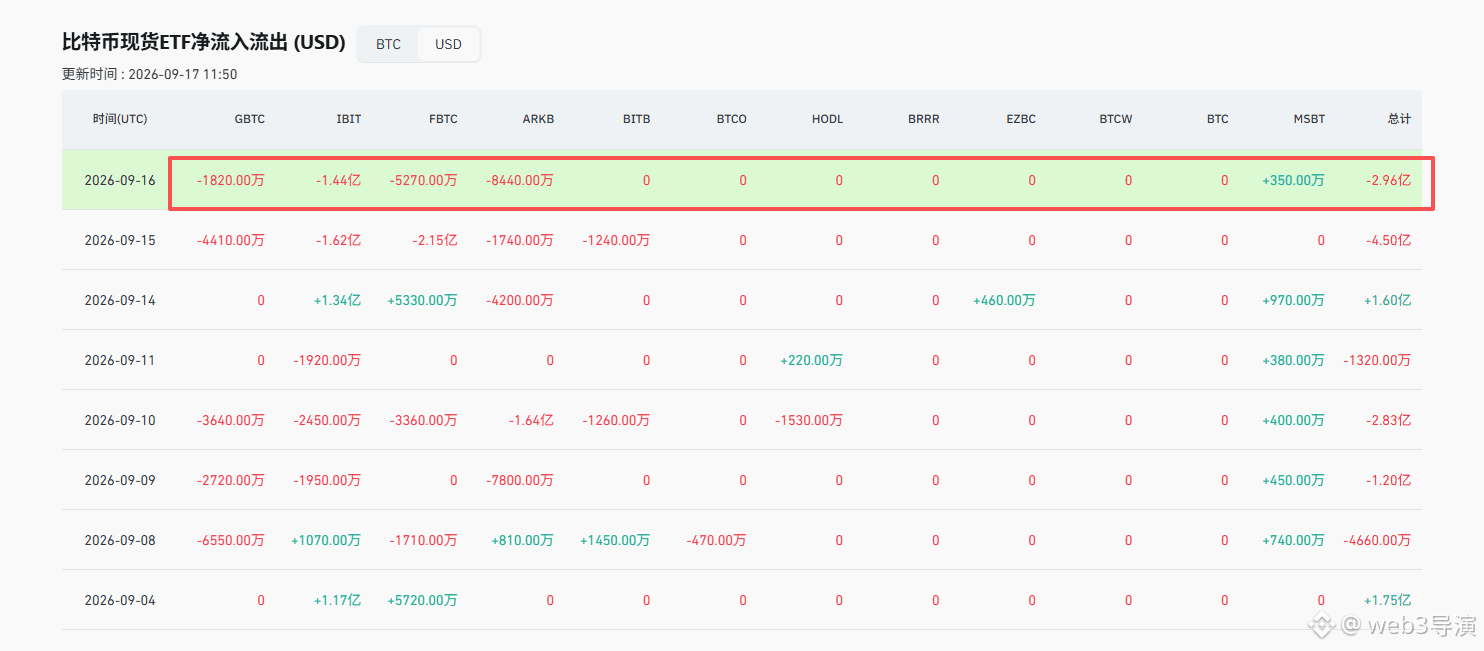
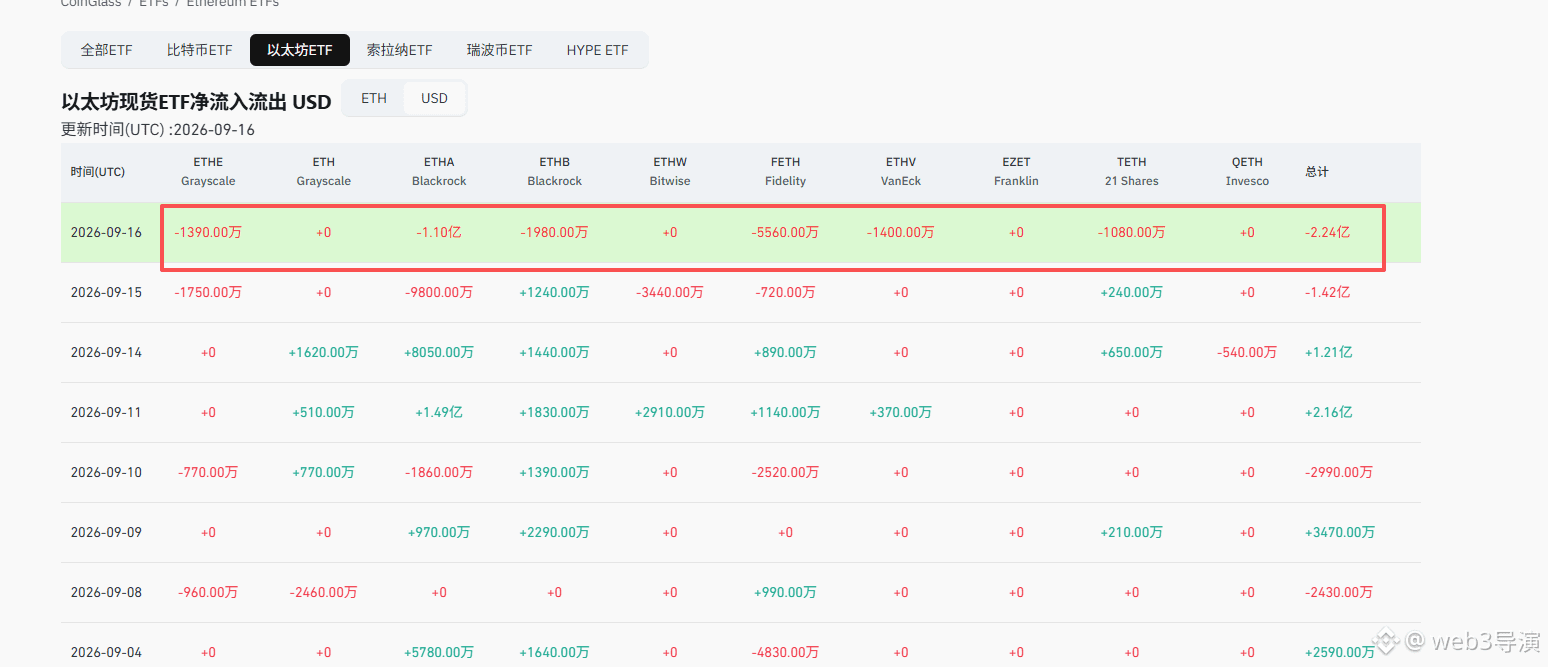
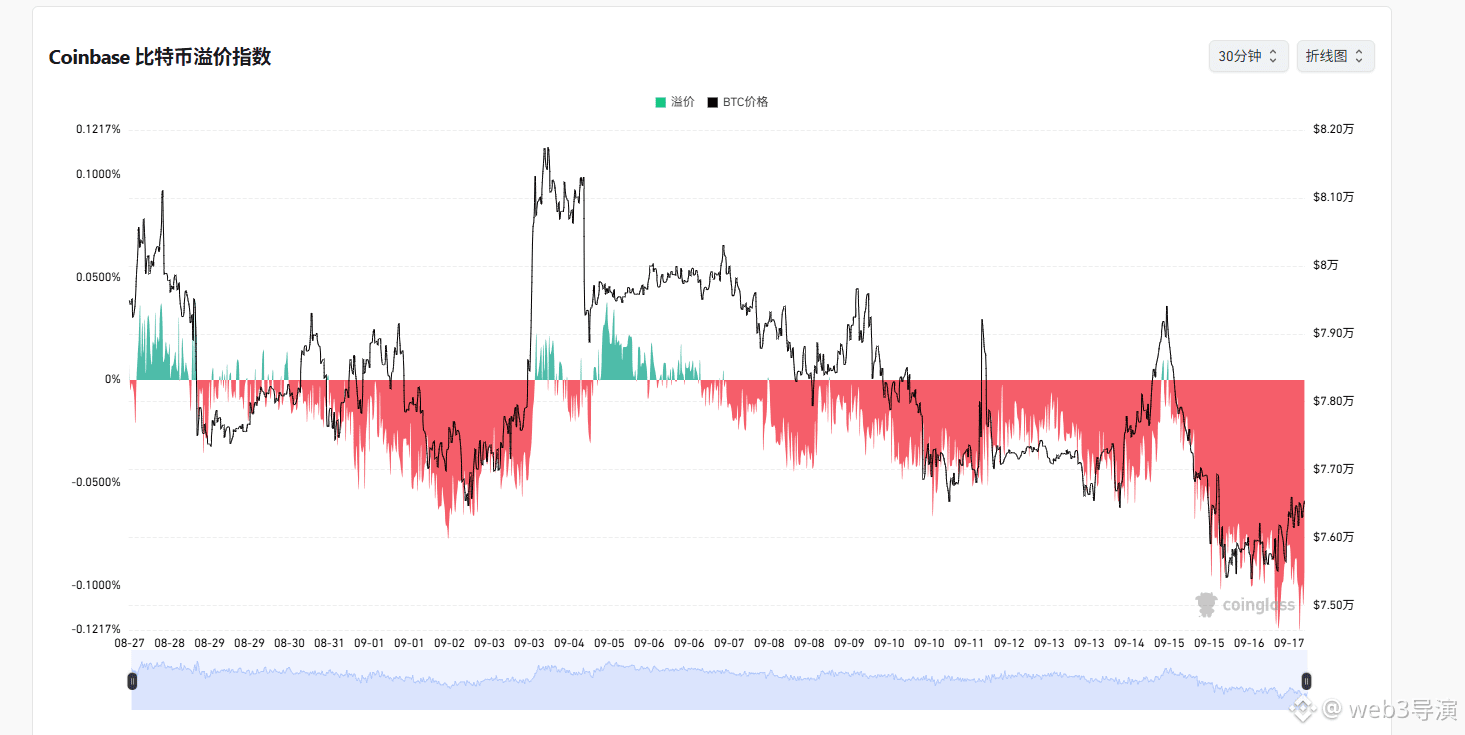
$BTC Figure 1, last night Bitcoin ETF outflows were about 300 million. Figure 2: last night Ethereum ETF outflows were 224 million. The outflow amounts are quite large across the board. Figure 3: it looks like US institutions are accelerating their outflows. Figure 4: on the order book, it shows there are buy orders below, but they are very weak; there are very few sell orders above. However, both sides—buyers and sellers—are weak. In the past couple of days, one is that the bill didn’t pass, and the other is the Federal Reserve raising rates—under this double negative, the market still hasn’t dropped. Many people think it won’t go down. Based on my past experience, don’t look only at what’s happening right now—at the very least, wait for a week. Only if it hasn’t dropped can you say the negative news has been priced in. Let the bullets fly.
$BTC Figure 1, last night Bitcoin ETF outflows were about 300 million. Figure 2: last night Ethereum ETF outflows were 224 million. The outflow amounts are quite large across the board. Figure 3: it looks like US institutions are accelerating their outflows. Figure 4: on the order book, it shows there are buy orders below, but they are very weak; there are very few sell orders above. However, both sides—buyers and sellers—are weak. In the past couple of days, one is that the bill didn’t pass, and the other is the Federal Reserve raising rates—under this double negative, the market still hasn’t dropped. Many people think it won’t go down. Based on my past experience, don’t look only at what’s happening right now—at the very least, wait for a week. Only if it hasn’t dropped can you say the negative news has been priced in. Let the bullets fly.
2
4
2.4k
·
--
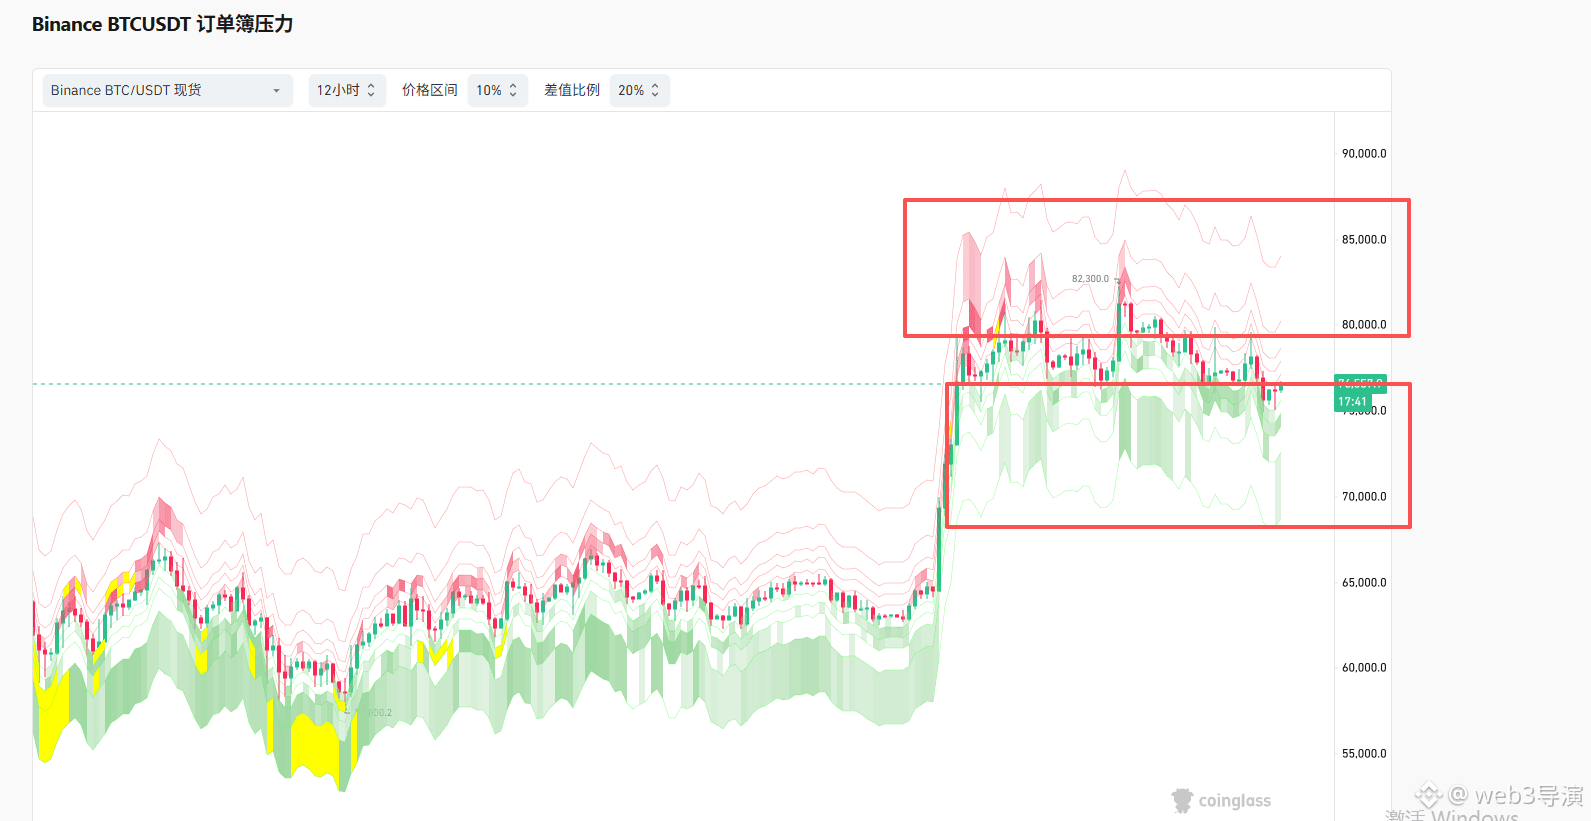
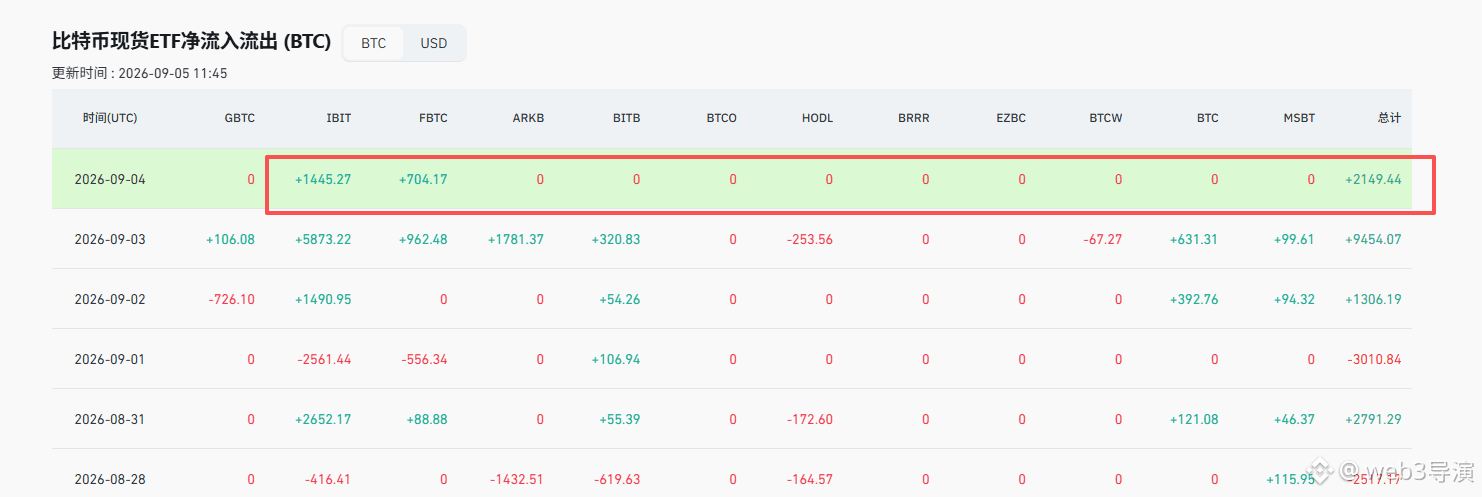
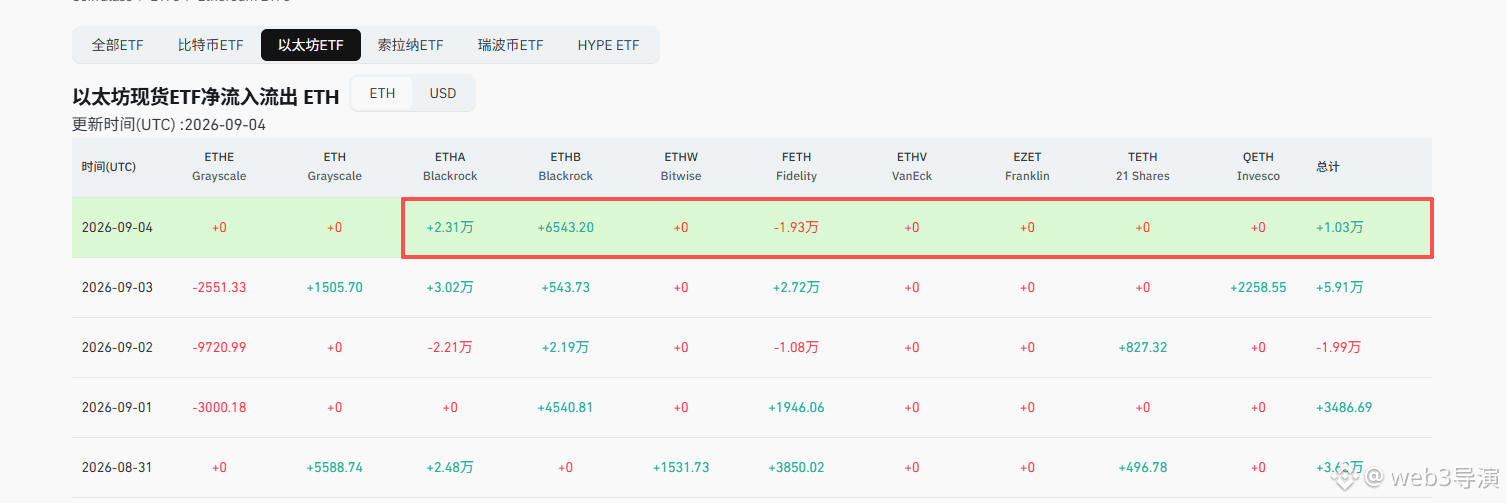
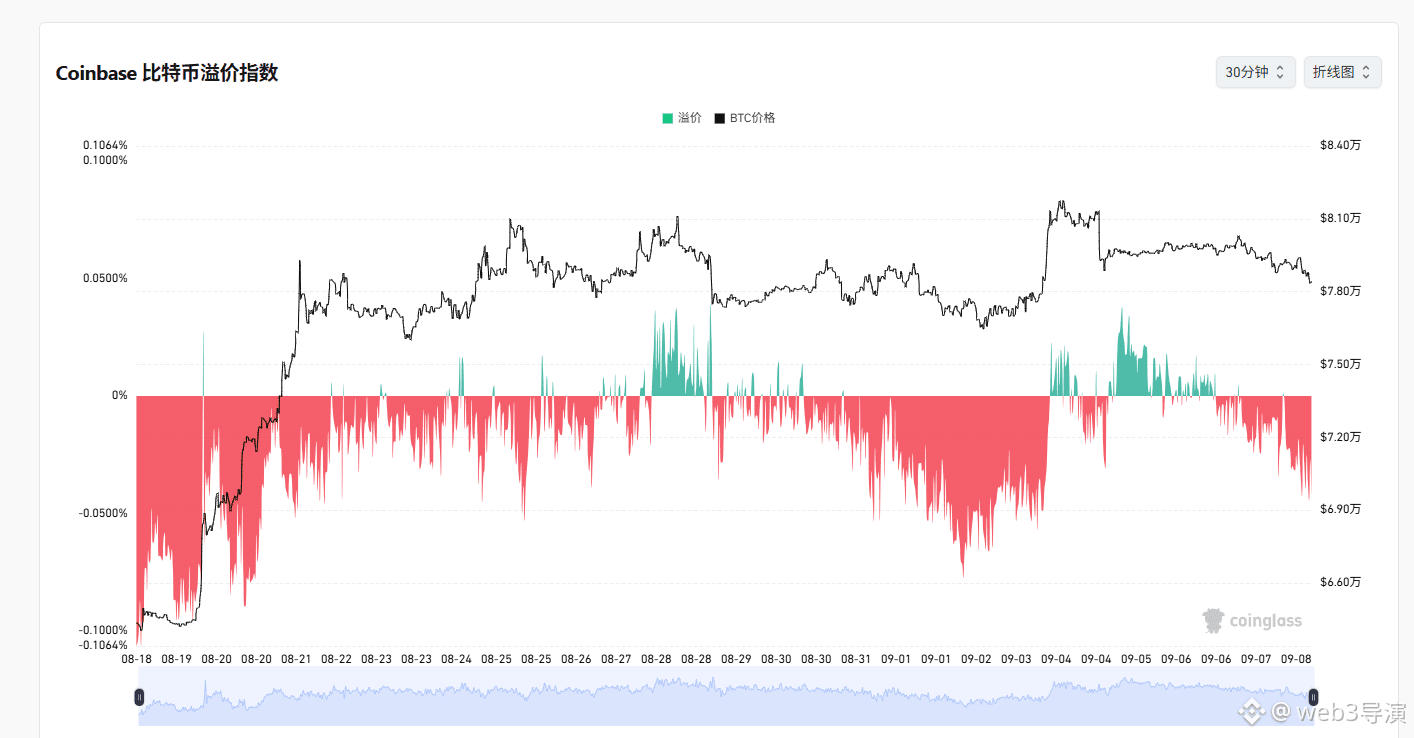
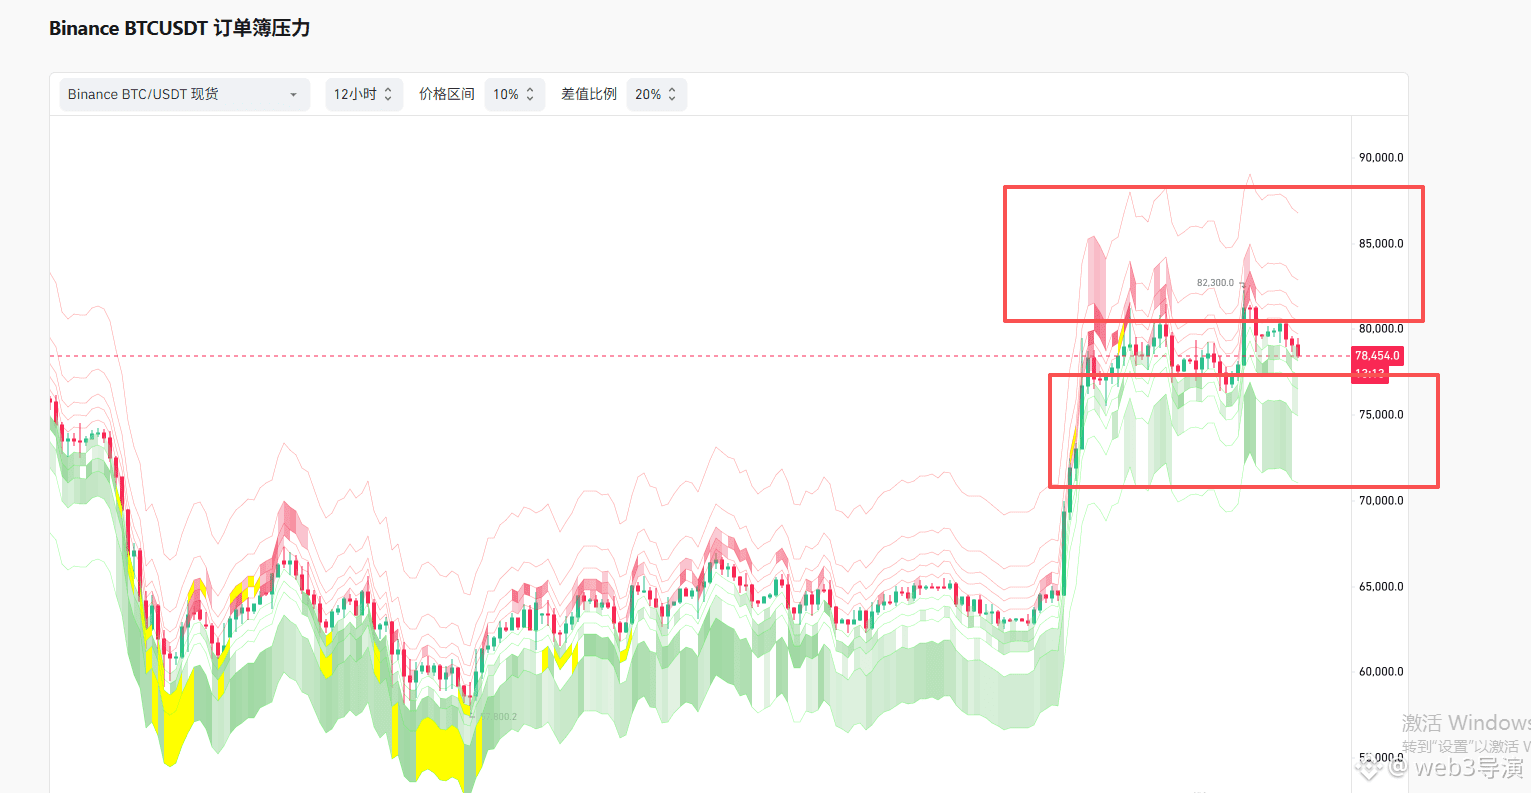
$BTC Figure 1: Last night the Bitcoin ETF net bought around 2,000 units. Figure 2: Last night the Ethereum ETF net bought around 10,000 units, which is relatively fewer. Figure 3: Last night US institutions were still net selling out. Figure 4: The order book shows that buy and sell limit orders remain fairly balanced; long orders are only slightly thicker. Most likely, it will continue to trade sideways (range-bound).
$BTC Figure 1: Last night the Bitcoin ETF net bought around 2,000 units. Figure 2: Last night the Ethereum ETF net bought around 10,000 units, which is relatively fewer. Figure 3: Last night US institutions were still net selling out. Figure 4: The order book shows that buy and sell limit orders remain fairly balanced; long orders are only slightly thicker. Most likely, it will continue to trade sideways (range-bound).
2
465
·
--
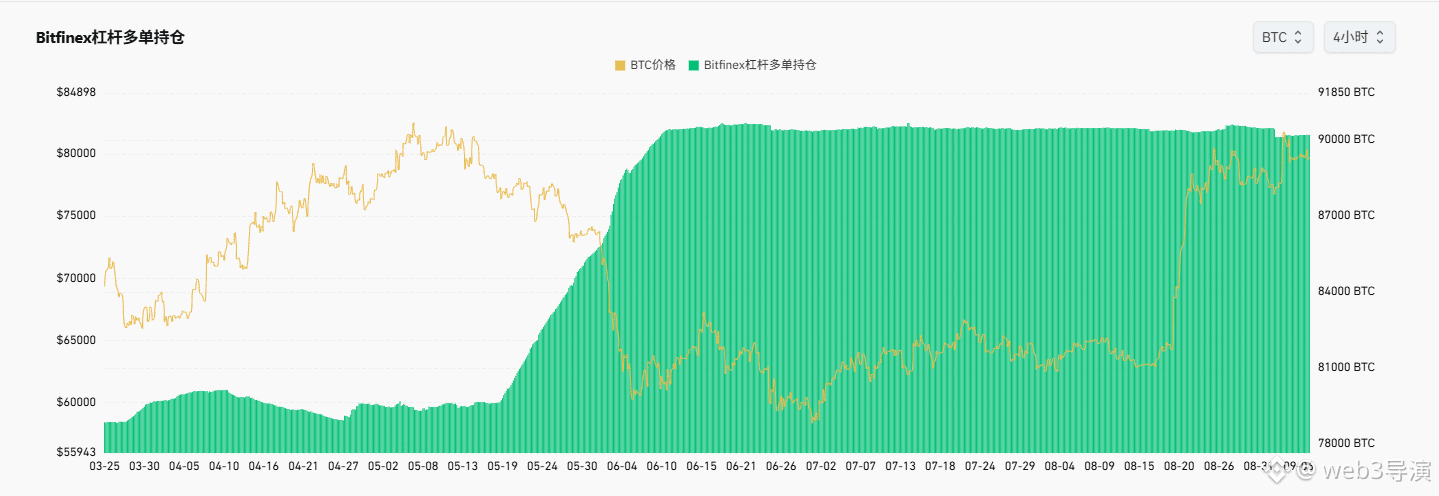
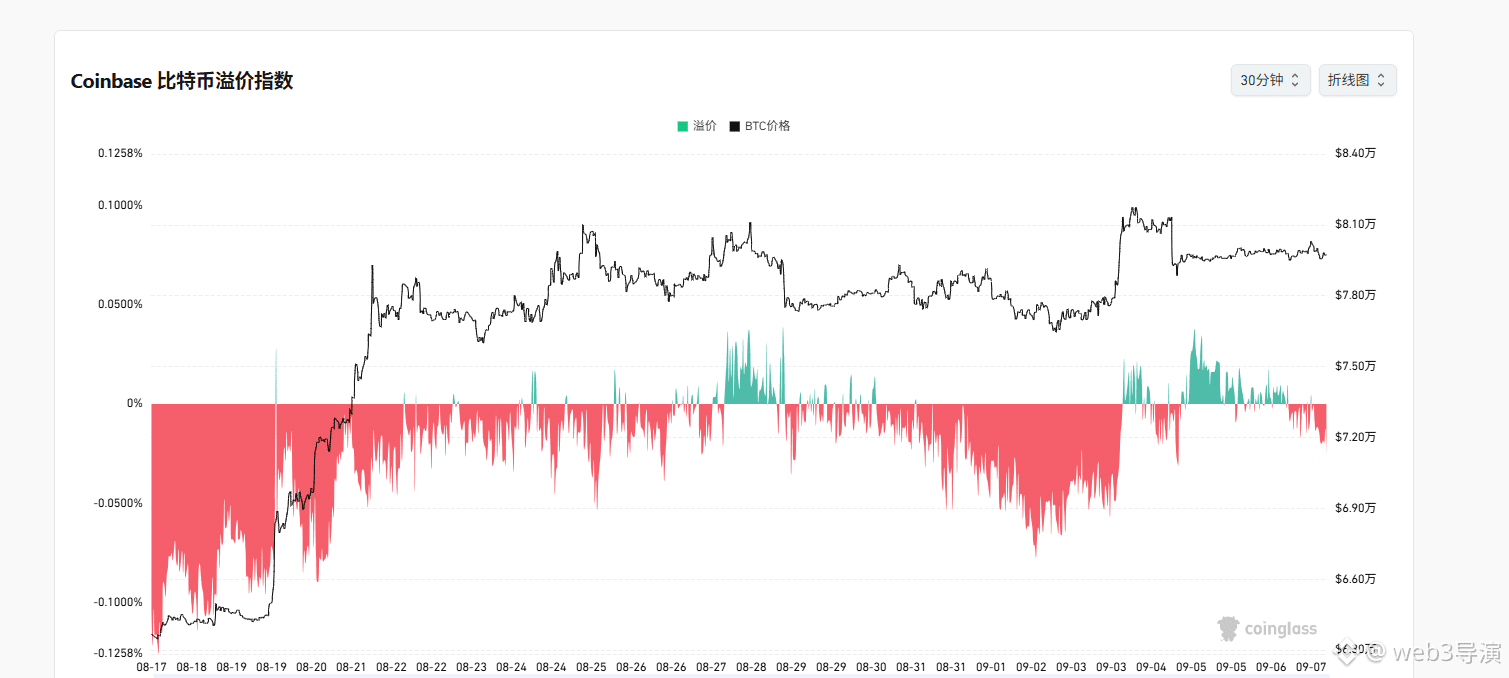
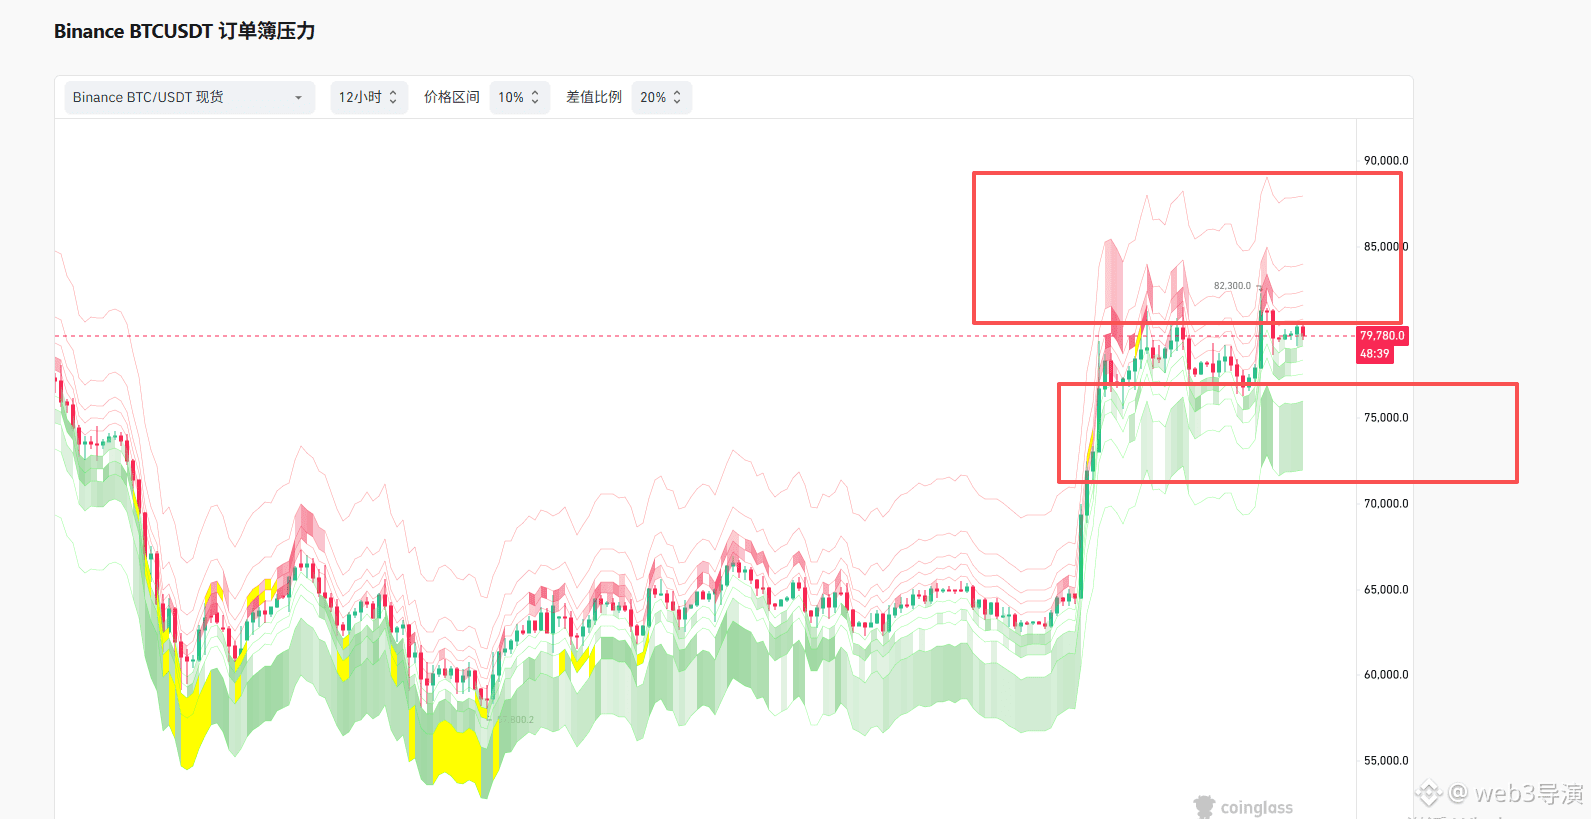
$BTC Figure 1, the institution-bought 90,000 big pies has not moved yet; Figure 2, U.S. institutions are still selling only a small amount for now; Figure 3, the order book shows that long and short orders are about the same, continuing to fluctuate
$BTC Figure 1, the institution-bought 90,000 big pies has not moved yet; Figure 2, U.S. institutions are still selling only a small amount for now; Figure 3, the order book shows that long and short orders are about the same, continuing to fluctuate
2
469
·
--
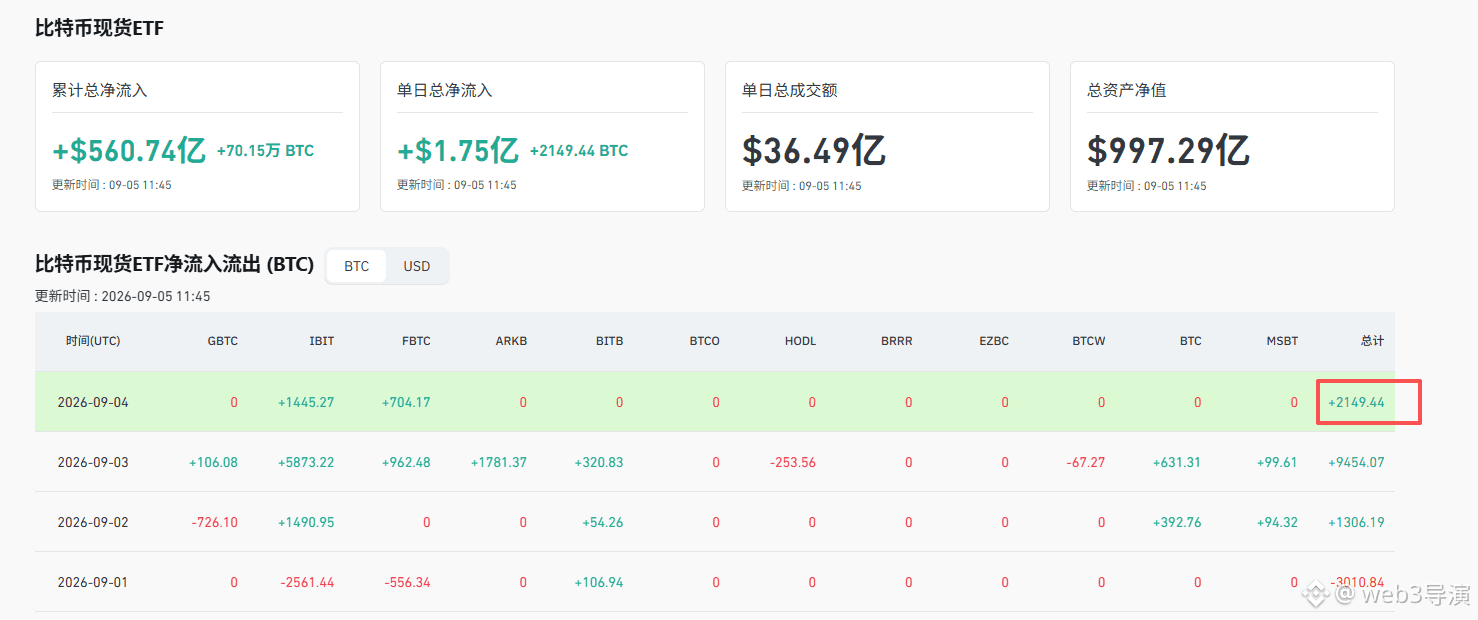
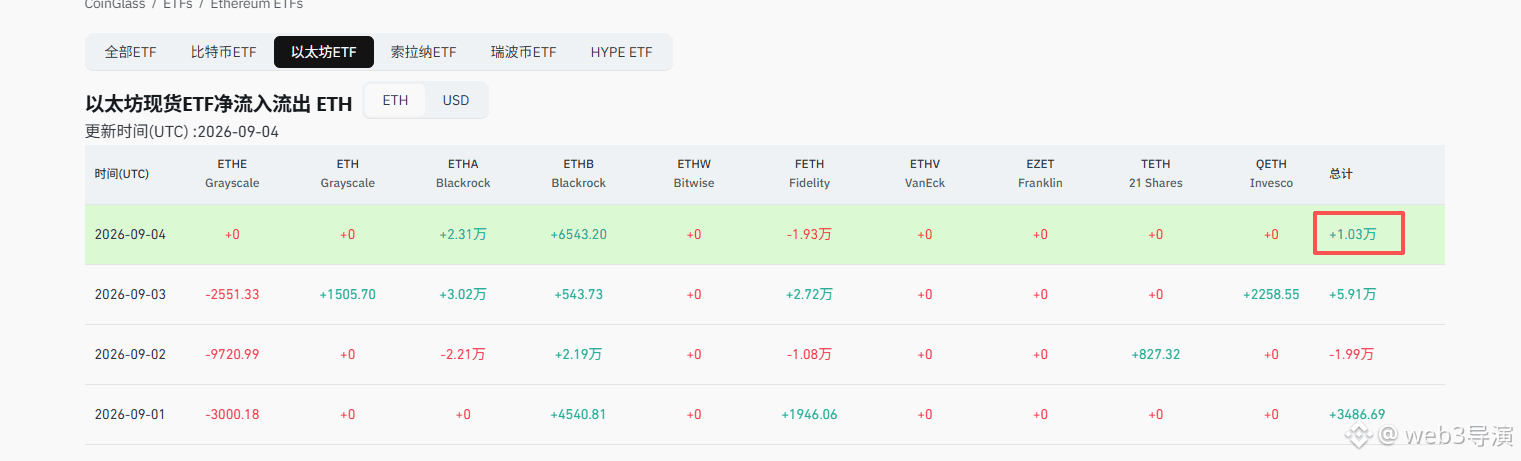
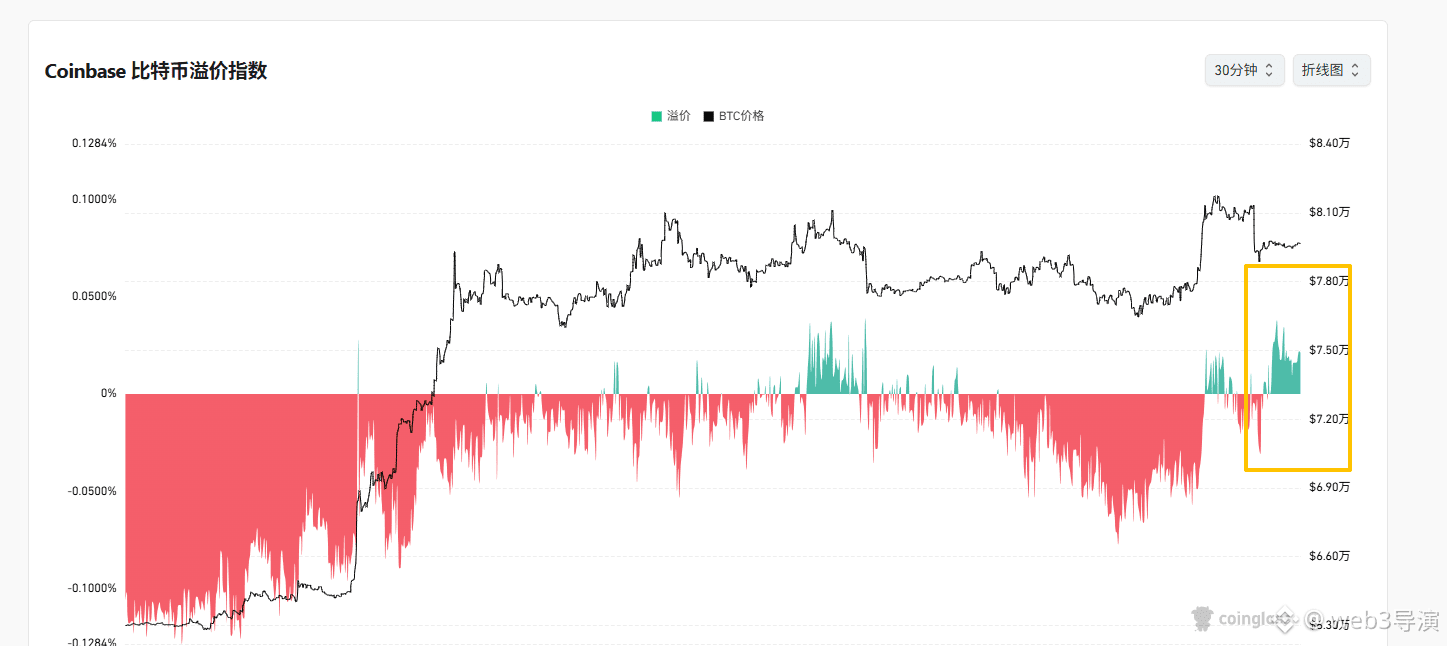
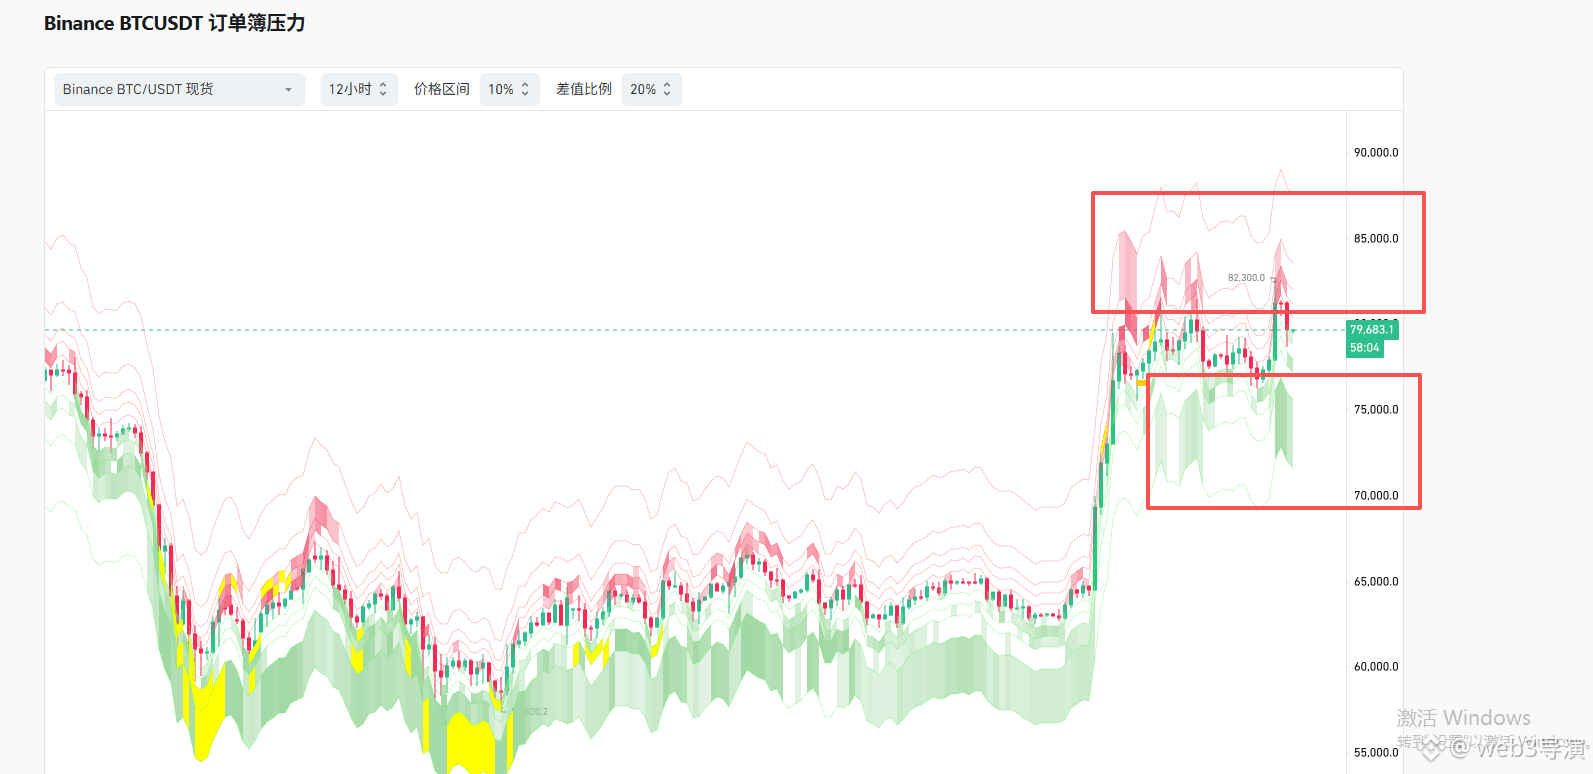
$BTC $ETH Figure 1: Last night Bitcoin ETF had a net buy of about 2,000, which is a bit small. Figure 2: Ethereum ETF had a net buy of 10,000 last night, a slight buy. Figure 3: U.S. institutions have started to see net inflows, which is a good thing; hope it can continue. Figure 4: The order book shows buy and sell orders are about the same, so it will likely still fluctuate.
$BTC $ETH Figure 1: Last night Bitcoin ETF had a net buy of about 2,000, which is a bit small. Figure 2: Ethereum ETF had a net buy of 10,000 last night, a slight buy. Figure 3: U.S. institutions have started to see net inflows, which is a good thing; hope it can continue. Figure 4: The order book shows buy and sell orders are about the same, so it will likely still fluctuate.
1
579
·
--
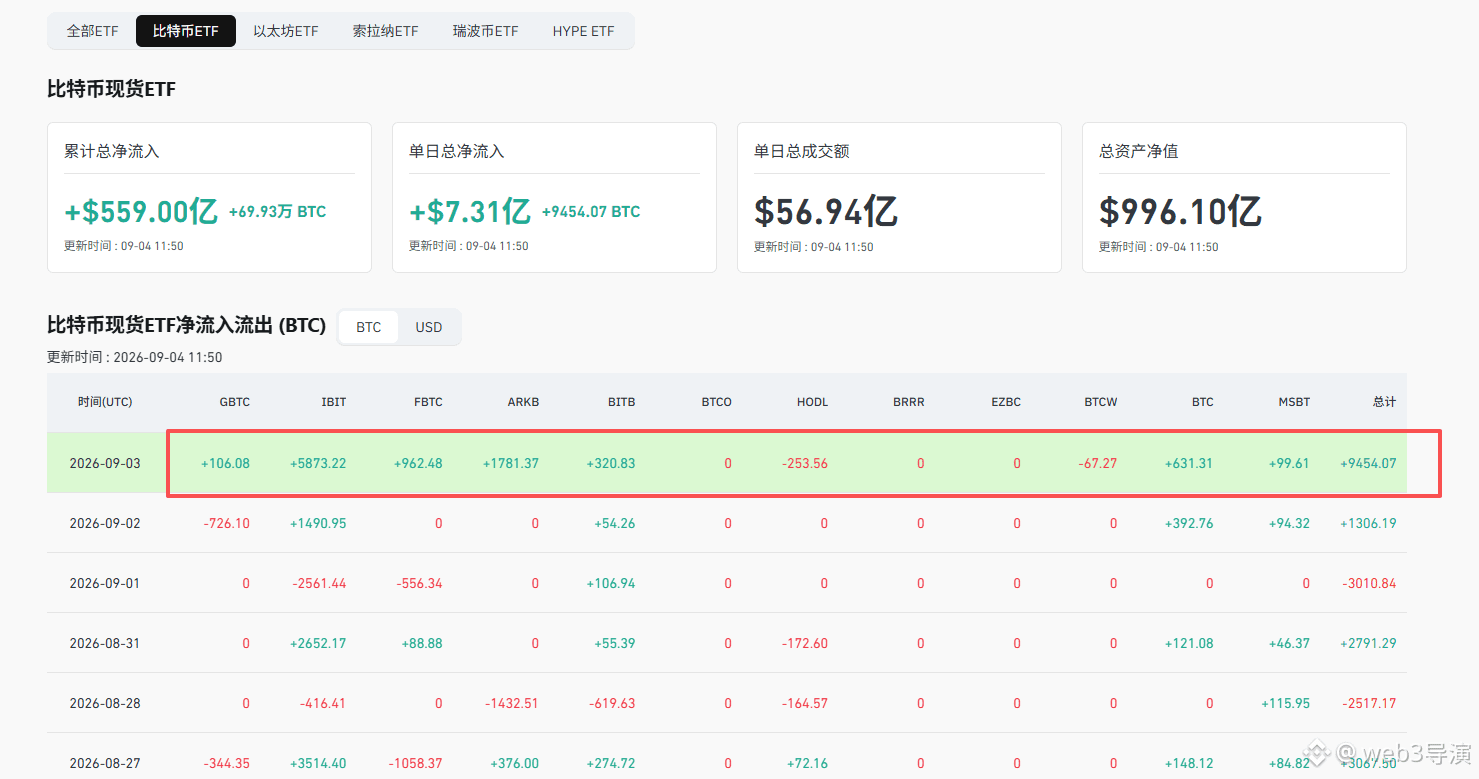
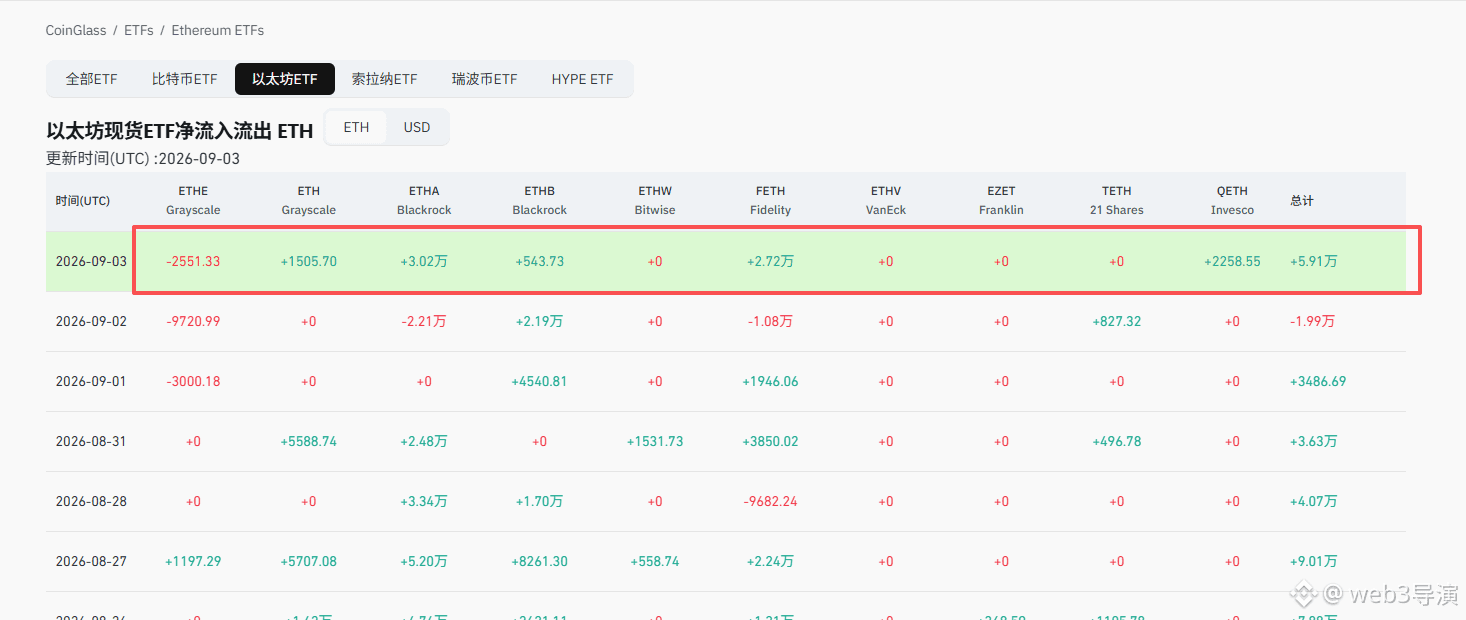
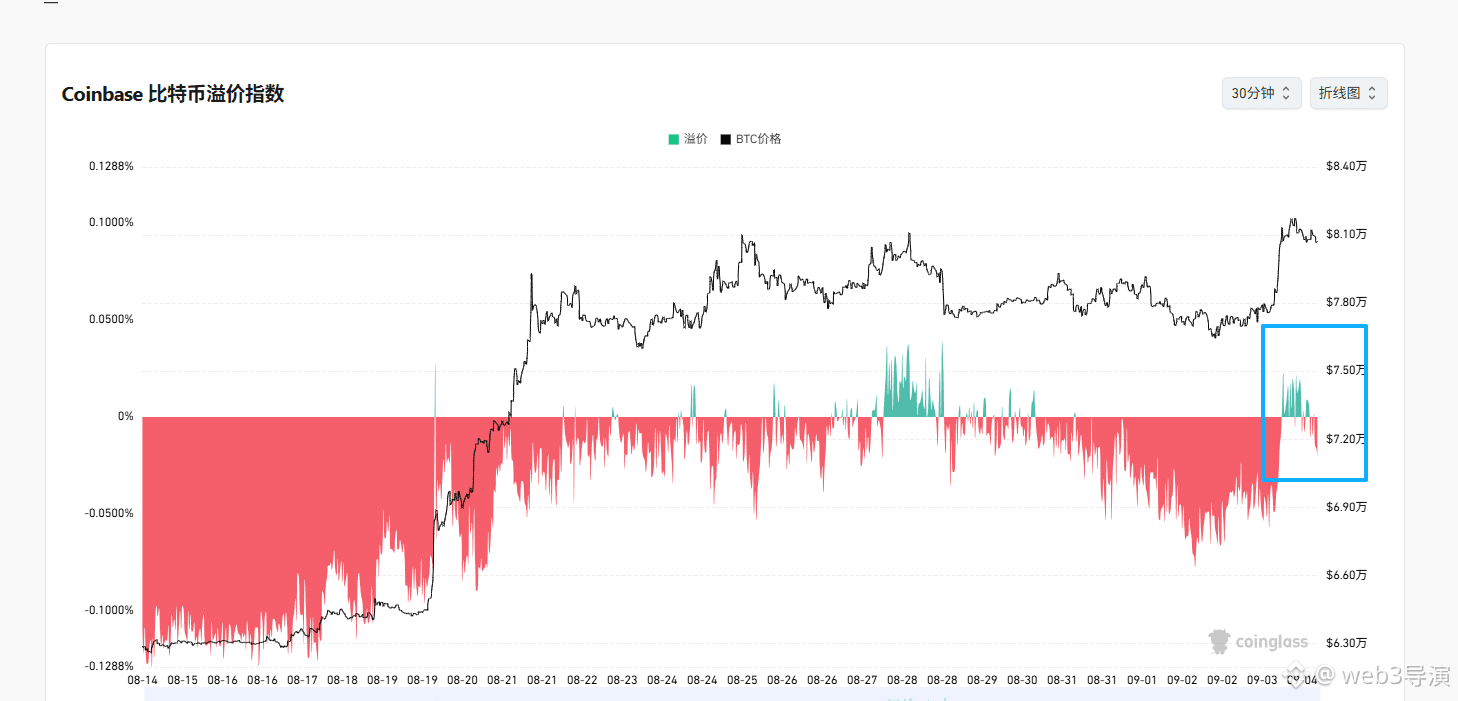
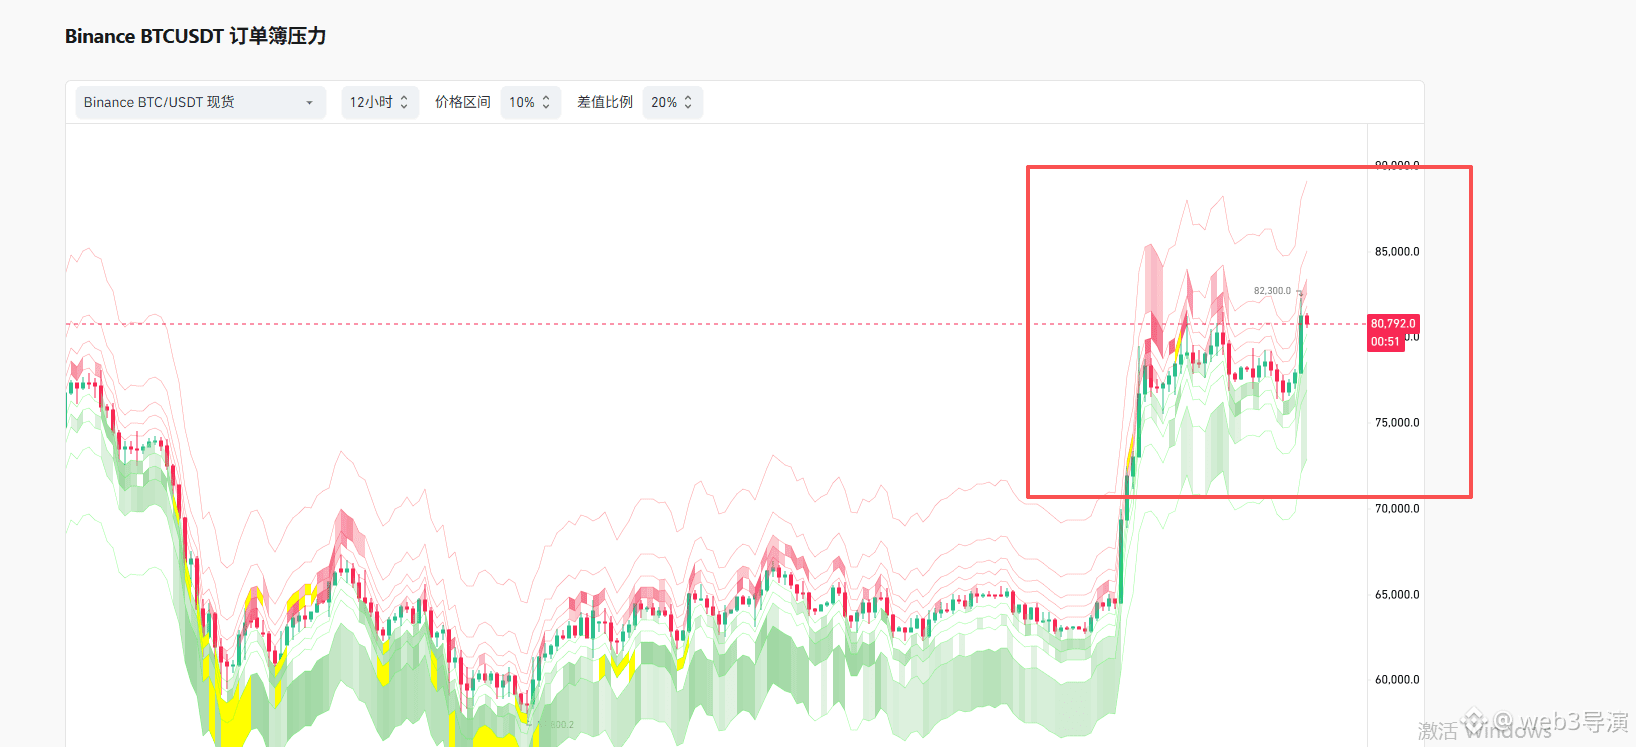
$BTC Figure 1: Last night, the Bitcoin ETF net bought more than 9,000, almost 10,000—big moves. No wonder it surged so fast. Figure 2: Last night, the Ethereum ETF net bought 59,000—fortunately, that’s a decent amount. Figure 3: U.S. institutions’ inflows and outflows were relatively balanced. Figure 4: The order book shows buy and sell orders were relatively balanced. As I said the day before yesterday, it will most likely still be range-bound
{spot}(BTCUSDT)
$BTC Figure 1: Last night, the Bitcoin ETF net bought more than 9,000, almost 10,000—big moves. No wonder it surged so fast. Figure 2: Last night, the Ethereum ETF net bought 59,000—fortunately, that’s a decent amount. Figure 3: U.S. institutions’ inflows and outflows were relatively balanced. Figure 4: The order book shows buy and sell orders were relatively balanced. As I said the day before yesterday, it will most likely still be range-bound
2
1
3.8k
·
--
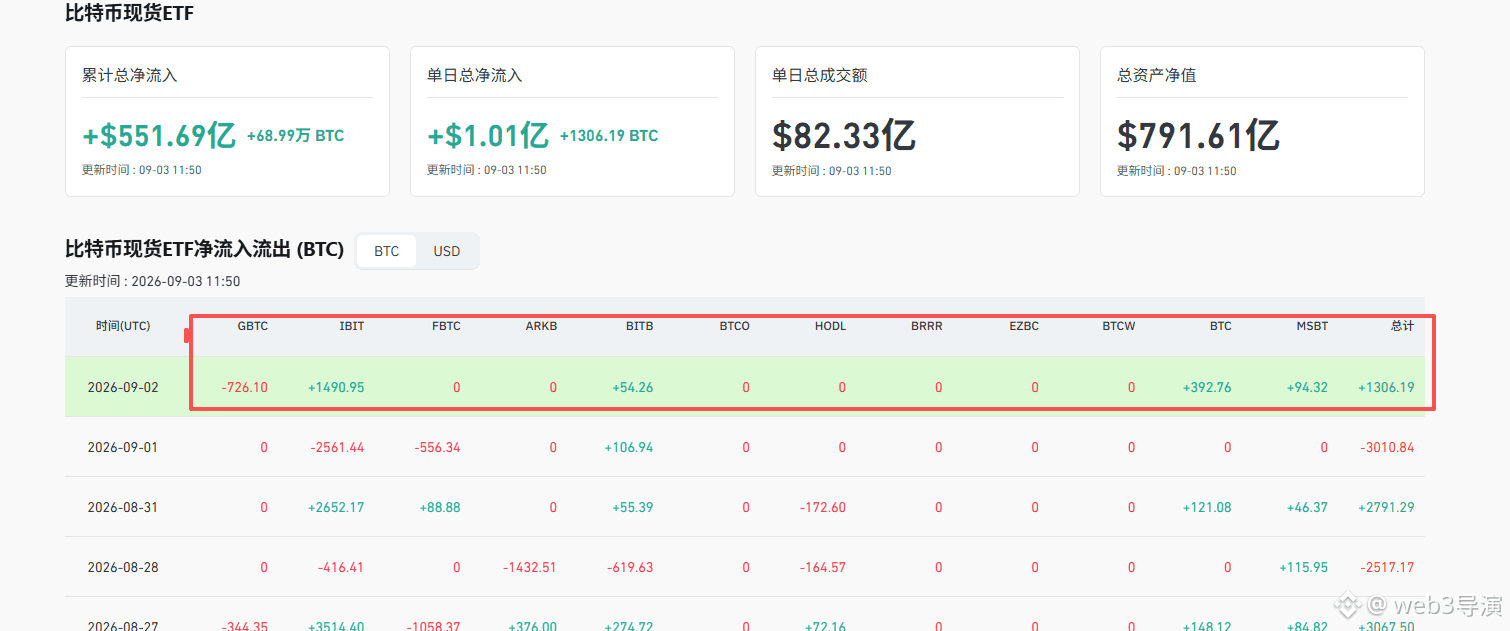
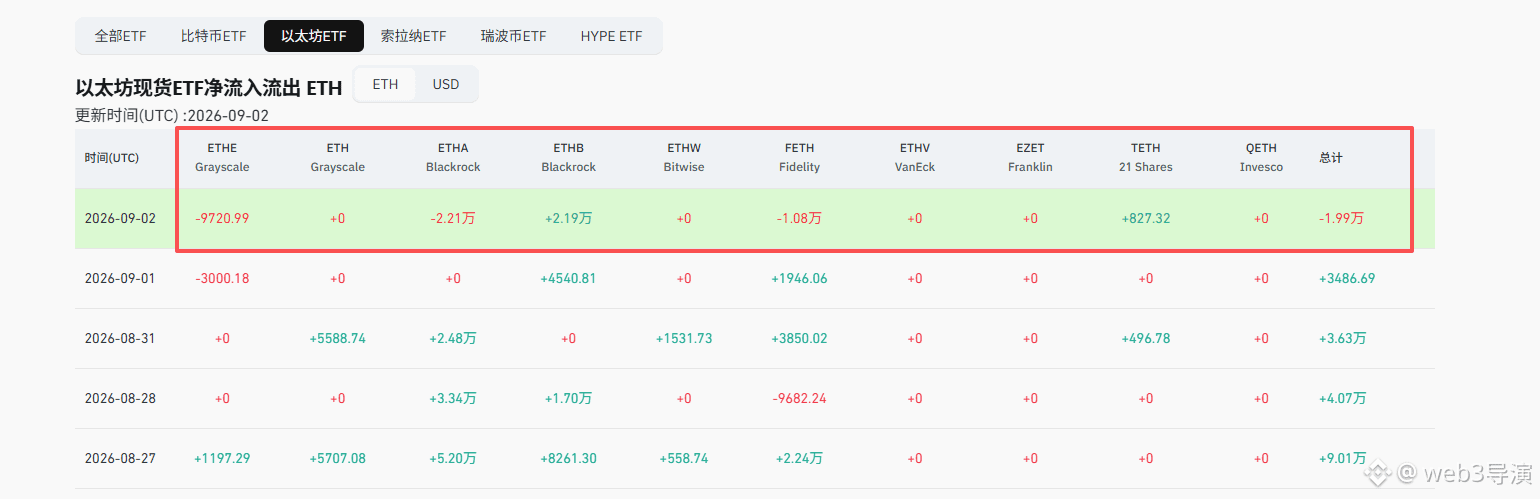
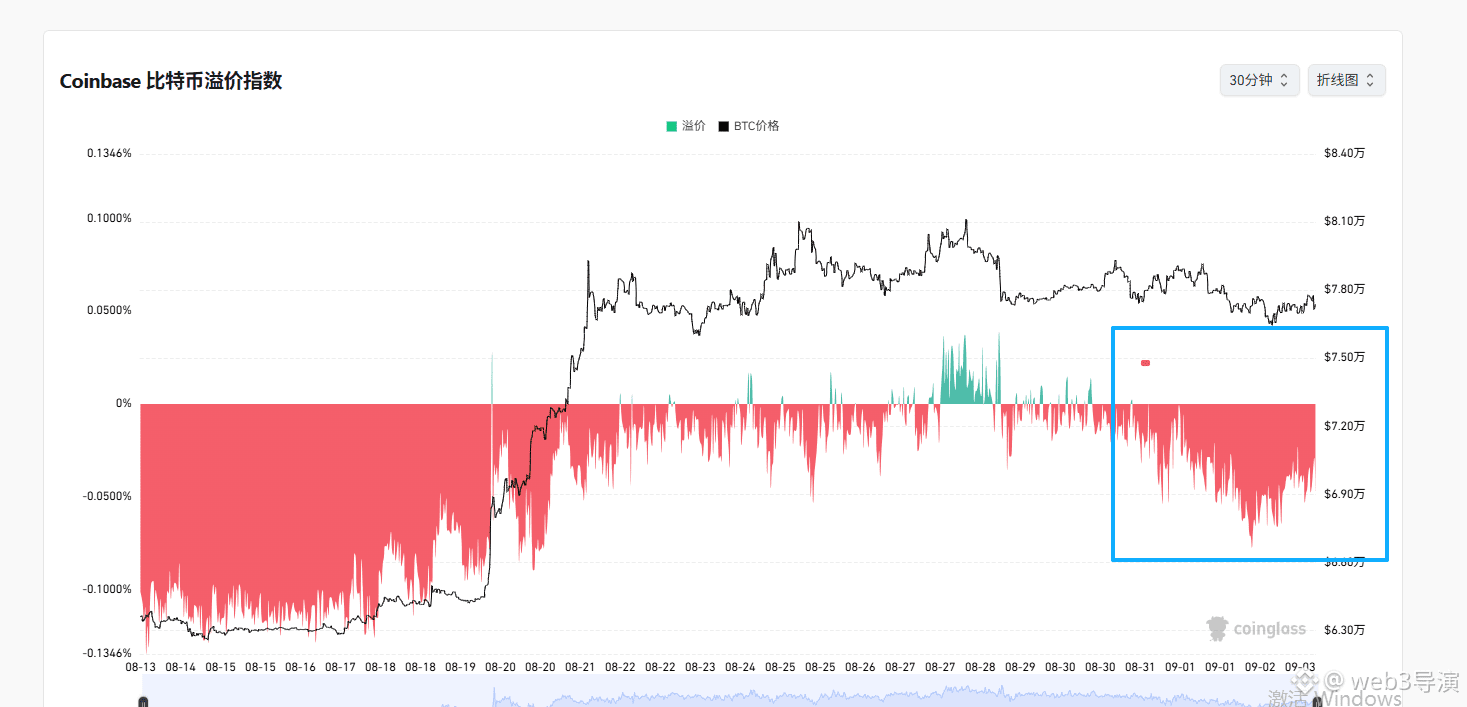
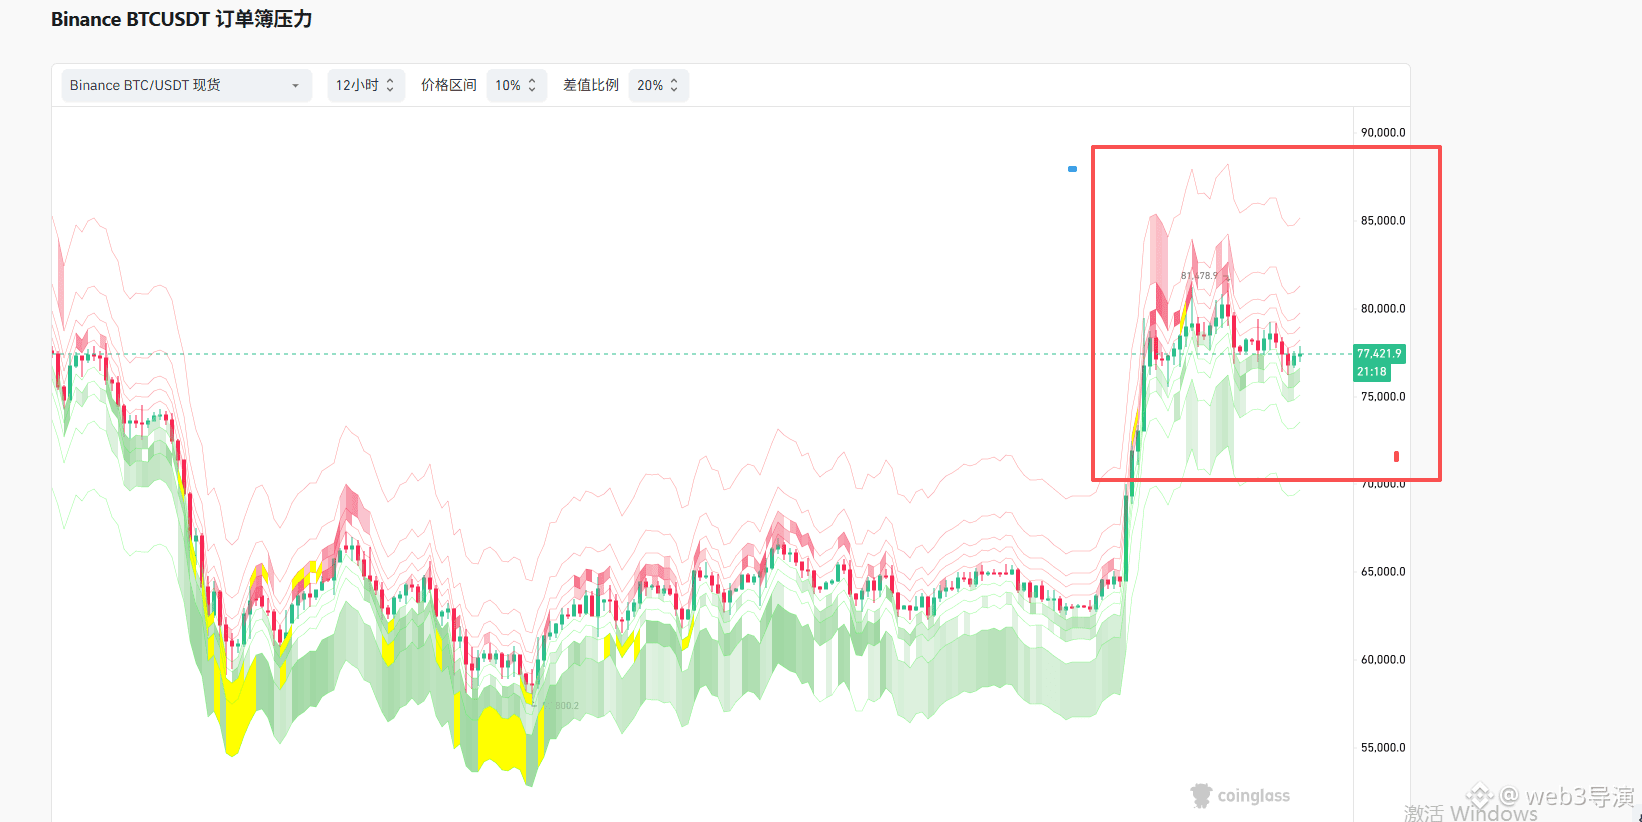
$BTC chart one, Bitcoin ETF net bought about 1,000 last night—kind of a bit low. Chart two: last night the Ethereum ETF net sold roughly 20,000. There’s been some disagreement in fund flows, but it won’t matter much. Chart three: U.S. institutions overall are still in a distribution state, though it seems also only in small amounts. Chart four: order book data hasn’t changed much. Assuming there’s a pullback, judging purely from the order book, support should be around 70,000.
$BTC chart one, Bitcoin ETF net bought about 1,000 last night—kind of a bit low. Chart two: last night the Ethereum ETF net sold roughly 20,000. There’s been some disagreement in fund flows, but it won’t matter much. Chart three: U.S. institutions overall are still in a distribution state, though it seems also only in small amounts. Chart four: order book data hasn’t changed much. Assuming there’s a pullback, judging purely from the order book, support should be around 70,000.
1
1.2k
·
--
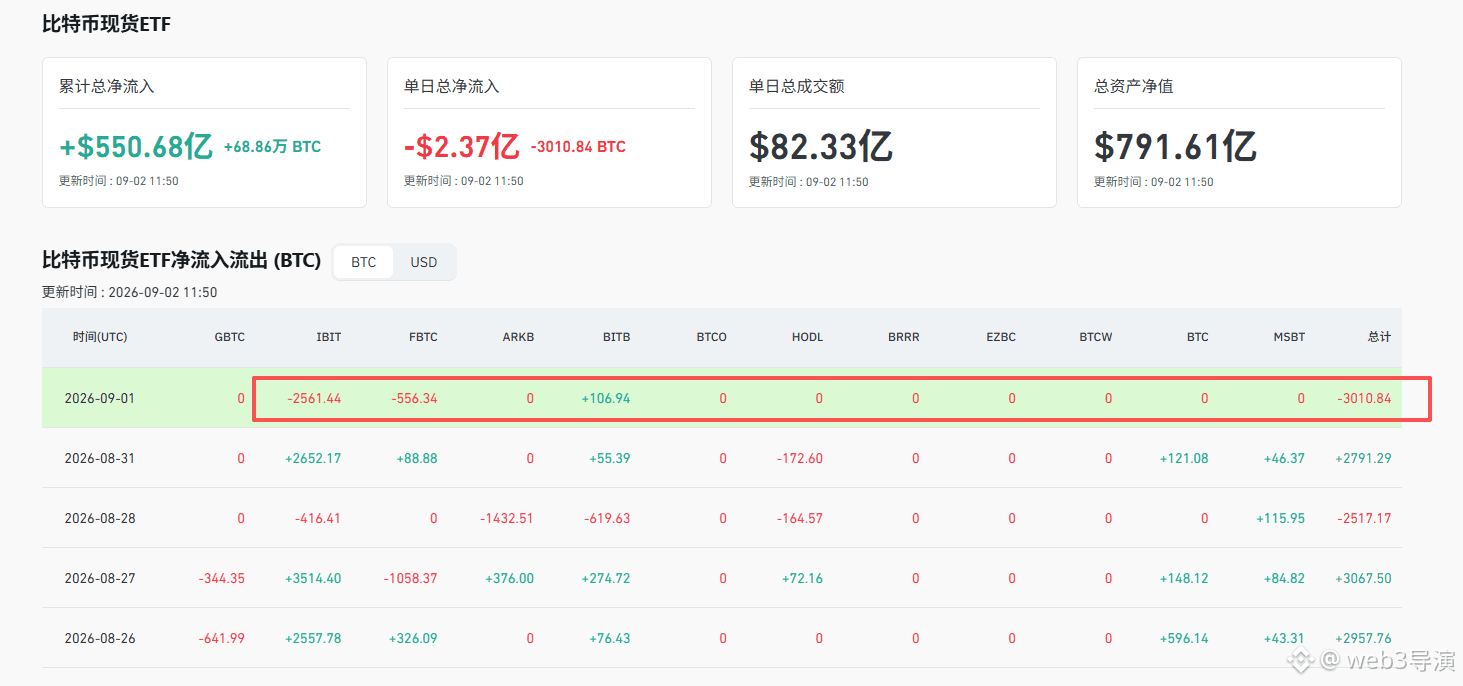
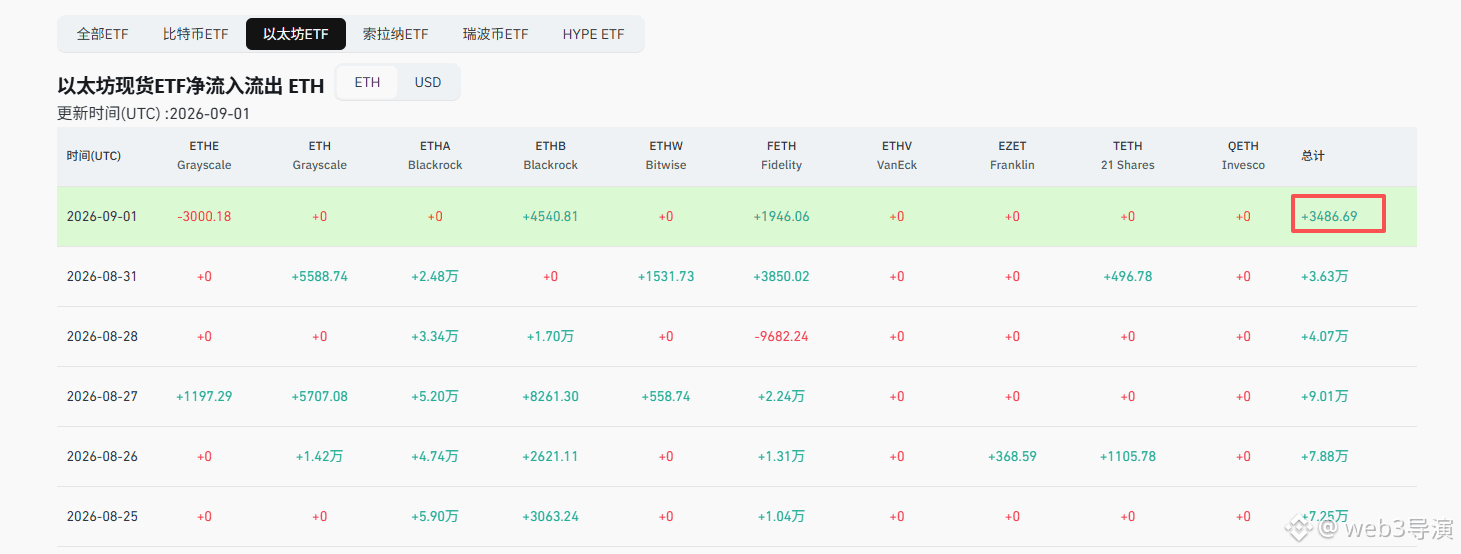
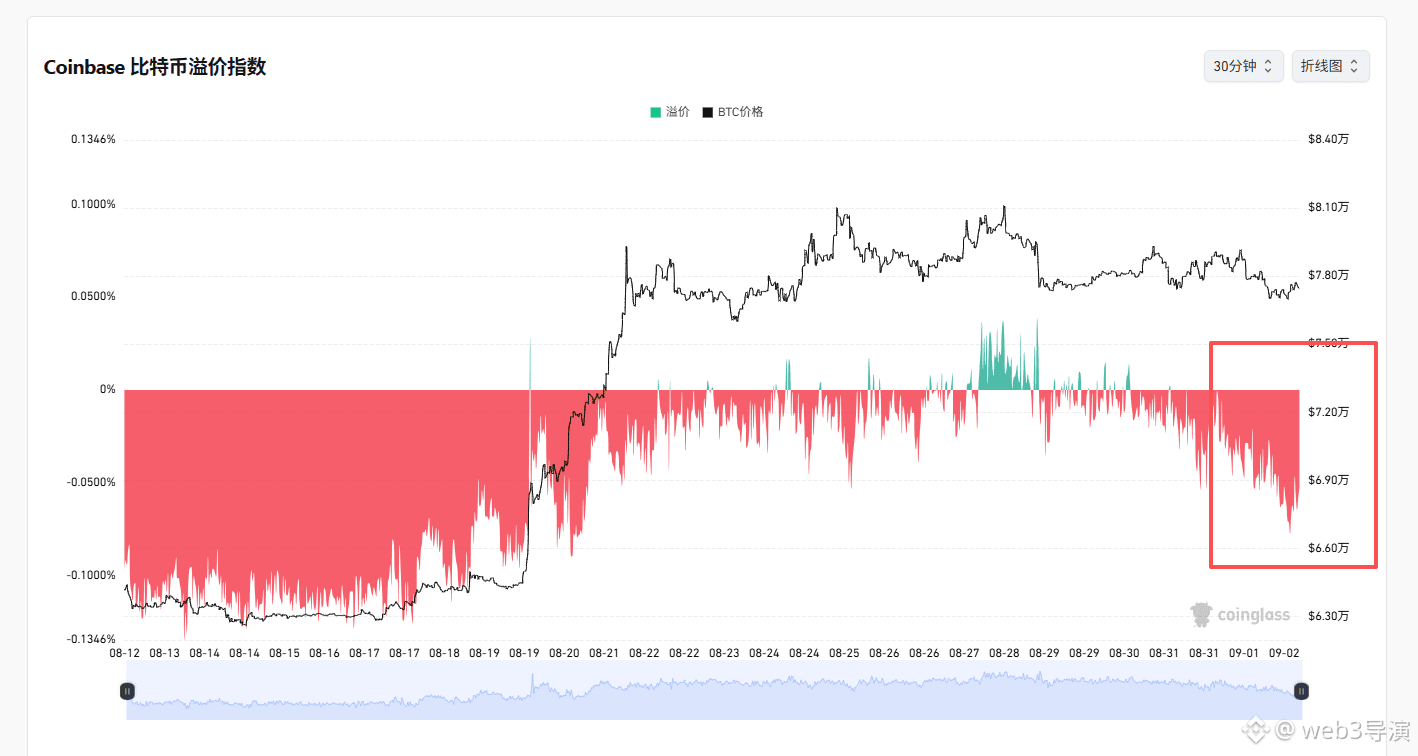
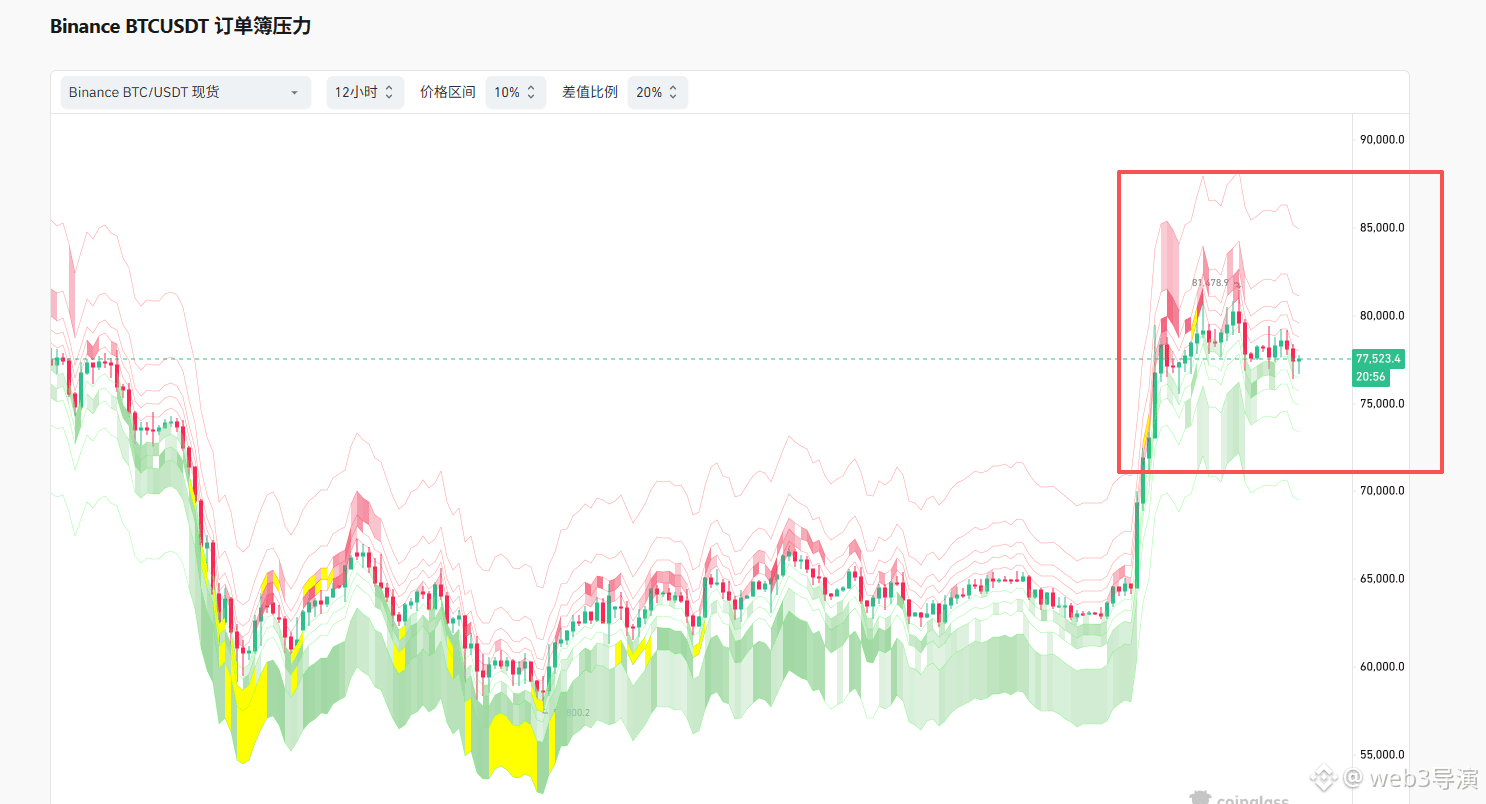
$BTC $ETH Figure 1, last night the Bitcoin ETF sold 3,000 BTC futures; Figure 2, the Ethereum ETF net bought 3,000 ETH; Figure 3, American institutions are dumping again, damn it; Figure 4, the order book shows that this level still needs to keep churning
$BTC $ETH Figure 1, last night the Bitcoin ETF sold 3,000 BTC futures; Figure 2, the Ethereum ETF net bought 3,000 ETH; Figure 3, American institutions are dumping again, damn it; Figure 4, the order book shows that this level still needs to keep churning
2
733
Log in to explore more content
Join global crypto users on Binance Square
⚡️ Get latest and useful information about crypto.
💬 Trusted by the world’s largest crypto exchange.
👍 Discover real insights from verified creators.
Email / Phone number
Trending Topics
US10YearYieldNears5.3%
4,382 views
145 Discussing
#US10YearYieldNears5.3%
The US 10-Year Treasury Yield has broken past the 5.3% threshold, surging to a 24-year high of 5.342% on October 1, 2026. This milestone marks the highest level the global benchmark note has reached since early 2002, surpassing its 2007 pre-financial crisis peak as a brutal global bond sell-off accelerates. [1]
What Is Driving the Spike?
Resilient Economic Growth: Upgraded U.S. GDP estimates (revised up to 2.2% for Q2) indicate the economy is expanding faster than initially anticipated. [1]
Energy-Driven Inflation Concerns: Elevated oil prices and persistent, sticky inflation are continuing to exert upward pressure on long-term rates. [1, 2]
$NEAR , $AAPLB ,$SOL
zoni-11c22
·0 Likes
·44 views
USWeeklyJoblessClaimsFallTo197000
0 views
0 Discussing
BitcoinETFsTake$6.34BillionInQ3
306 views
22 Discussing