

洋小小丶喜欢拉盘
536 Posts

洋小小丶喜欢拉盘
Report
Block User
关注我。分享心得。个人团队。努力发展。做市要谨慎。做一个专业交易员。内心充满恐惧和贪婪。乐观和悲观再到乐观。认知能力。套娃,在市场中盈利,或者做个收获者
Open Trade
High-Frequency Trader
6.2 Years
148 Following
367 Followers
306 Liked
Posts
Portfolio
All
Quotes
Videos
Live
PINNED
·
--

Article
A complete consolidation of market insights and trading ideasA complete consolidation of market insights and trading ideas
Good life, improve yourself. $BNB
Looking at the four hottest sectors—metaverse, NFTs, DeFi, and gaming—at this stage none has outstanding market action. The true dark-horse targets still need patience and waiting.
Only when Bitcoin’s price action turns favorable can the overall market environment warm up, which then creates influence outward. Most people get into this circle because of Bitcoin. No matter how they enter, Bitcoin’s core position in the market is beyond doubt.
You don’t need to overly care about others’ opinions; most ideas will eventually sink without a trace. Self-growth and completing positive improvement are the core focus. At the same time, you should build a mindset of placing orders, understand the importance of order placement to market liquidity, and intentionally refine your own order-placement trading logic.
A complete consolidation of market insights and trading ideas
A complete consolidation of market insights and trading ideas
Good life, improve yourself. $BNB
Looking at the four hottest sectors—metaverse, NFTs, DeFi, and gaming—at this stage none has outstanding market action. The true dark-horse targets still need patience and waiting.
Only when Bitcoin’s price action turns favorable can the overall market environment warm up, which then creates influence outward. Most people get into this circle because of Bitcoin. No matter how they enter, Bitcoin’s core position in the market is beyond doubt.
You don’t need to overly care about others’ opinions; most ideas will eventually sink without a trace. Self-growth and completing positive improvement are the core focus. At the same time, you should build a mindset of placing orders, understand the importance of order placement to market liquidity, and intentionally refine your own order-placement trading logic.
Good life, improve yourself. $BNB
Looking at the four hottest sectors—metaverse, NFTs, DeFi, and gaming—at this stage none has outstanding market action. The true dark-horse targets still need patience and waiting.
Only when Bitcoin’s price action turns favorable can the overall market environment warm up, which then creates influence outward. Most people get into this circle because of Bitcoin. No matter how they enter, Bitcoin’s core position in the market is beyond doubt.
You don’t need to overly care about others’ opinions; most ideas will eventually sink without a trace. Self-growth and completing positive improvement are the core focus. At the same time, you should build a mindset of placing orders, understand the importance of order placement to market liquidity, and intentionally refine your own order-placement trading logic.
2
168
PINNED
·
--
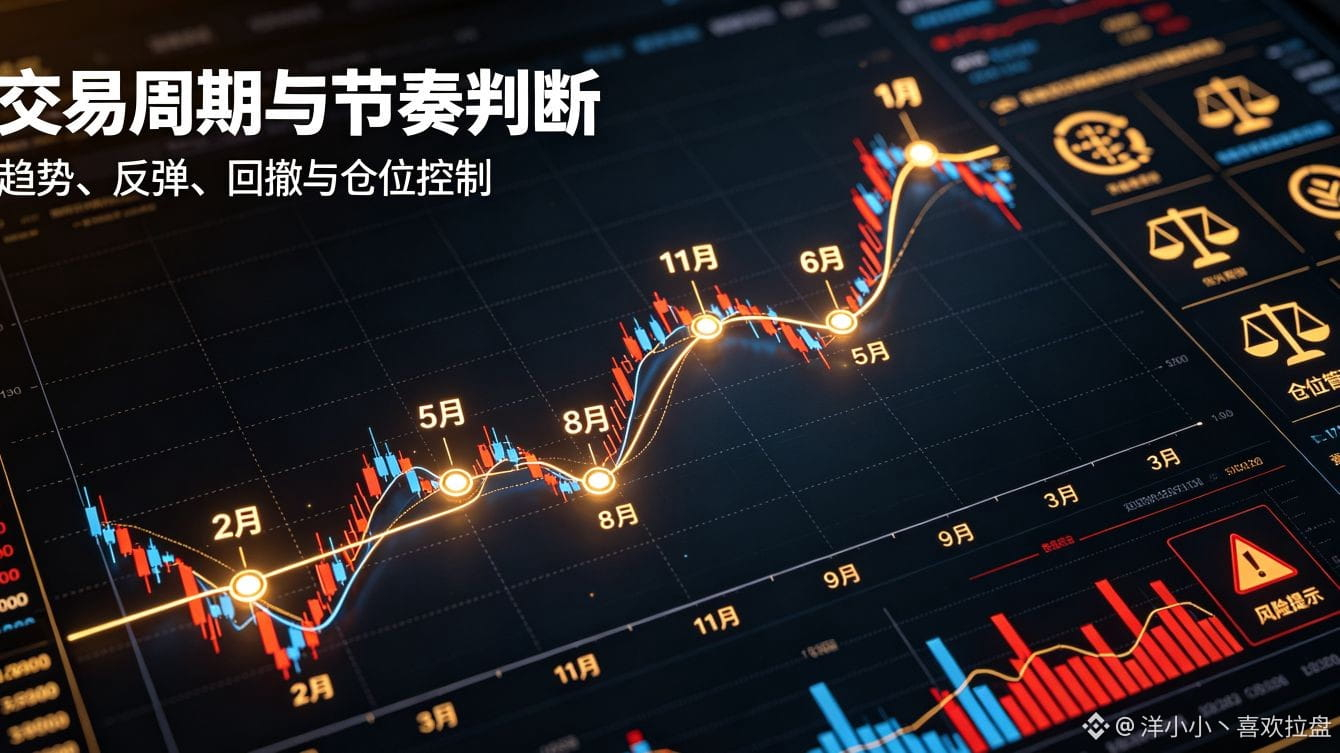
#2026足球风潮 Market cycle rhythm and trading logic: a complete整理
1. Core time cycle node breakdown
Quarterly cycle nodes (mid-quarter)
In the months of 2, 5, 8, and 11, these are designated as each quarter’s key mid-term time windows.
Semi-annual cycle nodes
Regular semi-annual nodes: December and June
Market start point: January
Mismatched semi-annual nodes: September and March
Monthly cycle nodes
Every month on the 1st (start point), the 15th (midpoint), and the 30th (end point)
Definition of gap periods
There are no months 4, 7, or 10; the above three months are defined as gap periods (to be determined).
All the listed time nodes above are key windows for the market’s price action.
2. Logic for projecting stage-by-stage行情
1. If a surge occurs in April, it can be determined that this is a gap period in a bearish environment, meaning the overall market is in a bear market; if the price declines in June, then the July gap period will most likely see an upward行情.
2. The set of time nodes: 1, 4, and 7, most likely corresponds to a trend continuation phase or a rebound cycle.
Price-action规律: if the earlier drawdown is large, there will typically be a modest rise afterward; if the earlier rally is excessively strong, there will typically be a modest pullback afterward; in extreme cases, the market may directly reverse.
3. Pros and cons analysis of long/short trading
The short-selling mode generally has smaller potential profit, but the行情 tends to realize more directly. In the market, there are more traders choosing to go long, so the chart is more prone to show washout patterns, forcing retail traders to exit.
Example: with a $1 initial本金 short position, if the行情 drops by 0.5, you profit 0.5. But if the行情 reverses and rises by 2, then the本金 will be down by 1—short positions carry the risk of unlimited losses. Long and short modes each have their own advantages and trade appeal.
4. Techniques for basic chart assessment
After a decline, if the price only recovers half of the prior drop, it indicates that this downtrend is real. This rule also applies to judging the走势 of most altcoin assets.
5. The three core elements of trading
A complete trading system cannot be separated from three core elements: trading strategy conclusions, position/risk management, and K-line technical analysis.
#2026足球风潮 Market cycle rhythm and trading logic: a complete整理
1. Core time cycle node breakdown
Quarterly cycle nodes (mid-quarter)
In the months of 2, 5, 8, and 11, these are designated as each quarter’s key mid-term time windows.
Semi-annual cycle nodes
Regular semi-annual nodes: December and June
Market start point: January
Mismatched semi-annual nodes: September and March
Monthly cycle nodes
Every month on the 1st (start point), the 15th (midpoint), and the 30th (end point)
Definition of gap periods
There are no months 4, 7, or 10; the above three months are defined as gap periods (to be determined).
All the listed time nodes above are key windows for the market’s price action.
2. Logic for projecting stage-by-stage行情
1. If a surge occurs in April, it can be determined that this is a gap period in a bearish environment, meaning the overall market is in a bear market; if the price declines in June, then the July gap period will most likely see an upward行情.
2. The set of time nodes: 1, 4, and 7, most likely corresponds to a trend continuation phase or a rebound cycle.
Price-action规律: if the earlier drawdown is large, there will typically be a modest rise afterward; if the earlier rally is excessively strong, there will typically be a modest pullback afterward; in extreme cases, the market may directly reverse.
3. Pros and cons analysis of long/short trading
The short-selling mode generally has smaller potential profit, but the行情 tends to realize more directly. In the market, there are more traders choosing to go long, so the chart is more prone to show washout patterns, forcing retail traders to exit.
Example: with a $1 initial本金 short position, if the行情 drops by 0.5, you profit 0.5. But if the行情 reverses and rises by 2, then the本金 will be down by 1—short positions carry the risk of unlimited losses. Long and short modes each have their own advantages and trade appeal.
4. Techniques for basic chart assessment
After a decline, if the price only recovers half of the prior drop, it indicates that this downtrend is real. This rule also applies to judging the走势 of most altcoin assets.
5. The three core elements of trading
A complete trading system cannot be separated from three core elements: trading strategy conclusions, position/risk management, and K-line technical analysis.
1. Core time cycle node breakdown
Quarterly cycle nodes (mid-quarter)
In the months of 2, 5, 8, and 11, these are designated as each quarter’s key mid-term time windows.
Semi-annual cycle nodes
Regular semi-annual nodes: December and June
Market start point: January
Mismatched semi-annual nodes: September and March
Monthly cycle nodes
Every month on the 1st (start point), the 15th (midpoint), and the 30th (end point)
Definition of gap periods
There are no months 4, 7, or 10; the above three months are defined as gap periods (to be determined).
All the listed time nodes above are key windows for the market’s price action.
2. Logic for projecting stage-by-stage行情
1. If a surge occurs in April, it can be determined that this is a gap period in a bearish environment, meaning the overall market is in a bear market; if the price declines in June, then the July gap period will most likely see an upward行情.
2. The set of time nodes: 1, 4, and 7, most likely corresponds to a trend continuation phase or a rebound cycle.
Price-action规律: if the earlier drawdown is large, there will typically be a modest rise afterward; if the earlier rally is excessively strong, there will typically be a modest pullback afterward; in extreme cases, the market may directly reverse.
3. Pros and cons analysis of long/short trading
The short-selling mode generally has smaller potential profit, but the行情 tends to realize more directly. In the market, there are more traders choosing to go long, so the chart is more prone to show washout patterns, forcing retail traders to exit.
Example: with a $1 initial本金 short position, if the行情 drops by 0.5, you profit 0.5. But if the行情 reverses and rises by 2, then the本金 will be down by 1—short positions carry the risk of unlimited losses. Long and short modes each have their own advantages and trade appeal.
4. Techniques for basic chart assessment
After a decline, if the price only recovers half of the prior drop, it indicates that this downtrend is real. This rule also applies to judging the走势 of most altcoin assets.
5. The three core elements of trading
A complete trading system cannot be separated from three core elements: trading strategy conclusions, position/risk management, and K-line technical analysis.
3
1
127
·
--
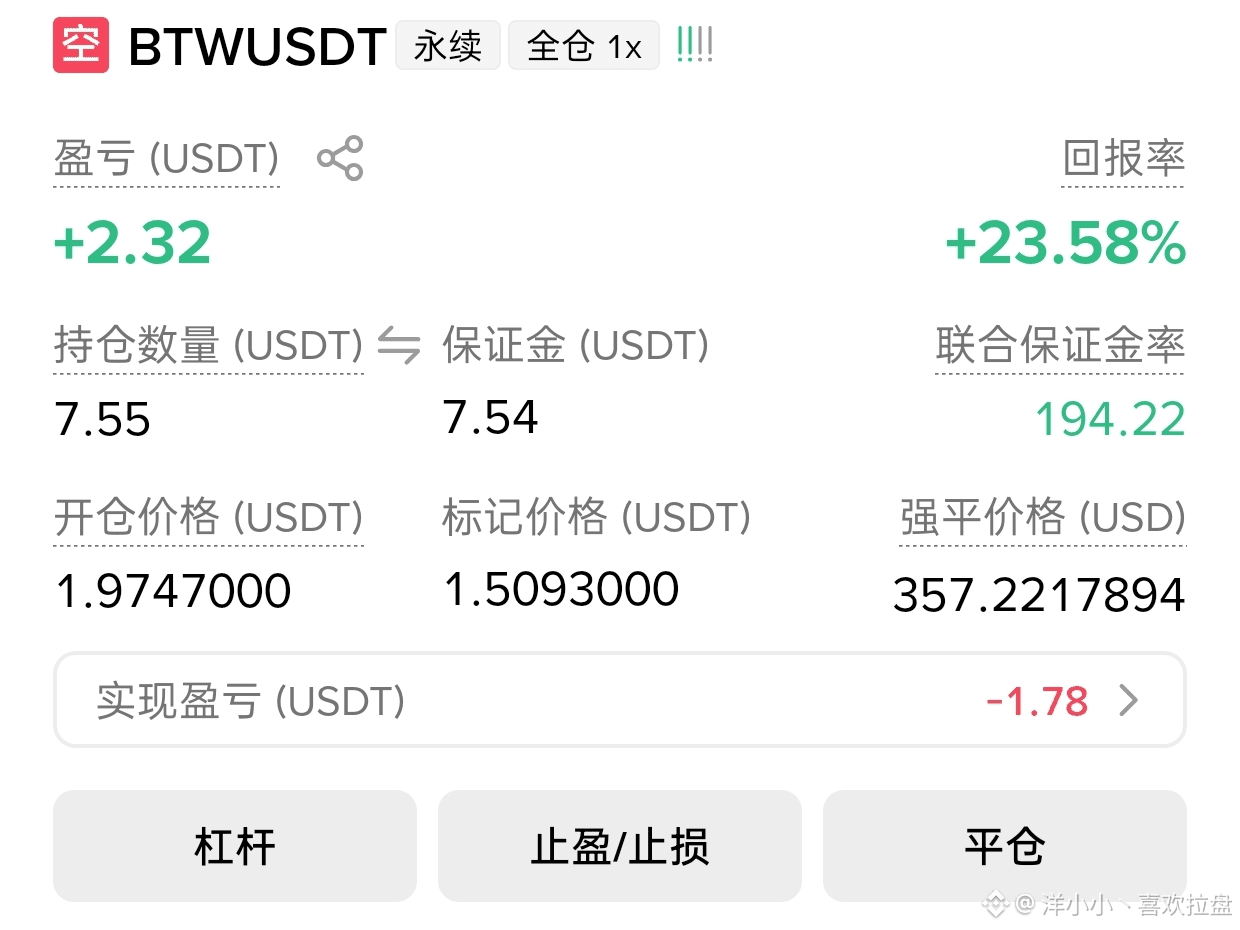
Held $BTW for five days, with high fees the whole time, and it still wasn't billed by the hour.
It only just outperformed the fees.
Held $BTW for five days, with high fees the whole time, and it still wasn't billed by the hour.
It only just outperformed the fees.
It only just outperformed the fees.
4
425
·
--
$IRYS has gains like ake—more than 1,000x from its historical low.
Some coins just get stronger the more dramatically they rise.
Seeing all the commotion around us, I thought it was the leader. I didn’t expect the market trend to shift.
$IRYS has gains like ake—more than 1,000x from its historical low.
Some coins just get stronger the more dramatically they rise.
Seeing all the commotion around us, I thought it was the leader. I didn’t expect the market trend to shift.
Some coins just get stronger the more dramatically they rise.
Seeing all the commotion around us, I thought it was the leader. I didn’t expect the market trend to shift.
1.2k
·
--
$US Is this about to surge sharply, or is it a bull trap? Will it go up 10x next month?
$US Is this about to surge sharply, or is it a bull trap? Will it go up 10x next month?
731
·
--
$AKE From the bottom, the increase is 1000x. Can you even imagine? You invest 10u, short at the bottom, and if it peaks, you could lose up to 10000u… When will you be able to get back to break-even?
$AKE From the bottom, the increase is 1000x. Can you even imagine? You invest 10u, short at the bottom, and if it peaks, you could lose up to 10000u… When will you be able to get back to break-even?
1
831
·
--
Don't let price movements sway your emotions; take profits where you should take profits, cut losses where you should cut losses, and keep a calm mindset.
Stretch out the time frame
Don't let price movements sway your emotions; take profits where you should take profits, cut losses where you should cut losses, and keep a calm mindset.
Stretch out the time frame
Stretch out the time frame
102
·
--
$牛来 Did a bull really come? Why not a dog, or a bear?
$牛来 Did a bull really come? Why not a dog, or a bear?
265
·
--
So many ideas, in a single moment, a choice is made
Let facts be the judge—take action
So many ideas, in a single moment, a choice is made
Let facts be the judge—take action
Let facts be the judge—take action
85
·
--
$AKE This coin is soaring hard, but it’s not time to short.
$AKE This coin is soaring hard, but it’s not time to short.
310
·
--
$US remains high, the trend is the most impressive—do you dare to short it? Answer me?
$US remains high, the trend is the most impressive—do you dare to short it? Answer me?
1
328
·
--
Playful, the mistake I made. To satisfy
the suppressed soul, what do I actually need?
$AKE
{future}(AKEUSDT)
Playful, the mistake I made. To satisfy
the suppressed soul, what do I actually need?
$AKE
the suppressed soul, what do I actually need?
$AKE

225
·
--
Partly True
$ZEC In-stock, long-established privacy token, up to 184 you can message to get it on WeChat. Represents strong momentum. For short-term trading.
{future}(ZECUSDT)
In-depth Market Analysis and Strategy for Zcash (ZEC)
Market Analysis:
- Daily chart: Price is trading above the middle band of the Bollinger Bands. MACD has formed a golden cross with expanding red histogram, and the RSI stays around the 60 mark in a strong range. The short-term bullish trend is strong. Current price is around 554.59, positioned at a critical zone where bulls and bears are battling.
- Weekly chart: After rebounding from the low at 184.16, price is currently in a high-range consolidation phase. The weekly MACD has not formed a death cross yet, but there is a need to stay alert to the risk of a pullback after a spike.
Bull vs. Bear Response Strategies:
- Going long: Follow the trend. Wait for a pullback to the 520–530 support zone, then enter after it stabilizes. Set stop-loss below 500. Targets are around the previous high near 687.53.
- Going short: It is not advisable to try topping on the left side. Wait until price spikes into the 600–620 resistance zone and fails, then look to short cautiously from the right side with a small position. Keep a strict stop-loss set above 650.
Comprehensive Evaluation and News:
Zcash, as the first blockchain system to use zero-knowledge proof mechanisms, has its privacy features highly regarded. Project updates have been frequent recently, including the release of a new node client called Zakura, aiming to boost transaction processing capacity to 50,000 transactions per second, which will greatly enhance network performance. Meanwhile, well-known analyst Ansem stated that he does not hold any long position in ZEC and set a price alert at $750, reflecting the market’s cautious attitude toward its long-term value. Although technical upgrades are a positive, the market cap is already $9.3 billion, which is relatively high for a privacy coin. Investors are advised to stay rational and participate in swing trading only with small positions, and never blindly chase higher prices.
This old, established privacy coin is heavily influenced by regulatory-related news
$ZEC In-stock, long-established privacy token, up to 184 you can message to get it on WeChat. Represents strong momentum. For short-term trading.
In-depth Market Analysis and Strategy for Zcash (ZEC)
Market Analysis:
- Daily chart: Price is trading above the middle band of the Bollinger Bands. MACD has formed a golden cross with expanding red histogram, and the RSI stays around the 60 mark in a strong range. The short-term bullish trend is strong. Current price is around 554.59, positioned at a critical zone where bulls and bears are battling.
- Weekly chart: After rebounding from the low at 184.16, price is currently in a high-range consolidation phase. The weekly MACD has not formed a death cross yet, but there is a need to stay alert to the risk of a pullback after a spike.
Bull vs. Bear Response Strategies:
- Going long: Follow the trend. Wait for a pullback to the 520–530 support zone, then enter after it stabilizes. Set stop-loss below 500. Targets are around the previous high near 687.53.
- Going short: It is not advisable to try topping on the left side. Wait until price spikes into the 600–620 resistance zone and fails, then look to short cautiously from the right side with a small position. Keep a strict stop-loss set above 650.
Comprehensive Evaluation and News:
Zcash, as the first blockchain system to use zero-knowledge proof mechanisms, has its privacy features highly regarded. Project updates have been frequent recently, including the release of a new node client called Zakura, aiming to boost transaction processing capacity to 50,000 transactions per second, which will greatly enhance network performance. Meanwhile, well-known analyst Ansem stated that he does not hold any long position in ZEC and set a price alert at $750, reflecting the market’s cautious attitude toward its long-term value. Although technical upgrades are a positive, the market cap is already $9.3 billion, which is relatively high for a privacy coin. Investors are advised to stay rational and participate in swing trading only with small positions, and never blindly chase higher prices.
This old, established privacy coin is heavily influenced by regulatory-related news
In-depth Market Analysis and Strategy for Zcash (ZEC)
Market Analysis:
- Daily chart: Price is trading above the middle band of the Bollinger Bands. MACD has formed a golden cross with expanding red histogram, and the RSI stays around the 60 mark in a strong range. The short-term bullish trend is strong. Current price is around 554.59, positioned at a critical zone where bulls and bears are battling.
- Weekly chart: After rebounding from the low at 184.16, price is currently in a high-range consolidation phase. The weekly MACD has not formed a death cross yet, but there is a need to stay alert to the risk of a pullback after a spike.
Bull vs. Bear Response Strategies:
- Going long: Follow the trend. Wait for a pullback to the 520–530 support zone, then enter after it stabilizes. Set stop-loss below 500. Targets are around the previous high near 687.53.
- Going short: It is not advisable to try topping on the left side. Wait until price spikes into the 600–620 resistance zone and fails, then look to short cautiously from the right side with a small position. Keep a strict stop-loss set above 650.
Comprehensive Evaluation and News:
Zcash, as the first blockchain system to use zero-knowledge proof mechanisms, has its privacy features highly regarded. Project updates have been frequent recently, including the release of a new node client called Zakura, aiming to boost transaction processing capacity to 50,000 transactions per second, which will greatly enhance network performance. Meanwhile, well-known analyst Ansem stated that he does not hold any long position in ZEC and set a price alert at $750, reflecting the market’s cautious attitude toward its long-term value. Although technical upgrades are a positive, the market cap is already $9.3 billion, which is relatively high for a privacy coin. Investors are advised to stay rational and participate in swing trading only with small positions, and never blindly chase higher prices.
This old, established privacy coin is heavily influenced by regulatory-related news
178
·
--
Partly True
$YGG Spot game shanzhai contract tokens—once glorious, never to return?
{future}(YGGUSDT)
Yield Guild Games (YGG) Market Depth Analysis and Strategy
Market Analysis:
- Weekly chart: YGG is currently in a long-term downtrend. Price is trading near the lower band of the Bollinger Bands. The MACD has formed a dead cross below the zero axis, with green histogram bars continuing to expand. The RSI has fallen below 20 into an oversold region, indicating extremely strong bearish momentum. The market is in a severely weak, slow-down drifting bearish phase.
- Daily chart: Price has just broken below the prior consolidation platform (around 0.019) and set a new all-time low at 0.01855. Although the RSI has entered the oversold zone, the moving-average system remains in a bearish alignment. Today also saw a high-volume, large bearish candlestick, suggesting panic selling is pouring out—no clear signal of a bottoming and stabilization has appeared yet.
Long-side Countermeasures:
- Going long: This is a high-risk “catching a falling knife” situation. Do not blindly bottom-fish. Wait for a clear bottom reversal pattern on the daily timeframe (such as a long lower wick or a bullish divergence) before considering an entry.
Comprehensive Evaluation and News:
YGG, as a leading DAO in the GameFi sector, has recently faced major negative catalysts. The July 6 news reported that YGG will shut down its game publishing arm, YGG Play, and lay off 35 employees. This directly hits the market’s confidence in its business expansion, causing the token price to crash and print a new low. Even though the official Twitter continues to promote collaborations with other projects (such as Animoca Brands), the contraction in its core business has led investors to worry about token utility and future earnings. Current market cap is only $18 million—while it may seem undervalued, given the deterioration in fundamentals, it’s recommended to stay on the sidelines and avoid downside risks.
Hold a small position.
$YGG Spot game shanzhai contract tokens—once glorious, never to return?
Yield Guild Games (YGG) Market Depth Analysis and Strategy
Market Analysis:
- Weekly chart: YGG is currently in a long-term downtrend. Price is trading near the lower band of the Bollinger Bands. The MACD has formed a dead cross below the zero axis, with green histogram bars continuing to expand. The RSI has fallen below 20 into an oversold region, indicating extremely strong bearish momentum. The market is in a severely weak, slow-down drifting bearish phase.
- Daily chart: Price has just broken below the prior consolidation platform (around 0.019) and set a new all-time low at 0.01855. Although the RSI has entered the oversold zone, the moving-average system remains in a bearish alignment. Today also saw a high-volume, large bearish candlestick, suggesting panic selling is pouring out—no clear signal of a bottoming and stabilization has appeared yet.
Long-side Countermeasures:
- Going long: This is a high-risk “catching a falling knife” situation. Do not blindly bottom-fish. Wait for a clear bottom reversal pattern on the daily timeframe (such as a long lower wick or a bullish divergence) before considering an entry.
Comprehensive Evaluation and News:
YGG, as a leading DAO in the GameFi sector, has recently faced major negative catalysts. The July 6 news reported that YGG will shut down its game publishing arm, YGG Play, and lay off 35 employees. This directly hits the market’s confidence in its business expansion, causing the token price to crash and print a new low. Even though the official Twitter continues to promote collaborations with other projects (such as Animoca Brands), the contraction in its core business has led investors to worry about token utility and future earnings. Current market cap is only $18 million—while it may seem undervalued, given the deterioration in fundamentals, it’s recommended to stay on the sidelines and avoid downside risks.
Hold a small position.
Yield Guild Games (YGG) Market Depth Analysis and Strategy
Market Analysis:
- Weekly chart: YGG is currently in a long-term downtrend. Price is trading near the lower band of the Bollinger Bands. The MACD has formed a dead cross below the zero axis, with green histogram bars continuing to expand. The RSI has fallen below 20 into an oversold region, indicating extremely strong bearish momentum. The market is in a severely weak, slow-down drifting bearish phase.
- Daily chart: Price has just broken below the prior consolidation platform (around 0.019) and set a new all-time low at 0.01855. Although the RSI has entered the oversold zone, the moving-average system remains in a bearish alignment. Today also saw a high-volume, large bearish candlestick, suggesting panic selling is pouring out—no clear signal of a bottoming and stabilization has appeared yet.
Long-side Countermeasures:
- Going long: This is a high-risk “catching a falling knife” situation. Do not blindly bottom-fish. Wait for a clear bottom reversal pattern on the daily timeframe (such as a long lower wick or a bullish divergence) before considering an entry.
Comprehensive Evaluation and News:
YGG, as a leading DAO in the GameFi sector, has recently faced major negative catalysts. The July 6 news reported that YGG will shut down its game publishing arm, YGG Play, and lay off 35 employees. This directly hits the market’s confidence in its business expansion, causing the token price to crash and print a new low. Even though the official Twitter continues to promote collaborations with other projects (such as Animoca Brands), the contraction in its core business has led investors to worry about token utility and future earnings. Current market cap is only $18 million—while it may seem undervalued, given the deterioration in fundamentals, it’s recommended to stay on the sidelines and avoid downside risks.
Hold a small position.
309
·
--
$币安人生 Chinese has spot supply—copycat contract tokens, major-institution narrative, temporarily bearish
{future}(币安人生USDT)
Binance Life (Bian Rensheng) Market Depth Analysis & Strategy
Market Analysis:
From the daily chart, after the price fell from the previous high of 0.92, it is currently trading near the middle band of the Bollinger Bands. The MACD has formed a bearish crossover and the red histogram bars have shrunk. The RSI has dropped below 50, indicating that short-term upward momentum has weakened, and the market has entered a high-level range pullback phase. The current price is around 0.6889, a critical battleground between bulls and bears. If it breaks below the middle-band support, it may dip further.
On the weekly timeframe, this coin surged from a historical low of 0.03751 to a high of 0.92000, delivering an astonishing increase. Currently, on the daily chart, it is in a high-range consolidation and pullback phase. Price is moving around the Bollinger middle band, and the MACD shows signs of a bearish crossover. The RSI has fallen below 50, reflecting a lack of short-term upside momentum and the risk of profit-taking.
Bull/Bear Countermeasures:
- Going Long: Wait patiently for signs that the pullback has stabilized. If the price receives support in the 0.60–0.65 range and consolidates with shrinking volume, you may consider a small-sized entry to trade the rebound. Set the stop-loss below 0.58.
- Going Short: The coin is currently in a weak, high-level consolidation, which is a good window to attempt shorting. Consider entering when the price rebounds into the 0.72–0.75 resistance zone and fails. Set the stop-loss above 0.78. Target around 0.55.
Overall Assessment & News:
As a Meme coin on the BNB Chain, this token has recently attracted market attention due to the "big whale effect." On-chain data shows that early holders have realized returns of thousands of times, and there is also a new big whale that has invested $1.7 million to buy in. This wealth effect has greatly boosted community sentiment. However, its fully diluted market cap is already $691 million, which is relatively high for a pure Meme coin. Although whale funds are still playing tug-of-war, the risks of a high turnover rate and concentrated holdings should not be ignored. Investors are advised to stay cautious and only participate with small positions for swing trades—never chase the price blindly.
This Meme coin is highly controlled by whales; its volatility can be extremely severe.
$币安人生 Chinese has spot supply—copycat contract tokens, major-institution narrative, temporarily bearish
Binance Life (Bian Rensheng) Market Depth Analysis & Strategy
Market Analysis:
From the daily chart, after the price fell from the previous high of 0.92, it is currently trading near the middle band of the Bollinger Bands. The MACD has formed a bearish crossover and the red histogram bars have shrunk. The RSI has dropped below 50, indicating that short-term upward momentum has weakened, and the market has entered a high-level range pullback phase. The current price is around 0.6889, a critical battleground between bulls and bears. If it breaks below the middle-band support, it may dip further.
On the weekly timeframe, this coin surged from a historical low of 0.03751 to a high of 0.92000, delivering an astonishing increase. Currently, on the daily chart, it is in a high-range consolidation and pullback phase. Price is moving around the Bollinger middle band, and the MACD shows signs of a bearish crossover. The RSI has fallen below 50, reflecting a lack of short-term upside momentum and the risk of profit-taking.
Bull/Bear Countermeasures:
- Going Long: Wait patiently for signs that the pullback has stabilized. If the price receives support in the 0.60–0.65 range and consolidates with shrinking volume, you may consider a small-sized entry to trade the rebound. Set the stop-loss below 0.58.
- Going Short: The coin is currently in a weak, high-level consolidation, which is a good window to attempt shorting. Consider entering when the price rebounds into the 0.72–0.75 resistance zone and fails. Set the stop-loss above 0.78. Target around 0.55.
Overall Assessment & News:
As a Meme coin on the BNB Chain, this token has recently attracted market attention due to the "big whale effect." On-chain data shows that early holders have realized returns of thousands of times, and there is also a new big whale that has invested $1.7 million to buy in. This wealth effect has greatly boosted community sentiment. However, its fully diluted market cap is already $691 million, which is relatively high for a pure Meme coin. Although whale funds are still playing tug-of-war, the risks of a high turnover rate and concentrated holdings should not be ignored. Investors are advised to stay cautious and only participate with small positions for swing trades—never chase the price blindly.
This Meme coin is highly controlled by whales; its volatility can be extremely severe.
Binance Life (Bian Rensheng) Market Depth Analysis & Strategy
Market Analysis:
From the daily chart, after the price fell from the previous high of 0.92, it is currently trading near the middle band of the Bollinger Bands. The MACD has formed a bearish crossover and the red histogram bars have shrunk. The RSI has dropped below 50, indicating that short-term upward momentum has weakened, and the market has entered a high-level range pullback phase. The current price is around 0.6889, a critical battleground between bulls and bears. If it breaks below the middle-band support, it may dip further.
On the weekly timeframe, this coin surged from a historical low of 0.03751 to a high of 0.92000, delivering an astonishing increase. Currently, on the daily chart, it is in a high-range consolidation and pullback phase. Price is moving around the Bollinger middle band, and the MACD shows signs of a bearish crossover. The RSI has fallen below 50, reflecting a lack of short-term upside momentum and the risk of profit-taking.
Bull/Bear Countermeasures:
- Going Long: Wait patiently for signs that the pullback has stabilized. If the price receives support in the 0.60–0.65 range and consolidates with shrinking volume, you may consider a small-sized entry to trade the rebound. Set the stop-loss below 0.58.
- Going Short: The coin is currently in a weak, high-level consolidation, which is a good window to attempt shorting. Consider entering when the price rebounds into the 0.72–0.75 resistance zone and fails. Set the stop-loss above 0.78. Target around 0.55.
Overall Assessment & News:
As a Meme coin on the BNB Chain, this token has recently attracted market attention due to the "big whale effect." On-chain data shows that early holders have realized returns of thousands of times, and there is also a new big whale that has invested $1.7 million to buy in. This wealth effect has greatly boosted community sentiment. However, its fully diluted market cap is already $691 million, which is relatively high for a pure Meme coin. Although whale funds are still playing tug-of-war, the risks of a high turnover rate and concentrated holdings should not be ignored. Investors are advised to stay cautious and only participate with small positions for swing trades—never chase the price blindly.
This Meme coin is highly controlled by whales; its volatility can be extremely severe.
1.1k
·
--
$龙虾 Chinese no-spot futures for counterfeit coins, AI narratives, rallying as money rushes in
{future}(龙虾USDT)
Lobster (Lobster) daily chart deep analysis and strategy
Market analysis:
According to the latest daily chart, the price is trading above the Bollinger Band middle line. The MACD has a golden cross with red histogram bars expanding, and the RSI remains around the 60 level in a strong range. This indicates that the short-term bullish trend is still strong. The market is currently in a rebound continuation phase, and there are no clear top-divergence signals yet.
Long/short response strategy:
- Go long: Follow the trend. Wait for a pullback to the 0.01485 support level and enter after it stabilizes. Set the stop loss below 0.013. The target is around the previous high of 0.020.
- Go short: It is not advisable to try to top-tick from the left side. Wait for the price to rise into the 0.0172–0.020 resistance zone. If you see stagnation signals such as a long upper wick or weakening volume, then attempt a short position on the right side with a small size. Set the stop loss strictly above 0.021.
Overall assessment and news:
This coin originates from an AI humorous meme posted on a Binance Chinese account. It is purely driven by community sentiment. Although it rides the AI agent hype for speculation, it lacks substantive technical support. Its market cap is only about $14 million, yet it experiences extreme volatility. As a pure Meme coin, its value depends entirely on community hype, making the risk very high. It is recommended to participate only with a small position for short-term trading and never chase with a heavy allocation.
$龙虾 Chinese no-spot futures for counterfeit coins, AI narratives, rallying as money rushes in
Lobster (Lobster) daily chart deep analysis and strategy
Market analysis:
According to the latest daily chart, the price is trading above the Bollinger Band middle line. The MACD has a golden cross with red histogram bars expanding, and the RSI remains around the 60 level in a strong range. This indicates that the short-term bullish trend is still strong. The market is currently in a rebound continuation phase, and there are no clear top-divergence signals yet.
Long/short response strategy:
- Go long: Follow the trend. Wait for a pullback to the 0.01485 support level and enter after it stabilizes. Set the stop loss below 0.013. The target is around the previous high of 0.020.
- Go short: It is not advisable to try to top-tick from the left side. Wait for the price to rise into the 0.0172–0.020 resistance zone. If you see stagnation signals such as a long upper wick or weakening volume, then attempt a short position on the right side with a small size. Set the stop loss strictly above 0.021.
Overall assessment and news:
This coin originates from an AI humorous meme posted on a Binance Chinese account. It is purely driven by community sentiment. Although it rides the AI agent hype for speculation, it lacks substantive technical support. Its market cap is only about $14 million, yet it experiences extreme volatility. As a pure Meme coin, its value depends entirely on community hype, making the risk very high. It is recommended to participate only with a small position for short-term trading and never chase with a heavy allocation.
Lobster (Lobster) daily chart deep analysis and strategy
Market analysis:
According to the latest daily chart, the price is trading above the Bollinger Band middle line. The MACD has a golden cross with red histogram bars expanding, and the RSI remains around the 60 level in a strong range. This indicates that the short-term bullish trend is still strong. The market is currently in a rebound continuation phase, and there are no clear top-divergence signals yet.
Long/short response strategy:
- Go long: Follow the trend. Wait for a pullback to the 0.01485 support level and enter after it stabilizes. Set the stop loss below 0.013. The target is around the previous high of 0.020.
- Go short: It is not advisable to try to top-tick from the left side. Wait for the price to rise into the 0.0172–0.020 resistance zone. If you see stagnation signals such as a long upper wick or weakening volume, then attempt a short position on the right side with a small size. Set the stop loss strictly above 0.021.
Overall assessment and news:
This coin originates from an AI humorous meme posted on a Binance Chinese account. It is purely driven by community sentiment. Although it rides the AI agent hype for speculation, it lacks substantive technical support. Its market cap is only about $14 million, yet it experiences extreme volatility. As a pure Meme coin, its value depends entirely on community hype, making the risk very high. It is recommended to participate only with a small position for short-term trading and never chase with a heavy allocation.
522
·
--
$TLM Watching in-stock game tokens, it’s estimated they will drop and be delisted. Next
{future}(TLMUSDT)
TLM (Alien Worlds) market deep-dive analysis and short-selling strategy
Market analysis:
Key price-move recap: a roller-coaster-like “sky-to-earth board”
- Extreme surge: The price truly started near the historical low of 0.0008, and was propelled by news (fixing mining issues). It then rocketed up straight away, reaching a peak of 0.0043
- Profit-taking pullback: After touching the high point, the price quickly fell back. This means the drawdown from the peak was significant; early bargain-hunting capital took huge profits, resulting in massive selling pressure.
Short-sell response strategy:
For such high-volatility coins, avoid blindly trying to pick the top on the left side. It’s recommended to use a right-side trading approach: wait for clear signs of stall after a spike (e.g., a long upper wick, weakening volume, or a breakdown of short-term moving averages), then attempt a short with a small position. Set the stop-loss strictly above the recent high (approximately in the 0.0020–0.0021 range) to avoid being violently squeezed upward again. For targets, first look toward support around 0.0014.
Token observation tag:
The platform has labeled this token with a “risk monitoring tag,” explicitly indicating that its volatility and risk may be higher. This official warning suggests the asset may have abnormal capital flows, potential market manipulation, or liquidity crises. It’s a more dangerous trading target than typical small-cap altcoins, so strict risk-control discipline must be followed.
Overall assessment and news:
On July 18, the project team issued an announcement stating that they have resolved technical faults affecting mining and in-game actions. This positive catalyst directly drove today’s explosive rally. However, token checks show it has the “ability to mint/increase supply” risk on both the BSC and ETH chains, and with a market cap of only $13 million but a fully diluted valuation close to $19 million, there are significant hidden risks from selling pressure. As an established GameFi, its long-term value still depends on how active the ecosystem is; for now, it’s driven more by sentiment
$TLM Watching in-stock game tokens, it’s estimated they will drop and be delisted. Next
TLM (Alien Worlds) market deep-dive analysis and short-selling strategy
Market analysis:
Key price-move recap: a roller-coaster-like “sky-to-earth board”
- Extreme surge: The price truly started near the historical low of 0.0008, and was propelled by news (fixing mining issues). It then rocketed up straight away, reaching a peak of 0.0043
- Profit-taking pullback: After touching the high point, the price quickly fell back. This means the drawdown from the peak was significant; early bargain-hunting capital took huge profits, resulting in massive selling pressure.
Short-sell response strategy:
For such high-volatility coins, avoid blindly trying to pick the top on the left side. It’s recommended to use a right-side trading approach: wait for clear signs of stall after a spike (e.g., a long upper wick, weakening volume, or a breakdown of short-term moving averages), then attempt a short with a small position. Set the stop-loss strictly above the recent high (approximately in the 0.0020–0.0021 range) to avoid being violently squeezed upward again. For targets, first look toward support around 0.0014.
Token observation tag:
The platform has labeled this token with a “risk monitoring tag,” explicitly indicating that its volatility and risk may be higher. This official warning suggests the asset may have abnormal capital flows, potential market manipulation, or liquidity crises. It’s a more dangerous trading target than typical small-cap altcoins, so strict risk-control discipline must be followed.
Overall assessment and news:
On July 18, the project team issued an announcement stating that they have resolved technical faults affecting mining and in-game actions. This positive catalyst directly drove today’s explosive rally. However, token checks show it has the “ability to mint/increase supply” risk on both the BSC and ETH chains, and with a market cap of only $13 million but a fully diluted valuation close to $19 million, there are significant hidden risks from selling pressure. As an established GameFi, its long-term value still depends on how active the ecosystem is; for now, it’s driven more by sentiment
TLM (Alien Worlds) market deep-dive analysis and short-selling strategy
Market analysis:
Key price-move recap: a roller-coaster-like “sky-to-earth board”
- Extreme surge: The price truly started near the historical low of 0.0008, and was propelled by news (fixing mining issues). It then rocketed up straight away, reaching a peak of 0.0043
- Profit-taking pullback: After touching the high point, the price quickly fell back. This means the drawdown from the peak was significant; early bargain-hunting capital took huge profits, resulting in massive selling pressure.
Short-sell response strategy:
For such high-volatility coins, avoid blindly trying to pick the top on the left side. It’s recommended to use a right-side trading approach: wait for clear signs of stall after a spike (e.g., a long upper wick, weakening volume, or a breakdown of short-term moving averages), then attempt a short with a small position. Set the stop-loss strictly above the recent high (approximately in the 0.0020–0.0021 range) to avoid being violently squeezed upward again. For targets, first look toward support around 0.0014.
Token observation tag:
The platform has labeled this token with a “risk monitoring tag,” explicitly indicating that its volatility and risk may be higher. This official warning suggests the asset may have abnormal capital flows, potential market manipulation, or liquidity crises. It’s a more dangerous trading target than typical small-cap altcoins, so strict risk-control discipline must be followed.
Overall assessment and news:
On July 18, the project team issued an announcement stating that they have resolved technical faults affecting mining and in-game actions. This positive catalyst directly drove today’s explosive rally. However, token checks show it has the “ability to mint/increase supply” risk on both the BSC and ETH chains, and with a market cap of only $13 million but a fully diluted valuation close to $19 million, there are significant hidden risks from selling pressure. As an established GameFi, its long-term value still depends on how active the ecosystem is; for now, it’s driven more by sentiment
84
·
--

Article
【Peak Preview】2026 World Cup Final in the USA, Canada & Mexico: The Ultimate Clash Between the Pampas Eagles and the Bullfighters Army【Peak Preview】2026 World Cup Final in the USA, Canada & Mexico: The Ultimate Clash Between the Pampas Eagles and the Bullfighters Army
$CHZ Sports-mimic coin leader: after the Jue Cai, will it go up?
At 3:00 a.m. Beijing time on July 20, 2026, the World Cup in the USA, Canada & Mexico will reach its ultimate peak showdown. At MetLife Stadium in New Jersey, New York, defending champions Argentina will take on Spain, the newly crowned European Championship winner. This is not only the first direct clash in World Cup history between the reigning European champions and the Copa América champions on the final stage, but also a fated battle between two extreme football philosophies.
【Peak Preview】2026 World Cup Final in the USA, Canada & Mexico: The Ultimate Clash Between the Pampas Eagles and the Bullfighters Army
【Peak Preview】2026 World Cup Final in the USA, Canada & Mexico: The Ultimate Clash Between the Pampas Eagles and the Bullfighters Army
$CHZ Sports-mimic coin leader: after the Jue Cai, will it go up?
At 3:00 a.m. Beijing time on July 20, 2026, the World Cup in the USA, Canada & Mexico will reach its ultimate peak showdown. At MetLife Stadium in New Jersey, New York, defending champions Argentina will take on Spain, the newly crowned European Championship winner. This is not only the first direct clash in World Cup history between the reigning European champions and the Copa América champions on the final stage, but also a fated battle between two extreme football philosophies.
$CHZ Sports-mimic coin leader: after the Jue Cai, will it go up?
At 3:00 a.m. Beijing time on July 20, 2026, the World Cup in the USA, Canada & Mexico will reach its ultimate peak showdown. At MetLife Stadium in New Jersey, New York, defending champions Argentina will take on Spain, the newly crowned European Championship winner. This is not only the first direct clash in World Cup history between the reigning European champions and the Copa América champions on the final stage, but also a fated battle between two extreme football philosophies.
2
1.4k
·
--
Verified
$ESPORTS No spot available contracts for counterfeit tokens, oversold rebound?
{future}(ESPORTSUSDT)
ESPORTS has recently crashed from its historical high of $0.83 down to $0.013—a drop of as much as 98%. Talk in the market about an “oversold rebound” has been running rampant, and the price has indeed surged violently by more than 74%. However, this is more of an emotional release and a contest of capital under extreme conditions.
Short-side strategy:
When facing an oversold rebound, never blindly “call the top” while shorting. Before sentiment cools off, trying to short a top on the left side of the move often gets squeezed, leading to forced liquidations. Wait until the rebound momentum exhausts and clear top signals appear (such as long upper wicks and divergences between price and volume). Then, use a small position to test on the right side, and set your stop-loss strictly above the prior high.
Overall assessment and news:
ESPORTS’s current market cap is only $27.87 million. Its fully diluted market cap is nearly $40 million, and the sell-pressure from unlocked tokens remains the “Damocles’ sword” hanging over its head. Recent news shows that the token’s extreme volatility has put both bulls and bears through an emotional rollercoaster: there are whales who are short and currently down by $4.42 million, and traders who shorted using 1x leverage and profited by as much as $9 million. This clearly indicates a highly speculative nature. As a Web3 gaming platform, its long-term value still needs to return to ecosystem building—not short-term hype.
$ESPORTS No spot available contracts for counterfeit tokens, oversold rebound?
ESPORTS has recently crashed from its historical high of $0.83 down to $0.013—a drop of as much as 98%. Talk in the market about an “oversold rebound” has been running rampant, and the price has indeed surged violently by more than 74%. However, this is more of an emotional release and a contest of capital under extreme conditions.
Short-side strategy:
When facing an oversold rebound, never blindly “call the top” while shorting. Before sentiment cools off, trying to short a top on the left side of the move often gets squeezed, leading to forced liquidations. Wait until the rebound momentum exhausts and clear top signals appear (such as long upper wicks and divergences between price and volume). Then, use a small position to test on the right side, and set your stop-loss strictly above the prior high.
Overall assessment and news:
ESPORTS’s current market cap is only $27.87 million. Its fully diluted market cap is nearly $40 million, and the sell-pressure from unlocked tokens remains the “Damocles’ sword” hanging over its head. Recent news shows that the token’s extreme volatility has put both bulls and bears through an emotional rollercoaster: there are whales who are short and currently down by $4.42 million, and traders who shorted using 1x leverage and profited by as much as $9 million. This clearly indicates a highly speculative nature. As a Web3 gaming platform, its long-term value still needs to return to ecosystem building—not short-term hype.
ESPORTS has recently crashed from its historical high of $0.83 down to $0.013—a drop of as much as 98%. Talk in the market about an “oversold rebound” has been running rampant, and the price has indeed surged violently by more than 74%. However, this is more of an emotional release and a contest of capital under extreme conditions.
Short-side strategy:
When facing an oversold rebound, never blindly “call the top” while shorting. Before sentiment cools off, trying to short a top on the left side of the move often gets squeezed, leading to forced liquidations. Wait until the rebound momentum exhausts and clear top signals appear (such as long upper wicks and divergences between price and volume). Then, use a small position to test on the right side, and set your stop-loss strictly above the prior high.
Overall assessment and news:
ESPORTS’s current market cap is only $27.87 million. Its fully diluted market cap is nearly $40 million, and the sell-pressure from unlocked tokens remains the “Damocles’ sword” hanging over its head. Recent news shows that the token’s extreme volatility has put both bulls and bears through an emotional rollercoaster: there are whales who are short and currently down by $4.42 million, and traders who shorted using 1x leverage and profited by as much as $9 million. This clearly indicates a highly speculative nature. As a Web3 gaming platform, its long-term value still needs to return to ecosystem building—not short-term hype.
1
281
·
--
$BANK spot fake/sham token, breaking to new highs
{future}(BANKUSDT)
This BANK coin rally is absolutely more thrilling than a roller coaster! A one-day surge of 91%—the price rocketed from $0.022 all the way to $0.134. On the weekly chart, that towering green candle makes your adrenaline spike. The RSI indicator even hit 99 directly; the market sentiment is blazing hot, like it’s about to break the sky in the next second.
But don’t just get carried away—risk is quietly lurking as well. Token detection shows it has a little “minting permission” tail, which means the project team could start printing money and diluting your returns at any time. While no blacklists or trading halts have been found—those fatal traps—this minting feature is still like a sword of Damocles hanging overhead.
Even more surreal: its all-time high is as high as $0.233, yet the current price hasn’t even reached half of that. Is it a value rebound or a bubble about to burst? No one knows. The AMA event just ended, and the founder’s promises in the big speech haven’t even cooled off, yet the market already handed out a surprise party.
Below is a brief short-selling action plan:
1. Core logic: bet on mean reversion
RSI near 100 indicates extreme overbought. Historically, this kind of pattern is often followed by a sharp pullback or a sudden dump. Your goal is to capture the downside after the sentiment tide retreats.
2. Entry timing: right-side trading (key)
- Don’t short the top from the left side: even if it’s surging wildly, as long as it’s still pumping, don’t short. “Irrational exuberance” can double the price and then double again—leaving shorts liquidated.
- Wait for a signal: you must wait until the candlestick shows a clear upper wick, a bearish engulfing pattern (bearish engulfing), or after a break below the short-term moving average on an hourly basis—then enter with a small position.
3. Position size & stop-loss: strict risk control
- Small position trial: this kind of “meme妖” coin is extremely volatile; it’s recommended to use a very small allocation (e.g., 5%-10% of total capital).
- Hard stop-loss: set it slightly above the high of the previous big bullish candle. If the price breaks the new high, immediately take the loss and exit—never hold through it.
One-sentence summary: Don’t catch the rabbit before it runs—wait for the rally to weaken, then act; set a stop-loss to avoid getting squeezed; move fast in and out to profit from the pullback.
$BANK spot fake/sham token, breaking to new highs
This BANK coin rally is absolutely more thrilling than a roller coaster! A one-day surge of 91%—the price rocketed from $0.022 all the way to $0.134. On the weekly chart, that towering green candle makes your adrenaline spike. The RSI indicator even hit 99 directly; the market sentiment is blazing hot, like it’s about to break the sky in the next second.
But don’t just get carried away—risk is quietly lurking as well. Token detection shows it has a little “minting permission” tail, which means the project team could start printing money and diluting your returns at any time. While no blacklists or trading halts have been found—those fatal traps—this minting feature is still like a sword of Damocles hanging overhead.
Even more surreal: its all-time high is as high as $0.233, yet the current price hasn’t even reached half of that. Is it a value rebound or a bubble about to burst? No one knows. The AMA event just ended, and the founder’s promises in the big speech haven’t even cooled off, yet the market already handed out a surprise party.
Below is a brief short-selling action plan:
1. Core logic: bet on mean reversion
RSI near 100 indicates extreme overbought. Historically, this kind of pattern is often followed by a sharp pullback or a sudden dump. Your goal is to capture the downside after the sentiment tide retreats.
2. Entry timing: right-side trading (key)
- Don’t short the top from the left side: even if it’s surging wildly, as long as it’s still pumping, don’t short. “Irrational exuberance” can double the price and then double again—leaving shorts liquidated.
- Wait for a signal: you must wait until the candlestick shows a clear upper wick, a bearish engulfing pattern (bearish engulfing), or after a break below the short-term moving average on an hourly basis—then enter with a small position.
3. Position size & stop-loss: strict risk control
- Small position trial: this kind of “meme妖” coin is extremely volatile; it’s recommended to use a very small allocation (e.g., 5%-10% of total capital).
- Hard stop-loss: set it slightly above the high of the previous big bullish candle. If the price breaks the new high, immediately take the loss and exit—never hold through it.
One-sentence summary: Don’t catch the rabbit before it runs—wait for the rally to weaken, then act; set a stop-loss to avoid getting squeezed; move fast in and out to profit from the pullback.
This BANK coin rally is absolutely more thrilling than a roller coaster! A one-day surge of 91%—the price rocketed from $0.022 all the way to $0.134. On the weekly chart, that towering green candle makes your adrenaline spike. The RSI indicator even hit 99 directly; the market sentiment is blazing hot, like it’s about to break the sky in the next second.
But don’t just get carried away—risk is quietly lurking as well. Token detection shows it has a little “minting permission” tail, which means the project team could start printing money and diluting your returns at any time. While no blacklists or trading halts have been found—those fatal traps—this minting feature is still like a sword of Damocles hanging overhead.
Even more surreal: its all-time high is as high as $0.233, yet the current price hasn’t even reached half of that. Is it a value rebound or a bubble about to burst? No one knows. The AMA event just ended, and the founder’s promises in the big speech haven’t even cooled off, yet the market already handed out a surprise party.
Below is a brief short-selling action plan:
1. Core logic: bet on mean reversion
RSI near 100 indicates extreme overbought. Historically, this kind of pattern is often followed by a sharp pullback or a sudden dump. Your goal is to capture the downside after the sentiment tide retreats.
2. Entry timing: right-side trading (key)
- Don’t short the top from the left side: even if it’s surging wildly, as long as it’s still pumping, don’t short. “Irrational exuberance” can double the price and then double again—leaving shorts liquidated.
- Wait for a signal: you must wait until the candlestick shows a clear upper wick, a bearish engulfing pattern (bearish engulfing), or after a break below the short-term moving average on an hourly basis—then enter with a small position.
3. Position size & stop-loss: strict risk control
- Small position trial: this kind of “meme妖” coin is extremely volatile; it’s recommended to use a very small allocation (e.g., 5%-10% of total capital).
- Hard stop-loss: set it slightly above the high of the previous big bullish candle. If the price breaks the new high, immediately take the loss and exit—never hold through it.
One-sentence summary: Don’t catch the rabbit before it runs—wait for the rally to weaken, then act; set a stop-loss to avoid getting squeezed; move fast in and out to profit from the pullback.
5
4.6k
Log in to explore more content
Join global crypto users on Binance Square
⚡️ Get latest and useful information about crypto.
💬 Trusted by the world’s largest crypto exchange.
👍 Discover real insights from verified creators.
Email / Phone number
Trending Topics
BinancePick
2.7M views
144,821 Discussing
Join #EarningsSeason: Predict Earnings on Binance Pick, Share Your Take on Binance Square!
Binance Square Official
·403 Likes
·339.6k views
EarningsSeason
5.1M views
24,823 Discussing
SouthKoreaReportedlyWeighsFourthCryptoTaxDelay
4,592 views
180 Discussing