

赚够1亿U
156 Posts

赚够1亿U
Report
Block User
主做XAU15分钟波段|目标1亿U|随缘直播|其他平台同名

BNB Holder
Frequent Trader
1.9 Years
3 Following
75 Followers
56 Liked
Posts
All
Live
·
--
It feels like the market trends of $XAU lately have been really hard to trade. I wanted to check how the daily candlesticks are moving, but it looks like the daily candlestick is giving me the middle finger 🖕
{future}(XAUUSDT)
It feels like the market trends of $XAU lately have been really hard to trade. I wanted to check how the daily candlesticks are moving, but it looks like the daily candlestick is giving me the middle finger 🖕
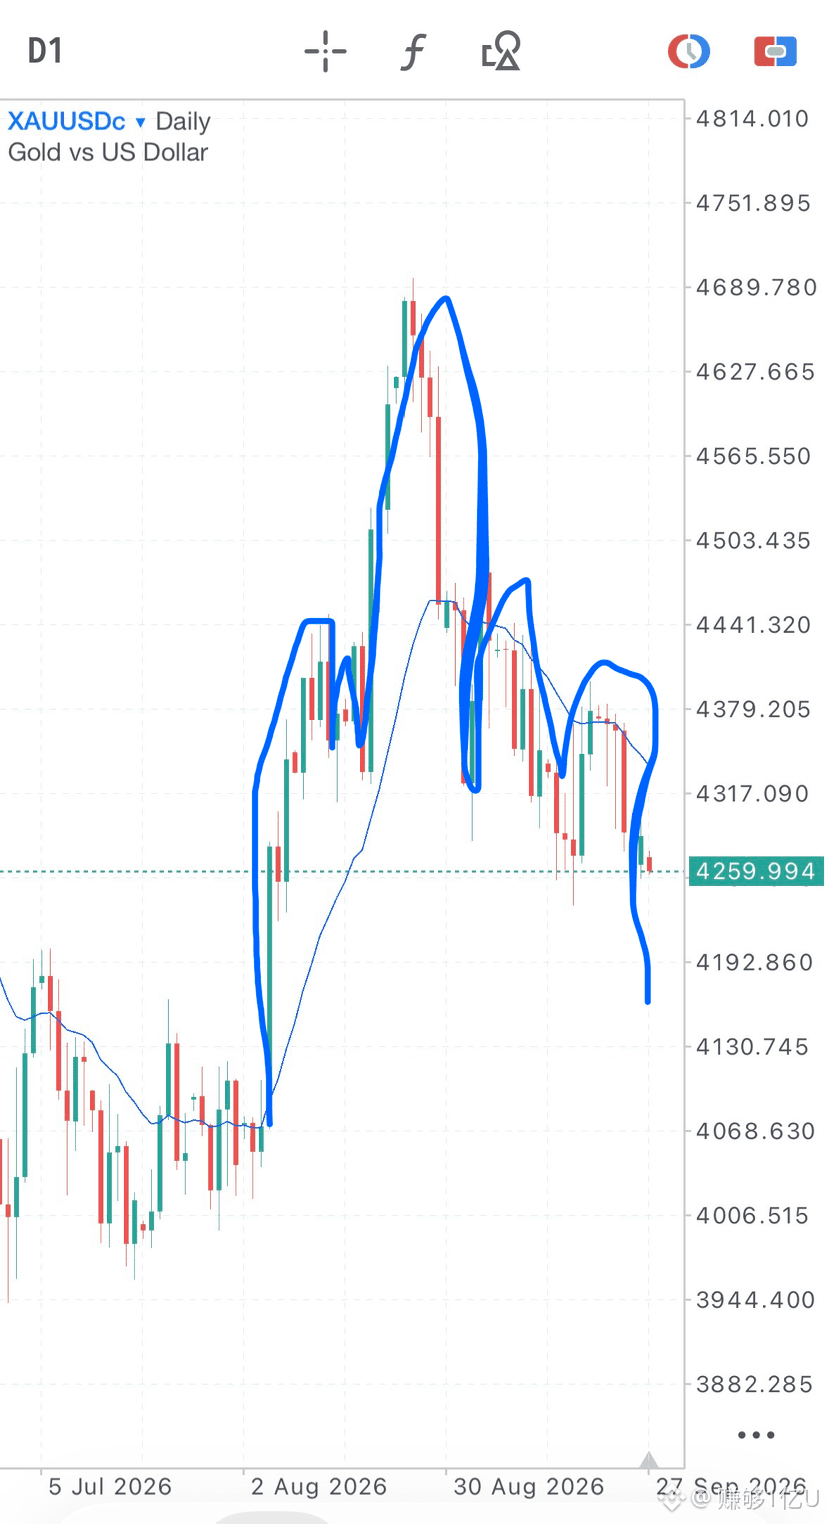
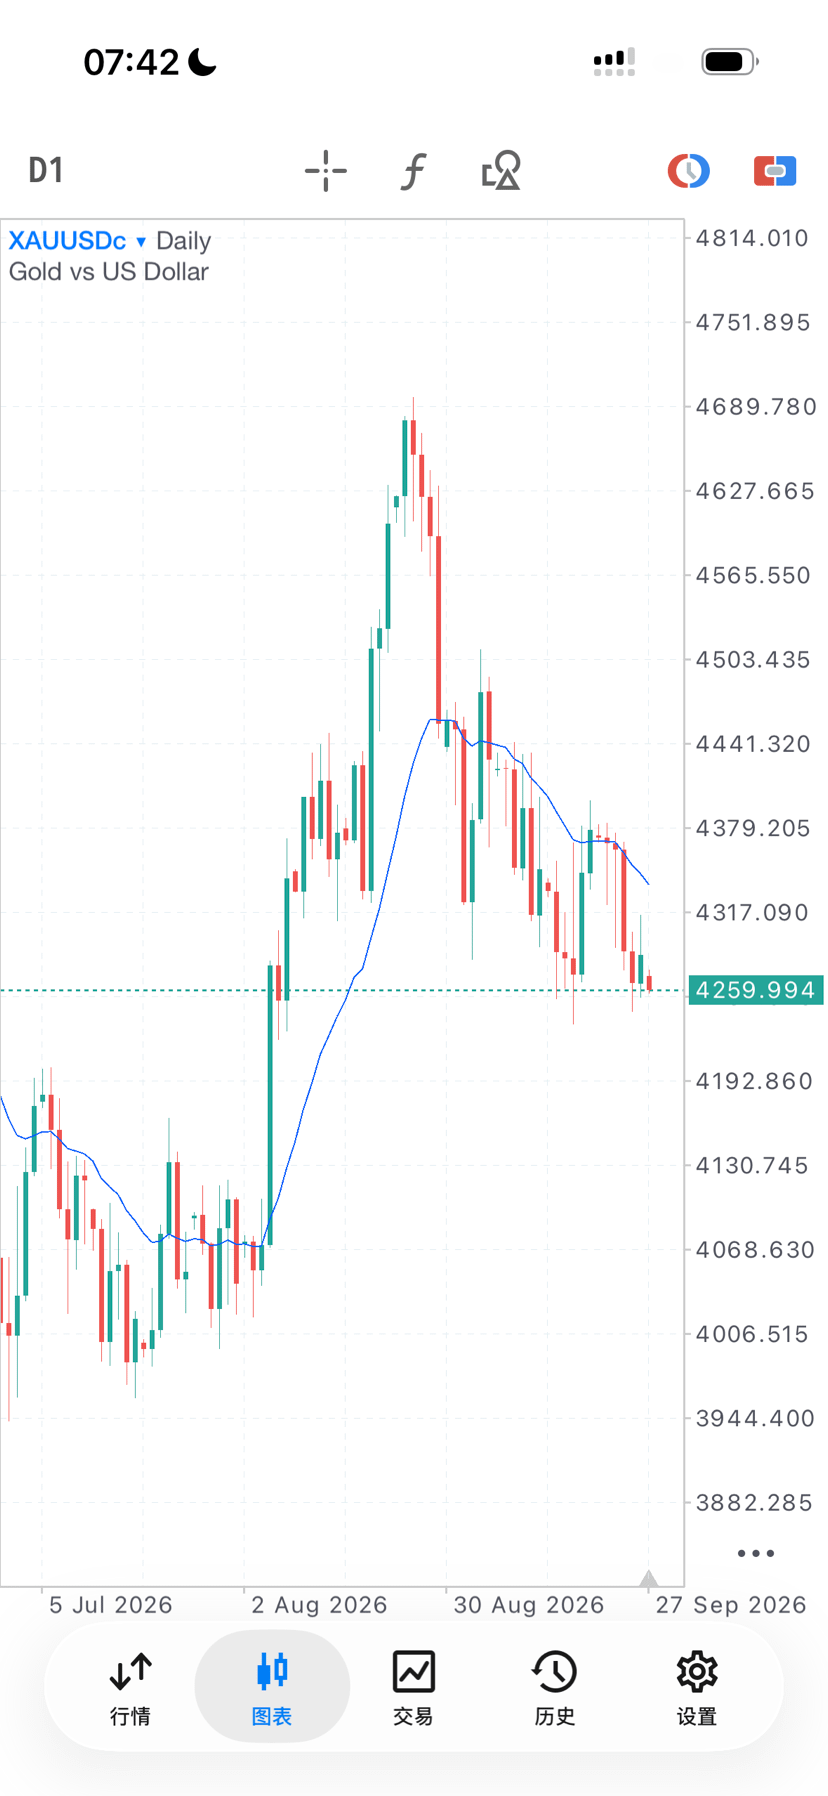
2
262
·
--
Verified
A $820 million unlock releases only 4%, yet HYPE whales keep piling into staking—on-chain data reveals the real truth behind the unlock panic# A $820 million unlock releases only 4%, yet HYPE whales keep piling into staking—on-chain data reveals the real truth behind the unlock panic
On September 6, Hyperliquid unlocked HYPE tokens worth $820 million, and the market was in panic. But the truth on-chain shows you is this: of the $820 million, only 4% actually entered circulation. At the same time, a whale address just spent $35.10 million to stake HYPE.
## Unlocking digits is scary; the on-chain release rate is the real story
According to Tokenomist data, on September 6, the HYPE core contributor unlock plan had a size of $8.4688 million (note: here the reference is the USD value corresponding to the token quantity; the actual unlock is about 9.92 million HYPE). However, only $36.56 million was actually released to the market—meaning the release rate was just 0.19%.
A $820 million unlock releases only 4%, yet HYPE whales keep piling into staking—on-chain data reveals the real truth behind the unlock panic
# A $820 million unlock releases only 4%, yet HYPE whales keep piling into staking—on-chain data reveals the real truth behind the unlock panic
On September 6, Hyperliquid unlocked HYPE tokens worth $820 million, and the market was in panic. But the truth on-chain shows you is this: of the $820 million, only 4% actually entered circulation. At the same time, a whale address just spent $35.10 million to stake HYPE.
## Unlocking digits is scary; the on-chain release rate is the real story
According to Tokenomist data, on September 6, the HYPE core contributor unlock plan had a size of $8.4688 million (note: here the reference is the USD value corresponding to the token quantity; the actual unlock is about 9.92 million HYPE). However, only $36.56 million was actually released to the market—meaning the release rate was just 0.19%.
On September 6, Hyperliquid unlocked HYPE tokens worth $820 million, and the market was in panic. But the truth on-chain shows you is this: of the $820 million, only 4% actually entered circulation. At the same time, a whale address just spent $35.10 million to stake HYPE.
## Unlocking digits is scary; the on-chain release rate is the real story
According to Tokenomist data, on September 6, the HYPE core contributor unlock plan had a size of $8.4688 million (note: here the reference is the USD value corresponding to the token quantity; the actual unlock is about 9.92 million HYPE). However, only $36.56 million was actually released to the market—meaning the release rate was just 0.19%.
1.2k
·
--
Partly True
PUMP Burns $430,000 Worth of Tokens Per Day on Average, Yet Whales Add 62.75 Million: Who Wins the Tug-of-War Between Buybacks and Unlocks?# PUMP Burns $430,000 Worth of Tokens Per Day on Average, Yet Whales Add 62.75 Million: Who Wins the Tug-of-War Between Buybacks and Unlocks?
What to watch most on-chain in September isn’t the BTC price, but a “supply-demand tug-of-war” happening with PUMP tokens—on one side, the protocol burns $430,000 worth of tokens every day; on the other, new tokens worth $35 million that were just unlocked on September 12.
## Giant Whales Accumulate Against the Tide: 62.75 Million PUMP Tokens Flood Into Big Wallets
According to Nansen on-chain data, in early September, giant whale wallets increased their holdings by 62.75 million PUMP tokens while the PUMP price fell by 3.5%. The value was approximately $2.72 million. Even more noteworthy is that the new wallets saw a net inflow of $1.83 million during the same period, while exchange balances flipped from a net outflow of $885,000 to a net inflow of $739,000.
PUMP Burns $430,000 Worth of Tokens Per Day on Average, Yet Whales Add 62.75 Million: Who Wins the Tug-of-War Between Buybacks and Unlocks?
# PUMP Burns $430,000 Worth of Tokens Per Day on Average, Yet Whales Add 62.75 Million: Who Wins the Tug-of-War Between Buybacks and Unlocks?
What to watch most on-chain in September isn’t the BTC price, but a “supply-demand tug-of-war” happening with PUMP tokens—on one side, the protocol burns $430,000 worth of tokens every day; on the other, new tokens worth $35 million that were just unlocked on September 12.
## Giant Whales Accumulate Against the Tide: 62.75 Million PUMP Tokens Flood Into Big Wallets
According to Nansen on-chain data, in early September, giant whale wallets increased their holdings by 62.75 million PUMP tokens while the PUMP price fell by 3.5%. The value was approximately $2.72 million. Even more noteworthy is that the new wallets saw a net inflow of $1.83 million during the same period, while exchange balances flipped from a net outflow of $885,000 to a net inflow of $739,000.
What to watch most on-chain in September isn’t the BTC price, but a “supply-demand tug-of-war” happening with PUMP tokens—on one side, the protocol burns $430,000 worth of tokens every day; on the other, new tokens worth $35 million that were just unlocked on September 12.
## Giant Whales Accumulate Against the Tide: 62.75 Million PUMP Tokens Flood Into Big Wallets
According to Nansen on-chain data, in early September, giant whale wallets increased their holdings by 62.75 million PUMP tokens while the PUMP price fell by 3.5%. The value was approximately $2.72 million. Even more noteworthy is that the new wallets saw a net inflow of $1.83 million during the same period, while exchange balances flipped from a net outflow of $885,000 to a net inflow of $739,000.
1
2
1.2k
·
--
Why staying in cash is also a type of trading
Taking 500 as the example principal
A and B were both waiting for an opportunity to make 100. But before that happened, A couldn’t control himself and made random trades, causing his principal to drop to 300. B, on the other hand, didn’t wait for his signal and made a firm decision not to open a position. Finally, when the market move came, both A and B got what they wanted and managed to earn 100.
At this point, A’s capital is 400, while B’s capital is 600. The difference between the two is 200. And this 200 is the profit brought by staying in cash.
Why staying in cash is also a type of trading
Taking 500 as the example principal
A and B were both waiting for an opportunity to make 100. But before that happened, A couldn’t control himself and made random trades, causing his principal to drop to 300. B, on the other hand, didn’t wait for his signal and made a firm decision not to open a position. Finally, when the market move came, both A and B got what they wanted and managed to earn 100.
At this point, A’s capital is 400, while B’s capital is 600. The difference between the two is 200. And this 200 is the profit brought by staying in cash.
Taking 500 as the example principal
A and B were both waiting for an opportunity to make 100. But before that happened, A couldn’t control himself and made random trades, causing his principal to drop to 300. B, on the other hand, didn’t wait for his signal and made a firm decision not to open a position. Finally, when the market move came, both A and B got what they wanted and managed to earn 100.
At this point, A’s capital is 400, while B’s capital is 600. The difference between the two is 200. And this 200 is the profit brought by staying in cash.
1.3k
·
--
CPI release within 24 hours: It only beat by 0.1 percentage points, yet the probability of further rate hikes surged to 85%—why didn’t crypto crash?# CPI release within 24 hours: It only beat by 0.1 percentage points, yet the probability of further rate hikes surged to 85%—why didn’t crypto crash?
Last night at 20:30, the August CPI was released. Among all the numbers, **only one was not up to standard**.
| Indicator | Actual | Forecast | Result |
|---|---|---|---|
| Overall CPI YoY | 3.4% | 3.4% | ✅ Kept in line with July |
| Overall CPI MoM | 0.4% | 0.4% | ✅ |
| Core CPI YoY | **2.4%** | 2.4% | ✅ **Lowest since 2021** |
| **Core CPI MoM** | **0.3%** | 0.2% | ❌ **Came in 0.1 percentage point above expectations** |
Headline inflation cooled, core annual rate hit a new low since 2021, and three out of four figures met expectations—yet the market only focused on that one 0.3%.
CPI release within 24 hours: It only beat by 0.1 percentage points, yet the probability of further rate hikes surged to 85%—why didn’t crypto crash?
# CPI release within 24 hours: It only beat by 0.1 percentage points, yet the probability of further rate hikes surged to 85%—why didn’t crypto crash?
Last night at 20:30, the August CPI was released. Among all the numbers, **only one was not up to standard**.
| Indicator | Actual | Forecast | Result |
|---|---|---|---|
| Overall CPI YoY | 3.4% | 3.4% | ✅ Kept in line with July |
| Overall CPI MoM | 0.4% | 0.4% | ✅ |
| Core CPI YoY | **2.4%** | 2.4% | ✅ **Lowest since 2021** |
| **Core CPI MoM** | **0.3%** | 0.2% | ❌ **Came in 0.1 percentage point above expectations** |
Headline inflation cooled, core annual rate hit a new low since 2021, and three out of four figures met expectations—yet the market only focused on that one 0.3%.
Last night at 20:30, the August CPI was released. Among all the numbers, **only one was not up to standard**.
| Indicator | Actual | Forecast | Result |
|---|---|---|---|
| Overall CPI YoY | 3.4% | 3.4% | ✅ Kept in line with July |
| Overall CPI MoM | 0.4% | 0.4% | ✅ |
| Core CPI YoY | **2.4%** | 2.4% | ✅ **Lowest since 2021** |
| **Core CPI MoM** | **0.3%** | 0.2% | ❌ **Came in 0.1 percentage point above expectations** |
Headline inflation cooled, core annual rate hit a new low since 2021, and three out of four figures met expectations—yet the market only focused on that one 0.3%.
264
·
--
CPI—bright and dark with equal intensity: core MoM at 0.3% barely crosses the line, and the rate-hike odds surge to 90%**CPI—bright and dark with equal intensity: core MoM at 0.3% barely crosses the line, and the rate-hike odds surge to 90%**
At 20:30 Beijing time on September 11, the U.S. Department of Labor released the August CPI. Four figures: three neatly landed right on the forecast line, and one quietly broke through the threshold:
| Indicator | Actual | Expected | Previous |
|---|---|---|---|
| Overall CPI YoY | **3.4%** | 3.4% | 3.4% |
| Overall CPI MoM | **0.4%** | 0.4% | 0.1% |
| Core CPI YoY | **2.4%** | 2.4% | 2.5% |
| Core CPI MoM | **0.3%** | 0.2% | — |
If you only look at the first row—CPI YoY at 3.4%, unchanged from July, and exactly matching market expectations down to the letter—you’ll most likely come to the conclusion that it’s "dull and unremarkable."
CPI—bright and dark with equal intensity: core MoM at 0.3% barely crosses the line, and the rate-hike odds surge to 90%
**CPI—bright and dark with equal intensity: core MoM at 0.3% barely crosses the line, and the rate-hike odds surge to 90%**
At 20:30 Beijing time on September 11, the U.S. Department of Labor released the August CPI. Four figures: three neatly landed right on the forecast line, and one quietly broke through the threshold:
| Indicator | Actual | Expected | Previous |
|---|---|---|---|
| Overall CPI YoY | **3.4%** | 3.4% | 3.4% |
| Overall CPI MoM | **0.4%** | 0.4% | 0.1% |
| Core CPI YoY | **2.4%** | 2.4% | 2.5% |
| Core CPI MoM | **0.3%** | 0.2% | — |
If you only look at the first row—CPI YoY at 3.4%, unchanged from July, and exactly matching market expectations down to the letter—you’ll most likely come to the conclusion that it’s "dull and unremarkable."
At 20:30 Beijing time on September 11, the U.S. Department of Labor released the August CPI. Four figures: three neatly landed right on the forecast line, and one quietly broke through the threshold:
| Indicator | Actual | Expected | Previous |
|---|---|---|---|
| Overall CPI YoY | **3.4%** | 3.4% | 3.4% |
| Overall CPI MoM | **0.4%** | 0.4% | 0.1% |
| Core CPI YoY | **2.4%** | 2.4% | 2.5% |
| Core CPI MoM | **0.3%** | 0.2% | — |
If you only look at the first row—CPI YoY at 3.4%, unchanged from July, and exactly matching market expectations down to the letter—you’ll most likely come to the conclusion that it’s "dull and unremarkable."
452
·
--
#1 in the whole market this week: Raydium’s buyback address has already accumulated 30% of the circulating supply—an infinite motion machine that buys more as it goes up# Biggest gainer across the whole market this week (+68%): Raydium’s buyback address has already accumulated 30% of the circulating supply—an "infinite motion machine" that buys more as it goes up.
The crypto market’s weekly gainers list has been refreshed. Most of the top ten are familiar faces rotating in and out, but the #1 spot might be one you haven’t paid much attention to—**Raydium (RAY), up 68.5% over 7 days, crowned the weekly gainer among the top 100 by market cap**, with another 18.6% increase in the past 24 hours.
And the underlying logic behind its rise is the most "mechanical" kind in the entire DeFi space: **trading volume → transaction fees → automatic buybacks**—no human intervention throughout, and everything is openly verifiable on-chain.
#1 in the whole market this week: Raydium’s buyback address has already accumulated 30% of the circulating supply—an infinite motion machine that buys more as it goes up
# Biggest gainer across the whole market this week (+68%): Raydium’s buyback address has already accumulated 30% of the circulating supply—an "infinite motion machine" that buys more as it goes up.
The crypto market’s weekly gainers list has been refreshed. Most of the top ten are familiar faces rotating in and out, but the #1 spot might be one you haven’t paid much attention to—**Raydium (RAY), up 68.5% over 7 days, crowned the weekly gainer among the top 100 by market cap**, with another 18.6% increase in the past 24 hours.
And the underlying logic behind its rise is the most "mechanical" kind in the entire DeFi space: **trading volume → transaction fees → automatic buybacks**—no human intervention throughout, and everything is openly verifiable on-chain.
The crypto market’s weekly gainers list has been refreshed. Most of the top ten are familiar faces rotating in and out, but the #1 spot might be one you haven’t paid much attention to—**Raydium (RAY), up 68.5% over 7 days, crowned the weekly gainer among the top 100 by market cap**, with another 18.6% increase in the past 24 hours.
And the underlying logic behind its rise is the most "mechanical" kind in the entire DeFi space: **trading volume → transaction fees → automatic buybacks**—no human intervention throughout, and everything is openly verifiable on-chain.
178
·
--
Data came out last night: PPI beats expectations while employment still shows resilience—this worst-case combination pushes the rate-hike probability to 73%, and BTC falls to $76,000Data came out last night: PPI beat expectations and employment still has resilience—this "worst-case combination" pushes the rate-hike probability to 73%, and BTC falls to $76,000
Last night (Sep 10) at 20:30, both data releases came out—and the outcome wasn’t very friendly. They form the kind of combination the Fed least wants to see.
**First, look at the actual data: inflation rebounds while employment holds firm**
**PPI (August Producer Price Index) comes in above expectations: **
- Year-on-year **5.4%** (forecast 5.3%, prior 4.7%)
- Month-on-month **+0.4%** (in line with expectations, but the prior value was only 0.1%; this is the largest increase since May)
- Core PPI year-on-year **4.6%** (in line with expectations, but higher than the revised 4.3%) — this is the third-highest reading of 2026, just 0.3% shy of the level reached more than three years ago
Data came out last night: PPI beats expectations while employment still shows resilience—this worst-case combination pushes the rate-hike probability to 73%, and BTC falls to $76,000
Data came out last night: PPI beat expectations and employment still has resilience—this "worst-case combination" pushes the rate-hike probability to 73%, and BTC falls to $76,000
Last night (Sep 10) at 20:30, both data releases came out—and the outcome wasn’t very friendly. They form the kind of combination the Fed least wants to see.
**First, look at the actual data: inflation rebounds while employment holds firm**
**PPI (August Producer Price Index) comes in above expectations: **
- Year-on-year **5.4%** (forecast 5.3%, prior 4.7%)
- Month-on-month **+0.4%** (in line with expectations, but the prior value was only 0.1%; this is the largest increase since May)
- Core PPI year-on-year **4.6%** (in line with expectations, but higher than the revised 4.3%) — this is the third-highest reading of 2026, just 0.3% shy of the level reached more than three years ago
Last night (Sep 10) at 20:30, both data releases came out—and the outcome wasn’t very friendly. They form the kind of combination the Fed least wants to see.
**First, look at the actual data: inflation rebounds while employment holds firm**
**PPI (August Producer Price Index) comes in above expectations: **
- Year-on-year **5.4%** (forecast 5.3%, prior 4.7%)
- Month-on-month **+0.4%** (in line with expectations, but the prior value was only 0.1%; this is the largest increase since May)
- Core PPI year-on-year **4.6%** (in line with expectations, but higher than the revised 4.3%) — this is the third-highest reading of 2026, just 0.3% shy of the level reached more than three years ago
131
·
--
APT unlocks 11.31 million tokens today: a $7.0 million potential sell pressure, but on-chain data reveals warmth# APT unlocks 11.31 million tokens today: a $7.0 million potential sell pressure, but on-chain data reveals warmth
On September 11, Aptos will unlock 11.31 million $APT tokens, with a nominal value of about $7.0 million. By common logic, large unlocks often come with sell pressure; however, on-chain daily active addresses rose by 53% over the past week, daily transaction volume has remained steady at around 6.5 million, and the total number of transactions across the network is approaching 5 billion. Is the market digesting it in advance, or is someone secretly stocking up?
## I. Unlocking Scale and Allocation: How big is the sell pressure really?
First, take a clear look at the cards being unlocked this time. According to Token Unlocks and Tokenomist data, 11.31 million APT tokens will be released, accounting for about 0.65% of the current circulating supply. The allocation is as follows:
APT unlocks 11.31 million tokens today: a $7.0 million potential sell pressure, but on-chain data reveals warmth
# APT unlocks 11.31 million tokens today: a $7.0 million potential sell pressure, but on-chain data reveals warmth
On September 11, Aptos will unlock 11.31 million $APT tokens, with a nominal value of about $7.0 million. By common logic, large unlocks often come with sell pressure; however, on-chain daily active addresses rose by 53% over the past week, daily transaction volume has remained steady at around 6.5 million, and the total number of transactions across the network is approaching 5 billion. Is the market digesting it in advance, or is someone secretly stocking up?
## I. Unlocking Scale and Allocation: How big is the sell pressure really?
First, take a clear look at the cards being unlocked this time. According to Token Unlocks and Tokenomist data, 11.31 million APT tokens will be released, accounting for about 0.65% of the current circulating supply. The allocation is as follows:
On September 11, Aptos will unlock 11.31 million $APT tokens, with a nominal value of about $7.0 million. By common logic, large unlocks often come with sell pressure; however, on-chain daily active addresses rose by 53% over the past week, daily transaction volume has remained steady at around 6.5 million, and the total number of transactions across the network is approaching 5 billion. Is the market digesting it in advance, or is someone secretly stocking up?
## I. Unlocking Scale and Allocation: How big is the sell pressure really?
First, take a clear look at the cards being unlocked this time. According to Token Unlocks and Tokenomist data, 11.31 million APT tokens will be released, accounting for about 0.65% of the current circulating supply. The allocation is as follows:
1
208
·
--
# UNI up 47% for the week: whales add 257,000 UNI, exchanges see outflows, protocol revenue breaks $10 million# UNI up 47% for the week: whales add 257,000 UNI, exchanges see outflows, protocol revenue breaks $10 million
Up 47% over the week—UNI’s rise isn’t driven by narratives, but by on-chain funds buying it in real terms.
On September 2, Nansen-labeled whale wallets collectively increased their UNI holdings. Their position rose from 3.2 million to 3.46 million UNI, an increase of 257,000 UNI in a single day, worth about $1.62 million. More importantly, the number of whale wallets holding UNI increased from 8 to 9—this suggests it’s not just old whales simply adding more; instead, a new large holder has officially entered the market. Meanwhile, new wallets saw a net inflow of $2.91 million on the day, while exchange balances decreased by 351,000 UNI. Three signals point in the same direction: large capital is moving UNI out of exchanges.
# UNI up 47% for the week: whales add 257,000 UNI, exchanges see outflows, protocol revenue breaks $10 million
# UNI up 47% for the week: whales add 257,000 UNI, exchanges see outflows, protocol revenue breaks $10 million
Up 47% over the week—UNI’s rise isn’t driven by narratives, but by on-chain funds buying it in real terms.
On September 2, Nansen-labeled whale wallets collectively increased their UNI holdings. Their position rose from 3.2 million to 3.46 million UNI, an increase of 257,000 UNI in a single day, worth about $1.62 million. More importantly, the number of whale wallets holding UNI increased from 8 to 9—this suggests it’s not just old whales simply adding more; instead, a new large holder has officially entered the market. Meanwhile, new wallets saw a net inflow of $2.91 million on the day, while exchange balances decreased by 351,000 UNI. Three signals point in the same direction: large capital is moving UNI out of exchanges.
Up 47% over the week—UNI’s rise isn’t driven by narratives, but by on-chain funds buying it in real terms.
On September 2, Nansen-labeled whale wallets collectively increased their UNI holdings. Their position rose from 3.2 million to 3.46 million UNI, an increase of 257,000 UNI in a single day, worth about $1.62 million. More importantly, the number of whale wallets holding UNI increased from 8 to 9—this suggests it’s not just old whales simply adding more; instead, a new large holder has officially entered the market. Meanwhile, new wallets saw a net inflow of $2.91 million on the day, while exchange balances decreased by 351,000 UNI. Three signals point in the same direction: large capital is moving UNI out of exchanges.
404
·
--
Partly True
Permanently burning 48.42 million tokens, worth $4.1 billion: How HYPE’s on-chain buyback machine counters a $590 million unlock surge# 永久销毁48.42 million tokens, worth 4.1 billion: How HYPE’s on-chain buyback machine counters a $590 million unlock surge
On September 6, an on-chain transaction quietly concluded: Hyperliquid’s Assistance Fund spent about $830,000 to buy 9,730 HYPE at an average price of $85.27, then permanently burned them. This isn’t a one-off action—it’s a buyback machine that never stops. To date, it has destroyed 48.42 million HYPE, accounting for 4.84% of the initial maximum supply; at current prices, that value exceeds $4.1 billion. Meanwhile, September 6 was also the month’s largest token unlock for HYPE: 9.92 million tokens, with a notional value of roughly $589 million. An on-chain tug-of-war between supply and demand is underway.
Permanently burning 48.42 million tokens, worth $4.1 billion: How HYPE’s on-chain buyback machine counters a $590 million unlock surge
# 永久销毁48.42 million tokens, worth 4.1 billion: How HYPE’s on-chain buyback machine counters a $590 million unlock surge
On September 6, an on-chain transaction quietly concluded: Hyperliquid’s Assistance Fund spent about $830,000 to buy 9,730 HYPE at an average price of $85.27, then permanently burned them. This isn’t a one-off action—it’s a buyback machine that never stops. To date, it has destroyed 48.42 million HYPE, accounting for 4.84% of the initial maximum supply; at current prices, that value exceeds $4.1 billion. Meanwhile, September 6 was also the month’s largest token unlock for HYPE: 9.92 million tokens, with a notional value of roughly $589 million. An on-chain tug-of-war between supply and demand is underway.
On September 6, an on-chain transaction quietly concluded: Hyperliquid’s Assistance Fund spent about $830,000 to buy 9,730 HYPE at an average price of $85.27, then permanently burned them. This isn’t a one-off action—it’s a buyback machine that never stops. To date, it has destroyed 48.42 million HYPE, accounting for 4.84% of the initial maximum supply; at current prices, that value exceeds $4.1 billion. Meanwhile, September 6 was also the month’s largest token unlock for HYPE: 9.92 million tokens, with a notional value of roughly $589 million. An on-chain tug-of-war between supply and demand is underway.
1
315
·
--
TVL tops Solana for the first time, yet the market cap is under $16 million: do you understand Sanctum’s on-chain signals?# TVL tops Solana for the first time, yet the market cap is under $16 million: do you understand Sanctum’s on-chain signals?
On September 9, Solana’s on-chain TVL (total value locked) hit a new all-time high of $12.1 billion. But what’s truly worth paying attention to isn’t the figure itself, but a quietly completed power shift—the liquid staking protocol Sanctum surpassed Jupiter with $1.8–$1.9 billion in TVL, becoming the largest protocol by locked value on Solana. Even more striking is that its fully diluted valuation (FDV) is only $32 million, and its circulating market cap is under $16 million. What does this mismatch—"No. 1 on-chain by status, but at the back end by market cap"—actually mean?
TVL tops Solana for the first time, yet the market cap is under $16 million: do you understand Sanctum’s on-chain signals?
# TVL tops Solana for the first time, yet the market cap is under $16 million: do you understand Sanctum’s on-chain signals?
On September 9, Solana’s on-chain TVL (total value locked) hit a new all-time high of $12.1 billion. But what’s truly worth paying attention to isn’t the figure itself, but a quietly completed power shift—the liquid staking protocol Sanctum surpassed Jupiter with $1.8–$1.9 billion in TVL, becoming the largest protocol by locked value on Solana. Even more striking is that its fully diluted valuation (FDV) is only $32 million, and its circulating market cap is under $16 million. What does this mismatch—"No. 1 on-chain by status, but at the back end by market cap"—actually mean?
On September 9, Solana’s on-chain TVL (total value locked) hit a new all-time high of $12.1 billion. But what’s truly worth paying attention to isn’t the figure itself, but a quietly completed power shift—the liquid staking protocol Sanctum surpassed Jupiter with $1.8–$1.9 billion in TVL, becoming the largest protocol by locked value on Solana. Even more striking is that its fully diluted valuation (FDV) is only $32 million, and its circulating market cap is under $16 million. What does this mismatch—"No. 1 on-chain by status, but at the back end by market cap"—actually mean?
166
·
--
Two data releases hit at 20:30 tonight at the same time: Initial Jobless Claims + PPI, the final outpost before tomorrow night’s CPITwo data releases hit at 20:30 tonight at the same time: Initial Jobless Claims + PPI, the final outpost before tomorrow night’s CPI
Tonight (September 10) at 20:30 Beijing time, the U.S. Department of Labor will release two sets of data at once. The market is waiting for both: **the number of Initial Jobless Claims for the week ending September 5**, and **August PPI (Producer Price Index)**.
Why have these two pieces of data suddenly become sensitive? Because they’re positioned in a critical time window: there is only one day between them and tomorrow night’s CPI (9/11), and only six days between them and the Federal Reserve interest rate decision on September 16. The market is currently pricing a September rate hike at 58%-60%—tonight’s data may become the first weight that either tips or supports this expectation.
Two data releases hit at 20:30 tonight at the same time: Initial Jobless Claims + PPI, the final outpost before tomorrow night’s CPI
Two data releases hit at 20:30 tonight at the same time: Initial Jobless Claims + PPI, the final outpost before tomorrow night’s CPI
Tonight (September 10) at 20:30 Beijing time, the U.S. Department of Labor will release two sets of data at once. The market is waiting for both: **the number of Initial Jobless Claims for the week ending September 5**, and **August PPI (Producer Price Index)**.
Why have these two pieces of data suddenly become sensitive? Because they’re positioned in a critical time window: there is only one day between them and tomorrow night’s CPI (9/11), and only six days between them and the Federal Reserve interest rate decision on September 16. The market is currently pricing a September rate hike at 58%-60%—tonight’s data may become the first weight that either tips or supports this expectation.
Tonight (September 10) at 20:30 Beijing time, the U.S. Department of Labor will release two sets of data at once. The market is waiting for both: **the number of Initial Jobless Claims for the week ending September 5**, and **August PPI (Producer Price Index)**.
Why have these two pieces of data suddenly become sensitive? Because they’re positioned in a critical time window: there is only one day between them and tomorrow night’s CPI (9/11), and only six days between them and the Federal Reserve interest rate decision on September 16. The market is currently pricing a September rate hike at 58%-60%—tonight’s data may become the first weight that either tips or supports this expectation.
98
·
--
WLD surges 16% in a single day: a U.S. stock company has scooped up 8.4% of the float, turning it into an OpenAI listing proxyWLD surges 16% in a single day: a U.S. stock company has scooped up 8.4% of the float, turning it into an "OpenAI listing proxy"
Crypto markets are broadly up today, but the AI sector is clearly moving faster (sector index up 4.17%). Among them, $WLD surged 16.19% in a single day; trading volume over 24 hours hit $1.25 billion, and the cumulative monthly gain is already about 180%.
Why did a "digital identity" project suddenly become a hot commodity in the market? The answer is hidden in three things—one U.S. stock company stockpiling large amounts of coins, an upcoming OpenAI IPO, and a 43% production cut.
**Catalyst 1: A Nasdaq-listed company has hoarded 8.4% of the float**
WLD surges 16% in a single day: a U.S. stock company has scooped up 8.4% of the float, turning it into an OpenAI listing proxy
WLD surges 16% in a single day: a U.S. stock company has scooped up 8.4% of the float, turning it into an "OpenAI listing proxy"
Crypto markets are broadly up today, but the AI sector is clearly moving faster (sector index up 4.17%). Among them, $WLD surged 16.19% in a single day; trading volume over 24 hours hit $1.25 billion, and the cumulative monthly gain is already about 180%.
Why did a "digital identity" project suddenly become a hot commodity in the market? The answer is hidden in three things—one U.S. stock company stockpiling large amounts of coins, an upcoming OpenAI IPO, and a 43% production cut.
**Catalyst 1: A Nasdaq-listed company has hoarded 8.4% of the float**
Crypto markets are broadly up today, but the AI sector is clearly moving faster (sector index up 4.17%). Among them, $WLD surged 16.19% in a single day; trading volume over 24 hours hit $1.25 billion, and the cumulative monthly gain is already about 180%.
Why did a "digital identity" project suddenly become a hot commodity in the market? The answer is hidden in three things—one U.S. stock company stockpiling large amounts of coins, an upcoming OpenAI IPO, and a 43% production cut.
**Catalyst 1: A Nasdaq-listed company has hoarded 8.4% of the float**
1
280
·
--
Verified
In two weeks, it pulled in $500 million—ZEC’s 45% surge is driven by far more than just an ETF.It drew $500 million in two weeks. The underlying logic behind ZEC’s 45% surge is far more than just an ETF.
A privacy coin that was once declared “dead” three times is using real money to slap everyone in the face.
While the market is still chasing AI, memes, and RWA, Zcash (ZEC) quietly pulled off one of this year’s most brutal altcoin rallies: up 45% week-over-week, up 138% in 30 days, and up 19x over the past year. The price surged to $1,180, hitting its highest level since 2016. Its market cap surpassed $20 billion, pushing it into the top ten of crypto by market value.
This isn’t meme-style speculative frenzy. The underlying logic behind ZEC’s explosive run is harder than that of 90% of altcoins.
In two weeks, it pulled in $500 million—ZEC’s 45% surge is driven by far more than just an ETF.
It drew $500 million in two weeks. The underlying logic behind ZEC’s 45% surge is far more than just an ETF.
A privacy coin that was once declared “dead” three times is using real money to slap everyone in the face.
While the market is still chasing AI, memes, and RWA, Zcash (ZEC) quietly pulled off one of this year’s most brutal altcoin rallies: up 45% week-over-week, up 138% in 30 days, and up 19x over the past year. The price surged to $1,180, hitting its highest level since 2016. Its market cap surpassed $20 billion, pushing it into the top ten of crypto by market value.
This isn’t meme-style speculative frenzy. The underlying logic behind ZEC’s explosive run is harder than that of 90% of altcoins.
A privacy coin that was once declared “dead” three times is using real money to slap everyone in the face.
While the market is still chasing AI, memes, and RWA, Zcash (ZEC) quietly pulled off one of this year’s most brutal altcoin rallies: up 45% week-over-week, up 138% in 30 days, and up 19x over the past year. The price surged to $1,180, hitting its highest level since 2016. Its market cap surpassed $20 billion, pushing it into the top ten of crypto by market value.
This isn’t meme-style speculative frenzy. The underlying logic behind ZEC’s explosive run is harder than that of 90% of altcoins.
407
·
--
Deposits top $30 billion, up 15% week-over-week: Why is AAVE this time the 'major uptrend' leader in the DeFi sector?September 10, the total crypto market cap surged past $2.73 trillion. The market was broadly up, but what truly caught the attention of long-time players wasn’t BTC or ETH—it was the DeFi blue-chip that had been dormant for more than half a year: $AAVE. This week it quietly broke into a new major uptrend: +32% for all of August, and in September it kept rising to above $132. There’s still room of about 80% before it reaches its ATH, but compared with the June low point, it has already doubled.
In September, when meme coins are flying everywhere and RWA stablecoins are taking center stage, why would the token of a lending protocol become a "old-money" style safe haven for capital? Today, across four dimensions—narrative, capital flows, fundamentals, and risks—we’ll dig into AAVE’s return this time: "not pump-based, but fundamentals-based."
Deposits top $30 billion, up 15% week-over-week: Why is AAVE this time the 'major uptrend' leader in the DeFi sector?
September 10, the total crypto market cap surged past $2.73 trillion. The market was broadly up, but what truly caught the attention of long-time players wasn’t BTC or ETH—it was the DeFi blue-chip that had been dormant for more than half a year: $AAVE . This week it quietly broke into a new major uptrend: +32% for all of August, and in September it kept rising to above $132. There’s still room of about 80% before it reaches its ATH, but compared with the June low point, it has already doubled.
In September, when meme coins are flying everywhere and RWA stablecoins are taking center stage, why would the token of a lending protocol become a "old-money" style safe haven for capital? Today, across four dimensions—narrative, capital flows, fundamentals, and risks—we’ll dig into AAVE’s return this time: "not pump-based, but fundamentals-based."
In September, when meme coins are flying everywhere and RWA stablecoins are taking center stage, why would the token of a lending protocol become a "old-money" style safe haven for capital? Today, across four dimensions—narrative, capital flows, fundamentals, and risks—we’ll dig into AAVE’s return this time: "not pump-based, but fundamentals-based."
183
Log in to explore more content
Join global crypto users on Binance Square
⚡️ Get latest and useful information about crypto.
💬 Trusted by the world’s largest crypto exchange.
👍 Discover real insights from verified creators.
Email / Phone number
Trending Topics
BitcoinRejectedAt$87K
22,314 views
56 Discussing
$BTC Update 🚨 🐼 Skip THIS Warning at Your Own Risk ⚠️
BTC is knocking on 87K like it already owns the place 😂Bulls are awake… but BTC usually likes to shake a few people out before the real move.
Overall, BTC is breaking out and the higher-timeframe picture is still bullish. The 4H and daily structure are strong, price is holding above the major averages, and momentum is still supporting the move.
83K was honestly a beautiful buy location. That was the area where risk/reward made sense. Anyone who bought there is already sitting enjoying profit
Now come to main
BTC is sitting right under the previous high around 87K. So I would not be surprised if we first see a little downside liquidity grab, flush some late longs, and then BTC decides whether it wants the real breakout.
For today’s scalp, This is my Plan 👇
BTC SHORT scalp Entry: 86,550–86,900
TP1: 85,650
TP2: 84,850
TP3: 84,050
SL: 87,800
I only like this if we get a proper rejection near the highs. No blind shorting.
For the bigger picture, I’m still bullish as long as the 82.5K–83K area keeps holding. If BTC gets a clean breakout and starts accepting above 87.4K, then this whole short idea is invalid and the next bullish leg becomes much more interesting.
SO BASICALLY OCTOBER HISTORICAL IS BULLISH MONTH FOR BITCOIN.
ALWAYS DYOR
Panda Traders
·31 Likes
·12.9k views
FedOctoberRateHikeOddsFallTo17%
16,103 views
292 Discussing
NvidiaHitsRecordHighUp2.4%
3,659 views
186 Discussing