
懂得八方来财
10 Posts

懂得八方来财
1 Following
12 Followers
12 Liked
Posts
All
Quotes


交易员赵财神
·
--
2025.4.17.BTC.ETH.SOL.BNB.Intraday Market Analysis
BTC
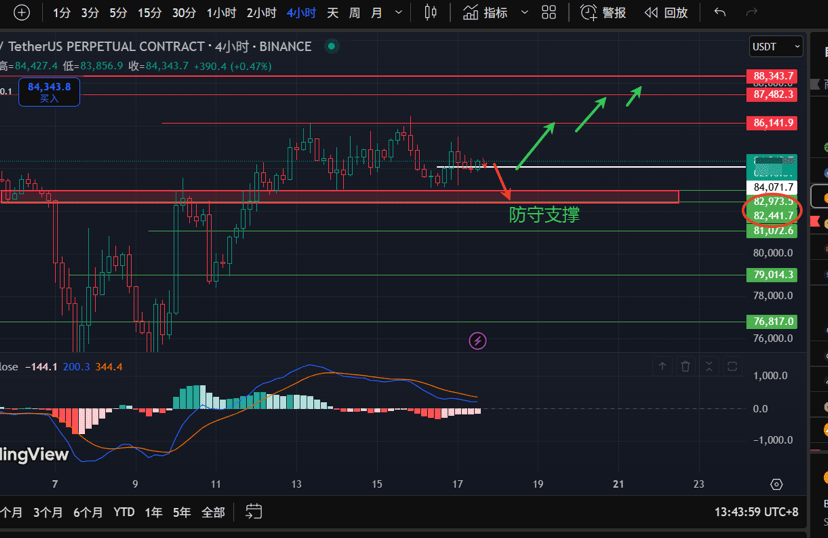
Good afternoon, brothers. This daily level of oscillation is indeed untradeable, constantly fluctuating between three thousand points. Last night's spike to 86000 didn't materialize, but thankfully, a slight pullback to 83000 did not break the defensive support. The daily rebound trend is still intact, and the overall trading strategy is still to focus on buying on dips, with a stop-loss at 82500. You can wait to enter long positions with small lots in the 84000-83500 range, with leverage within 50 times, and stop-loss at 82500. The target resistance is still looking at 86000. This position can be reduced, and if it breaks through, then look at 87500.88300. The strategy is a personal opinion and for reference only, not constituting investment advice.
ETH
The lower timeframe is starting to show an oscillating upward market. Pay attention to the small level support at 1585. As long as the hourly closing price does not fall below this position, the market can look for a rebound, with rebound target resistances at 1610, 1660, and 1690. If the hourly closing price falls below 1585, it indicates that this rebound is over, and long positions can be abandoned. Continue to watch the support below at 1550, 1505, and 1470. Steady long positions should still focus on the second and third support levels.
SOL
After SOL broke through the resistance support at 128 last night, the four-hour level drop did not break this position a second time. Currently, as long as the four-hour closing does not fall below this position, the market can continue to look for a rebound, with rebound target resistance at 135, and if it breaks through, look at 140 and 145. The rebound will only be considered over if the four-hour closing falls below 128, with target support below at 123 and 116.
BNB
The BNB defensive support at 580 remains unchanged. As long as the hourly closing does not fall below this position, the market can continue to look for a rebound, with rebound target resistance at 585 and 590. If it breaks through, look near 600. If the hourly closing falls below 580, this rebound will be over, and first look at the defensive support below at 576. If it breaks, look at 566, 555, #BTC☀ #ETH🔥🔥🔥🔥🔥🔥 #solana
BTC
Good afternoon, brothers. This daily level of oscillation is indeed untradeable, constantly fluctuating between three thousand points. Last night's spike to 86000 didn't materialize, but thankfully, a slight pullback to 83000 did not break the defensive support. The daily rebound trend is still intact, and the overall trading strategy is still to focus on buying on dips, with a stop-loss at 82500. You can wait to enter long positions with small lots in the 84000-83500 range, with leverage within 50 times, and stop-loss at 82500. The target resistance is still looking at 86000. This position can be reduced, and if it breaks through, then look at 87500.88300. The strategy is a personal opinion and for reference only, not constituting investment advice.
ETH
The lower timeframe is starting to show an oscillating upward market. Pay attention to the small level support at 1585. As long as the hourly closing price does not fall below this position, the market can look for a rebound, with rebound target resistances at 1610, 1660, and 1690. If the hourly closing price falls below 1585, it indicates that this rebound is over, and long positions can be abandoned. Continue to watch the support below at 1550, 1505, and 1470. Steady long positions should still focus on the second and third support levels.
SOL
After SOL broke through the resistance support at 128 last night, the four-hour level drop did not break this position a second time. Currently, as long as the four-hour closing does not fall below this position, the market can continue to look for a rebound, with rebound target resistance at 135, and if it breaks through, look at 140 and 145. The rebound will only be considered over if the four-hour closing falls below 128, with target support below at 123 and 116.
BNB
The BNB defensive support at 580 remains unchanged. As long as the hourly closing does not fall below this position, the market can continue to look for a rebound, with rebound target resistance at 585 and 590. If it breaks through, look near 600. If the hourly closing falls below 580, this rebound will be over, and first look at the defensive support below at 576. If it breaks, look at 566, 555, #BTC☀ #ETH🔥🔥🔥🔥🔥🔥 #solana

Jasmine Immordino VSZs
·
--
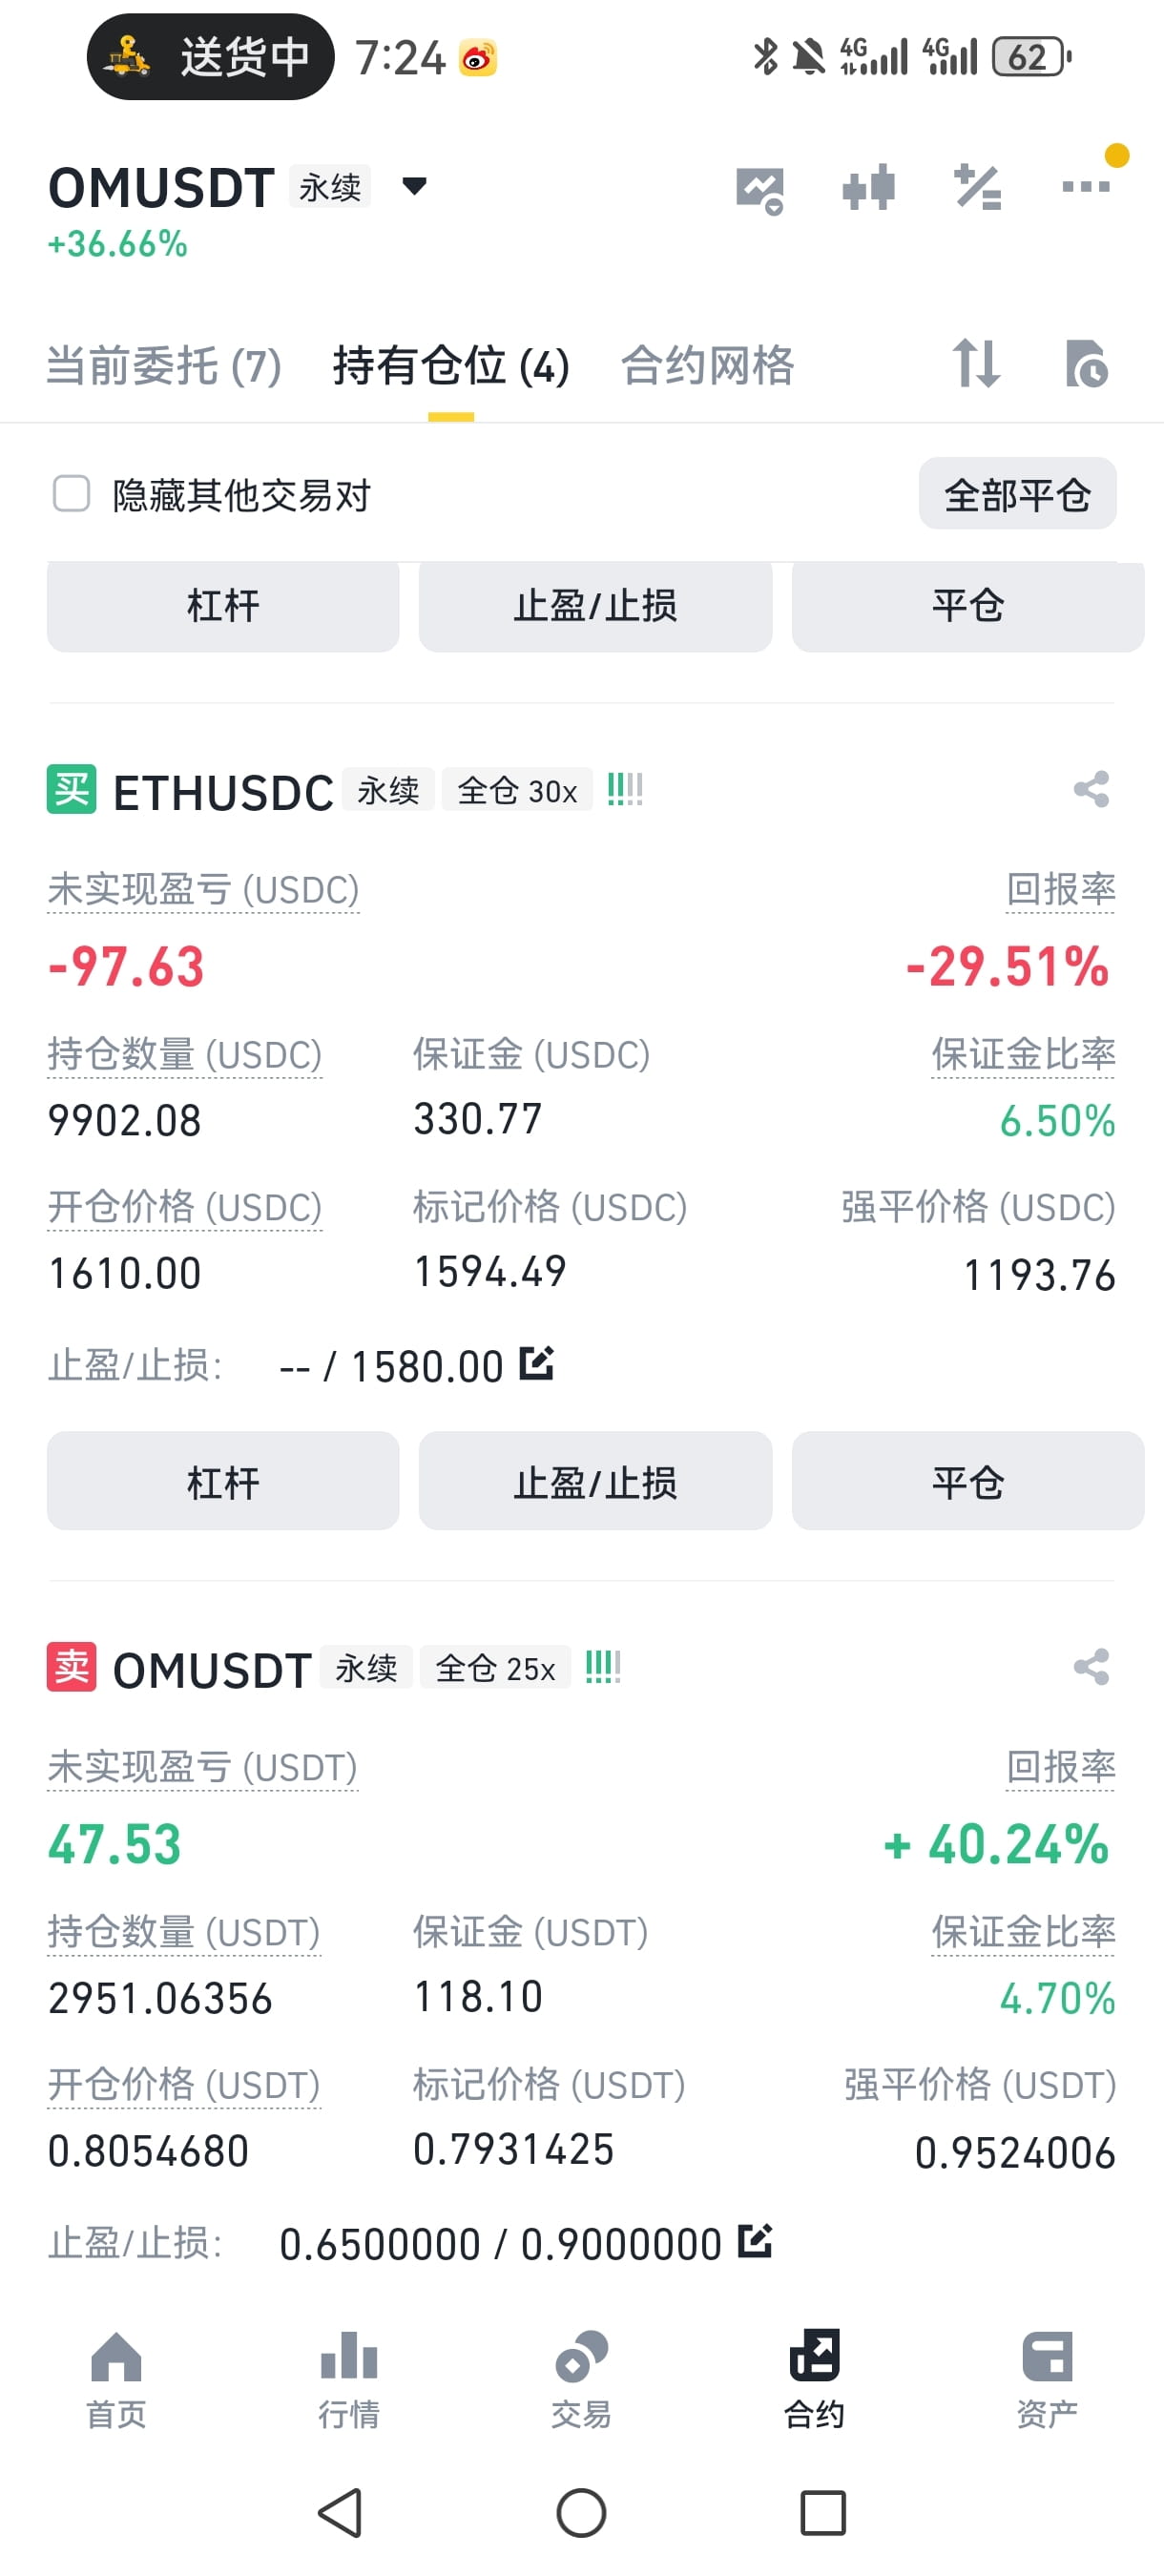
OM has already extended my life by more than 200, but the pancake and Ethereum are still down.

追日逐光
·
--
Bullish🚀
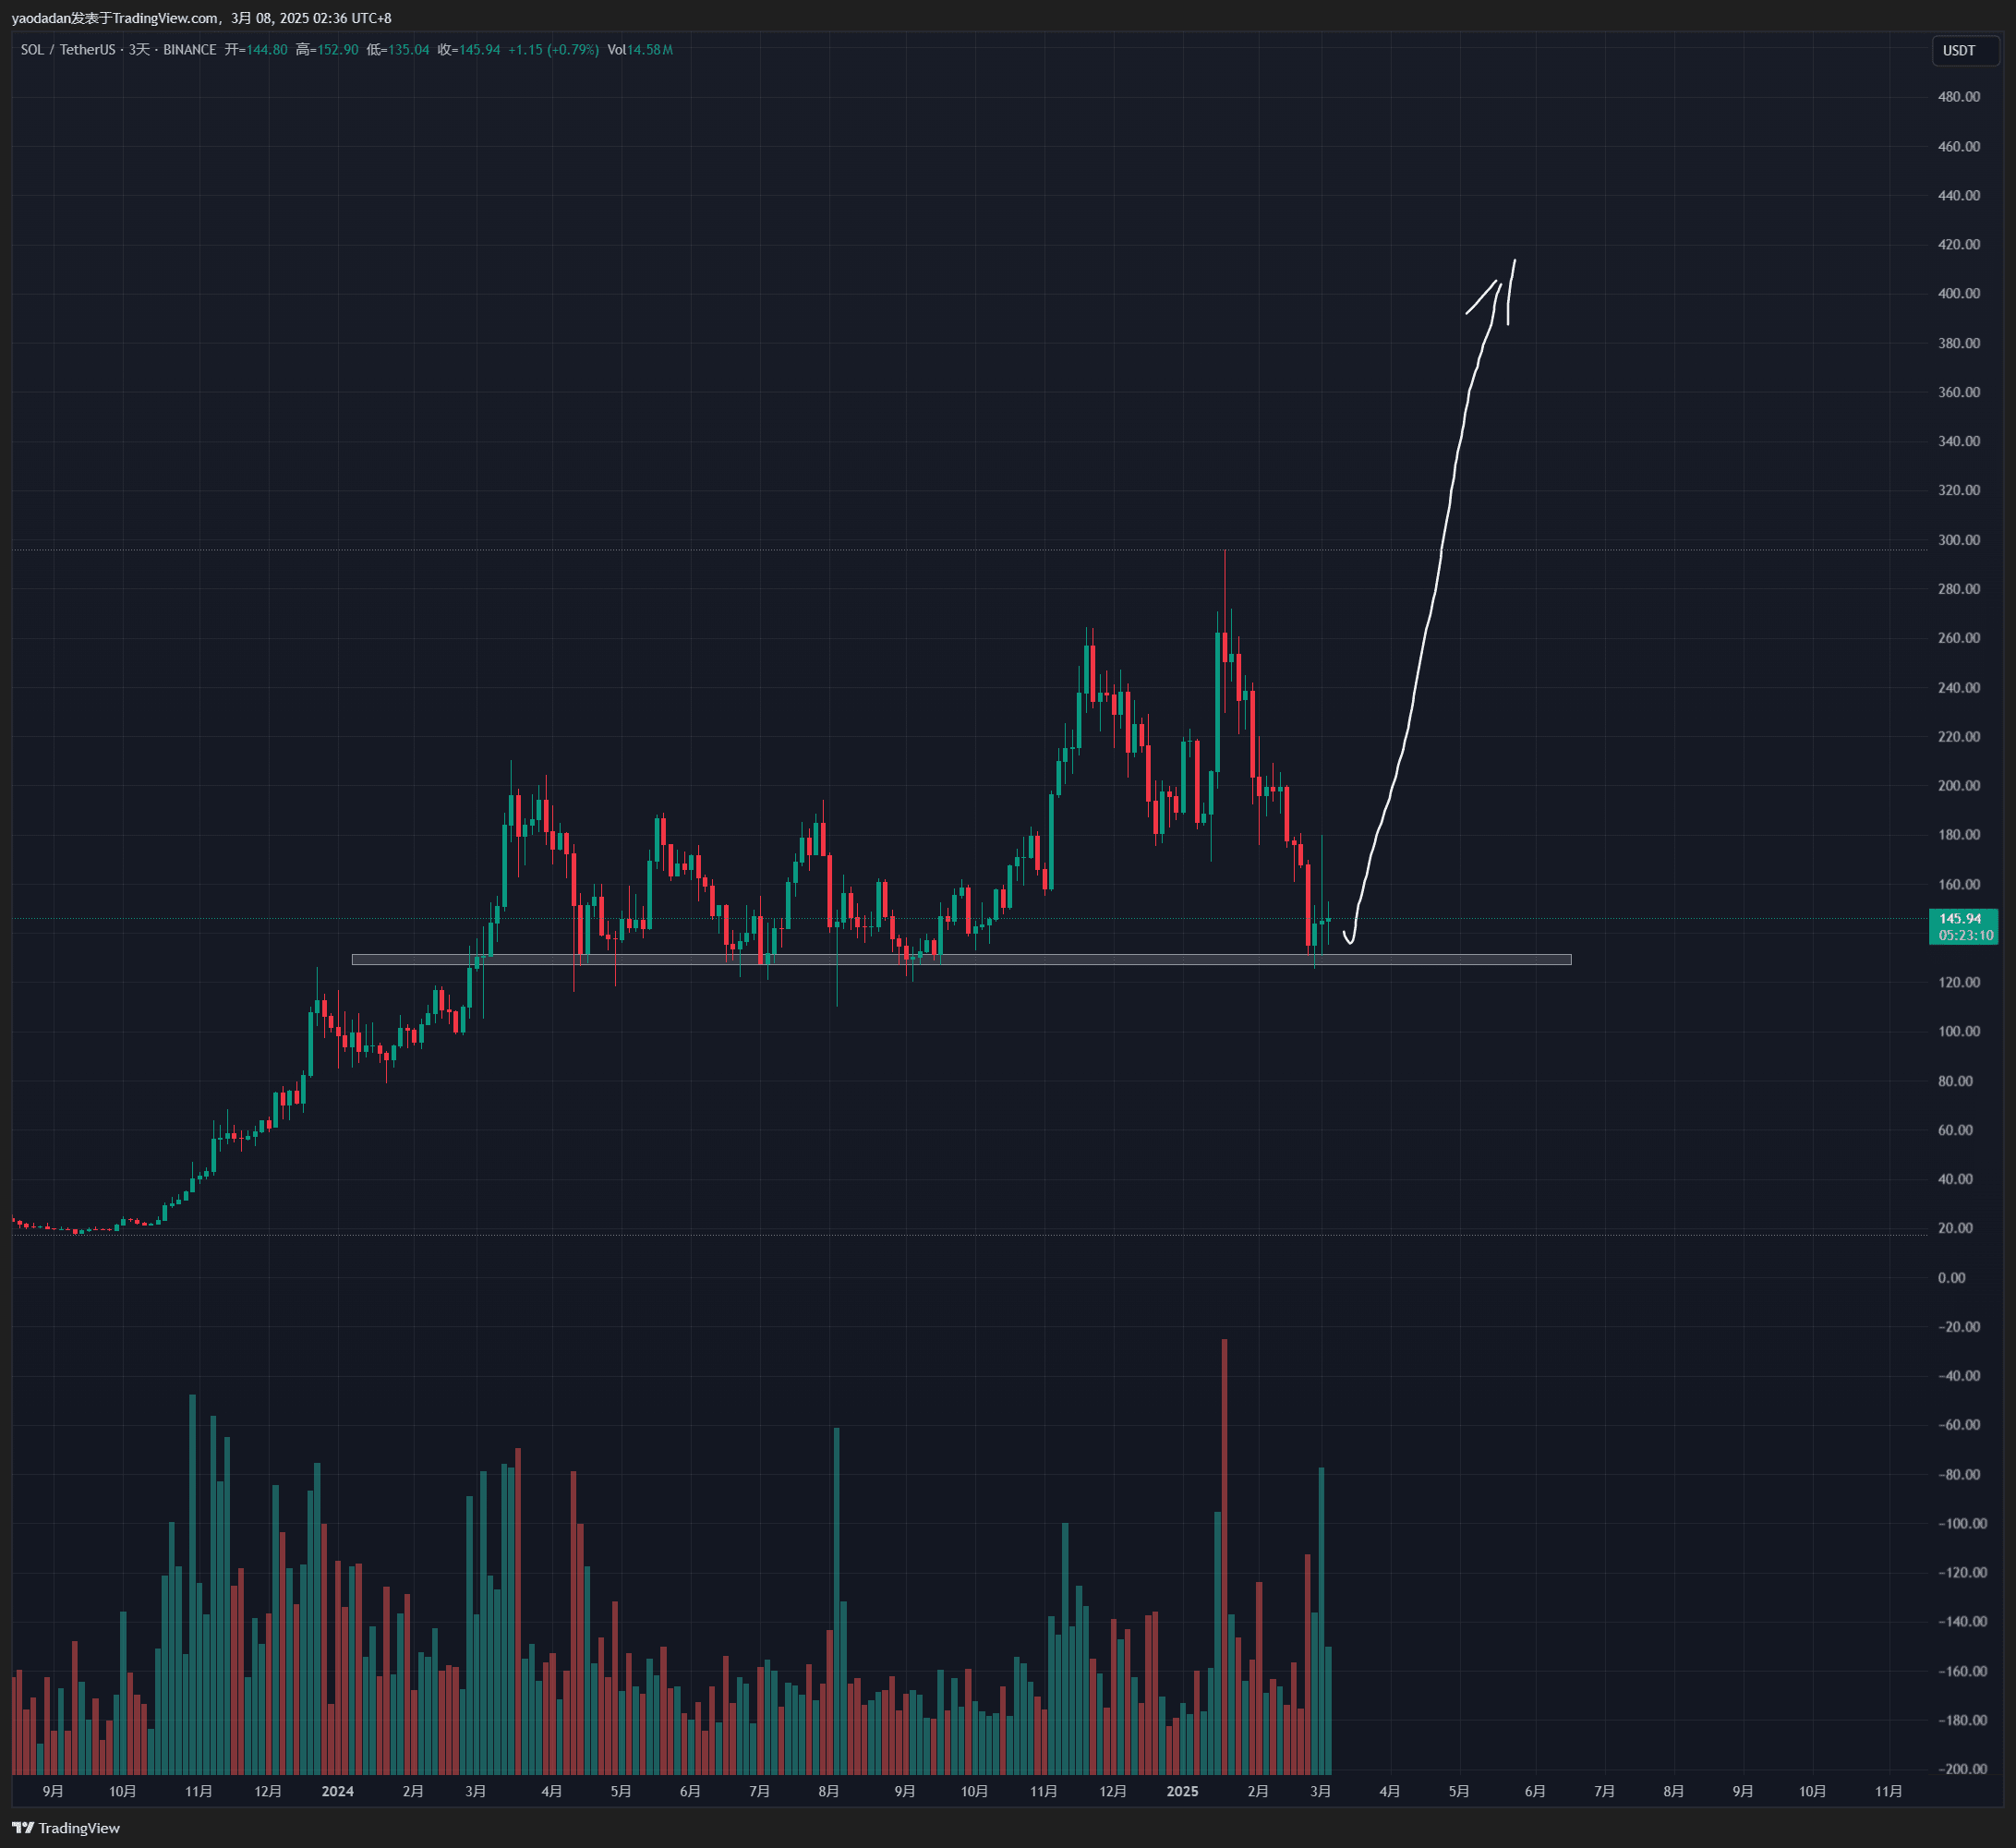
Price Outlook and Stop Loss Strategy for $SOL
Solana (SOL) is gearing up to challenge the $400 mark! From a technical perspective, it has recently bounced back from a key support level, with strong upward momentum. The DeFi ecosystem boom and increased on-chain activity are providing robust support. The target of $400 is not out of reach; historical trends show that SOL has incredible potential in a bull market.
Stop Loss Setting: It is recommended to set the stop loss point below the blank box (key support level) to avoid the risk of sudden declines. If the weekly closing price falls below this level, implement a timely stop loss to protect your principal. The crypto market is highly volatile, and precise risk management is crucial.
Trading Reminder: Pay attention to the weekly trend and avoid being distracted by short-term noise. Do you think SOL can reach $400? Feel free to leave a comment for discussion!
👇
Price Outlook and Stop Loss Strategy for $SOL
Solana (SOL) is gearing up to challenge the $400 mark! From a technical perspective, it has recently bounced back from a key support level, with strong upward momentum. The DeFi ecosystem boom and increased on-chain activity are providing robust support. The target of $400 is not out of reach; historical trends show that SOL has incredible potential in a bull market.
Stop Loss Setting: It is recommended to set the stop loss point below the blank box (key support level) to avoid the risk of sudden declines. If the weekly closing price falls below this level, implement a timely stop loss to protect your principal. The crypto market is highly volatile, and precise risk management is crucial.
Trading Reminder: Pay attention to the weekly trend and avoid being distracted by short-term noise. Do you think SOL can reach $400? Feel free to leave a comment for discussion!
👇

Black BTC
·
--
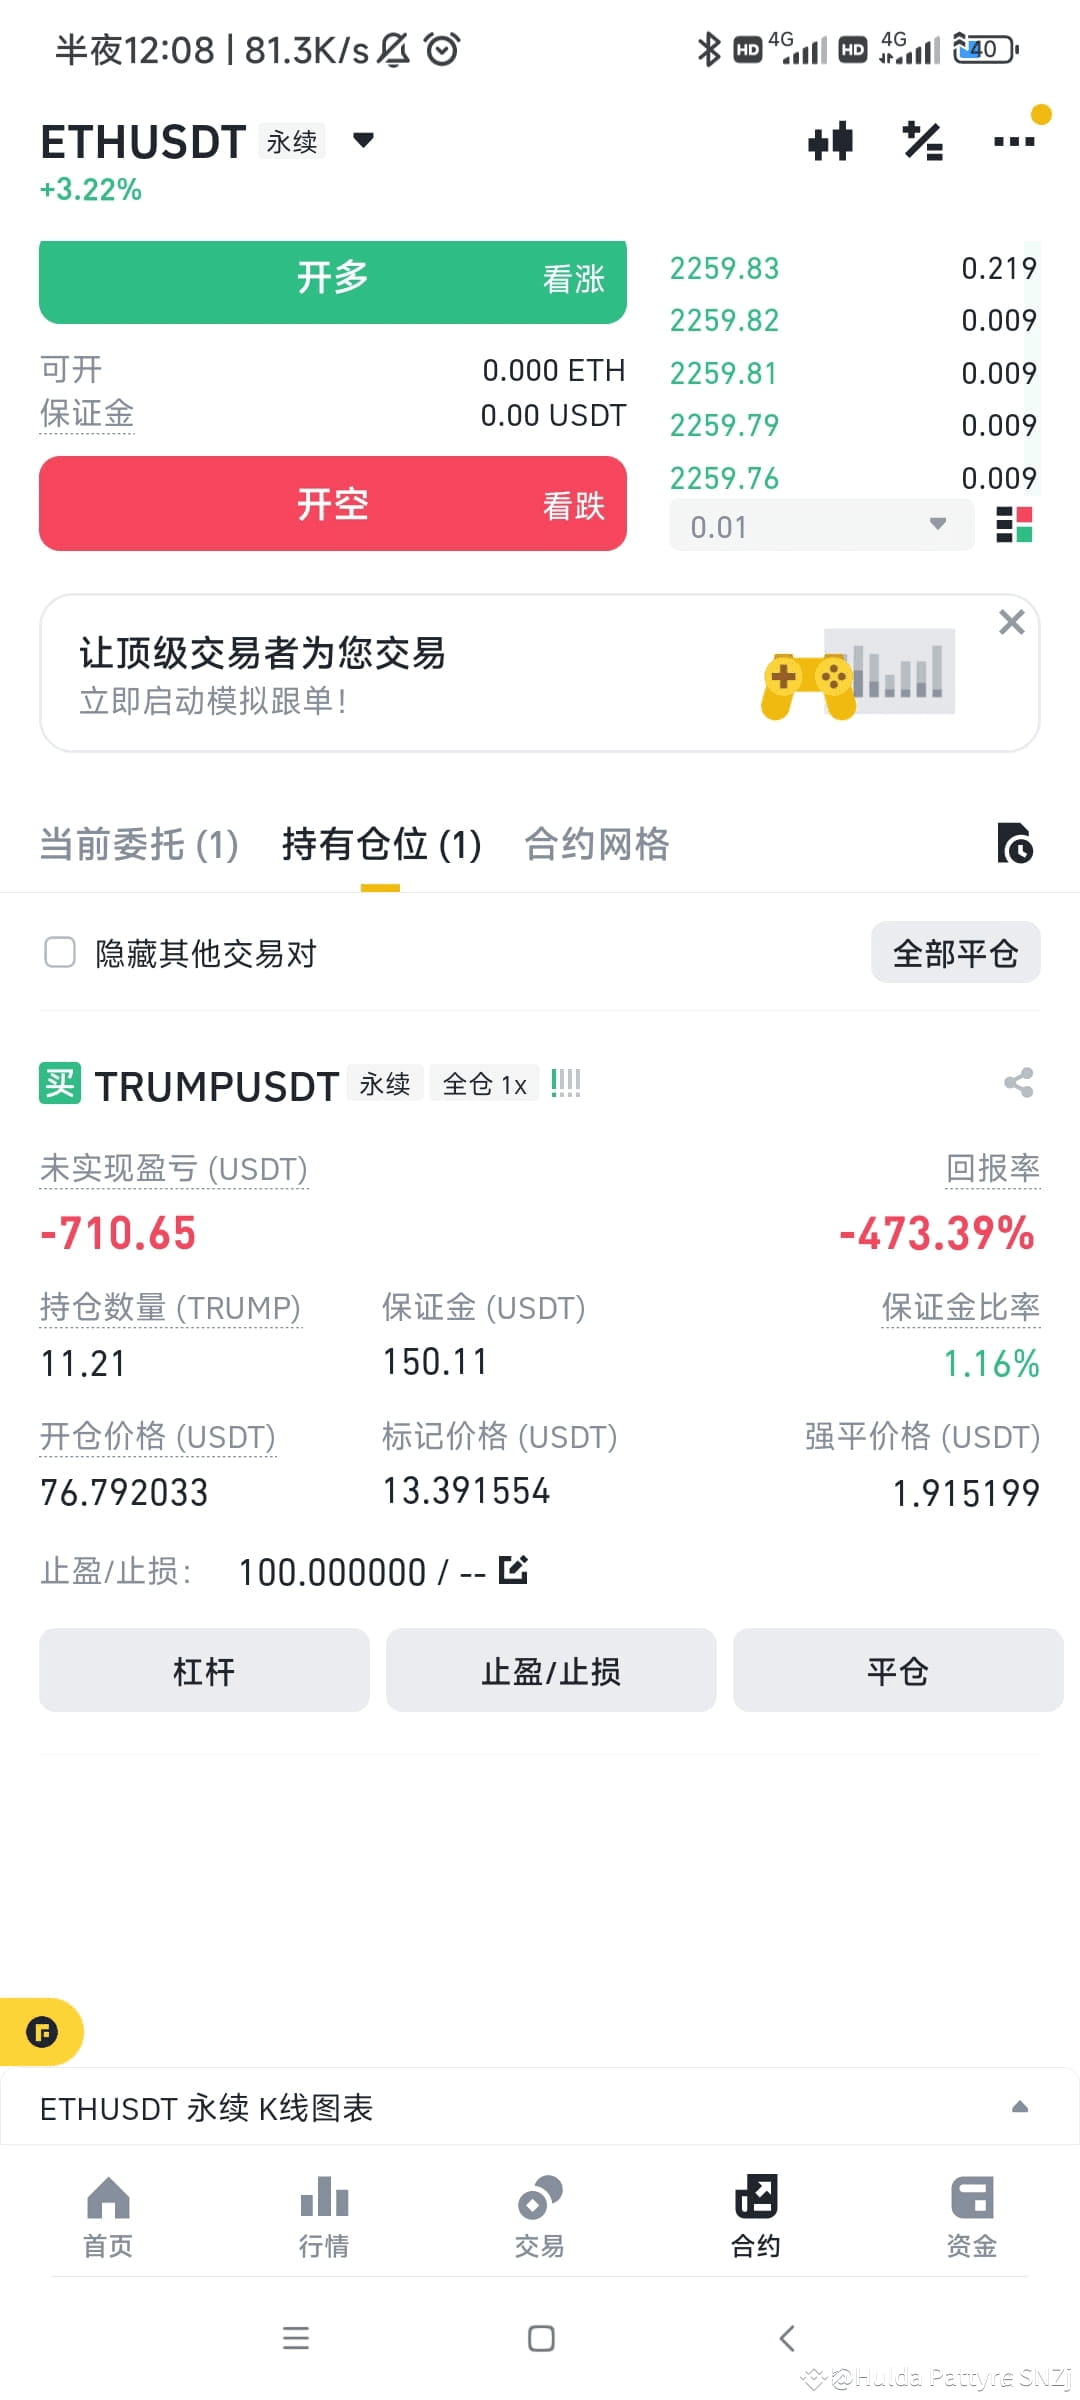
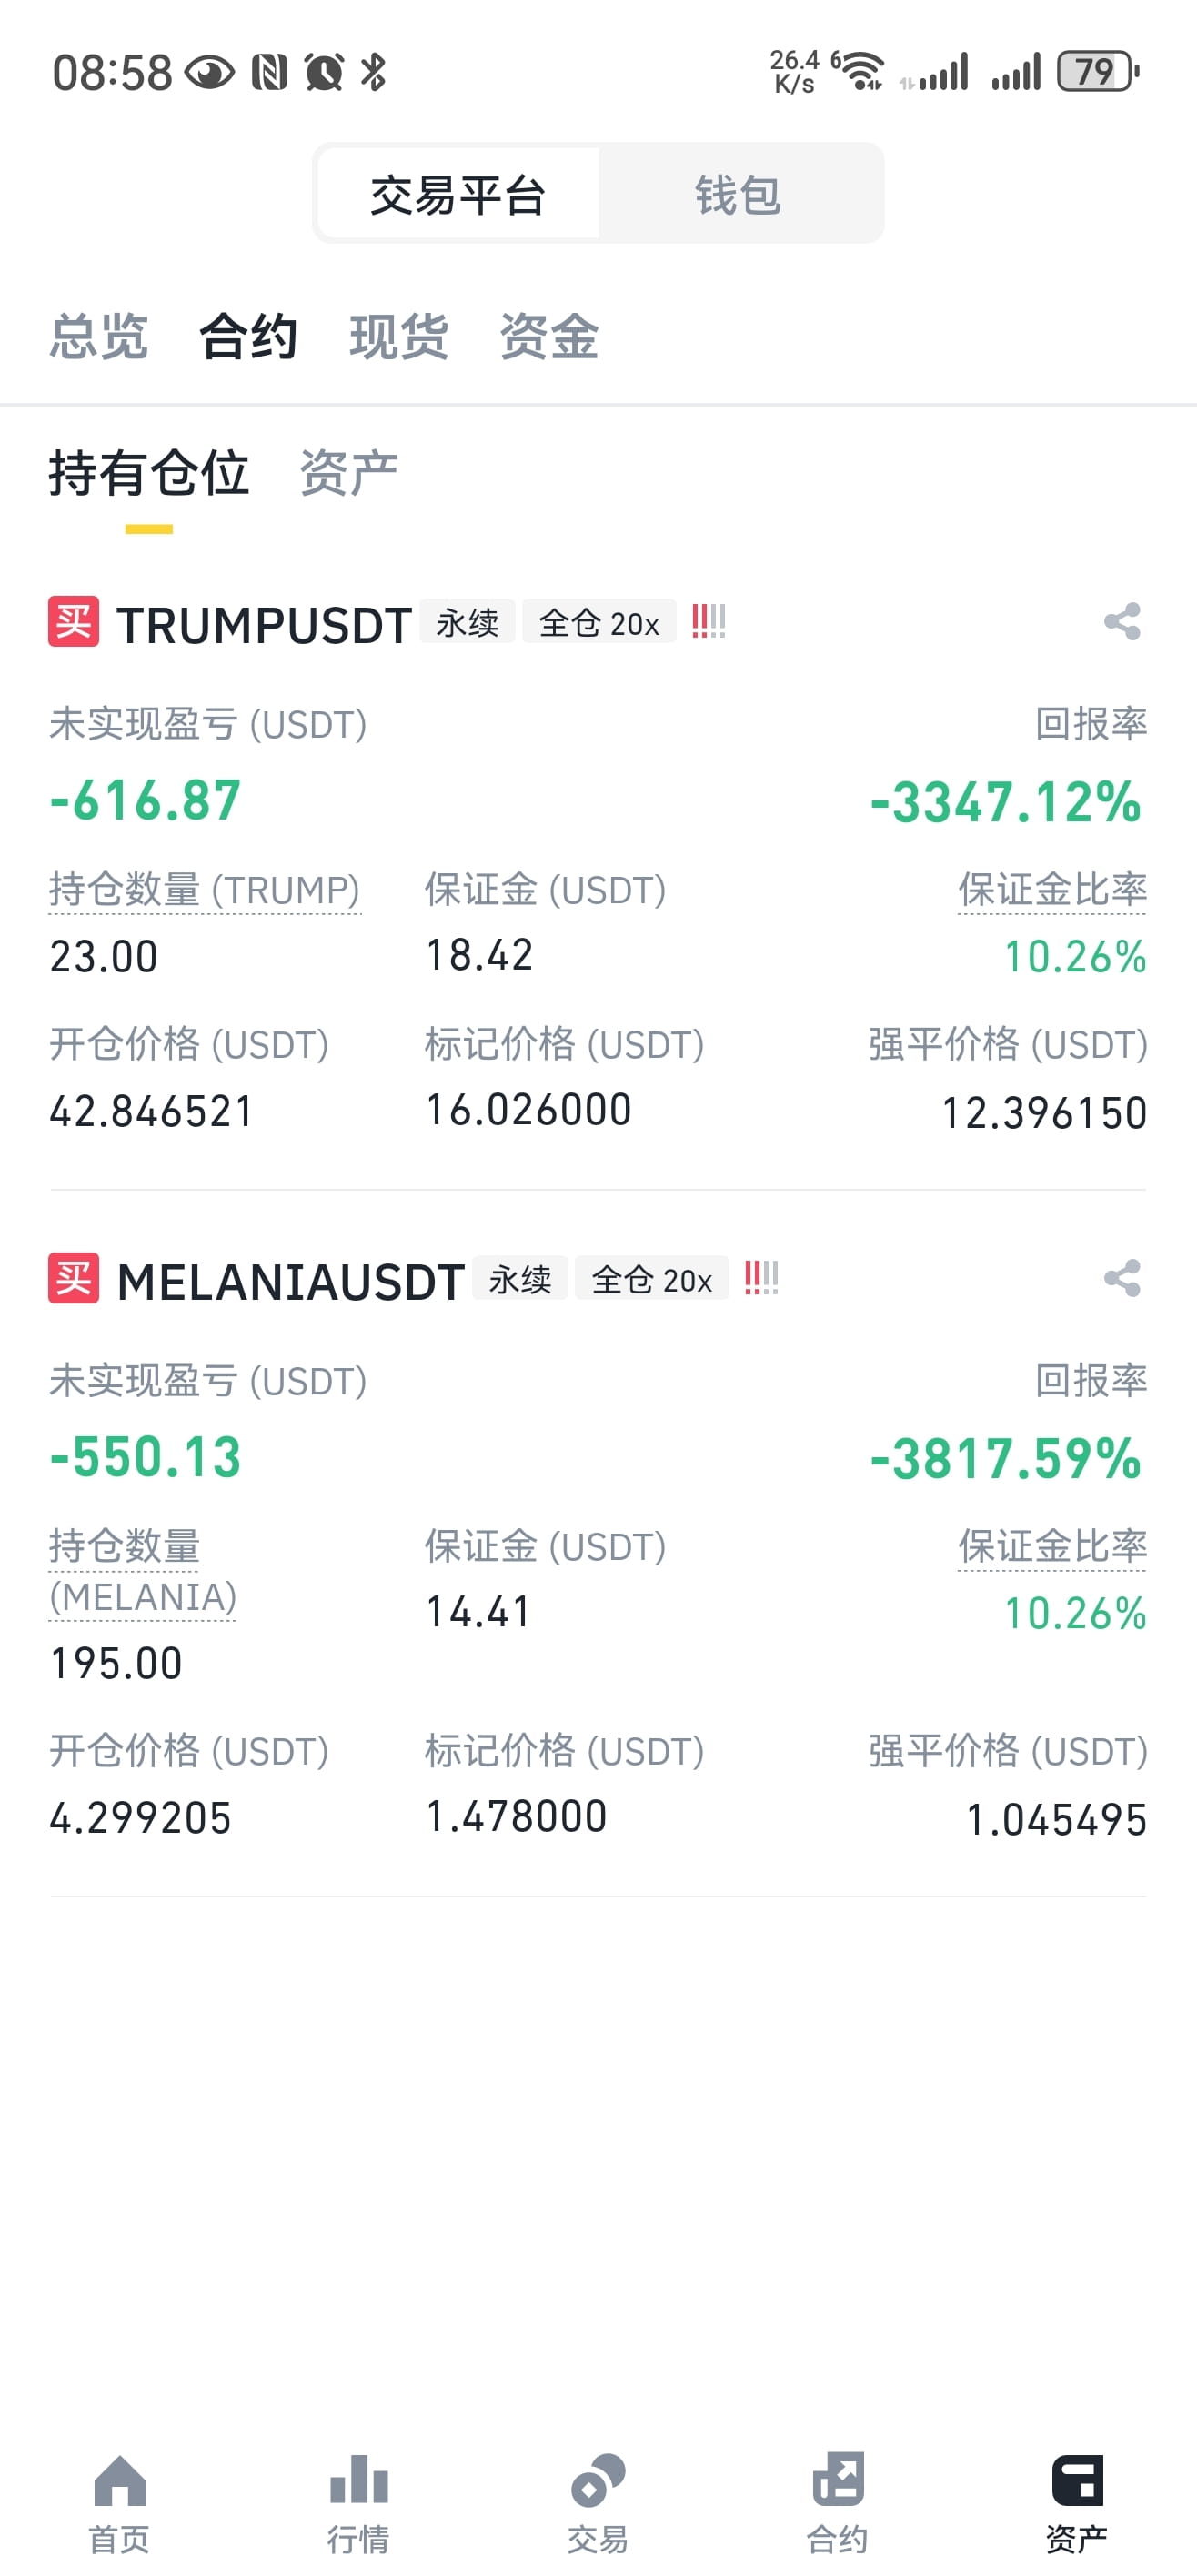
This position can only be increased by adding funds, raising the opening cost to around 20 and the liquidation to around 5. I suggest closing it as it affects your mood.

会飞的咸鱼
·
--
Still here, all good
Log in to explore more content