
Análisis cripto diario
13 Posts

Análisis cripto diario
Report
Block User
Espacio para el análisis de ciclos de mercado y oportunidades spot. Priorizando la preservación del capital, la disciplina y la paciencia por sobre el ruido
23 Following
26 Followers
17 Liked
Posts
All
Quotes
·
--
Bullish
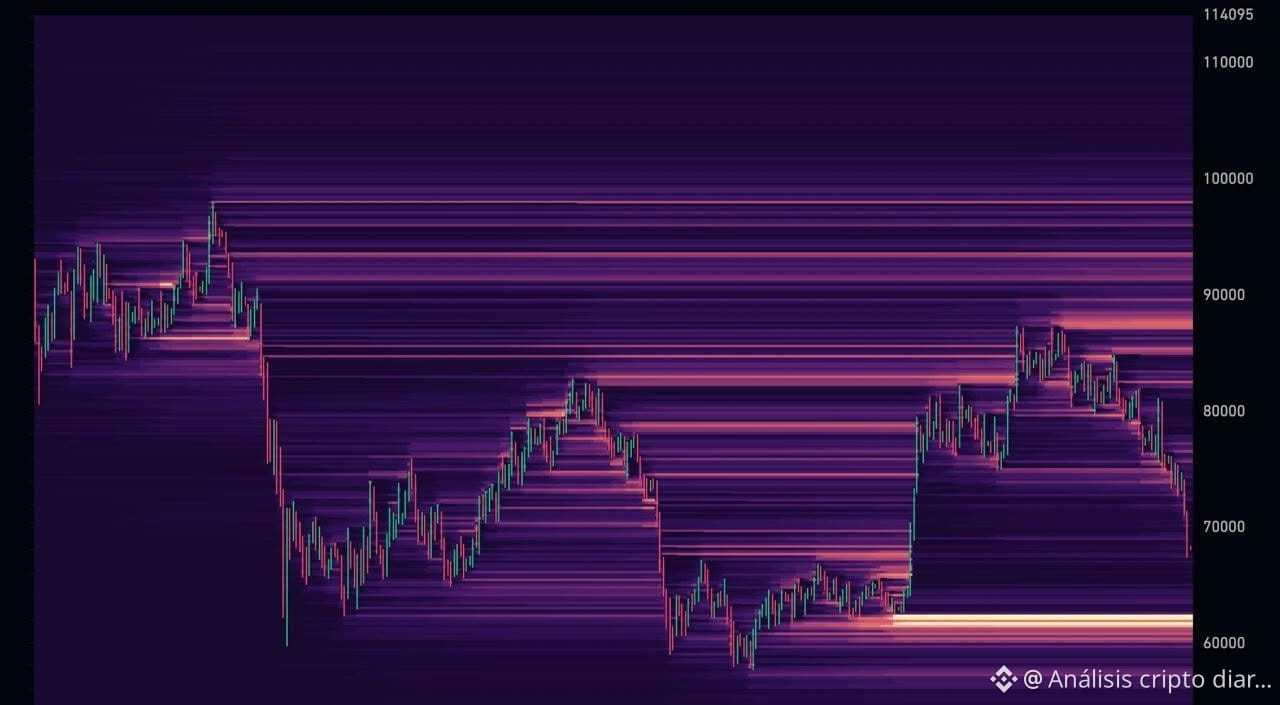
*⚠️ $BTC Heading toward $60K: My plan is to WAIT*
There’s a huge liquidation pool at $60K, but the price won’t drop in a straight line. It could rise first to liquidate shorts and THEN come down to reach it.
My step-by-step plan:
*1. DON’T BUY OUT OF FOMO*
If it goes up now, I won’t buy. That rise could just be a move to sweep the highs before dropping.
*2. HAVE 2 SCENARIOS*
- It rises to $75K–$80K, stalls, and drops to $60K.
- Or it drops straight to $60K–$62K.
The destination is the same; only the path changes.
*3. WAIT FOR THE SWEEP*
I want to see it reach $60K–$62K, wick below to liquidate longs, and recover quickly.
*4. LOOK FOR CONFIRMATION*
I won’t buy just because it touched $60K. I’ll wait for a rejection candle and for it to hold above $62K.
In this scenario, patience pays more than anxiety. I’m waiting for the sweep.
Are you waiting, or are you already buying?
{spot}(BTCUSDT)
*⚠️ $BTC Heading toward $60K: My plan is to WAIT*
There’s a huge liquidation pool at $60K, but the price won’t drop in a straight line. It could rise first to liquidate shorts and THEN come down to reach it.
My step-by-step plan:
*1. DON’T BUY OUT OF FOMO*
If it goes up now, I won’t buy. That rise could just be a move to sweep the highs before dropping.
*2. HAVE 2 SCENARIOS*
- It rises to $75K–$80K, stalls, and drops to $60K.
- Or it drops straight to $60K–$62K.
The destination is the same; only the path changes.
*3. WAIT FOR THE SWEEP*
I want to see it reach $60K–$62K, wick below to liquidate longs, and recover quickly.
*4. LOOK FOR CONFIRMATION*
I won’t buy just because it touched $60K. I’ll wait for a rejection candle and for it to hold above $62K.
In this scenario, patience pays more than anxiety. I’m waiting for the sweep.
Are you waiting, or are you already buying?
There’s a huge liquidation pool at $60K, but the price won’t drop in a straight line. It could rise first to liquidate shorts and THEN come down to reach it.
My step-by-step plan:
*1. DON’T BUY OUT OF FOMO*
If it goes up now, I won’t buy. That rise could just be a move to sweep the highs before dropping.
*2. HAVE 2 SCENARIOS*
- It rises to $75K–$80K, stalls, and drops to $60K.
- Or it drops straight to $60K–$62K.
The destination is the same; only the path changes.
*3. WAIT FOR THE SWEEP*
I want to see it reach $60K–$62K, wick below to liquidate longs, and recover quickly.
*4. LOOK FOR CONFIRMATION*
I won’t buy just because it touched $60K. I’ll wait for a rejection candle and for it to hold above $62K.
In this scenario, patience pays more than anxiety. I’m waiting for the sweep.
Are you waiting, or are you already buying?
266
·
--
Bullish
BLOOD IN THE STREETS: HISTORIC SPOT BOTTOM OR PANIC TRAP?
{spot}(BNBUSDT)
The market woke up to the **Fear & Greed Index stuck at 12 (Extreme Fear)**. Screens are burning, the red tide is scaring the masses, and retail traders are giving away their positions. But those of us who’ve been in this for years know the golden rule: big money doesn’t buy when there’s celebration and euphoria—it buys when there’s silence and desperation at **BTC**’s macro support levels.
Meanwhile, in the ecosystem, $BNB continues to establish itself as the ultimate defensive asset: accumulating in these zones doesn’t just position you for the long term—it also gets you ready to earn from every *Launchpool* and *Megadrop* that comes along.
And if that weren’t enough, the fast traders’ spotlight is on $RARE today: with volume that shattered expectations and recent listings lighting the fuse, the token went from silence to chasing an **explosive breakout** that sparked FOMO everywhere.
Are you taking advantage of the discount to accumulate on spot, or are you stuck watching from the sidelines? Tell me your move in the comments! 👇📉🚀
#staking
BLOOD IN THE STREETS: HISTORIC SPOT BOTTOM OR PANIC TRAP?
The market woke up to the **Fear & Greed Index stuck at 12 (Extreme Fear)**. Screens are burning, the red tide is scaring the masses, and retail traders are giving away their positions. But those of us who’ve been in this for years know the golden rule: big money doesn’t buy when there’s celebration and euphoria—it buys when there’s silence and desperation at **BTC**’s macro support levels.
Meanwhile, in the ecosystem, $BNB continues to establish itself as the ultimate defensive asset: accumulating in these zones doesn’t just position you for the long term—it also gets you ready to earn from every *Launchpool* and *Megadrop* that comes along.
And if that weren’t enough, the fast traders’ spotlight is on $RARE today: with volume that shattered expectations and recent listings lighting the fuse, the token went from silence to chasing an **explosive breakout** that sparked FOMO everywhere.
Are you taking advantage of the discount to accumulate on spot, or are you stuck watching from the sidelines? Tell me your move in the comments! 👇📉🚀
#staking
The market woke up to the **Fear & Greed Index stuck at 12 (Extreme Fear)**. Screens are burning, the red tide is scaring the masses, and retail traders are giving away their positions. But those of us who’ve been in this for years know the golden rule: big money doesn’t buy when there’s celebration and euphoria—it buys when there’s silence and desperation at **BTC**’s macro support levels.
Meanwhile, in the ecosystem, $BNB continues to establish itself as the ultimate defensive asset: accumulating in these zones doesn’t just position you for the long term—it also gets you ready to earn from every *Launchpool* and *Megadrop* that comes along.
And if that weren’t enough, the fast traders’ spotlight is on $RARE today: with volume that shattered expectations and recent listings lighting the fuse, the token went from silence to chasing an **explosive breakout** that sparked FOMO everywhere.
Are you taking advantage of the discount to accumulate on spot, or are you stuck watching from the sidelines? Tell me your move in the comments! 👇📉🚀
#staking

143
·
--
Bullish
EXPLOSIVE TAKEOFF OR TRAP? WHAT'S COOKING WITH $RARE
When an altcoin breaks out hard, sees massive volume, and starts flying on exchanges, the whole market turns to look. That's exactly what's happening with $RARE: a move that looks just like an explosive takeoff and has lit up the radar of the fastest traders.
Moves that wake up this violently usually leave you with two choices: either you ride the wave in time and take advantage of the momentum, or you watch from the sidelines as it takes off without you.
Are you already on board the rocket, or would you rather wait for a retest? Let me know what you think in the comments! 👇🚀
{spot}(RAREUSDT)
EXPLOSIVE TAKEOFF OR TRAP? WHAT'S COOKING WITH $RARE
When an altcoin breaks out hard, sees massive volume, and starts flying on exchanges, the whole market turns to look. That's exactly what's happening with $RARE: a move that looks just like an explosive takeoff and has lit up the radar of the fastest traders.
Moves that wake up this violently usually leave you with two choices: either you ride the wave in time and take advantage of the momentum, or you watch from the sidelines as it takes off without you.
Are you already on board the rocket, or would you rather wait for a retest? Let me know what you think in the comments! 👇🚀
When an altcoin breaks out hard, sees massive volume, and starts flying on exchanges, the whole market turns to look. That's exactly what's happening with $RARE: a move that looks just like an explosive takeoff and has lit up the radar of the fastest traders.
Moves that wake up this violently usually leave you with two choices: either you ride the wave in time and take advantage of the momentum, or you watch from the sidelines as it takes off without you.
Are you already on board the rocket, or would you rather wait for a retest? Let me know what you think in the comments! 👇🚀

438
·
--
Bullish
**EXTREME FEAR AT 12: THE SURVIVAL GUIDE TO HUNTING FOR THE SPOT BOTTOM**
{spot}(BTCUSDT)
When the **Crypto Fear & Greed** Index plunges to a level of **12**, the screen turns red, social media floods with apocalyptic predictions, and the collective emotion is pure panic. For the inexperienced investor, it’s time to run; but for those who read market cycles with a cool head, it’s one of those golden opportunities the market offers very rarely.
Such deep fear is nothing more than a reflection of mass capitulation. It’s the exact moment when retail investors sell out of desperation, surrendering their assets at critical support zones. Historically, these extreme readings have precisely marked **structural bottoms in the spot market**, laying the groundwork for major accumulation.
Taking advantage of this scenario requires tuning out the noise, looking at the chart from a long-term perspective, and understanding that the best buys are never made when the market is euphoric and green, but when there’s blood in the streets. Patience and a cool-headed strategy once again prove to be the intelligent investor’s best allies. #BTC☀ #fear&greed
**EXTREME FEAR AT 12: THE SURVIVAL GUIDE TO HUNTING FOR THE SPOT BOTTOM**
When the **Crypto Fear & Greed** Index plunges to a level of **12**, the screen turns red, social media floods with apocalyptic predictions, and the collective emotion is pure panic. For the inexperienced investor, it’s time to run; but for those who read market cycles with a cool head, it’s one of those golden opportunities the market offers very rarely.
Such deep fear is nothing more than a reflection of mass capitulation. It’s the exact moment when retail investors sell out of desperation, surrendering their assets at critical support zones. Historically, these extreme readings have precisely marked **structural bottoms in the spot market**, laying the groundwork for major accumulation.
Taking advantage of this scenario requires tuning out the noise, looking at the chart from a long-term perspective, and understanding that the best buys are never made when the market is euphoric and green, but when there’s blood in the streets. Patience and a cool-headed strategy once again prove to be the intelligent investor’s best allies. #BTC☀ #fear&greed
When the **Crypto Fear & Greed** Index plunges to a level of **12**, the screen turns red, social media floods with apocalyptic predictions, and the collective emotion is pure panic. For the inexperienced investor, it’s time to run; but for those who read market cycles with a cool head, it’s one of those golden opportunities the market offers very rarely.
Such deep fear is nothing more than a reflection of mass capitulation. It’s the exact moment when retail investors sell out of desperation, surrendering their assets at critical support zones. Historically, these extreme readings have precisely marked **structural bottoms in the spot market**, laying the groundwork for major accumulation.
Taking advantage of this scenario requires tuning out the noise, looking at the chart from a long-term perspective, and understanding that the best buys are never made when the market is euphoric and green, but when there’s blood in the streets. Patience and a cool-headed strategy once again prove to be the intelligent investor’s best allies. #BTC☀ #fear&greed
137
·
--
Bullish
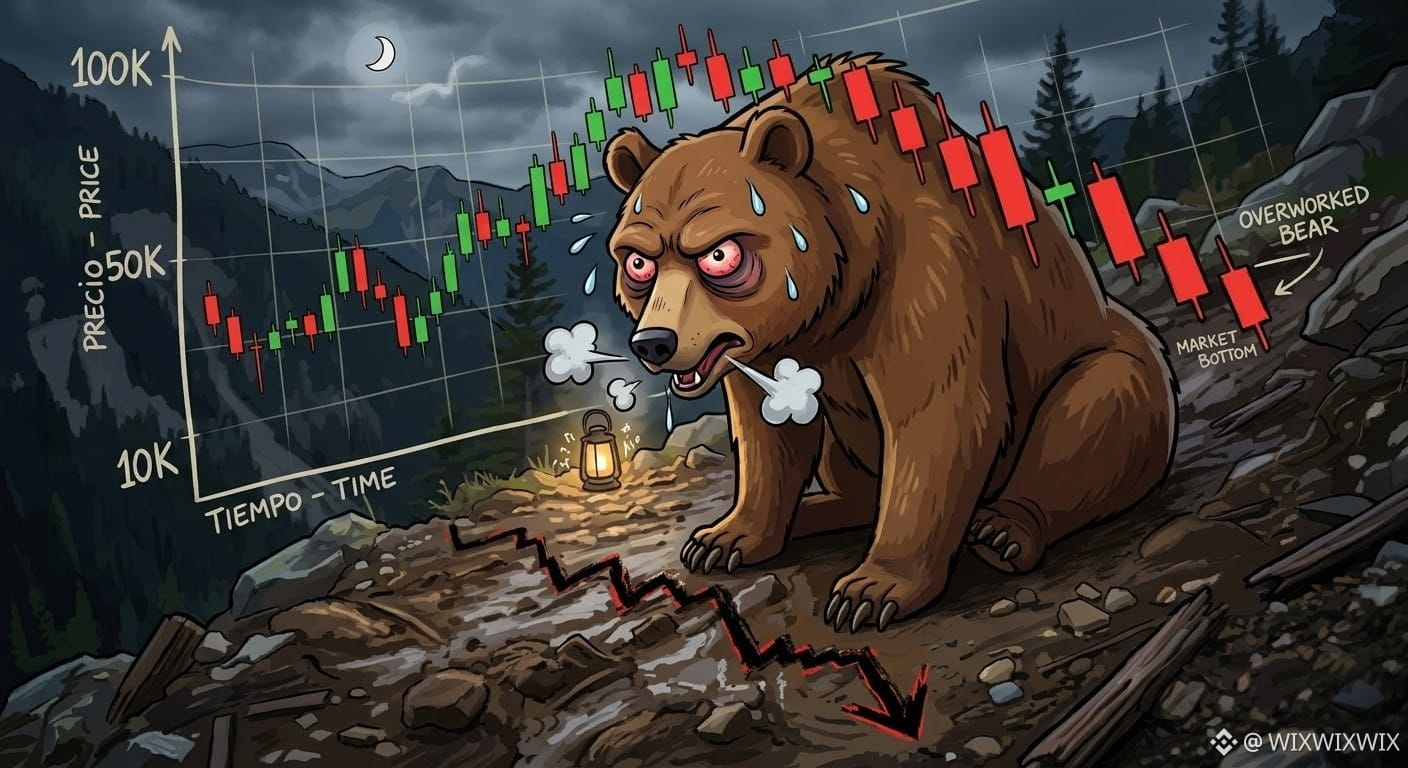
BTC EXHAUSTION: WHEN THE BEARS RUN OUT OF STEAM AT 0.618
{spot}(BTCUSDT)
$BTC
The cryptocurrency market is a constant test of psychology and structural analysis. In recent hours, Bitcoin hit a new low, but one key technical detail completely changed the chart’s interpretation: **the move came with a notably smaller drop in volume and an exact, millimeter-perfect bounce at the 0.618 Fibonacci level.**
What many interpret as extreme weakness is, in reality, a classic sign of **bearish exhaustion**.
When the price makes a lower low but selling pressure dries up, it means those pushing the price down are running out of ammunition. Add to that the fact that the RSI and volume are backing up this slowdown in an institutional golden zone, and the outlook changes: panic begins to fade, and the market lays the groundwork for a bounce or range-bound stabilization.
Patience and a cool-headed reading of the chart still prevail when fear tries to take over the screen.
BTC EXHAUSTION: WHEN THE BEARS RUN OUT OF STEAM AT 0.618
$BTC
The cryptocurrency market is a constant test of psychology and structural analysis. In recent hours, Bitcoin hit a new low, but one key technical detail completely changed the chart’s interpretation: **the move came with a notably smaller drop in volume and an exact, millimeter-perfect bounce at the 0.618 Fibonacci level.**
What many interpret as extreme weakness is, in reality, a classic sign of **bearish exhaustion**.
When the price makes a lower low but selling pressure dries up, it means those pushing the price down are running out of ammunition. Add to that the fact that the RSI and volume are backing up this slowdown in an institutional golden zone, and the outlook changes: panic begins to fade, and the market lays the groundwork for a bounce or range-bound stabilization.
Patience and a cool-headed reading of the chart still prevail when fear tries to take over the screen.
$BTC
The cryptocurrency market is a constant test of psychology and structural analysis. In recent hours, Bitcoin hit a new low, but one key technical detail completely changed the chart’s interpretation: **the move came with a notably smaller drop in volume and an exact, millimeter-perfect bounce at the 0.618 Fibonacci level.**
What many interpret as extreme weakness is, in reality, a classic sign of **bearish exhaustion**.
When the price makes a lower low but selling pressure dries up, it means those pushing the price down are running out of ammunition. Add to that the fact that the RSI and volume are backing up this slowdown in an institutional golden zone, and the outlook changes: panic begins to fade, and the market lays the groundwork for a bounce or range-bound stabilization.
Patience and a cool-headed reading of the chart still prevail when fear tries to take over the screen.
99
·
--
Bullish
**🧠 "Buy when there's blood in the streets": Market fear and the opportunity in BTC**
The crypto market has a golden rule that few dare to follow when things get hot: **extreme fear is synonymous with opportunity**. Following the latest price shake-up, the famous **Crypto Fear & Greed** index plunged into fear territory, and retail investors rushed to sell in a panic.
But those who look at the board calmly know exactly what this means.
📉 What is the Fear & Greed Index telling us now?
When the index shows high levels of fear, general sentiment is one of panic: social media is flooded with apocalyptic predictions and capital is pouring out. Historically, **the best macro and medium-term accumulation zones form right here**, when the tide of emotion drives the masses to sell their assets at a discount.
⚙️ Confluence with technical analysis
This market panic isn't happening just anywhere; it coincides with a key technical zone for Bitcoin:
* **Support and golden levels:** We're testing very strong support ranges that coincide with Fibonacci retracements (0.5 - 0.618), a zone where big players tend to accumulate patiently.
* **The end of the correction:** While emotion says BTC is going to zero, the wave structure and the slowdown in selling volume suggest we're facing a classic fear trap before the next rally attempt.
💡 How can you take advantage of it in Spot?
Trading against sentiment requires a method:
1. **Don't buy everything at once:** Divide your capital into staggered purchases within this support zone.
2. **Tune out the noise:** Fear clouds your judgment; rely on the data and your long-term strategy, not the day's catastrophic headline.
Are you taking advantage of the discount fear is creating, or would you rather wait for the waters to calm? I'll be reading your comments! 👇💬
$BTC
{spot}(BTCUSDT)
**🧠 "Buy when there's blood in the streets": Market fear and the opportunity in BTC**
The crypto market has a golden rule that few dare to follow when things get hot: **extreme fear is synonymous with opportunity**. Following the latest price shake-up, the famous **Crypto Fear & Greed** index plunged into fear territory, and retail investors rushed to sell in a panic.
But those who look at the board calmly know exactly what this means.
📉 What is the Fear & Greed Index telling us now?
When the index shows high levels of fear, general sentiment is one of panic: social media is flooded with apocalyptic predictions and capital is pouring out. Historically, **the best macro and medium-term accumulation zones form right here**, when the tide of emotion drives the masses to sell their assets at a discount.
⚙️ Confluence with technical analysis
This market panic isn't happening just anywhere; it coincides with a key technical zone for Bitcoin:
* **Support and golden levels:** We're testing very strong support ranges that coincide with Fibonacci retracements (0.5 - 0.618), a zone where big players tend to accumulate patiently.
* **The end of the correction:** While emotion says BTC is going to zero, the wave structure and the slowdown in selling volume suggest we're facing a classic fear trap before the next rally attempt.
💡 How can you take advantage of it in Spot?
Trading against sentiment requires a method:
1. **Don't buy everything at once:** Divide your capital into staggered purchases within this support zone.
2. **Tune out the noise:** Fear clouds your judgment; rely on the data and your long-term strategy, not the day's catastrophic headline.
Are you taking advantage of the discount fear is creating, or would you rather wait for the waters to calm? I'll be reading your comments! 👇💬
$BTC
The crypto market has a golden rule that few dare to follow when things get hot: **extreme fear is synonymous with opportunity**. Following the latest price shake-up, the famous **Crypto Fear & Greed** index plunged into fear territory, and retail investors rushed to sell in a panic.
But those who look at the board calmly know exactly what this means.
📉 What is the Fear & Greed Index telling us now?
When the index shows high levels of fear, general sentiment is one of panic: social media is flooded with apocalyptic predictions and capital is pouring out. Historically, **the best macro and medium-term accumulation zones form right here**, when the tide of emotion drives the masses to sell their assets at a discount.
⚙️ Confluence with technical analysis
This market panic isn't happening just anywhere; it coincides with a key technical zone for Bitcoin:
* **Support and golden levels:** We're testing very strong support ranges that coincide with Fibonacci retracements (0.5 - 0.618), a zone where big players tend to accumulate patiently.
* **The end of the correction:** While emotion says BTC is going to zero, the wave structure and the slowdown in selling volume suggest we're facing a classic fear trap before the next rally attempt.
💡 How can you take advantage of it in Spot?
Trading against sentiment requires a method:
1. **Don't buy everything at once:** Divide your capital into staggered purchases within this support zone.
2. **Tune out the noise:** Fear clouds your judgment; rely on the data and your long-term strategy, not the day's catastrophic headline.
Are you taking advantage of the discount fear is creating, or would you rather wait for the waters to calm? I'll be reading your comments! 👇💬
$BTC
1
302
·
--
Bullish
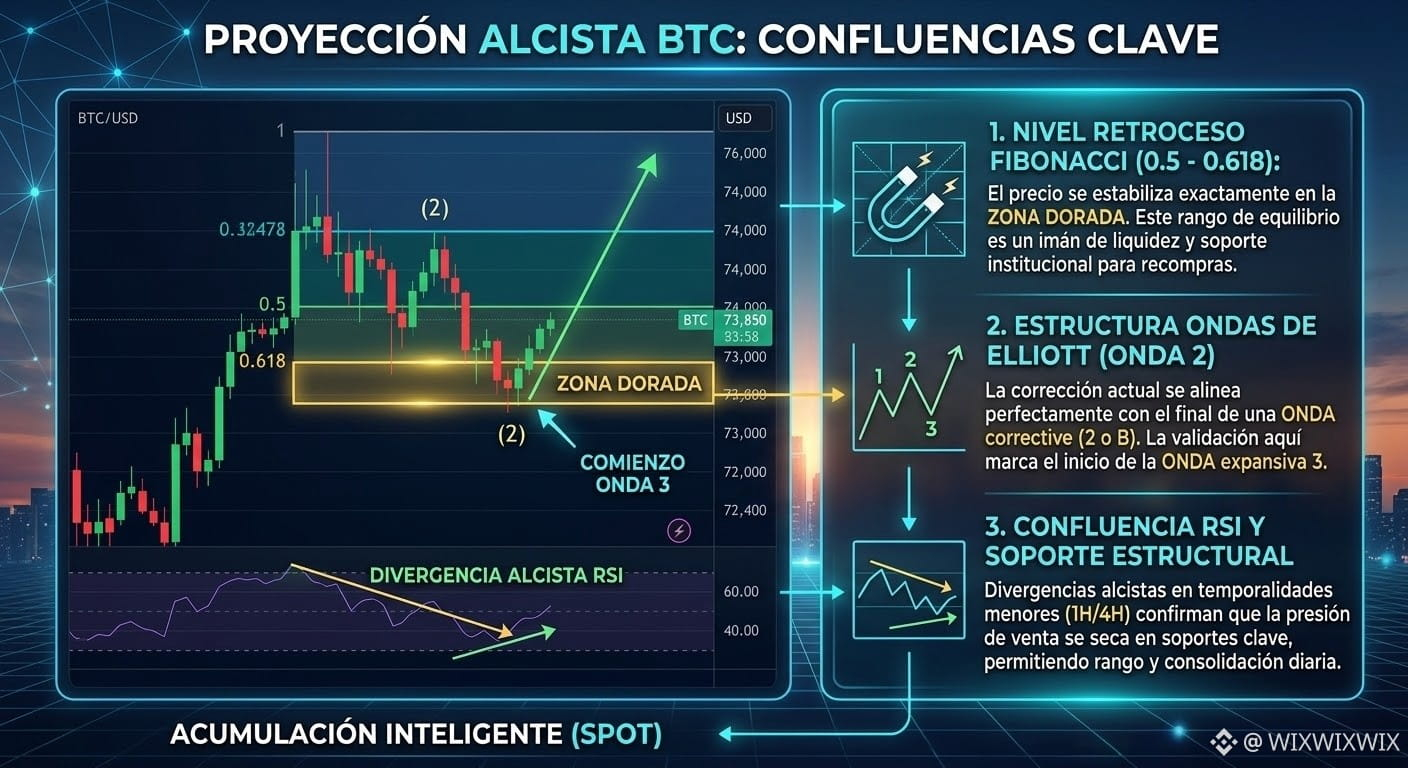
**🚀 Bullish Outlook: Technical Confluence in BTC’s Golden Zone**
The Bitcoin market is presenting us with a highly interesting technical setup. Far from seeing only a worrying correction, the current structure is aligning almost perfectly in a **high-probability confluence** that supports the possibility of a larger rebound and the continuation of the primary uptrend.
### 📊 The Move’s Key Confluences
1. **The Fibonacci Golden Zone (0.5 - 0.618):**
The price has retraced exactly to the institutional equilibrium zone (the famous OTE - *Optimal Trade Entry*). In technical analysis, this range between the **0.5 and 0.618** levels of the previous impulse acts as a liquidity magnet, where major players take the opportunity to buy back in and position themselves in the direction of the primary trend without paying a premium.
2. **Elliott Wave Structure (Wave 2 / B):**
As we’ve been breaking down, this correction fits perfectly with the end of a corrective wave structure (Wave 2 or B). A confirmation of this support would mean the short-term bearish structure is running out of steam, paving the way for the expansive impulse of **Wave 3**, historically the most violent and profitable phase of the cycle.
3. **Confluence with the RSI (Divergences Developing):**
While the price moves deeper into or precisely tests this golden Fibonacci level, the RSI on lower timeframes (1H and 4H) is beginning to show bearish fatigue and bullish divergences. This indicates that selling pressure is drying up and that the market is preparing for a solid technical rebound, which could establish a trading range and confirm a clear divergence on the daily chart.
{spot}(BTCUSDT)
#BTC80K🚀🚀
**🚀 Bullish Outlook: Technical Confluence in BTC’s Golden Zone**
The Bitcoin market is presenting us with a highly interesting technical setup. Far from seeing only a worrying correction, the current structure is aligning almost perfectly in a **high-probability confluence** that supports the possibility of a larger rebound and the continuation of the primary uptrend.
### 📊 The Move’s Key Confluences
1. **The Fibonacci Golden Zone (0.5 - 0.618):**
The price has retraced exactly to the institutional equilibrium zone (the famous OTE - *Optimal Trade Entry*). In technical analysis, this range between the **0.5 and 0.618** levels of the previous impulse acts as a liquidity magnet, where major players take the opportunity to buy back in and position themselves in the direction of the primary trend without paying a premium.
2. **Elliott Wave Structure (Wave 2 / B):**
As we’ve been breaking down, this correction fits perfectly with the end of a corrective wave structure (Wave 2 or B). A confirmation of this support would mean the short-term bearish structure is running out of steam, paving the way for the expansive impulse of **Wave 3**, historically the most violent and profitable phase of the cycle.
3. **Confluence with the RSI (Divergences Developing):**
While the price moves deeper into or precisely tests this golden Fibonacci level, the RSI on lower timeframes (1H and 4H) is beginning to show bearish fatigue and bullish divergences. This indicates that selling pressure is drying up and that the market is preparing for a solid technical rebound, which could establish a trading range and confirm a clear divergence on the daily chart.
#BTC80K🚀🚀
The Bitcoin market is presenting us with a highly interesting technical setup. Far from seeing only a worrying correction, the current structure is aligning almost perfectly in a **high-probability confluence** that supports the possibility of a larger rebound and the continuation of the primary uptrend.
### 📊 The Move’s Key Confluences
1. **The Fibonacci Golden Zone (0.5 - 0.618):**
The price has retraced exactly to the institutional equilibrium zone (the famous OTE - *Optimal Trade Entry*). In technical analysis, this range between the **0.5 and 0.618** levels of the previous impulse acts as a liquidity magnet, where major players take the opportunity to buy back in and position themselves in the direction of the primary trend without paying a premium.
2. **Elliott Wave Structure (Wave 2 / B):**
As we’ve been breaking down, this correction fits perfectly with the end of a corrective wave structure (Wave 2 or B). A confirmation of this support would mean the short-term bearish structure is running out of steam, paving the way for the expansive impulse of **Wave 3**, historically the most violent and profitable phase of the cycle.
3. **Confluence with the RSI (Divergences Developing):**
While the price moves deeper into or precisely tests this golden Fibonacci level, the RSI on lower timeframes (1H and 4H) is beginning to show bearish fatigue and bullish divergences. This indicates that selling pressure is drying up and that the market is preparing for a solid technical rebound, which could establish a trading range and confirm a clear divergence on the daily chart.
#BTC80K🚀🚀
1
120
·
--
Bullish
**🔥 $HOT Airdrop: How it works and how to farm faster!**
The official listing is coming, so don't sleep on it. The system rewards those who genuinely engage. Here's the lowdown:
* **How does it work?** Passive mining through the Telegram mini app, with points accumulated based on your activity in the NEAR ecosystem.
* **Upgrade your Storage:** Level it up so it doesn't fill up as quickly and you don't lose mining time.
* **Boost the Chimney:** It's the multiplier that speeds up hourly generation.
* **Complete missions:** Do quick tasks and transactions to secure your spot in the snapshot.
👉 **Join in and build your team with my link:** https://app.hot-labs.org/link?2034445uu 💎🚀
$HOT #Airdrop #Crypto
{spot}(NEARUSDT)
$HOT
**🔥 $HOT Airdrop: How it works and how to farm faster!**
The official listing is coming, so don't sleep on it. The system rewards those who genuinely engage. Here's the lowdown:
* **How does it work?** Passive mining through the Telegram mini app, with points accumulated based on your activity in the NEAR ecosystem.
* **Upgrade your Storage:** Level it up so it doesn't fill up as quickly and you don't lose mining time.
* **Boost the Chimney:** It's the multiplier that speeds up hourly generation.
* **Complete missions:** Do quick tasks and transactions to secure your spot in the snapshot.
👉 **Join in and build your team with my link:** https://app.hot-labs.org/link?2034445uu 💎🚀
$HOT #Airdrop #Crypto
$HOT
The official listing is coming, so don't sleep on it. The system rewards those who genuinely engage. Here's the lowdown:
* **How does it work?** Passive mining through the Telegram mini app, with points accumulated based on your activity in the NEAR ecosystem.
* **Upgrade your Storage:** Level it up so it doesn't fill up as quickly and you don't lose mining time.
* **Boost the Chimney:** It's the multiplier that speeds up hourly generation.
* **Complete missions:** Do quick tasks and transactions to secure your spot in the snapshot.
👉 **Join in and build your team with my link:** https://app.hot-labs.org/link?2034445uu 💎🚀
$HOT #Airdrop #Crypto
$HOT

207
·
--
Bullish
**The bounce is just around the corner! 🚀 Analyzing Bitcoin support and RSI**
The current zone between **$73,700 and $75,000 USD** is acting like a magnet and key support. If you’ve been following the play, you’ll know this level looks set to stop the correction and pave the way for what comes next.
🔍 **What are the indicators telling us?**
* **Divergences on the 1H and 4H:** Bullish divergences are starting to appear on the lower time frames. They won’t mark the definitive bottom of the year, but they’re ideal for stopping the bleeding.
* **The range scenario:** Most likely, this bounce will lead to **a few days of range-bound trading** in this zone. That sideways movement is exactly what the daily chart needs to finish consolidating a clear, strong divergence.
* **Spot outlook:** For spot trading, this is the time to be surgically patient. Accumulating gradually at support levels helps avoid headaches and puts you in a good position for the next impulse wave.
Are you buying at this support, or would you rather wait for the daily chart to confirm the pattern? Let me know in the comments below! 👇💬
$BTC
{spot}(BTCUSDT)
#bitcoin #CryptoTrading. #BinanceSquareTalks #TechnicalAnalysis
**The bounce is just around the corner! 🚀 Analyzing Bitcoin support and RSI**
The current zone between **$73,700 and $75,000 USD** is acting like a magnet and key support. If you’ve been following the play, you’ll know this level looks set to stop the correction and pave the way for what comes next.
🔍 **What are the indicators telling us?**
* **Divergences on the 1H and 4H:** Bullish divergences are starting to appear on the lower time frames. They won’t mark the definitive bottom of the year, but they’re ideal for stopping the bleeding.
* **The range scenario:** Most likely, this bounce will lead to **a few days of range-bound trading** in this zone. That sideways movement is exactly what the daily chart needs to finish consolidating a clear, strong divergence.
* **Spot outlook:** For spot trading, this is the time to be surgically patient. Accumulating gradually at support levels helps avoid headaches and puts you in a good position for the next impulse wave.
Are you buying at this support, or would you rather wait for the daily chart to confirm the pattern? Let me know in the comments below! 👇💬
$BTC
#bitcoin #CryptoTrading. #BinanceSquareTalks #TechnicalAnalysis
The current zone between **$73,700 and $75,000 USD** is acting like a magnet and key support. If you’ve been following the play, you’ll know this level looks set to stop the correction and pave the way for what comes next.
🔍 **What are the indicators telling us?**
* **Divergences on the 1H and 4H:** Bullish divergences are starting to appear on the lower time frames. They won’t mark the definitive bottom of the year, but they’re ideal for stopping the bleeding.
* **The range scenario:** Most likely, this bounce will lead to **a few days of range-bound trading** in this zone. That sideways movement is exactly what the daily chart needs to finish consolidating a clear, strong divergence.
* **Spot outlook:** For spot trading, this is the time to be surgically patient. Accumulating gradually at support levels helps avoid headaches and puts you in a good position for the next impulse wave.
Are you buying at this support, or would you rather wait for the daily chart to confirm the pattern? Let me know in the comments below! 👇💬
$BTC
#bitcoin #CryptoTrading. #BinanceSquareTalks #TechnicalAnalysis
112
·
--
Bullish
Accumulating BTC efficiently without suffering from daily volatility is possible by implementing a structured plan.
1. The Core: Automation with DCA (Dollar-Cost Averaging)
Consistency over timing: Instead of risking all your capital trying to guess the market bottom, set aside a fixed amount (e.g., weekly or monthly) that fits your finances.
Automation on Binance: Set up the Auto-Invest tool on the Spot platform to buy Bitcoin on a schedule, eliminating emotional noise and the stress of watching screens.
2. The Tactical Boost: “Buy the Dip” (Buying on corrections)
Take advantage of pullbacks: Keep 20% or 30% of your capital in stablecoins (such as USDT or USDC) on Binance so you can make occasional manual purchases only when the market experiences sharp corrections or drops toward important technical support levels.
Sentiment analysis: Monitor the Fear & Greed Index; periods of “Extreme Fear” have historically tended to be the most profitable accumulation windows in the long term.
3. Risk Management and Storage
Long-term perspective: Treat your Bitcoin purchases as a store-of-value asset to hold for several years, avoiding panic selling during short-term volatility.
Security: If you trade with large amounts of capital, remember to periodically withdraw your satoshis from the platform to a cold wallet (hardware wallet) so you retain full custody under your own control.
What do you think of this strategy? Do you prefer making one-time purchases or automating your entries with DCA? Let me know in the comments and follow me on Binance Square for more crypto content! 🚀#btc #bitcoin #BinanceSquareTalks
{spot}(BTCUSDT)
Accumulating BTC efficiently without suffering from daily volatility is possible by implementing a structured plan.
1. The Core: Automation with DCA (Dollar-Cost Averaging)
Consistency over timing: Instead of risking all your capital trying to guess the market bottom, set aside a fixed amount (e.g., weekly or monthly) that fits your finances.
Automation on Binance: Set up the Auto-Invest tool on the Spot platform to buy Bitcoin on a schedule, eliminating emotional noise and the stress of watching screens.
2. The Tactical Boost: “Buy the Dip” (Buying on corrections)
Take advantage of pullbacks: Keep 20% or 30% of your capital in stablecoins (such as USDT or USDC) on Binance so you can make occasional manual purchases only when the market experiences sharp corrections or drops toward important technical support levels.
Sentiment analysis: Monitor the Fear & Greed Index; periods of “Extreme Fear” have historically tended to be the most profitable accumulation windows in the long term.
3. Risk Management and Storage
Long-term perspective: Treat your Bitcoin purchases as a store-of-value asset to hold for several years, avoiding panic selling during short-term volatility.
Security: If you trade with large amounts of capital, remember to periodically withdraw your satoshis from the platform to a cold wallet (hardware wallet) so you retain full custody under your own control.
What do you think of this strategy? Do you prefer making one-time purchases or automating your entries with DCA? Let me know in the comments and follow me on Binance Square for more crypto content! 🚀#btc #bitcoin #BinanceSquareTalks
1. The Core: Automation with DCA (Dollar-Cost Averaging)
Consistency over timing: Instead of risking all your capital trying to guess the market bottom, set aside a fixed amount (e.g., weekly or monthly) that fits your finances.
Automation on Binance: Set up the Auto-Invest tool on the Spot platform to buy Bitcoin on a schedule, eliminating emotional noise and the stress of watching screens.
2. The Tactical Boost: “Buy the Dip” (Buying on corrections)
Take advantage of pullbacks: Keep 20% or 30% of your capital in stablecoins (such as USDT or USDC) on Binance so you can make occasional manual purchases only when the market experiences sharp corrections or drops toward important technical support levels.
Sentiment analysis: Monitor the Fear & Greed Index; periods of “Extreme Fear” have historically tended to be the most profitable accumulation windows in the long term.
3. Risk Management and Storage
Long-term perspective: Treat your Bitcoin purchases as a store-of-value asset to hold for several years, avoiding panic selling during short-term volatility.
Security: If you trade with large amounts of capital, remember to periodically withdraw your satoshis from the platform to a cold wallet (hardware wallet) so you retain full custody under your own control.
What do you think of this strategy? Do you prefer making one-time purchases or automating your entries with DCA? Let me know in the comments and follow me on Binance Square for more crypto content! 🚀#btc #bitcoin #BinanceSquareTalks
101
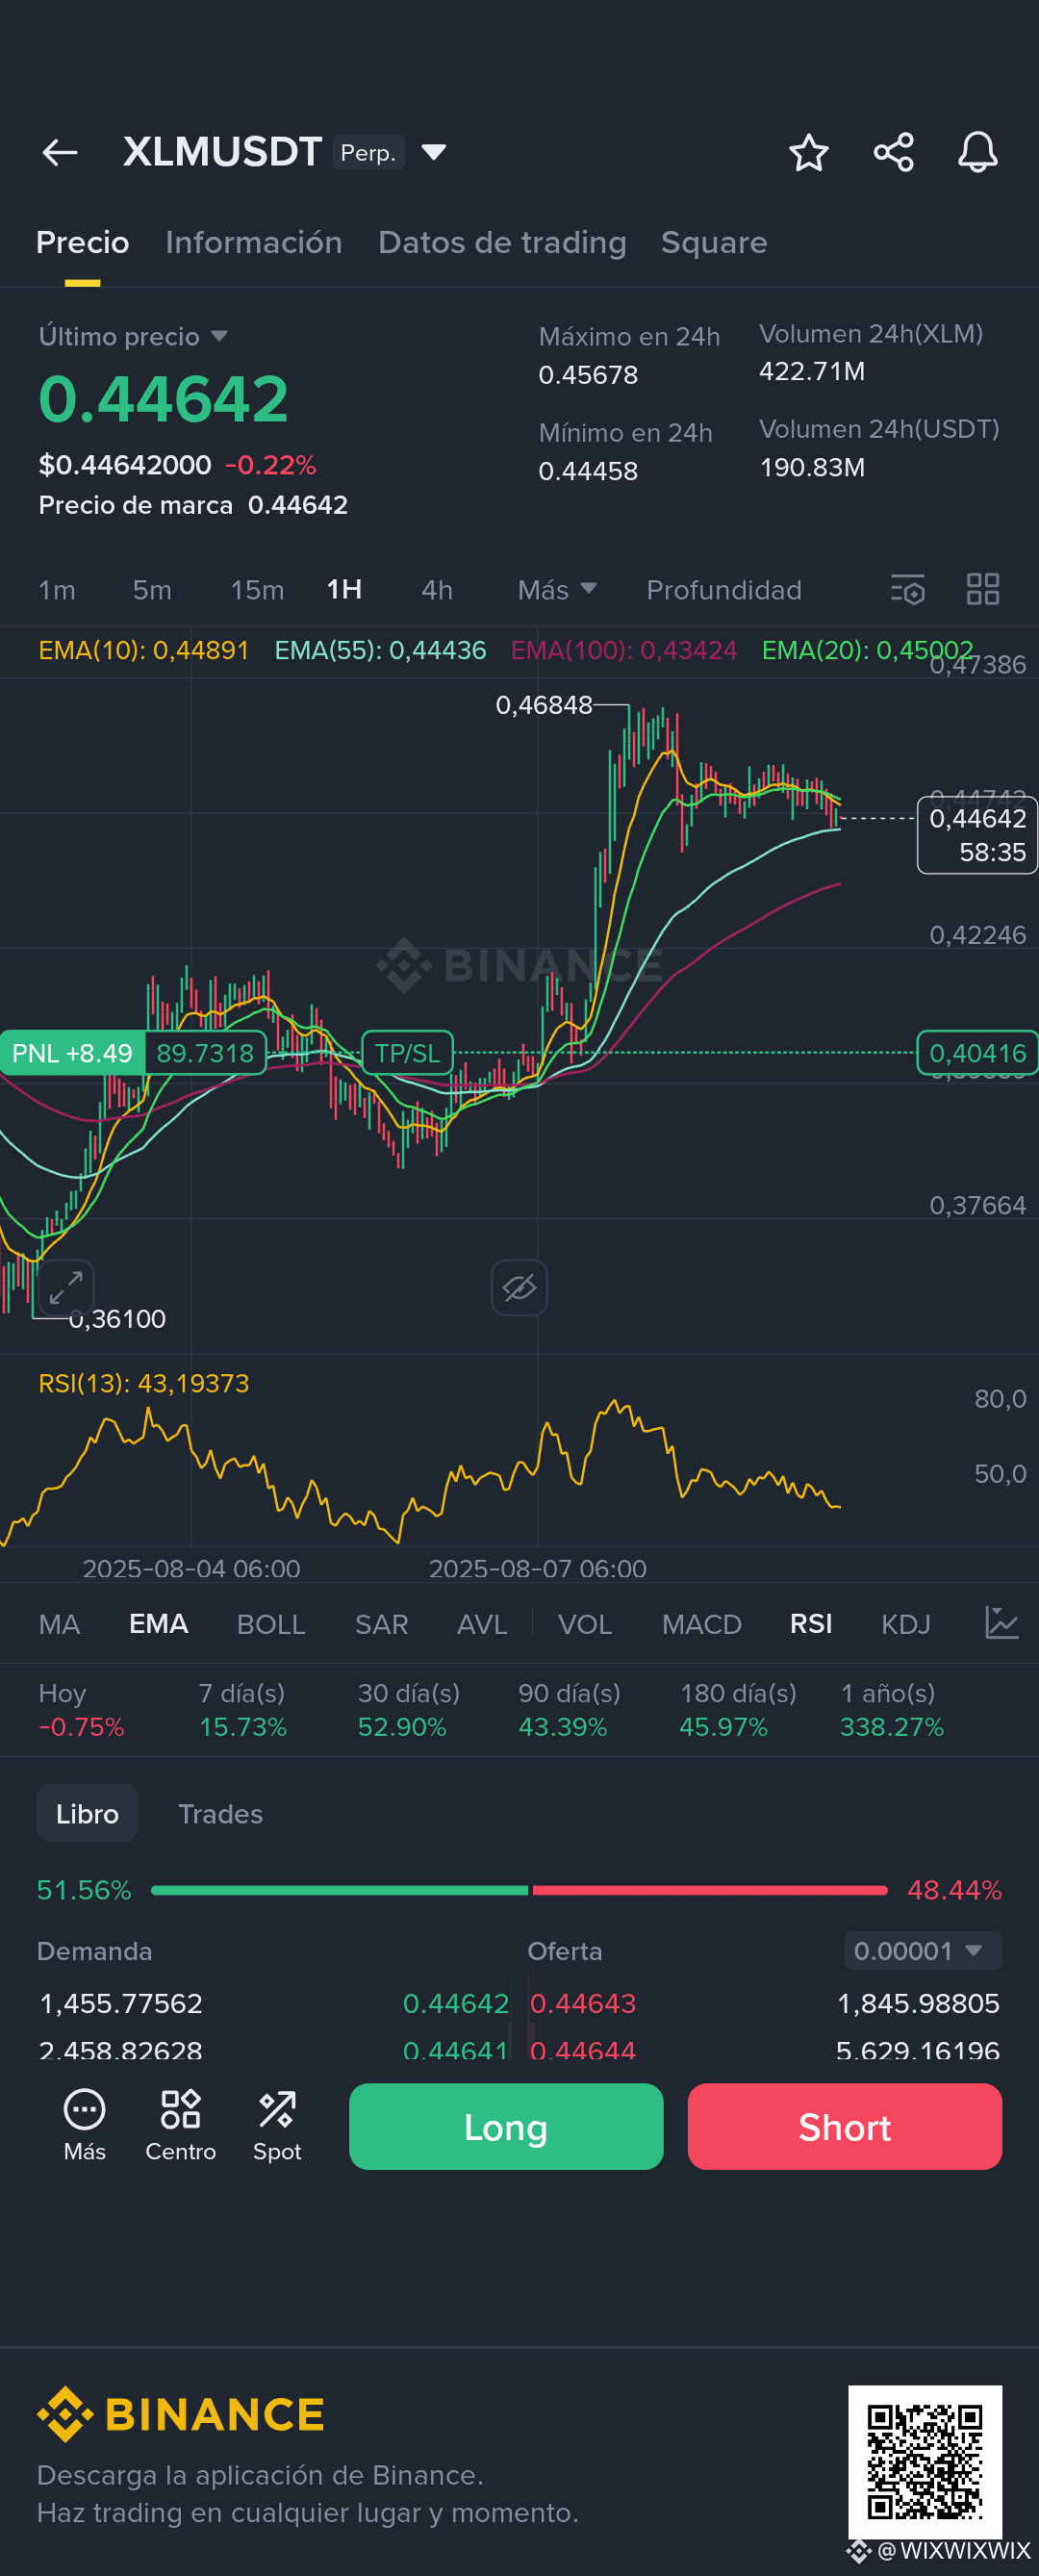
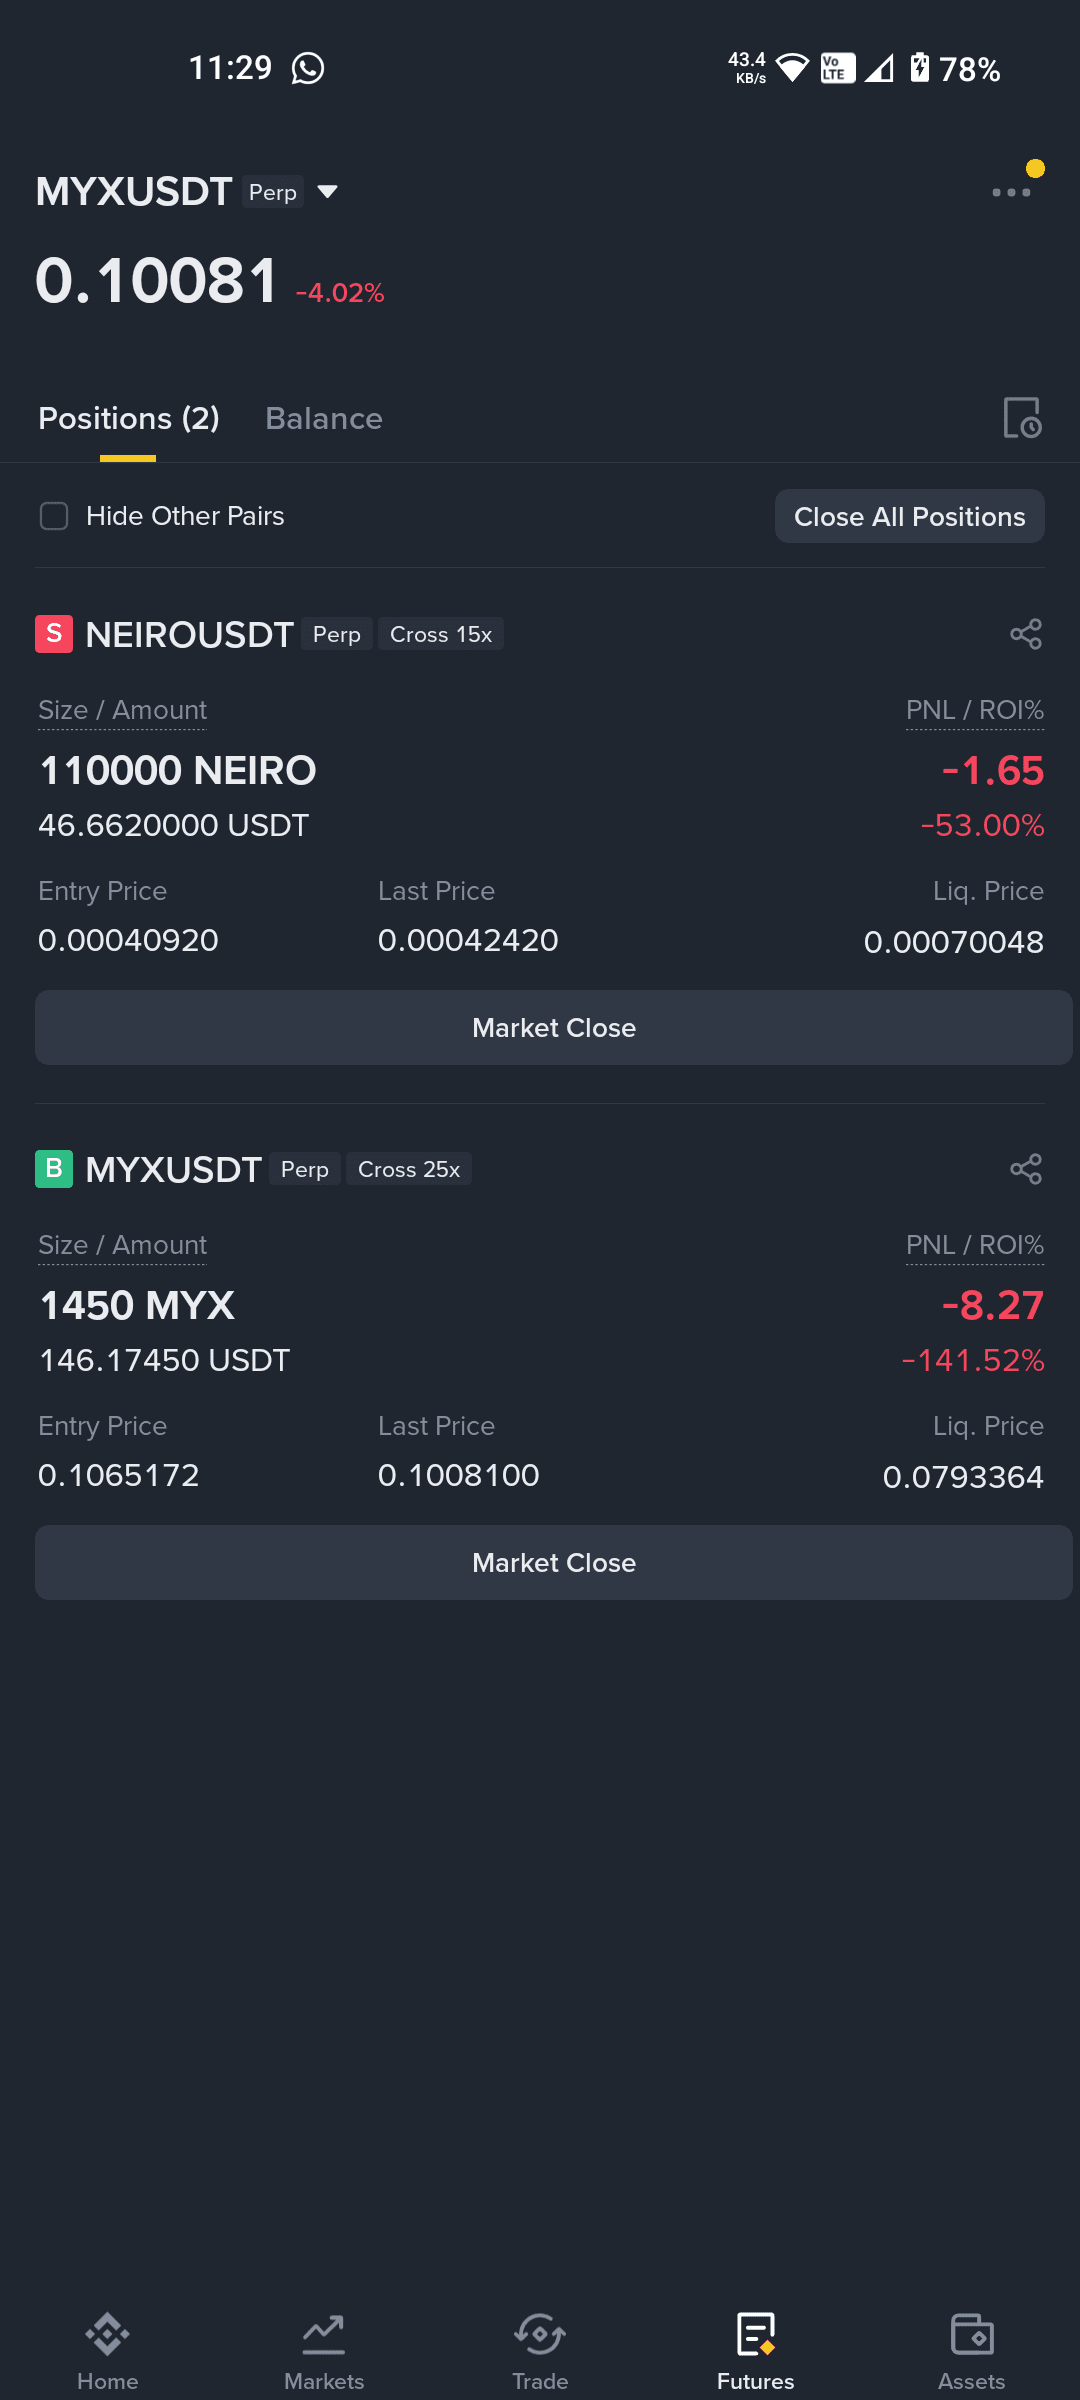
I'm not an expert but for me it's going down, you have to assume losses. The next time you trade, put the margin in isolation so if the market moves against you, you only lose what you risked.
I'm not an expert but for me it's going down, you have to assume losses. The next time you trade, put the margin in isolation so if the market moves against you, you only lose what you risked.

abhi_rick7
·
--
#MYX any expert what should i do help
4
11
Log in to explore more content
Join global crypto users on Binance Square
⚡️ Get latest and useful information about crypto.
💬 Trusted by the world’s largest crypto exchange.
👍 Discover real insights from verified creators.
Email / Phone number
Trending Topics
A Packed Week of Earnings and Data Tests Markets
58,002 views
381 Discussing
🚨🇺🇸 BIG WEEK AHEAD FOR THE MARKETS!
Markets are pricing in a Fed rate hike in December and $BTC could see some big moves next week.
Here's what's coming:
• Monday: Fed Chair Warsh speaks
• Tuesday: US Retail Sales + $NVDA earnings
• Wednesday: FOMC Minutes
• Thursday: Jobless Claims + Philly Fed Index
• Friday: Consumer Sentiment + Fed speeches
All eyes on $BTC as another important week begins.
#bitcoin
Mookie
·15 Likes
·6.2k views
AnthropicIPOTestsInvestorAppetiteForAI
106,268 views
1,305 Discussing
BitcoinExtendsLosingStreakToSixWeeks
76,897 views
673 Discussing