
万联welinkBTC
8.6k Posts

万联welinkBTC
 Square Verified+
Report
Block User
万物互联,数字为王 | x:@fly_welinkBTC |开发者🔗 ai.welinkbtc.xyz 🔥链上指标分析🔥 16年入圈,4年社区运营经验,主业 HW程序员,擅长socialfi领域;专注Web3、链游、AI、AirDrop投资机会;【监控全网100位币圈达人,一起穿越牛熊】
Open Trade
High-Frequency Trader
8.3 Years
283 Following
53.4K+ Followers
66.0K+ Liked
Posts
Portfolio
All
Quotes
Videos
Live
PINNED
·
--

Article
Our platform is officially live! WELINKBTC - Everything is interconnected, and data is king. Connect Bitcoin market signals to real execution.Today
We are very pleased to announce
Our platform is officially live!
After less than two weeks of internal testing
There are already over 100 early users.
Portal
https://welinkbtc-onchainmain.xyz/
Benefits time 😍
1. AccessCode Early Experience Code:
WELINKMAX (Get 1 month of free MAX early experience upon binding)
2. An airdrop reward of up to 50u will be provided to real users who have bound both X (Twitter) and a wallet during the early stage;
3. For each invited registered user, you can receive a reward of 0.1u.
4. For each invited valid user, you can receive a reward of 2u.
5. For each invited subscribed user, you can receive first-level subscription rewards of 12%, and second-level subscription rewards of 3%;
Our platform is officially live! WELINKBTC - Everything is interconnected, and data is king. Connect Bitcoin market signals to real execution.
Today
We are very pleased to announce
Our platform is officially live!
After less than two weeks of internal testing
There are already over 100 early users.
Portal
https://welinkbtc-onchainmain.xyz/
Benefits time 😍
1. AccessCode Early Experience Code:
WELINKMAX (Get 1 month of free MAX early experience upon binding)
2. An airdrop reward of up to 50u will be provided to real users who have bound both X (Twitter) and a wallet during the early stage;
3. For each invited registered user, you can receive a reward of 0.1u.
4. For each invited valid user, you can receive a reward of 2u.
5. For each invited subscribed user, you can receive first-level subscription rewards of 12%, and second-level subscription rewards of 3%;
We are very pleased to announce
Our platform is officially live!
After less than two weeks of internal testing
There are already over 100 early users.
Portal
https://welinkbtc-onchainmain.xyz/
Benefits time 😍
1. AccessCode Early Experience Code:
WELINKMAX (Get 1 month of free MAX early experience upon binding)
2. An airdrop reward of up to 50u will be provided to real users who have bound both X (Twitter) and a wallet during the early stage;
3. For each invited registered user, you can receive a reward of 0.1u.
4. For each invited valid user, you can receive a reward of 2u.
5. For each invited subscribed user, you can receive first-level subscription rewards of 12%, and second-level subscription rewards of 3%;
22
1
41
4.8k
PINNED
·
--

Article
My bizarre experience under the hands of a big boss! My true story (full)This article is sponsored by @SafePal
@welinkBTC Creation
I will tell you my bizarre experience, the true story of my time at the hands of the big boss!
In 2002, I resigned from my job as vice president of a listed company in Ji'an, Jiangxi. As a young and successful man, I always wanted to make great achievements. However, I realized that I was just a person with no background, no connections, and no funds. After several rounds of introductions, I met a retired major general in Beijing.
At first I thought it was a scam on TV, but after checking several times I found it was true, and then I became his disciple. I thought I had finally reached the ceiling in China and the story had just begun.
My bizarre experience under the hands of a big boss! My true story (full)
This article is sponsored by @SafePal
@万联welinkBTC Creation
I will tell you my bizarre experience, the true story of my time at the hands of the big boss!
In 2002, I resigned from my job as vice president of a listed company in Ji'an, Jiangxi. As a young and successful man, I always wanted to make great achievements. However, I realized that I was just a person with no background, no connections, and no funds. After several rounds of introductions, I met a retired major general in Beijing.
At first I thought it was a scam on TV, but after checking several times I found it was true, and then I became his disciple. I thought I had finally reached the ceiling in China and the story had just begun.
@万联welinkBTC Creation
I will tell you my bizarre experience, the true story of my time at the hands of the big boss!
In 2002, I resigned from my job as vice president of a listed company in Ji'an, Jiangxi. As a young and successful man, I always wanted to make great achievements. However, I realized that I was just a person with no background, no connections, and no funds. After several rounds of introductions, I met a retired major general in Beijing.
At first I thought it was a scam on TV, but after checking several times I found it was true, and then I became his disciple. I thought I had finally reached the ceiling in China and the story had just begun.
87
25
110
5.5k
·
--
#On-chain Metrics Analysis
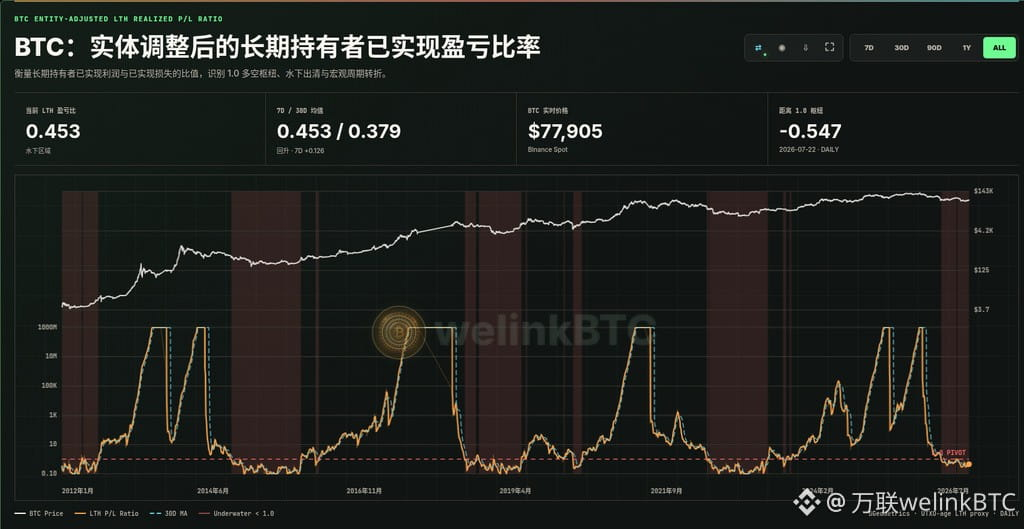
BTC: Entity-Adjusted Long-Term Holder Realized Profit/Loss Ratio
This ratio compares realized profits with realized losses for coins held for more than approximately 155 days: above 1.0 indicates profit-taking is dominant, while below 1.0 indicates that long-term holders are also selling at a loss. Crossing back above 1.0 is an important signal for observing shifts in macro sentiment and identifying underwater capitulation and cycle turning points.
Current status · Underwater zone · LTH profit/loss ratio 0.453
The current 7-day smoothed ratio is 0.453, below 1.0, indicating that loss realization among long-term holders is dominant; the 30-day average is 0.379. The current underwater period has lasted 70 days since 2026-05-14, with a 7-day change of +0.126 (recovering), and is −0.547 away from the 1.0 pivot. On-chain date: 2026-07-22; BTC spot price: approximately $77,905 (Binance Spot).
Historical reference: Historically, the underwater red zone has spanned deep bear-market phases. Comparison samples include the 2022 low of approximately 0.08, lasting 335 days (2022-05-21→2023-04-28); the brief 2023 dip to 0.32, lasting 19 days (2023-07-28→2023-08-15); and two periods in 2026: 0.38, lasting 87 days (2026-02-09→2026-05-09), and the current period, with a low of approximately 0.29, lasting 70 days (2026-05-14→2026-07-22). Ranges: \u003c1.0 underwater capitulation, 1.0–1.5 pivot recovery, 1.5–20 profit-dominant, \u003e20 high-level distribution. The underwater red zone is not a single-day bottom-fishing signal; it is more useful for assessing whether long-term holders are undergoing sustained capitulation and redistribution. A clearer signal of recovery from the right-hand side emerges only when the ratio bottoms and then breaks back above 1.0; confirmation should still be sought from spot demand, realized price, liquidity, and price structure. For cycle research only; this is not investment advice.
More curated on-chain cycle indicators
Portal
https://welinkbtc-onchainmain.xyz/
Understand cycles like a professional analyst
$BTC
#On-chain Metrics Analysis
BTC: Entity-Adjusted Long-Term Holder Realized Profit/Loss Ratio
This ratio compares realized profits with realized losses for coins held for more than approximately 155 days: above 1.0 indicates profit-taking is dominant, while below 1.0 indicates that long-term holders are also selling at a loss. Crossing back above 1.0 is an important signal for observing shifts in macro sentiment and identifying underwater capitulation and cycle turning points.
Current status · Underwater zone · LTH profit/loss ratio 0.453
The current 7-day smoothed ratio is 0.453, below 1.0, indicating that loss realization among long-term holders is dominant; the 30-day average is 0.379. The current underwater period has lasted 70 days since 2026-05-14, with a 7-day change of +0.126 (recovering), and is −0.547 away from the 1.0 pivot. On-chain date: 2026-07-22; BTC spot price: approximately $77,905 (Binance Spot).
Historical reference: Historically, the underwater red zone has spanned deep bear-market phases. Comparison samples include the 2022 low of approximately 0.08, lasting 335 days (2022-05-21→2023-04-28); the brief 2023 dip to 0.32, lasting 19 days (2023-07-28→2023-08-15); and two periods in 2026: 0.38, lasting 87 days (2026-02-09→2026-05-09), and the current period, with a low of approximately 0.29, lasting 70 days (2026-05-14→2026-07-22). Ranges: \u003c1.0 underwater capitulation, 1.0–1.5 pivot recovery, 1.5–20 profit-dominant, \u003e20 high-level distribution. The underwater red zone is not a single-day bottom-fishing signal; it is more useful for assessing whether long-term holders are undergoing sustained capitulation and redistribution. A clearer signal of recovery from the right-hand side emerges only when the ratio bottoms and then breaks back above 1.0; confirmation should still be sought from spot demand, realized price, liquidity, and price structure. For cycle research only; this is not investment advice.
More curated on-chain cycle indicators
Portal
https://welinkbtc-onchainmain.xyz/
Understand cycles like a professional analyst
$BTC
BTC: Entity-Adjusted Long-Term Holder Realized Profit/Loss Ratio
This ratio compares realized profits with realized losses for coins held for more than approximately 155 days: above 1.0 indicates profit-taking is dominant, while below 1.0 indicates that long-term holders are also selling at a loss. Crossing back above 1.0 is an important signal for observing shifts in macro sentiment and identifying underwater capitulation and cycle turning points.
Current status · Underwater zone · LTH profit/loss ratio 0.453
The current 7-day smoothed ratio is 0.453, below 1.0, indicating that loss realization among long-term holders is dominant; the 30-day average is 0.379. The current underwater period has lasted 70 days since 2026-05-14, with a 7-day change of +0.126 (recovering), and is −0.547 away from the 1.0 pivot. On-chain date: 2026-07-22; BTC spot price: approximately $77,905 (Binance Spot).
Historical reference: Historically, the underwater red zone has spanned deep bear-market phases. Comparison samples include the 2022 low of approximately 0.08, lasting 335 days (2022-05-21→2023-04-28); the brief 2023 dip to 0.32, lasting 19 days (2023-07-28→2023-08-15); and two periods in 2026: 0.38, lasting 87 days (2026-02-09→2026-05-09), and the current period, with a low of approximately 0.29, lasting 70 days (2026-05-14→2026-07-22). Ranges: \u003c1.0 underwater capitulation, 1.0–1.5 pivot recovery, 1.5–20 profit-dominant, \u003e20 high-level distribution. The underwater red zone is not a single-day bottom-fishing signal; it is more useful for assessing whether long-term holders are undergoing sustained capitulation and redistribution. A clearer signal of recovery from the right-hand side emerges only when the ratio bottoms and then breaks back above 1.0; confirmation should still be sought from spot demand, realized price, liquidity, and price structure. For cycle research only; this is not investment advice.
More curated on-chain cycle indicators
Portal
https://welinkbtc-onchainmain.xyz/
Understand cycles like a professional analyst
$BTC
2
1k
·
--
# On-Chain Metrics Analysis
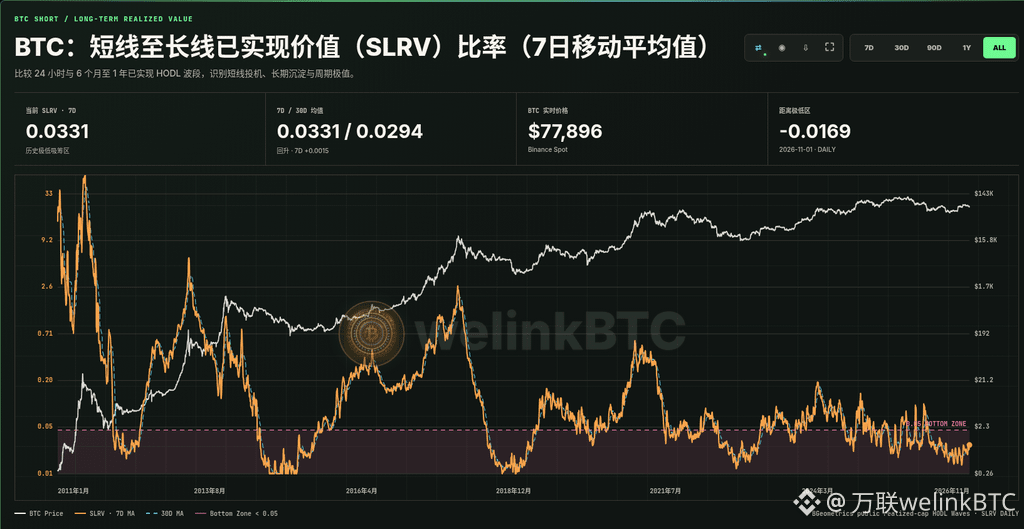
BTC: Short-Term to Long-Term Realized Value (SLRV) Ratio (7-Day Moving Average)
SLRV = 24-hour realized HODL wave ÷ 6-month to 1-year realized HODL wave, with a 7-day moving average applied to the daily ratio. It compares the relative strength of short-term speculative flows and medium- to long-term coin accumulation, helping identify cyclical extremes.
Current status · Historical extreme-low accumulation zone · 7D SLRV 0.0331
The current 7-day average SLRV is 0.0331, entering the historical extreme-low zone below 0.05; the 30-day average is 0.0294. Short-term speculative flows have contracted significantly, and the coin structure is leaning more toward accumulation. 7-day change: +0.0015 (rebounding); raw daily ratio: 0.0221. The current stretch in the historical extreme-low zone has lasted 30 days; distance from the extreme-low threshold: −0.0169. On-chain date: 2026-11-01. BTC spot price: approximately $77,896 (Binance Spot).
Historical references: Recent extreme-low zone examples include 2025-07-22→2025-08-22 (low of 0.0234, 32 days), 2025-10-01→2025-11-18 (0.0295, 49 days), and 2025-11-29→2026-01-08 (0.0291, 41 days); the current cycle, from 2026-02-12 through 2026-11-01, has a low of 0.0190 and has lasted 263 days so far (ongoing). Zones: <0.05 historical extreme-low zone (speculation cooling; watch for long-term accumulation), 0.05–1.0 normal equilibrium, 1.0–3.0 rising activity, >3.0 overheated distribution. Historical lows are not single-day buy-the-dip signals; they are better viewed as structural windows in which speculative excess is persistently compressed. Long-term accumulation signals are more reliable when a low SLRV is accompanied by recovering spot demand, support from realized price, and improving liquidity. For cyclical research only; not investment advice.
More curated on-chain cycle indicators
Portal
https://welinkbtc-onchainmain.xyz/
Understand market cycles like a professional analyst
$BTC
# On-Chain Metrics Analysis
BTC: Short-Term to Long-Term Realized Value (SLRV) Ratio (7-Day Moving Average)
SLRV = 24-hour realized HODL wave ÷ 6-month to 1-year realized HODL wave, with a 7-day moving average applied to the daily ratio. It compares the relative strength of short-term speculative flows and medium- to long-term coin accumulation, helping identify cyclical extremes.
Current status · Historical extreme-low accumulation zone · 7D SLRV 0.0331
The current 7-day average SLRV is 0.0331, entering the historical extreme-low zone below 0.05; the 30-day average is 0.0294. Short-term speculative flows have contracted significantly, and the coin structure is leaning more toward accumulation. 7-day change: +0.0015 (rebounding); raw daily ratio: 0.0221. The current stretch in the historical extreme-low zone has lasted 30 days; distance from the extreme-low threshold: −0.0169. On-chain date: 2026-11-01. BTC spot price: approximately $77,896 (Binance Spot).
Historical references: Recent extreme-low zone examples include 2025-07-22→2025-08-22 (low of 0.0234, 32 days), 2025-10-01→2025-11-18 (0.0295, 49 days), and 2025-11-29→2026-01-08 (0.0291, 41 days); the current cycle, from 2026-02-12 through 2026-11-01, has a low of 0.0190 and has lasted 263 days so far (ongoing). Zones: <0.05 historical extreme-low zone (speculation cooling; watch for long-term accumulation), 0.05–1.0 normal equilibrium, 1.0–3.0 rising activity, >3.0 overheated distribution. Historical lows are not single-day buy-the-dip signals; they are better viewed as structural windows in which speculative excess is persistently compressed. Long-term accumulation signals are more reliable when a low SLRV is accompanied by recovering spot demand, support from realized price, and improving liquidity. For cyclical research only; not investment advice.
More curated on-chain cycle indicators
Portal
https://welinkbtc-onchainmain.xyz/
Understand market cycles like a professional analyst
$BTC
BTC: Short-Term to Long-Term Realized Value (SLRV) Ratio (7-Day Moving Average)
SLRV = 24-hour realized HODL wave ÷ 6-month to 1-year realized HODL wave, with a 7-day moving average applied to the daily ratio. It compares the relative strength of short-term speculative flows and medium- to long-term coin accumulation, helping identify cyclical extremes.
Current status · Historical extreme-low accumulation zone · 7D SLRV 0.0331
The current 7-day average SLRV is 0.0331, entering the historical extreme-low zone below 0.05; the 30-day average is 0.0294. Short-term speculative flows have contracted significantly, and the coin structure is leaning more toward accumulation. 7-day change: +0.0015 (rebounding); raw daily ratio: 0.0221. The current stretch in the historical extreme-low zone has lasted 30 days; distance from the extreme-low threshold: −0.0169. On-chain date: 2026-11-01. BTC spot price: approximately $77,896 (Binance Spot).
Historical references: Recent extreme-low zone examples include 2025-07-22→2025-08-22 (low of 0.0234, 32 days), 2025-10-01→2025-11-18 (0.0295, 49 days), and 2025-11-29→2026-01-08 (0.0291, 41 days); the current cycle, from 2026-02-12 through 2026-11-01, has a low of 0.0190 and has lasted 263 days so far (ongoing). Zones: <0.05 historical extreme-low zone (speculation cooling; watch for long-term accumulation), 0.05–1.0 normal equilibrium, 1.0–3.0 rising activity, >3.0 overheated distribution. Historical lows are not single-day buy-the-dip signals; they are better viewed as structural windows in which speculative excess is persistently compressed. Long-term accumulation signals are more reliable when a low SLRV is accompanied by recovering spot demand, support from realized price, and improving liquidity. For cyclical research only; not investment advice.
More curated on-chain cycle indicators
Portal
https://welinkbtc-onchainmain.xyz/
Understand market cycles like a professional analyst
$BTC
2
1.1k
·
--
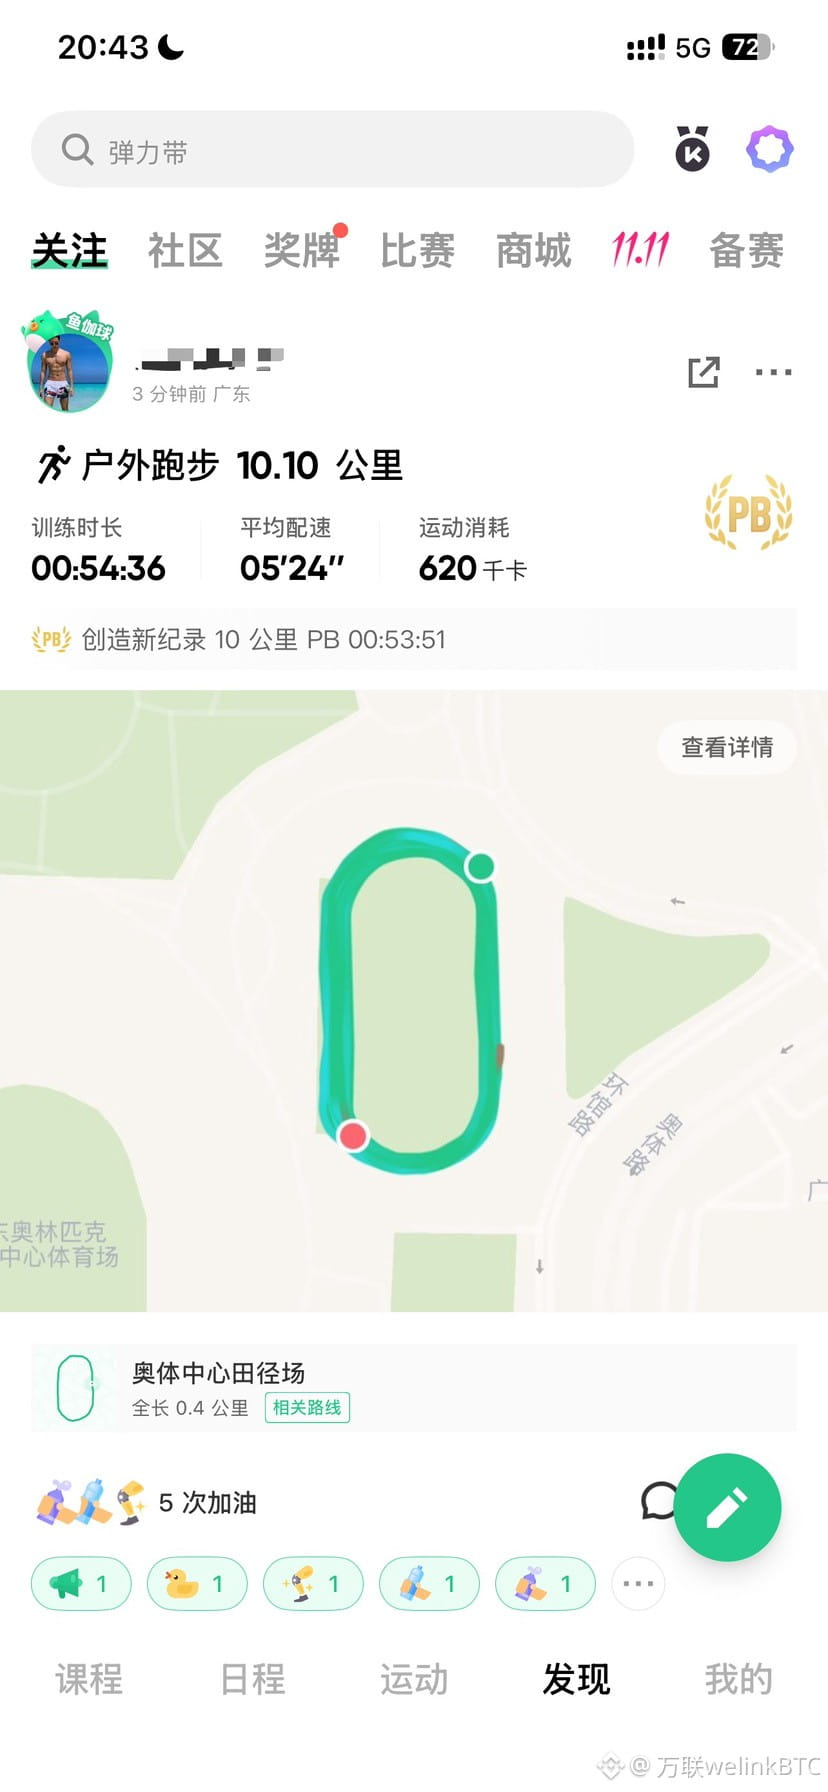
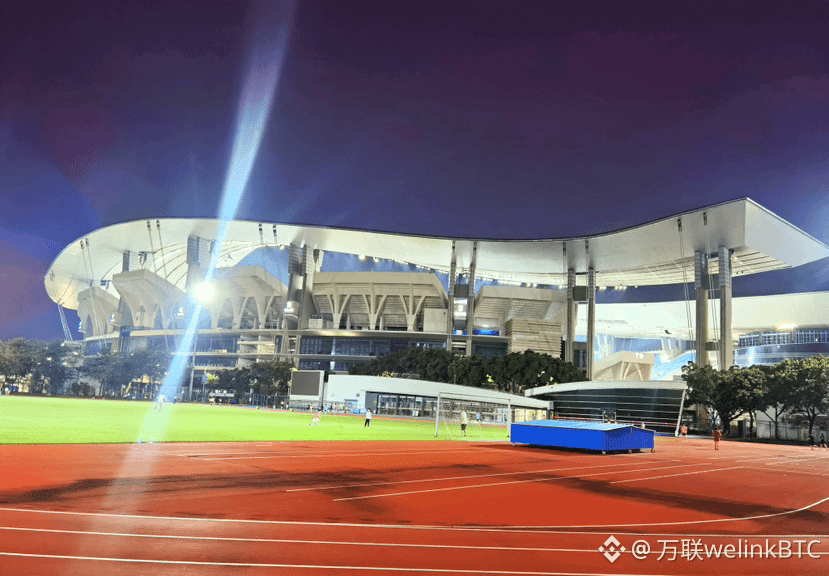
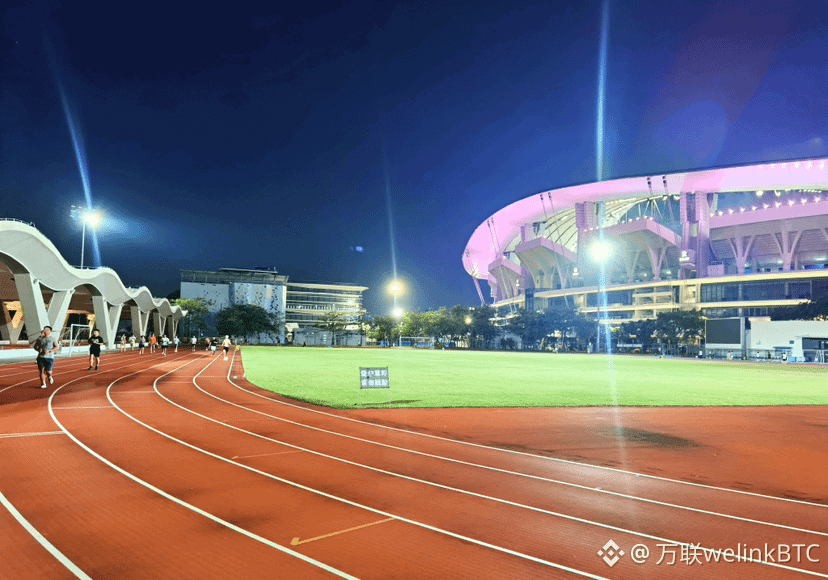
Finished today's 10-kilometer run
Feeling better and better
Ten kilometers in one go—not bad!
Keep exercising 💪 Get moving
🥳🥳🥳
#币安已处理46.5亿美元提款
$BNB
{future}(BNBUSDT)
Finished today's 10-kilometer run
Feeling better and better
Ten kilometers in one go—not bad!
Keep exercising 💪 Get moving
🥳🥳🥳
#币安已处理46.5亿美元提款
$BNB
Feeling better and better
Ten kilometers in one go—not bad!
Keep exercising 💪 Get moving
🥳🥳🥳
#币安已处理46.5亿美元提款
$BNB

4
3
1.2k
·
--
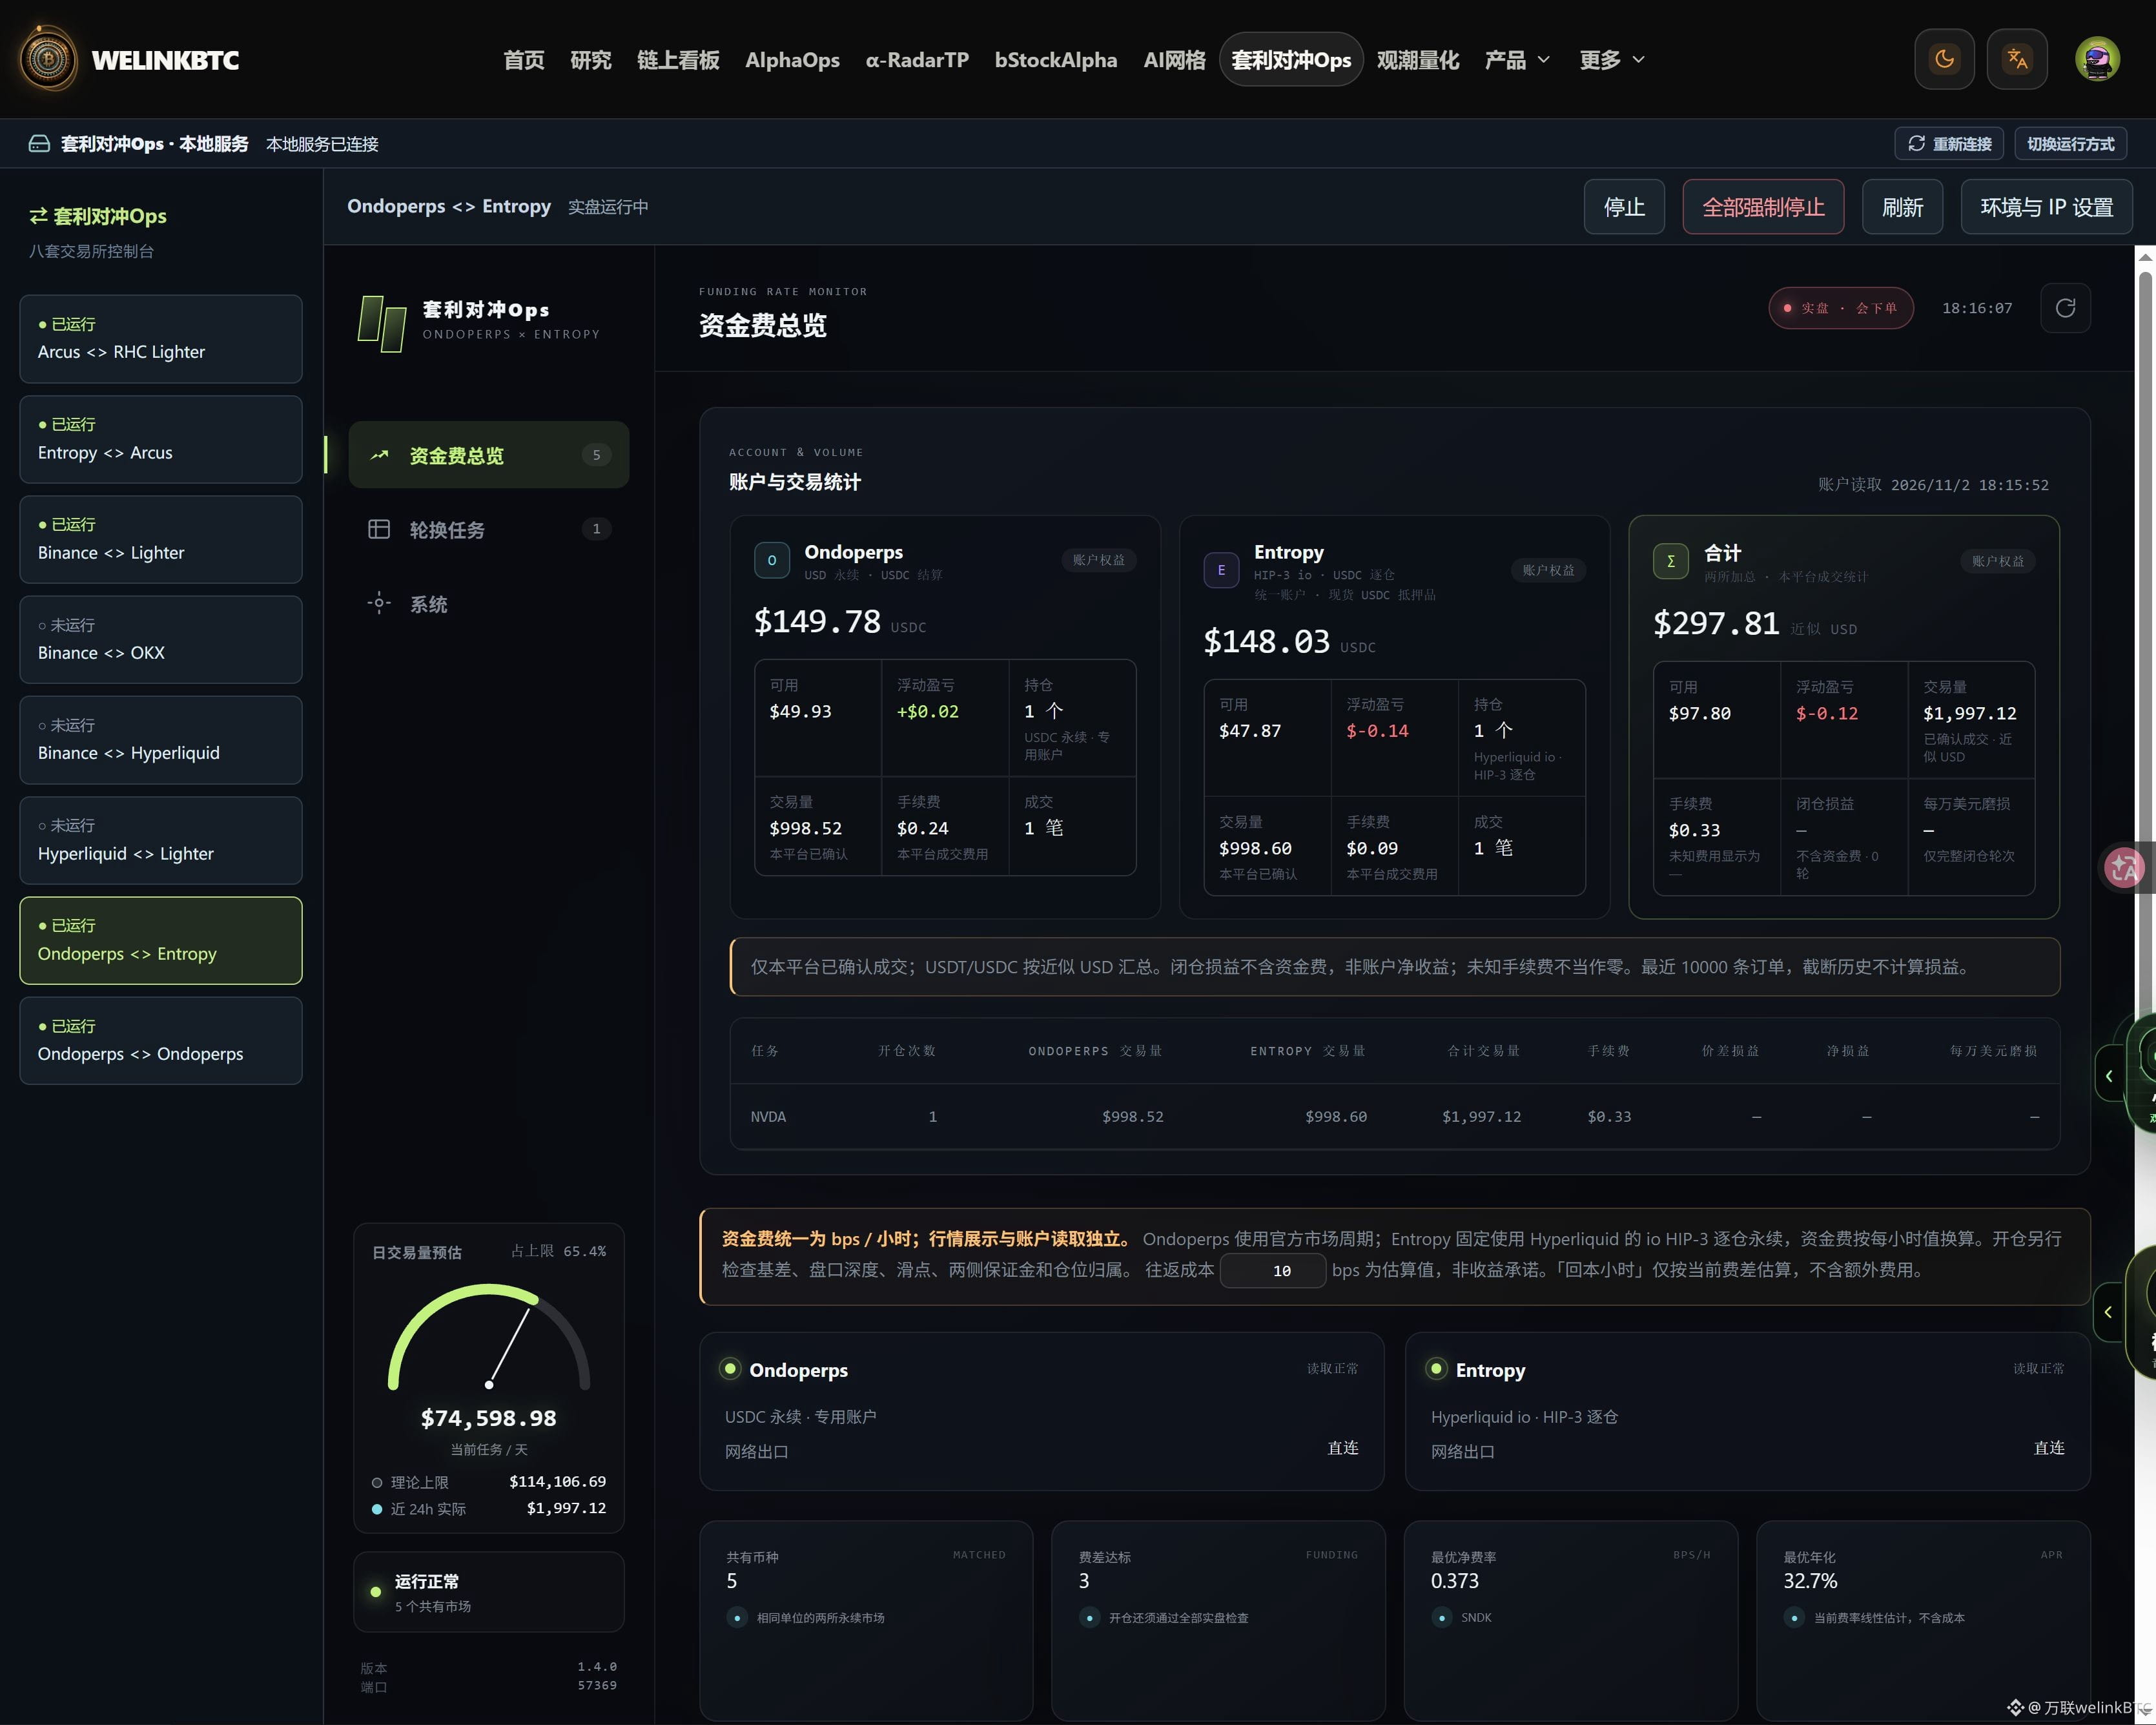
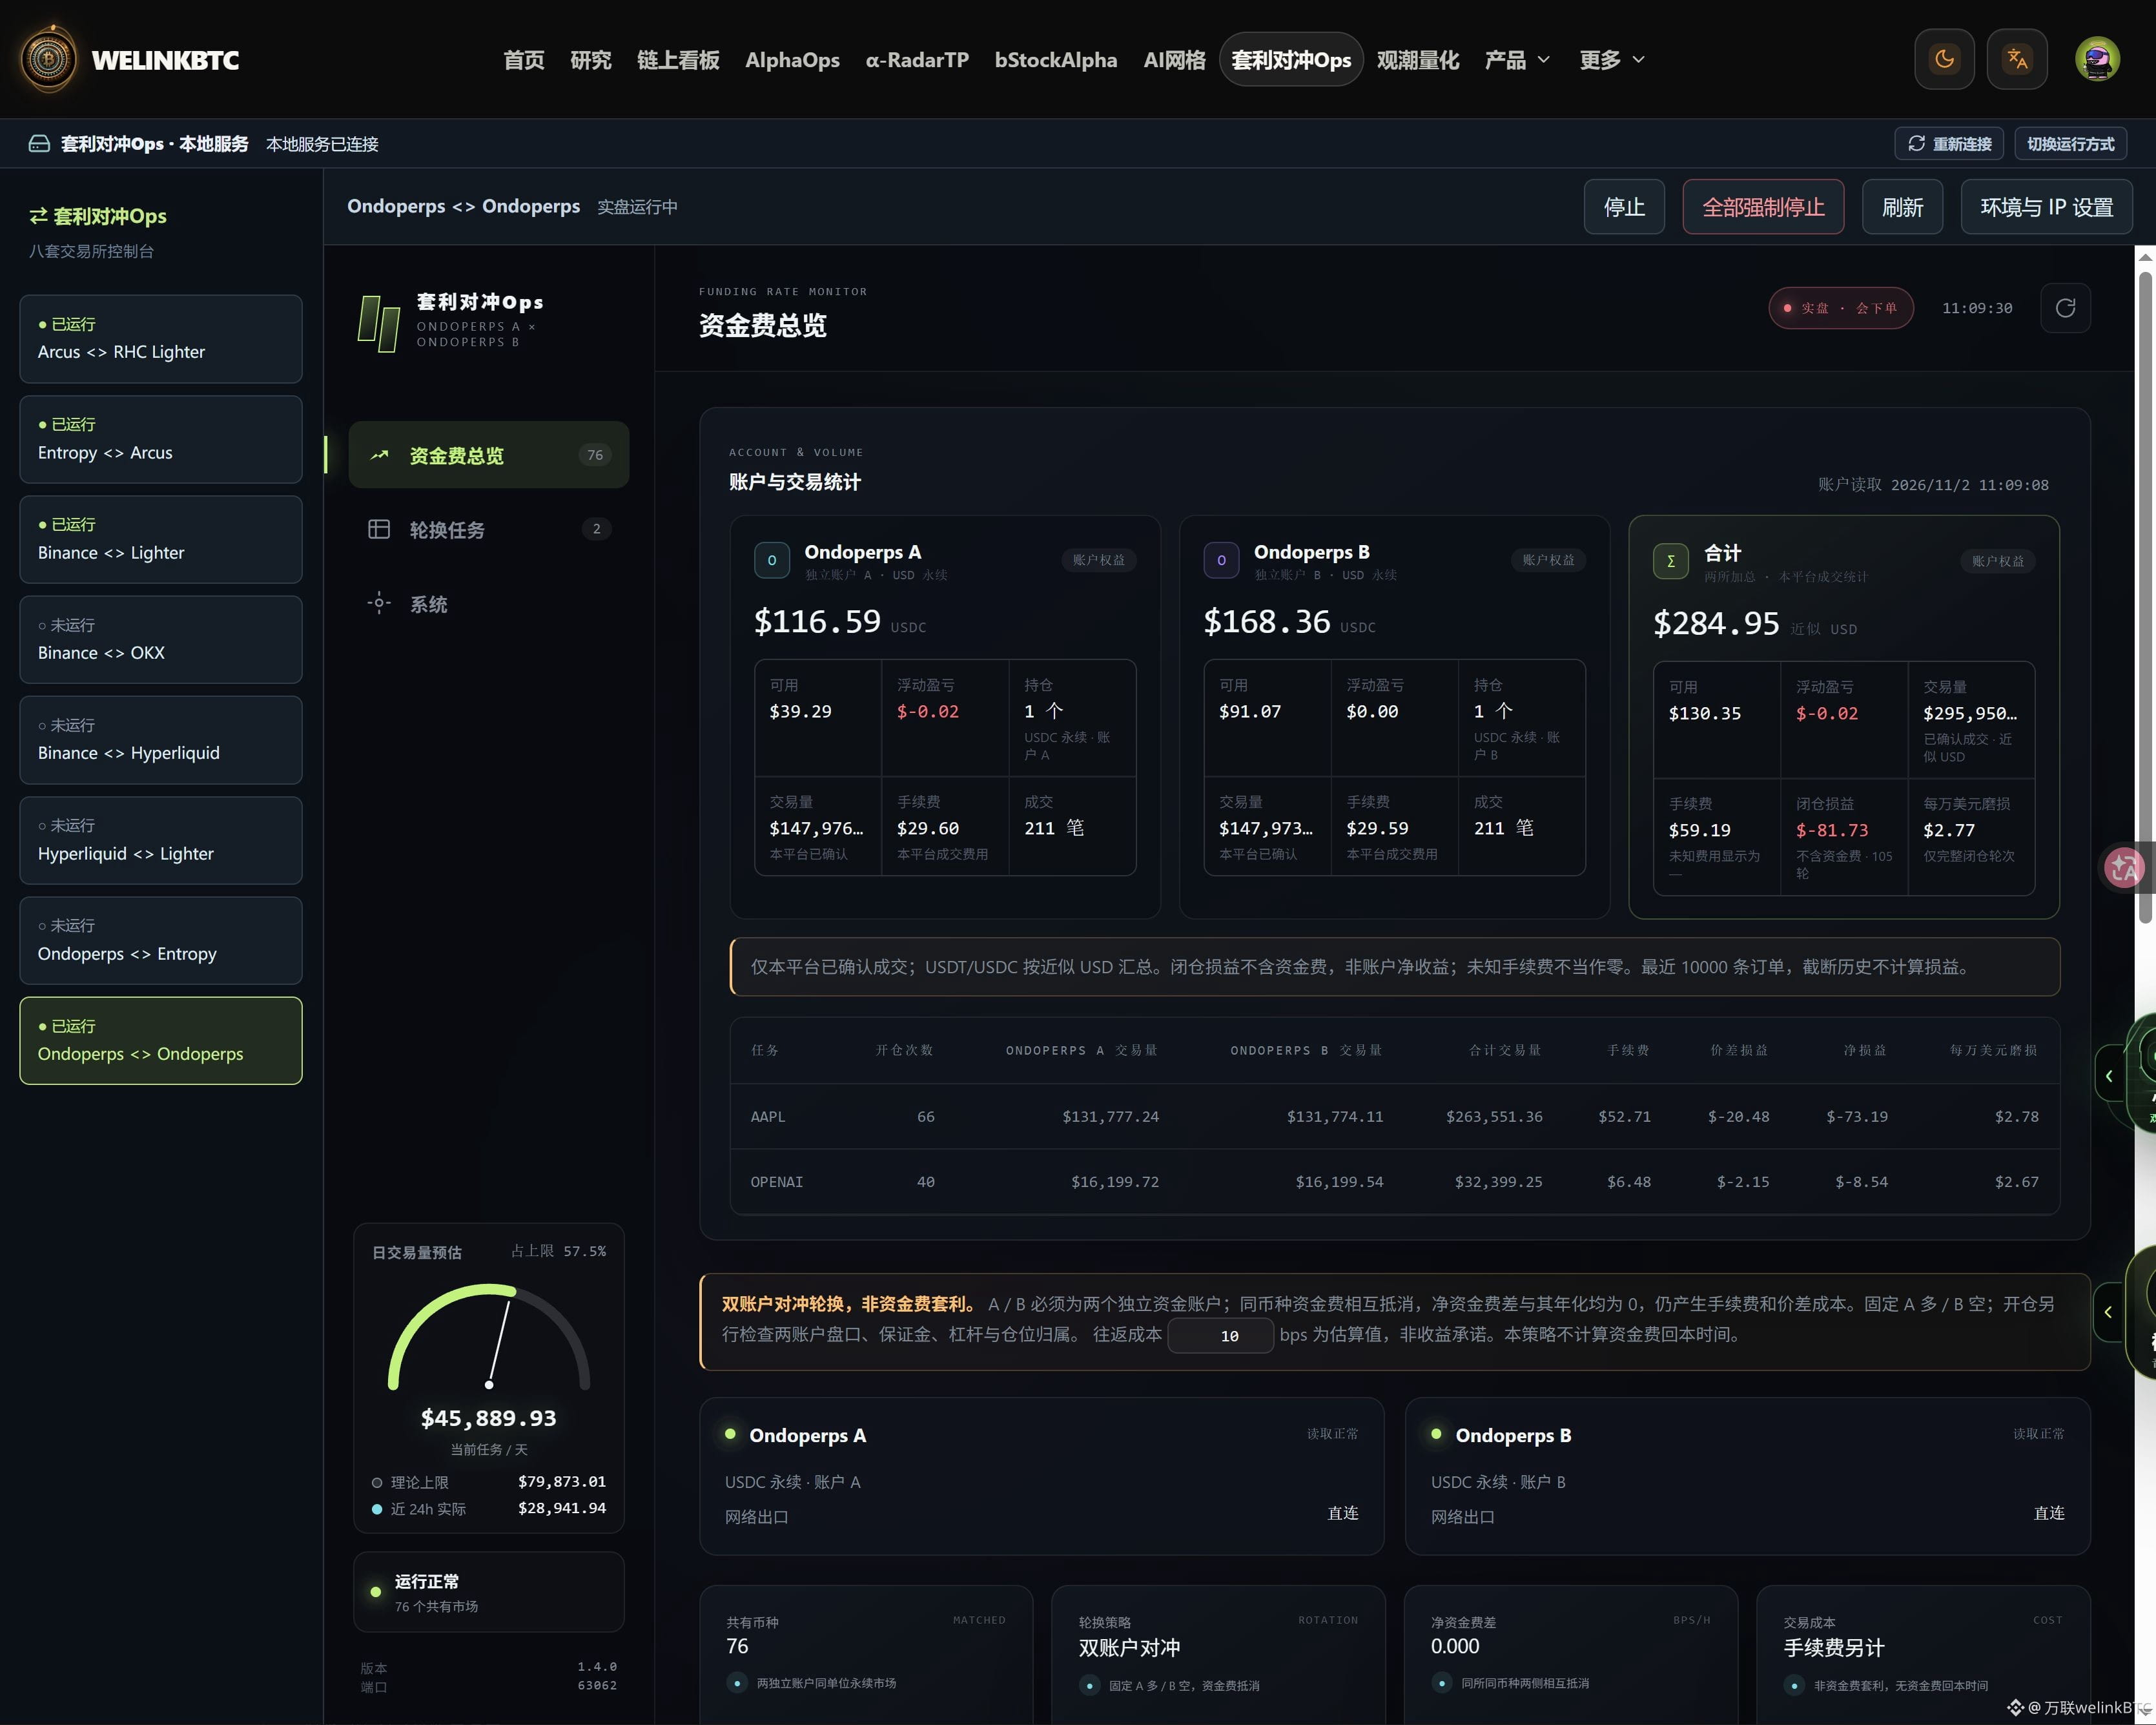
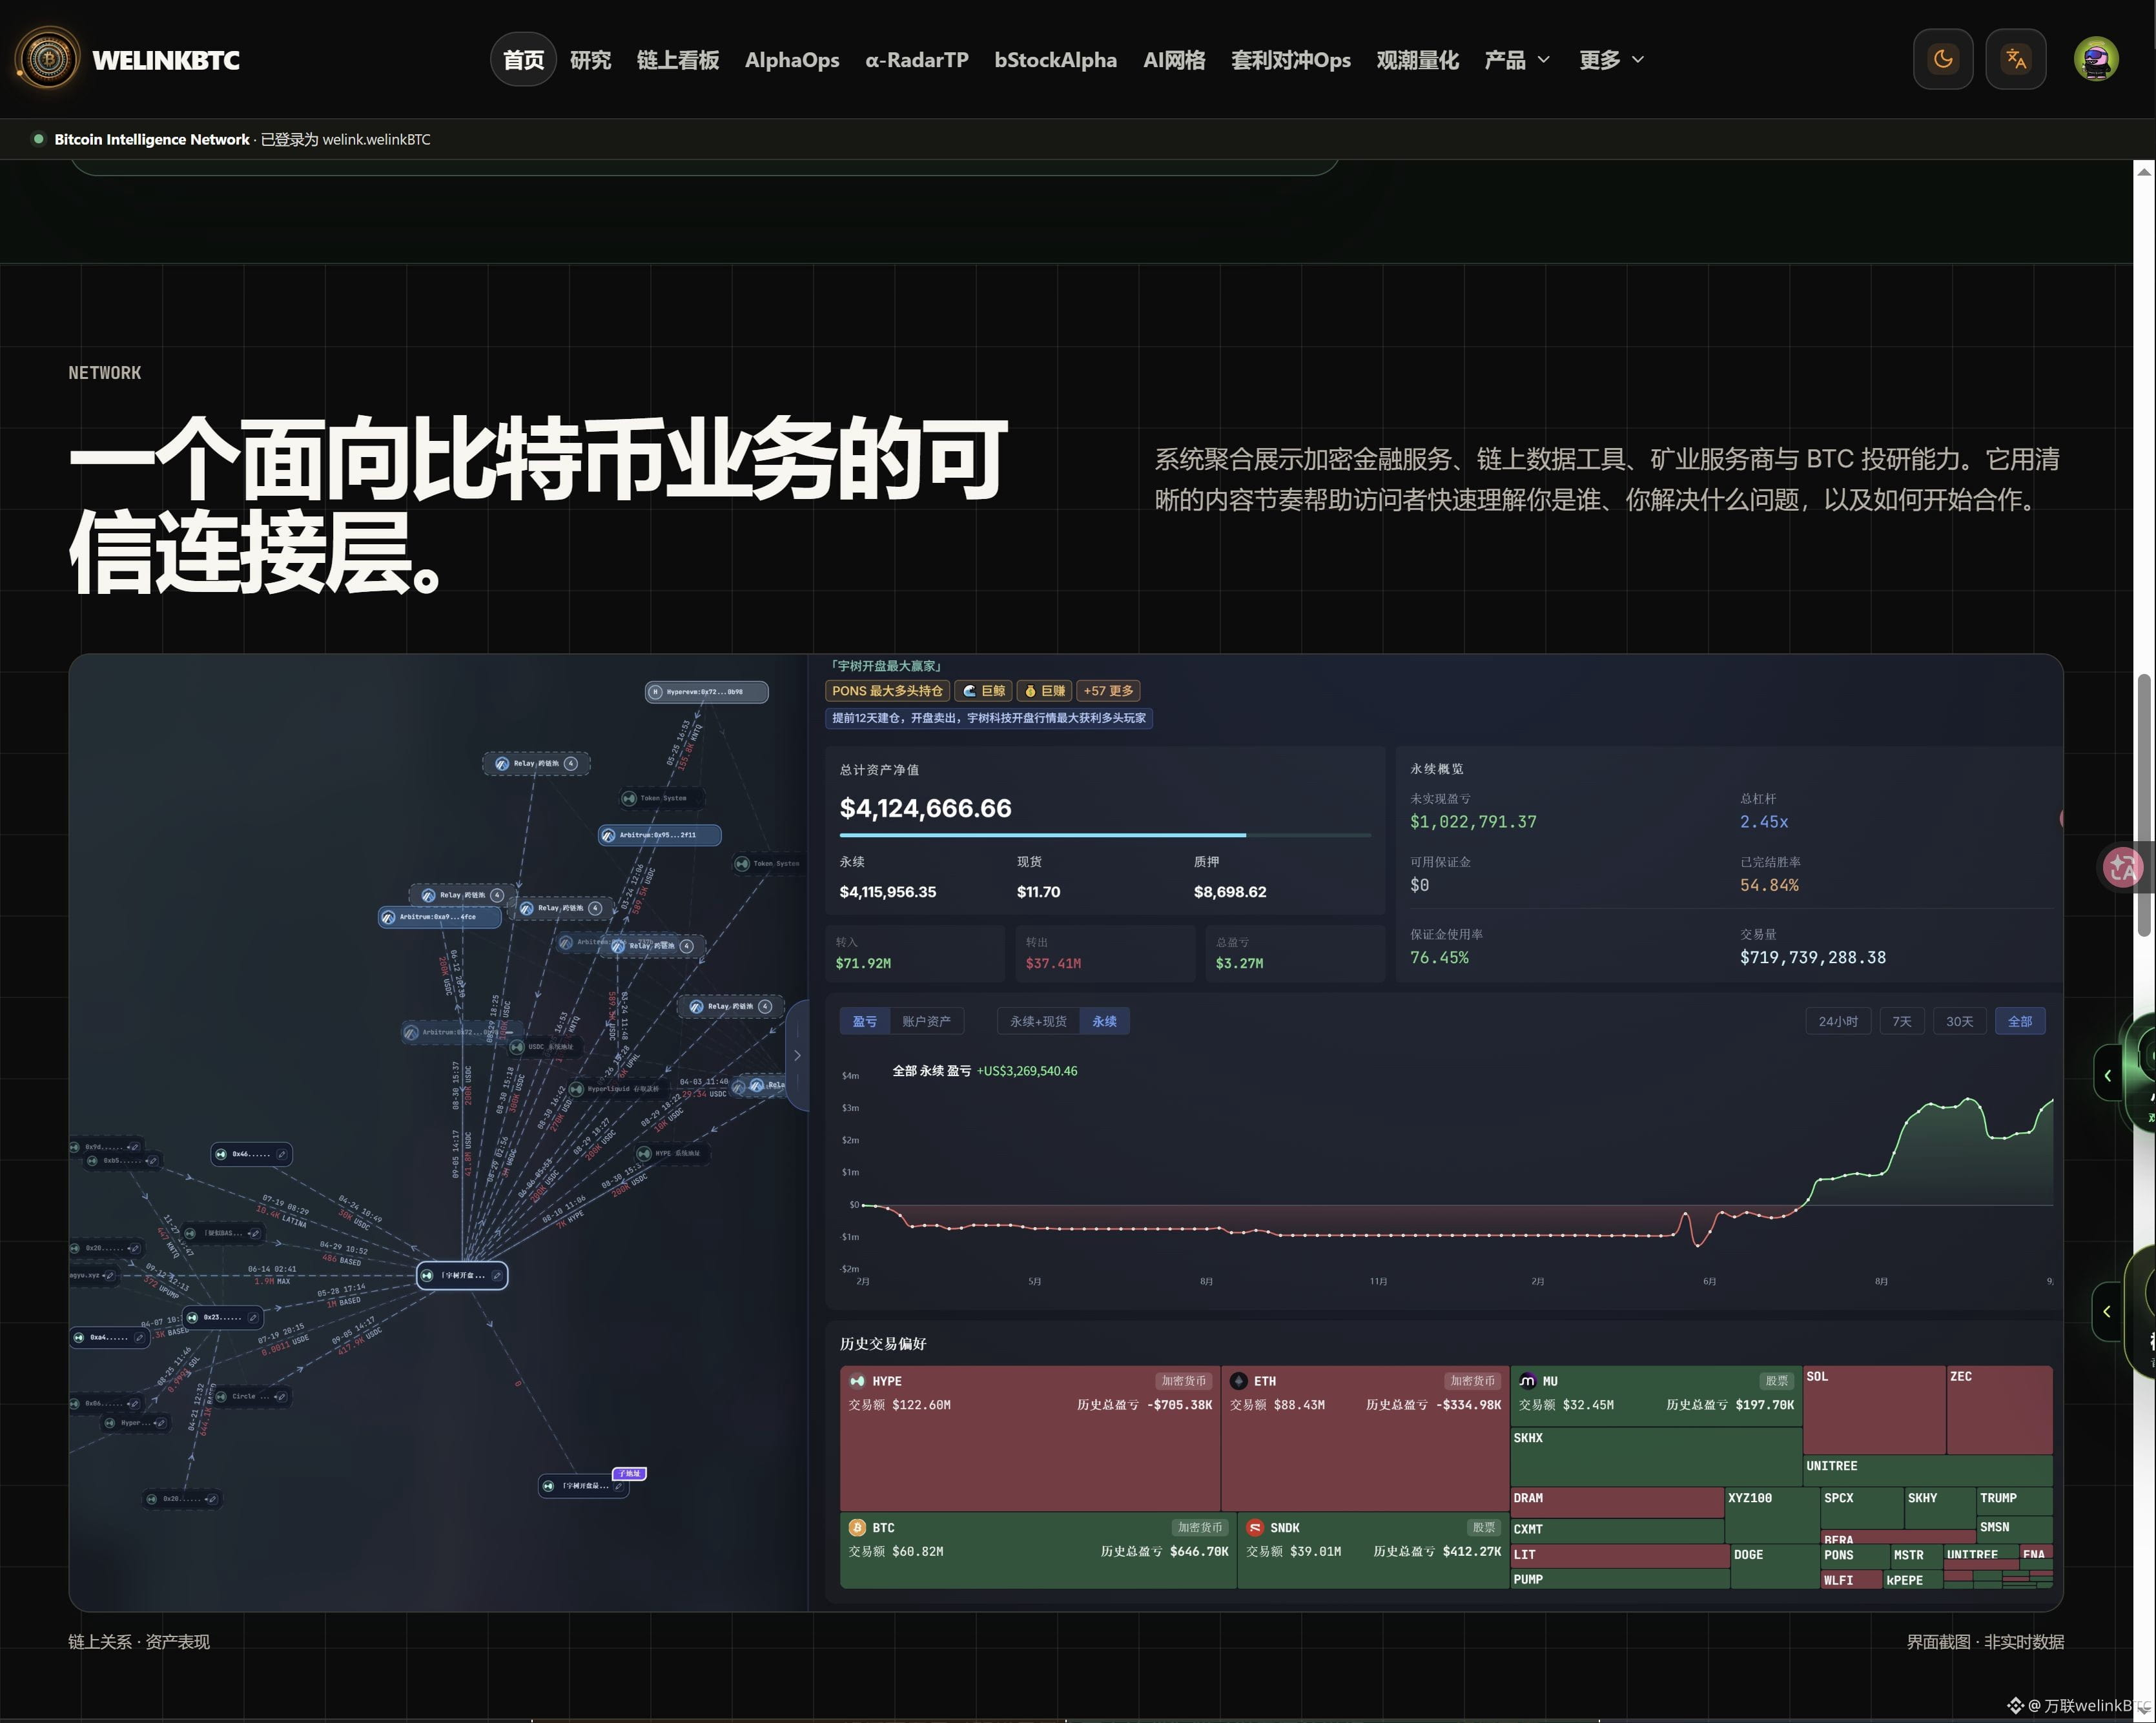
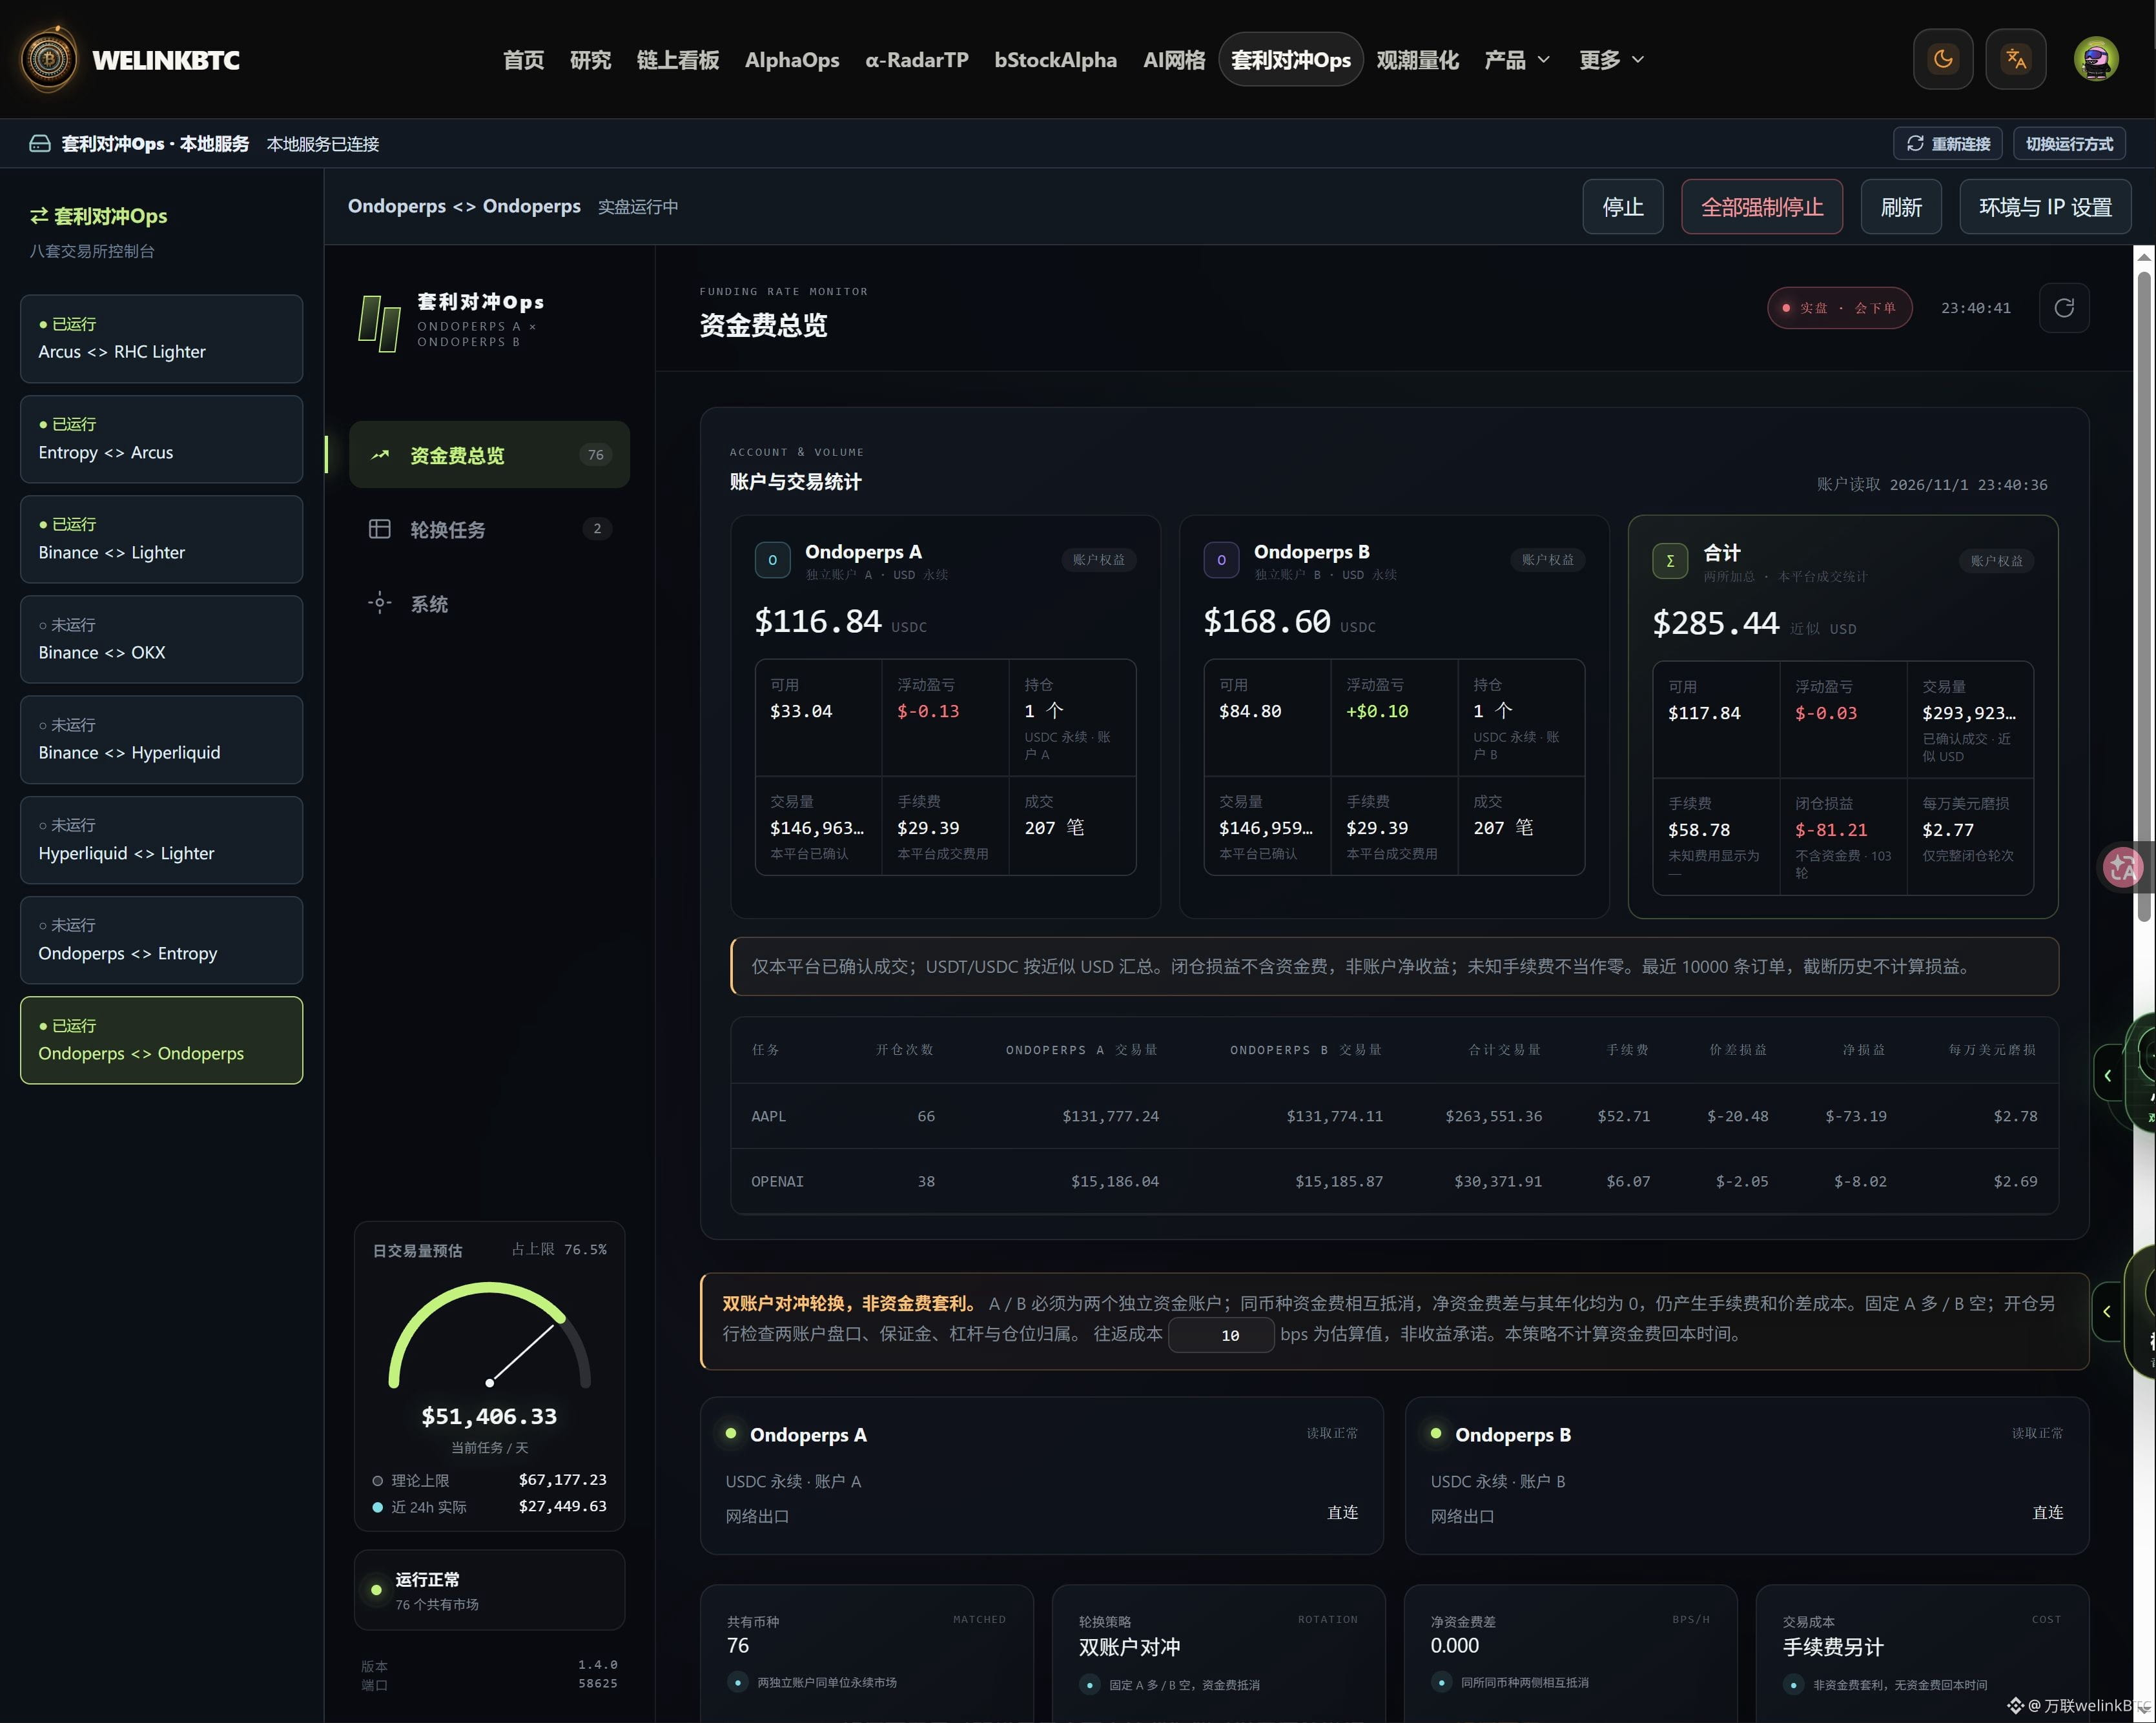
Today I updated the arbitrage and hedging bots for Ondoperps and Entropy.
I’ve also got multiple setups running now.
The only perps I’m focusing on for airdrops now are Ondoperps and Entropy.
Ondo offers weekly rewards: 220,000 USDC + a 5 million-point pool, plus cash prizes.
Entropy has surpassed $100 million in OI, becoming the second-largest HIP-3 builder DEX.
Ondo rewards link:
https://app.ondoperps.xyz/?ref=6G11VG
Entropy portal:
https://pro.entropy.io/?r=welinkbtc
Arbitrage and hedging bot:
https://welinkbtc-onchainmain.xyz/hedge-ops
#币安恢复28种法币提现
$BNB
{future}(BNBUSDT)
Today I updated the arbitrage and hedging bots for Ondoperps and Entropy.
I’ve also got multiple setups running now.
The only perps I’m focusing on for airdrops now are Ondoperps and Entropy.
Ondo offers weekly rewards: 220,000 USDC + a 5 million-point pool, plus cash prizes.
Entropy has surpassed $100 million in OI, becoming the second-largest HIP-3 builder DEX.
Ondo rewards link:
https://app.ondoperps.xyz/?ref=6G11VG
Entropy portal:
https://pro.entropy.io/?r=welinkbtc
Arbitrage and hedging bot:
https://welinkbtc-onchainmain.xyz/hedge-ops
#币安恢复28种法币提现
$BNB
I’ve also got multiple setups running now.
The only perps I’m focusing on for airdrops now are Ondoperps and Entropy.
Ondo offers weekly rewards: 220,000 USDC + a 5 million-point pool, plus cash prizes.
Entropy has surpassed $100 million in OI, becoming the second-largest HIP-3 builder DEX.
Ondo rewards link:
https://app.ondoperps.xyz/?ref=6G11VG
Entropy portal:
https://pro.entropy.io/?r=welinkbtc
Arbitrage and hedging bot:
https://welinkbtc-onchainmain.xyz/hedge-ops
#币安恢复28种法币提现
$BNB
万联welinkBTC
·
--
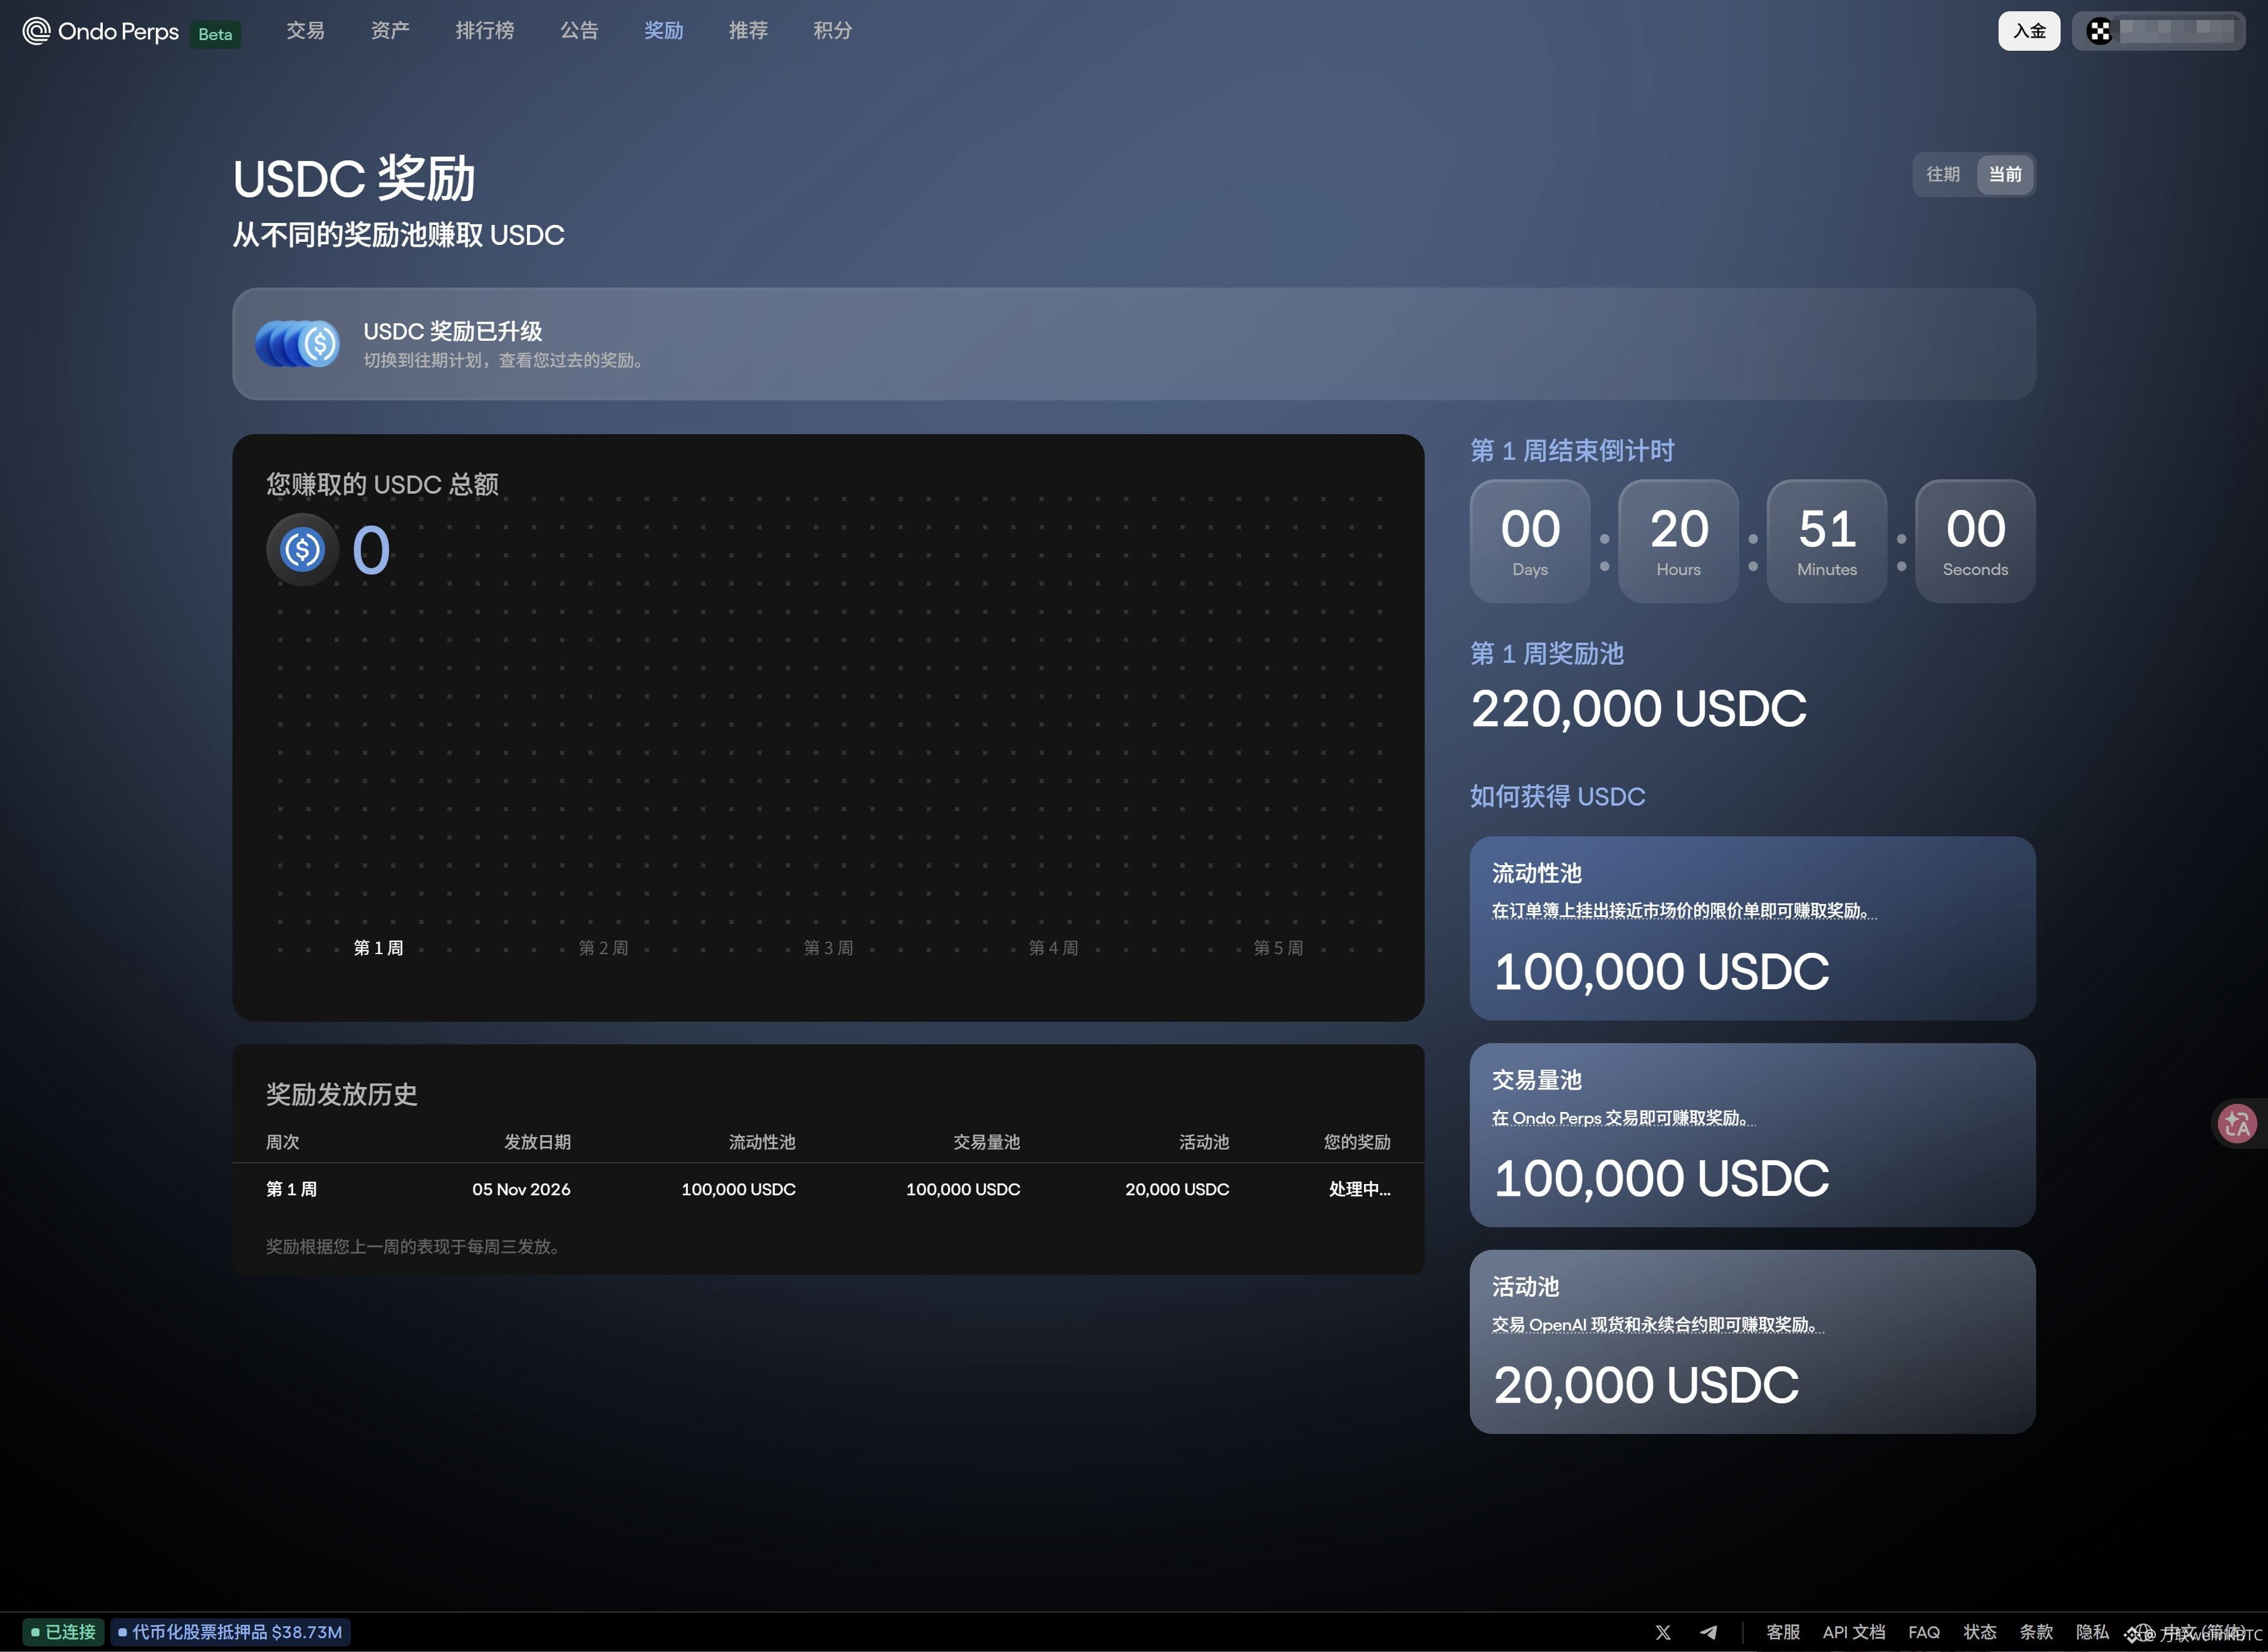
OndoPerps Cash Rewards: Week One
One day left before it ends
The new version’s first-week cash prize pool is 220,000 USDC, plus rewards from a 5-million-point pool
I’ve been farming for a week—let’s see how much I can earn
Rewards page:
https://app.ondoperps.xyz/?ref=6G11VG
Guys,
keep going, keep going
The rewards are getting bigger
The first-week cash prize pool is 220,000 USDC, plus rewards from a 5-million-point pool
There are cash rewards right now, so get in early and start farming
Airdrop incoming
The well-known RWA project $ONDO Perps
has confirmed its U.S. stock perpetuals platform, Ondo Perps
is now officially open to all users.
That’s right—the leader in on-chain stocks has also entered the U.S. stock perpetuals market
It currently supports over a hundred popular stocks, including SPCX and MU,
and during trading, rewards will be airdropped to you in USDC
based on your trading volume and holding time
If you want to farm rewards on the Ondo platform, use Wanlian’s link
to save 20% on trading fees:
Link:
https://app.ondoperps.xyz/?ref=6G11VG
A bold prediction:
ONDO may airdrop tokens to OndoPerps users
Potential airdrop date: January 2027
Arbitrage and hedging program:
https://welinkbtc-onchainmain.xyz/hedge-ops
#币安已处理46.5亿美元提款
$BNB
One day left before it ends
The new version’s first-week cash prize pool is 220,000 USDC, plus rewards from a 5-million-point pool
I’ve been farming for a week—let’s see how much I can earn
Rewards page:
https://app.ondoperps.xyz/?ref=6G11VG
Guys,
keep going, keep going
The rewards are getting bigger
The first-week cash prize pool is 220,000 USDC, plus rewards from a 5-million-point pool
There are cash rewards right now, so get in early and start farming
Airdrop incoming
The well-known RWA project $ONDO Perps
has confirmed its U.S. stock perpetuals platform, Ondo Perps
is now officially open to all users.
That’s right—the leader in on-chain stocks has also entered the U.S. stock perpetuals market
It currently supports over a hundred popular stocks, including SPCX and MU,
and during trading, rewards will be airdropped to you in USDC
based on your trading volume and holding time
If you want to farm rewards on the Ondo platform, use Wanlian’s link
to save 20% on trading fees:
Link:
https://app.ondoperps.xyz/?ref=6G11VG
A bold prediction:
ONDO may airdrop tokens to OndoPerps users
Potential airdrop date: January 2027
Arbitrage and hedging program:
https://welinkbtc-onchainmain.xyz/hedge-ops
#币安已处理46.5亿美元提款
$BNB
2
1.1k
·
--
There’s a group of people in Shenzhen playing a really dirty game: they’ve turned business into a performance.
Just this June, at a major trade fair in Shenzhen,
small and medium-sized businesses from all over the country paid tens of thousands of yuan for booth space and traveled thousands of miles to attend,
hoping to land a few more export orders. The event was packed, with foreign visitors streaming in.
But ask them about product specifications, wholesale prices, or the details of a partnership, and they knew nothing at all.
That’s because those foreign buyers were actors from beginning to end—mostly international students studying in China.
They carried Chinese-language business cards, spoke broken Chinese, went from booth to booth taking photos, picked up brochures, and then walked away.
The truth only came out after one business owner followed them all the way to the subway station.
The organizer’s staff checked off the actors’ names one by one. At 3 p.m., they were paid in cash on-site: 300 yuan for a day. Once the performance was over, they went home.
The business owners were furious and surrounded the organizers, demanding an explanation.
They had just one question: “We spent our hard-earned money to do business, and you put on a show for us.”
This isn’t an isolated case.
Trade fairs across the country are pulling the same stunt. Organizers only care about selling booth space; they don’t care whether businesses make any sales.
They’ve brought the Thirty-Six Stratagems into commercial trade fairs: inventing things out of thin air, faking foot traffic, concealing the truth, and collecting fees.
The whole performance was flawless. Even more ironic were the actors on stage.
International students who benefit from taxpayer subsidies and enjoy access to the best resources ended up helping the organizers cheat honest domestic entrepreneurs.
A blogger once traveled to more than a hundred countries, randomly interviewing foreigners about their impression of us. The answers were remarkably consistent: just two words—“shrewd and slick.”
That impression was earned through repeated acts of deception.
Every time we put on a charade, the outside world trusts us a little less, and the road to doing business overseas gets a little narrower.
When playing tricks is treated as a skill, and breaking agreements is seen as a means of survival, we still have a long way to go before we reach a truly civilized business environment.
But one thing is true: every show eventually comes to an end.
The people who deliver honest, genuine goods don’t rely on scripts or acting. They may not be the brightest stars on stage.
But when the stage collapses, they’re still standing. Integrity never goes out of date.
#比特币连续7周收于50周均线上方
#币安已处理46.5亿美元提款
$BNB
{future}(BNBUSDT)
There’s a group of people in Shenzhen playing a really dirty game: they’ve turned business into a performance.
Just this June, at a major trade fair in Shenzhen,
small and medium-sized businesses from all over the country paid tens of thousands of yuan for booth space and traveled thousands of miles to attend,
hoping to land a few more export orders. The event was packed, with foreign visitors streaming in.
But ask them about product specifications, wholesale prices, or the details of a partnership, and they knew nothing at all.
That’s because those foreign buyers were actors from beginning to end—mostly international students studying in China.
They carried Chinese-language business cards, spoke broken Chinese, went from booth to booth taking photos, picked up brochures, and then walked away.
The truth only came out after one business owner followed them all the way to the subway station.
The organizer’s staff checked off the actors’ names one by one. At 3 p.m., they were paid in cash on-site: 300 yuan for a day. Once the performance was over, they went home.
The business owners were furious and surrounded the organizers, demanding an explanation.
They had just one question: “We spent our hard-earned money to do business, and you put on a show for us.”
This isn’t an isolated case.
Trade fairs across the country are pulling the same stunt. Organizers only care about selling booth space; they don’t care whether businesses make any sales.
They’ve brought the Thirty-Six Stratagems into commercial trade fairs: inventing things out of thin air, faking foot traffic, concealing the truth, and collecting fees.
The whole performance was flawless. Even more ironic were the actors on stage.
International students who benefit from taxpayer subsidies and enjoy access to the best resources ended up helping the organizers cheat honest domestic entrepreneurs.
A blogger once traveled to more than a hundred countries, randomly interviewing foreigners about their impression of us. The answers were remarkably consistent: just two words—“shrewd and slick.”
That impression was earned through repeated acts of deception.
Every time we put on a charade, the outside world trusts us a little less, and the road to doing business overseas gets a little narrower.
When playing tricks is treated as a skill, and breaking agreements is seen as a means of survival, we still have a long way to go before we reach a truly civilized business environment.
But one thing is true: every show eventually comes to an end.
The people who deliver honest, genuine goods don’t rely on scripts or acting. They may not be the brightest stars on stage.
But when the stage collapses, they’re still standing. Integrity never goes out of date.
#比特币连续7周收于50周均线上方
#币安已处理46.5亿美元提款
$BNB
Just this June, at a major trade fair in Shenzhen,
small and medium-sized businesses from all over the country paid tens of thousands of yuan for booth space and traveled thousands of miles to attend,
hoping to land a few more export orders. The event was packed, with foreign visitors streaming in.
But ask them about product specifications, wholesale prices, or the details of a partnership, and they knew nothing at all.
That’s because those foreign buyers were actors from beginning to end—mostly international students studying in China.
They carried Chinese-language business cards, spoke broken Chinese, went from booth to booth taking photos, picked up brochures, and then walked away.
The truth only came out after one business owner followed them all the way to the subway station.
The organizer’s staff checked off the actors’ names one by one. At 3 p.m., they were paid in cash on-site: 300 yuan for a day. Once the performance was over, they went home.
The business owners were furious and surrounded the organizers, demanding an explanation.
They had just one question: “We spent our hard-earned money to do business, and you put on a show for us.”
This isn’t an isolated case.
Trade fairs across the country are pulling the same stunt. Organizers only care about selling booth space; they don’t care whether businesses make any sales.
They’ve brought the Thirty-Six Stratagems into commercial trade fairs: inventing things out of thin air, faking foot traffic, concealing the truth, and collecting fees.
The whole performance was flawless. Even more ironic were the actors on stage.
International students who benefit from taxpayer subsidies and enjoy access to the best resources ended up helping the organizers cheat honest domestic entrepreneurs.
A blogger once traveled to more than a hundred countries, randomly interviewing foreigners about their impression of us. The answers were remarkably consistent: just two words—“shrewd and slick.”
That impression was earned through repeated acts of deception.
Every time we put on a charade, the outside world trusts us a little less, and the road to doing business overseas gets a little narrower.
When playing tricks is treated as a skill, and breaking agreements is seen as a means of survival, we still have a long way to go before we reach a truly civilized business environment.
But one thing is true: every show eventually comes to an end.
The people who deliver honest, genuine goods don’t rely on scripts or acting. They may not be the brightest stars on stage.
But when the stage collapses, they’re still standing. Integrity never goes out of date.
#比特币连续7周收于50周均线上方
#币安已处理46.5亿美元提款
$BNB
1
3
740
·
--
OndoPerps Cash Rewards: Week One
One day left before it ends
The new version’s first-week cash prize pool is 220,000 USDC, plus rewards from a 5-million-point pool
I’ve been farming for a week—let’s see how much I can earn
Rewards page:
https://app.ondoperps.xyz/?ref=6G11VG
Guys,
keep going, keep going
The rewards are getting bigger
The first-week cash prize pool is 220,000 USDC, plus rewards from a 5-million-point pool
There are cash rewards right now, so get in early and start farming
Airdrop incoming
The well-known RWA project $ONDO Perps
has confirmed its U.S. stock perpetuals platform, Ondo Perps
is now officially open to all users.
That’s right—the leader in on-chain stocks has also entered the U.S. stock perpetuals market
It currently supports over a hundred popular stocks, including SPCX and MU,
and during trading, rewards will be airdropped to you in USDC
based on your trading volume and holding time
If you want to farm rewards on the Ondo platform, use Wanlian’s link
to save 20% on trading fees:
Link:
https://app.ondoperps.xyz/?ref=6G11VG
A bold prediction:
ONDO may airdrop tokens to OndoPerps users
Potential airdrop date: January 2027
Arbitrage and hedging program:
https://welinkbtc-onchainmain.xyz/hedge-ops
#币安已处理46.5亿美元提款
$BNB
{future}(BNBUSDT)
OndoPerps Cash Rewards: Week One
One day left before it ends
The new version’s first-week cash prize pool is 220,000 USDC, plus rewards from a 5-million-point pool
I’ve been farming for a week—let’s see how much I can earn
Rewards page:
https://app.ondoperps.xyz/?ref=6G11VG
Guys,
keep going, keep going
The rewards are getting bigger
The first-week cash prize pool is 220,000 USDC, plus rewards from a 5-million-point pool
There are cash rewards right now, so get in early and start farming
Airdrop incoming
The well-known RWA project $ONDO Perps
has confirmed its U.S. stock perpetuals platform, Ondo Perps
is now officially open to all users.
That’s right—the leader in on-chain stocks has also entered the U.S. stock perpetuals market
It currently supports over a hundred popular stocks, including SPCX and MU,
and during trading, rewards will be airdropped to you in USDC
based on your trading volume and holding time
If you want to farm rewards on the Ondo platform, use Wanlian’s link
to save 20% on trading fees:
Link:
https://app.ondoperps.xyz/?ref=6G11VG
A bold prediction:
ONDO may airdrop tokens to OndoPerps users
Potential airdrop date: January 2027
Arbitrage and hedging program:
https://welinkbtc-onchainmain.xyz/hedge-ops
#币安已处理46.5亿美元提款
$BNB
One day left before it ends
The new version’s first-week cash prize pool is 220,000 USDC, plus rewards from a 5-million-point pool
I’ve been farming for a week—let’s see how much I can earn
Rewards page:
https://app.ondoperps.xyz/?ref=6G11VG
Guys,
keep going, keep going
The rewards are getting bigger
The first-week cash prize pool is 220,000 USDC, plus rewards from a 5-million-point pool
There are cash rewards right now, so get in early and start farming
Airdrop incoming
The well-known RWA project $ONDO Perps
has confirmed its U.S. stock perpetuals platform, Ondo Perps
is now officially open to all users.
That’s right—the leader in on-chain stocks has also entered the U.S. stock perpetuals market
It currently supports over a hundred popular stocks, including SPCX and MU,
and during trading, rewards will be airdropped to you in USDC
based on your trading volume and holding time
If you want to farm rewards on the Ondo platform, use Wanlian’s link
to save 20% on trading fees:
Link:
https://app.ondoperps.xyz/?ref=6G11VG
A bold prediction:
ONDO may airdrop tokens to OndoPerps users
Potential airdrop date: January 2027
Arbitrage and hedging program:
https://welinkbtc-onchainmain.xyz/hedge-ops
#币安已处理46.5亿美元提款
$BNB
1
4
3k
·
--
# On-Chain Indicator Analysis
BTC: LTH Spent Price Below Waterline
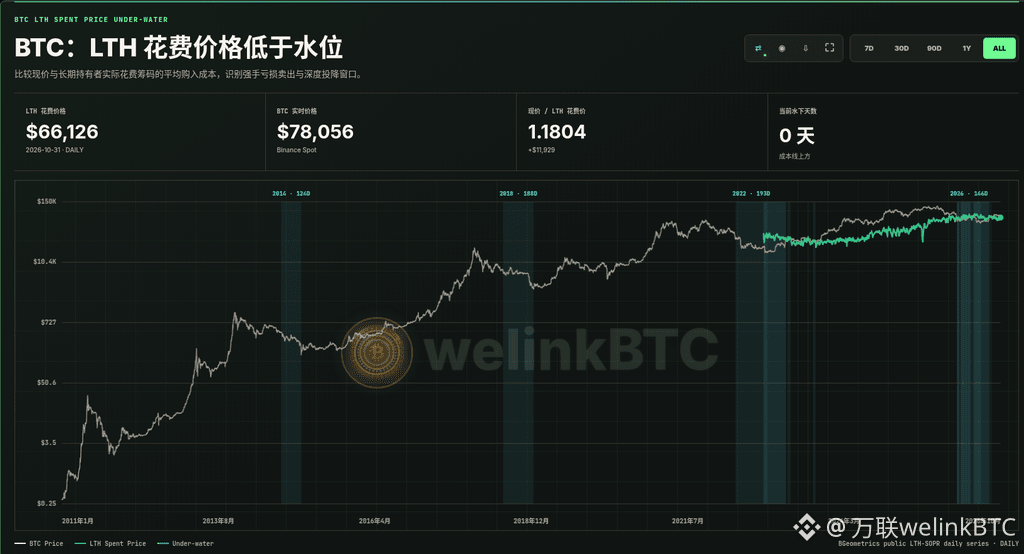
The LTH Spent Price is the weighted average acquisition cost of coins spent on a given day after being held for at least 155 days (which can be derived as spot price ÷ LTH-SOPR). It compares the cost basis of “older coins currently being sold,” rather than the static average cost of all long-term holdings, and is used to identify loss-making sales by strong hands and periods of deep capitulation.
Current Status · Above the Cost Line
BTC is currently around $78,056 (Binance Spot), while the LTH Spent Price is $66,126 (2026-10-31). The spot price is about $11,929 above the spent cost, with a ratio of 1.1804. The current number of days underwater is 0, and the price is above the spent cost line. The 7-day change in the spent price is about +$4,655, and LTH-SOPR is 1.1705; the exact public series is shown from 2022-11-01 onward.
Historical reference: When the spot price falls below the LTH Spent Price and stays there for over 100 days, this has historically often coincided with deep capitulation among long-term holders and the final phase of a bear market. In 2014, 2018, and 2022, the periods from the breakdown to the cycle bottom were approximately 124, 188, and 193 days, respectively. The reference window for this cycle is about 146 days (approximately through 2026-06-30, at $57,800). Range definitions: ≥1.08× above cost; 1.00–1.08× recovery test; 0.90–1.00× underwater capitulation; <0.90× deeply underwater. Moving back above the green line can be one signal of a recovery, but should still be confirmed by demand and liquidity. These time periods are for cycle comparison and do not constitute investment advice.
【BTC Short-Term Snapshot】
Binance BTCUSDT is currently around 78,056 USDT, up about 0.80% over 24 hours, with an intraday range of approximately 77,392–78,285.
Macro: The Federal Reserve held rates steady at 3.75%–4% in its 10/28 decision (10–2 vote, with two members favoring a rate hike). In the short term, pricing remains subject to volatility around the “pause, but hawkish” stance.
Flows: U.S. spot BTC ETFs saw net outflows of about $643 million on 10/30 (Farside); 10/31–11/1 fell on a weekend, with no U.S. stock-market ETF trading days.
Short-term view: The price is holding above around 77,000 and rebounding moderately. Watch the area near the intraday high and the 78,000 level above, and the opening zone around 77,400 below. For discussion only; this is not investment advice.
More Selected On-Chain Cycle Indicators
Portal
https://welinkbtc-onchainmain.xyz/
Understand market cycles like a professional analyst
$BTC
# On-Chain Indicator Analysis
BTC: LTH Spent Price Below Waterline
The LTH Spent Price is the weighted average acquisition cost of coins spent on a given day after being held for at least 155 days (which can be derived as spot price ÷ LTH-SOPR). It compares the cost basis of “older coins currently being sold,” rather than the static average cost of all long-term holdings, and is used to identify loss-making sales by strong hands and periods of deep capitulation.
Current Status · Above the Cost Line
BTC is currently around $78,056 (Binance Spot), while the LTH Spent Price is $66,126 (2026-10-31). The spot price is about $11,929 above the spent cost, with a ratio of 1.1804. The current number of days underwater is 0, and the price is above the spent cost line. The 7-day change in the spent price is about +$4,655, and LTH-SOPR is 1.1705; the exact public series is shown from 2022-11-01 onward.
Historical reference: When the spot price falls below the LTH Spent Price and stays there for over 100 days, this has historically often coincided with deep capitulation among long-term holders and the final phase of a bear market. In 2014, 2018, and 2022, the periods from the breakdown to the cycle bottom were approximately 124, 188, and 193 days, respectively. The reference window for this cycle is about 146 days (approximately through 2026-06-30, at $57,800). Range definitions: ≥1.08× above cost; 1.00–1.08× recovery test; 0.90–1.00× underwater capitulation; <0.90× deeply underwater. Moving back above the green line can be one signal of a recovery, but should still be confirmed by demand and liquidity. These time periods are for cycle comparison and do not constitute investment advice.
【BTC Short-Term Snapshot】
Binance BTCUSDT is currently around 78,056 USDT, up about 0.80% over 24 hours, with an intraday range of approximately 77,392–78,285.
Macro: The Federal Reserve held rates steady at 3.75%–4% in its 10/28 decision (10–2 vote, with two members favoring a rate hike). In the short term, pricing remains subject to volatility around the “pause, but hawkish” stance.
Flows: U.S. spot BTC ETFs saw net outflows of about $643 million on 10/30 (Farside); 10/31–11/1 fell on a weekend, with no U.S. stock-market ETF trading days.
Short-term view: The price is holding above around 77,000 and rebounding moderately. Watch the area near the intraday high and the 78,000 level above, and the opening zone around 77,400 below. For discussion only; this is not investment advice.
More Selected On-Chain Cycle Indicators
Portal
https://welinkbtc-onchainmain.xyz/
Understand market cycles like a professional analyst
$BTC
BTC: LTH Spent Price Below Waterline
The LTH Spent Price is the weighted average acquisition cost of coins spent on a given day after being held for at least 155 days (which can be derived as spot price ÷ LTH-SOPR). It compares the cost basis of “older coins currently being sold,” rather than the static average cost of all long-term holdings, and is used to identify loss-making sales by strong hands and periods of deep capitulation.
Current Status · Above the Cost Line
BTC is currently around $78,056 (Binance Spot), while the LTH Spent Price is $66,126 (2026-10-31). The spot price is about $11,929 above the spent cost, with a ratio of 1.1804. The current number of days underwater is 0, and the price is above the spent cost line. The 7-day change in the spent price is about +$4,655, and LTH-SOPR is 1.1705; the exact public series is shown from 2022-11-01 onward.
Historical reference: When the spot price falls below the LTH Spent Price and stays there for over 100 days, this has historically often coincided with deep capitulation among long-term holders and the final phase of a bear market. In 2014, 2018, and 2022, the periods from the breakdown to the cycle bottom were approximately 124, 188, and 193 days, respectively. The reference window for this cycle is about 146 days (approximately through 2026-06-30, at $57,800). Range definitions: ≥1.08× above cost; 1.00–1.08× recovery test; 0.90–1.00× underwater capitulation; <0.90× deeply underwater. Moving back above the green line can be one signal of a recovery, but should still be confirmed by demand and liquidity. These time periods are for cycle comparison and do not constitute investment advice.
【BTC Short-Term Snapshot】
Binance BTCUSDT is currently around 78,056 USDT, up about 0.80% over 24 hours, with an intraday range of approximately 77,392–78,285.
Macro: The Federal Reserve held rates steady at 3.75%–4% in its 10/28 decision (10–2 vote, with two members favoring a rate hike). In the short term, pricing remains subject to volatility around the “pause, but hawkish” stance.
Flows: U.S. spot BTC ETFs saw net outflows of about $643 million on 10/30 (Farside); 10/31–11/1 fell on a weekend, with no U.S. stock-market ETF trading days.
Short-term view: The price is holding above around 77,000 and rebounding moderately. Watch the area near the intraday high and the 78,000 level above, and the opening zone around 77,400 below. For discussion only; this is not investment advice.
More Selected On-Chain Cycle Indicators
Portal
https://welinkbtc-onchainmain.xyz/
Understand market cycles like a professional analyst
$BTC
1.5k
·
--
AI has made “learning by doing” the smartest way to learn.
Before, whenever I wanted to learn something, I’d think—
“I’ll take a few courses first,” or “I’ll understand the principles before I get started.”
And then I’d put it off for months.
But with AI, the order of learning has completely flipped:
It’s no longer “learn first, then do”—it’s “learn as you go.”
Here’s what’s worked for me 👇
I use a few AI tools to support learning and hands-on practice:
1️⃣ Use ChatGPT for “quick lookups + research + getting answers”
- If I get stuck on a concept or a function, I just ask ChatGPT.
- If I want to build a product prototype or plan a project, I first use it to define a demo.
2️⃣ Use NotebookLM for “organizing materials + deep understanding”
- I drop reports, PDFs, and design documents in, and it helps me distill the key points and generate mind maps.
- It greatly shortens the path from “understanding” → “grasping the key points” → “producing something.”
3️⃣ Use Claude Code for “automated tasks + code generation”
- If a project involves code, developing with Claude Code, a powerful AI coding assistant, can significantly speed things up.
- I can also use it to handle some automated tasks and help with low-value, repetitive work.
4️⃣ Use Figma for “design + visualization”
- If I want to sketch out an idea or organize a structure, I can just enter a prompt in Figma to generate sketches or flowcharts.
5️⃣ Connect them all: do → look things up → reflect
- Do: Pick a small project, write some code, or create a design draft.
- Look things up: When you hit a roadblock, ask ChatGPT; organize materials with NotebookLM; use Claude Code for code; and Figma for design.
- Reflect: When you’re done, use AI to review, summarize, and identify your next steps.
Honestly, AI has made “learning” more accessible.
You may no longer need to study systematically something you’ll only use once in a while.
But if you have high standards or need professional expertise in a particular area,
you still need to put in the work to learn the fundamentals and principles.
For now, AI is just a tool to boost efficiency—or,
as you might say, a second brain.
#币安第一阶段15个网络已恢复提现
$BNB $BTC
{future}(BTCUSDT)
{future}(BNBUSDT)
AI has made “learning by doing” the smartest way to learn.
Before, whenever I wanted to learn something, I’d think—
“I’ll take a few courses first,” or “I’ll understand the principles before I get started.”
And then I’d put it off for months.
But with AI, the order of learning has completely flipped:
It’s no longer “learn first, then do”—it’s “learn as you go.”
Here’s what’s worked for me 👇
I use a few AI tools to support learning and hands-on practice:
1️⃣ Use ChatGPT for “quick lookups + research + getting answers”
- If I get stuck on a concept or a function, I just ask ChatGPT.
- If I want to build a product prototype or plan a project, I first use it to define a demo.
2️⃣ Use NotebookLM for “organizing materials + deep understanding”
- I drop reports, PDFs, and design documents in, and it helps me distill the key points and generate mind maps.
- It greatly shortens the path from “understanding” → “grasping the key points” → “producing something.”
3️⃣ Use Claude Code for “automated tasks + code generation”
- If a project involves code, developing with Claude Code, a powerful AI coding assistant, can significantly speed things up.
- I can also use it to handle some automated tasks and help with low-value, repetitive work.
4️⃣ Use Figma for “design + visualization”
- If I want to sketch out an idea or organize a structure, I can just enter a prompt in Figma to generate sketches or flowcharts.
5️⃣ Connect them all: do → look things up → reflect
- Do: Pick a small project, write some code, or create a design draft.
- Look things up: When you hit a roadblock, ask ChatGPT; organize materials with NotebookLM; use Claude Code for code; and Figma for design.
- Reflect: When you’re done, use AI to review, summarize, and identify your next steps.
Honestly, AI has made “learning” more accessible.
You may no longer need to study systematically something you’ll only use once in a while.
But if you have high standards or need professional expertise in a particular area,
you still need to put in the work to learn the fundamentals and principles.
For now, AI is just a tool to boost efficiency—or,
as you might say, a second brain.
#币安第一阶段15个网络已恢复提现
$BNB $BTC
Before, whenever I wanted to learn something, I’d think—
“I’ll take a few courses first,” or “I’ll understand the principles before I get started.”
And then I’d put it off for months.
But with AI, the order of learning has completely flipped:
It’s no longer “learn first, then do”—it’s “learn as you go.”
Here’s what’s worked for me 👇
I use a few AI tools to support learning and hands-on practice:
1️⃣ Use ChatGPT for “quick lookups + research + getting answers”
- If I get stuck on a concept or a function, I just ask ChatGPT.
- If I want to build a product prototype or plan a project, I first use it to define a demo.
2️⃣ Use NotebookLM for “organizing materials + deep understanding”
- I drop reports, PDFs, and design documents in, and it helps me distill the key points and generate mind maps.
- It greatly shortens the path from “understanding” → “grasping the key points” → “producing something.”
3️⃣ Use Claude Code for “automated tasks + code generation”
- If a project involves code, developing with Claude Code, a powerful AI coding assistant, can significantly speed things up.
- I can also use it to handle some automated tasks and help with low-value, repetitive work.
4️⃣ Use Figma for “design + visualization”
- If I want to sketch out an idea or organize a structure, I can just enter a prompt in Figma to generate sketches or flowcharts.
5️⃣ Connect them all: do → look things up → reflect
- Do: Pick a small project, write some code, or create a design draft.
- Look things up: When you hit a roadblock, ask ChatGPT; organize materials with NotebookLM; use Claude Code for code; and Figma for design.
- Reflect: When you’re done, use AI to review, summarize, and identify your next steps.
Honestly, AI has made “learning” more accessible.
You may no longer need to study systematically something you’ll only use once in a while.
But if you have high standards or need professional expertise in a particular area,
you still need to put in the work to learn the fundamentals and principles.
For now, AI is just a tool to boost efficiency—or,
as you might say, a second brain.
#币安第一阶段15个网络已恢复提现
$BNB $BTC
3
1.4k
·
--
#On-Chain Metrics Analysis
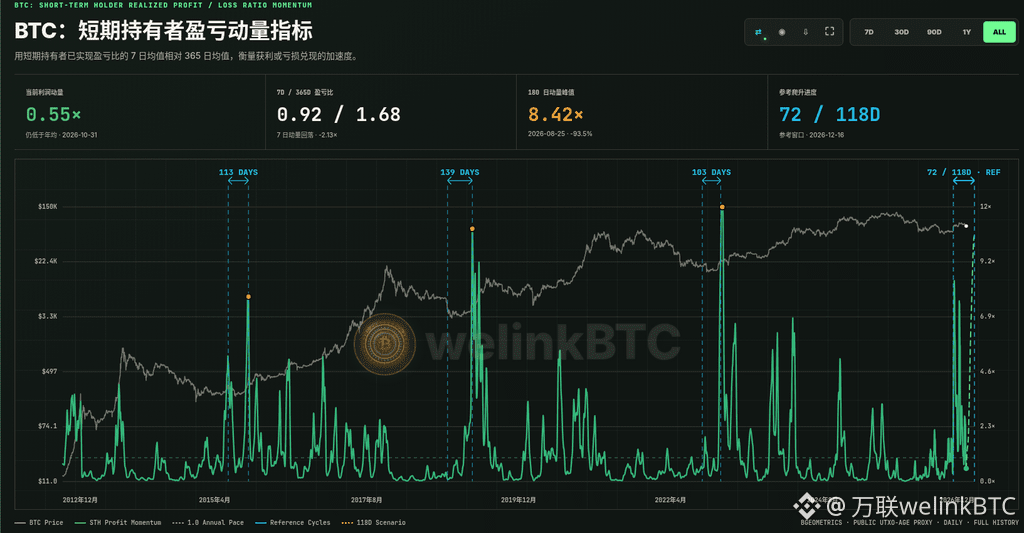
BTC: Short-Term Holder Profit/Loss Momentum Indicator
Measures the acceleration of profit or loss realization by comparing the 7-day average of the short-term holder realized profit/loss ratio with its 365-day average: a reading above 1 means recent profits are being realized faster than the yearly norm, while a rapid spike calls for checking whether spot demand can absorb the selling.
Current status · Still below the annual average · Reported momentum 0.55×
The public proxy’s 7-day profit/loss ratio is 0.92, versus a 365-day average of 1.68, putting current profit momentum at 0.55×, still below the annual average. It has changed by -93.5% from the 180-day peak of 8.42× (2026-08-25), while 7-day momentum has fallen by about -2.13×. The 2026 anchor on the reference chart starts on 2026-08-20; as of 2026-10-31, it is day 72, with about 46 days remaining in the 118-day historical-average window (the reference window points to around 2026-12-16). Public on-chain data is current through 2026-10-31; the public status and reference countdown are independent.
Historical reference: the reference ramp-up periods in the 2015, 2019, and 2022 cycles lasted 113, 139, and 103 days, respectively, averaging about 118 days; corresponding public proxy peaks were about 7.76×, 10.60×, and 12.61×. Bands: <0.5× near-zero accumulation, 0.5–1× weak recovery, 1–3× momentum expansion, ≥8× euphoric distribution. The dotted path is only for tracking the remaining time and validation conditions; it does not predict price. For cycle research only; not investment advice.
【BTC Short-Term Snapshot】
Binance BTCUSDT is trading at around 78,056 USDT, up about 0.80% over 24h, with an intraday range of around 77,392–78,285.
Macro: The Fed held rates unchanged at 3.75%–4% in its 10/28 decision (10–2 vote, with two members favoring a hike); short-term pricing remains sensitive to the “pause but hawkish” stance.
Flows: U.S. spot BTC ETFs saw net outflows of about $643 million on 10/30 (Farside); 10/31–11/1 fall on a weekend, with no U.S. equity ETF trading days.
Short-term view: Price is holding above around 77,000 and recovering modestly; watch the area near the intraday high and the 78,000 level above, and the opening range around 77,400 below. For discussion only; not investment advice.
More selected on-chain cycle indicators
Portal
https://welinkbtc-onchainmain.xyz/
Understand cycles like a professional analyst
$BTC
#On-Chain Metrics Analysis
BTC: Short-Term Holder Profit/Loss Momentum Indicator
Measures the acceleration of profit or loss realization by comparing the 7-day average of the short-term holder realized profit/loss ratio with its 365-day average: a reading above 1 means recent profits are being realized faster than the yearly norm, while a rapid spike calls for checking whether spot demand can absorb the selling.
Current status · Still below the annual average · Reported momentum 0.55×
The public proxy’s 7-day profit/loss ratio is 0.92, versus a 365-day average of 1.68, putting current profit momentum at 0.55×, still below the annual average. It has changed by -93.5% from the 180-day peak of 8.42× (2026-08-25), while 7-day momentum has fallen by about -2.13×. The 2026 anchor on the reference chart starts on 2026-08-20; as of 2026-10-31, it is day 72, with about 46 days remaining in the 118-day historical-average window (the reference window points to around 2026-12-16). Public on-chain data is current through 2026-10-31; the public status and reference countdown are independent.
Historical reference: the reference ramp-up periods in the 2015, 2019, and 2022 cycles lasted 113, 139, and 103 days, respectively, averaging about 118 days; corresponding public proxy peaks were about 7.76×, 10.60×, and 12.61×. Bands: <0.5× near-zero accumulation, 0.5–1× weak recovery, 1–3× momentum expansion, ≥8× euphoric distribution. The dotted path is only for tracking the remaining time and validation conditions; it does not predict price. For cycle research only; not investment advice.
【BTC Short-Term Snapshot】
Binance BTCUSDT is trading at around 78,056 USDT, up about 0.80% over 24h, with an intraday range of around 77,392–78,285.
Macro: The Fed held rates unchanged at 3.75%–4% in its 10/28 decision (10–2 vote, with two members favoring a hike); short-term pricing remains sensitive to the “pause but hawkish” stance.
Flows: U.S. spot BTC ETFs saw net outflows of about $643 million on 10/30 (Farside); 10/31–11/1 fall on a weekend, with no U.S. equity ETF trading days.
Short-term view: Price is holding above around 77,000 and recovering modestly; watch the area near the intraday high and the 78,000 level above, and the opening range around 77,400 below. For discussion only; not investment advice.
More selected on-chain cycle indicators
Portal
https://welinkbtc-onchainmain.xyz/
Understand cycles like a professional analyst
$BTC
BTC: Short-Term Holder Profit/Loss Momentum Indicator
Measures the acceleration of profit or loss realization by comparing the 7-day average of the short-term holder realized profit/loss ratio with its 365-day average: a reading above 1 means recent profits are being realized faster than the yearly norm, while a rapid spike calls for checking whether spot demand can absorb the selling.
Current status · Still below the annual average · Reported momentum 0.55×
The public proxy’s 7-day profit/loss ratio is 0.92, versus a 365-day average of 1.68, putting current profit momentum at 0.55×, still below the annual average. It has changed by -93.5% from the 180-day peak of 8.42× (2026-08-25), while 7-day momentum has fallen by about -2.13×. The 2026 anchor on the reference chart starts on 2026-08-20; as of 2026-10-31, it is day 72, with about 46 days remaining in the 118-day historical-average window (the reference window points to around 2026-12-16). Public on-chain data is current through 2026-10-31; the public status and reference countdown are independent.
Historical reference: the reference ramp-up periods in the 2015, 2019, and 2022 cycles lasted 113, 139, and 103 days, respectively, averaging about 118 days; corresponding public proxy peaks were about 7.76×, 10.60×, and 12.61×. Bands: <0.5× near-zero accumulation, 0.5–1× weak recovery, 1–3× momentum expansion, ≥8× euphoric distribution. The dotted path is only for tracking the remaining time and validation conditions; it does not predict price. For cycle research only; not investment advice.
【BTC Short-Term Snapshot】
Binance BTCUSDT is trading at around 78,056 USDT, up about 0.80% over 24h, with an intraday range of around 77,392–78,285.
Macro: The Fed held rates unchanged at 3.75%–4% in its 10/28 decision (10–2 vote, with two members favoring a hike); short-term pricing remains sensitive to the “pause but hawkish” stance.
Flows: U.S. spot BTC ETFs saw net outflows of about $643 million on 10/30 (Farside); 10/31–11/1 fall on a weekend, with no U.S. equity ETF trading days.
Short-term view: Price is holding above around 77,000 and recovering modestly; watch the area near the intraday high and the 78,000 level above, and the opening range around 77,400 below. For discussion only; not investment advice.
More selected on-chain cycle indicators
Portal
https://welinkbtc-onchainmain.xyz/
Understand cycles like a professional analyst
$BTC
913
·
--
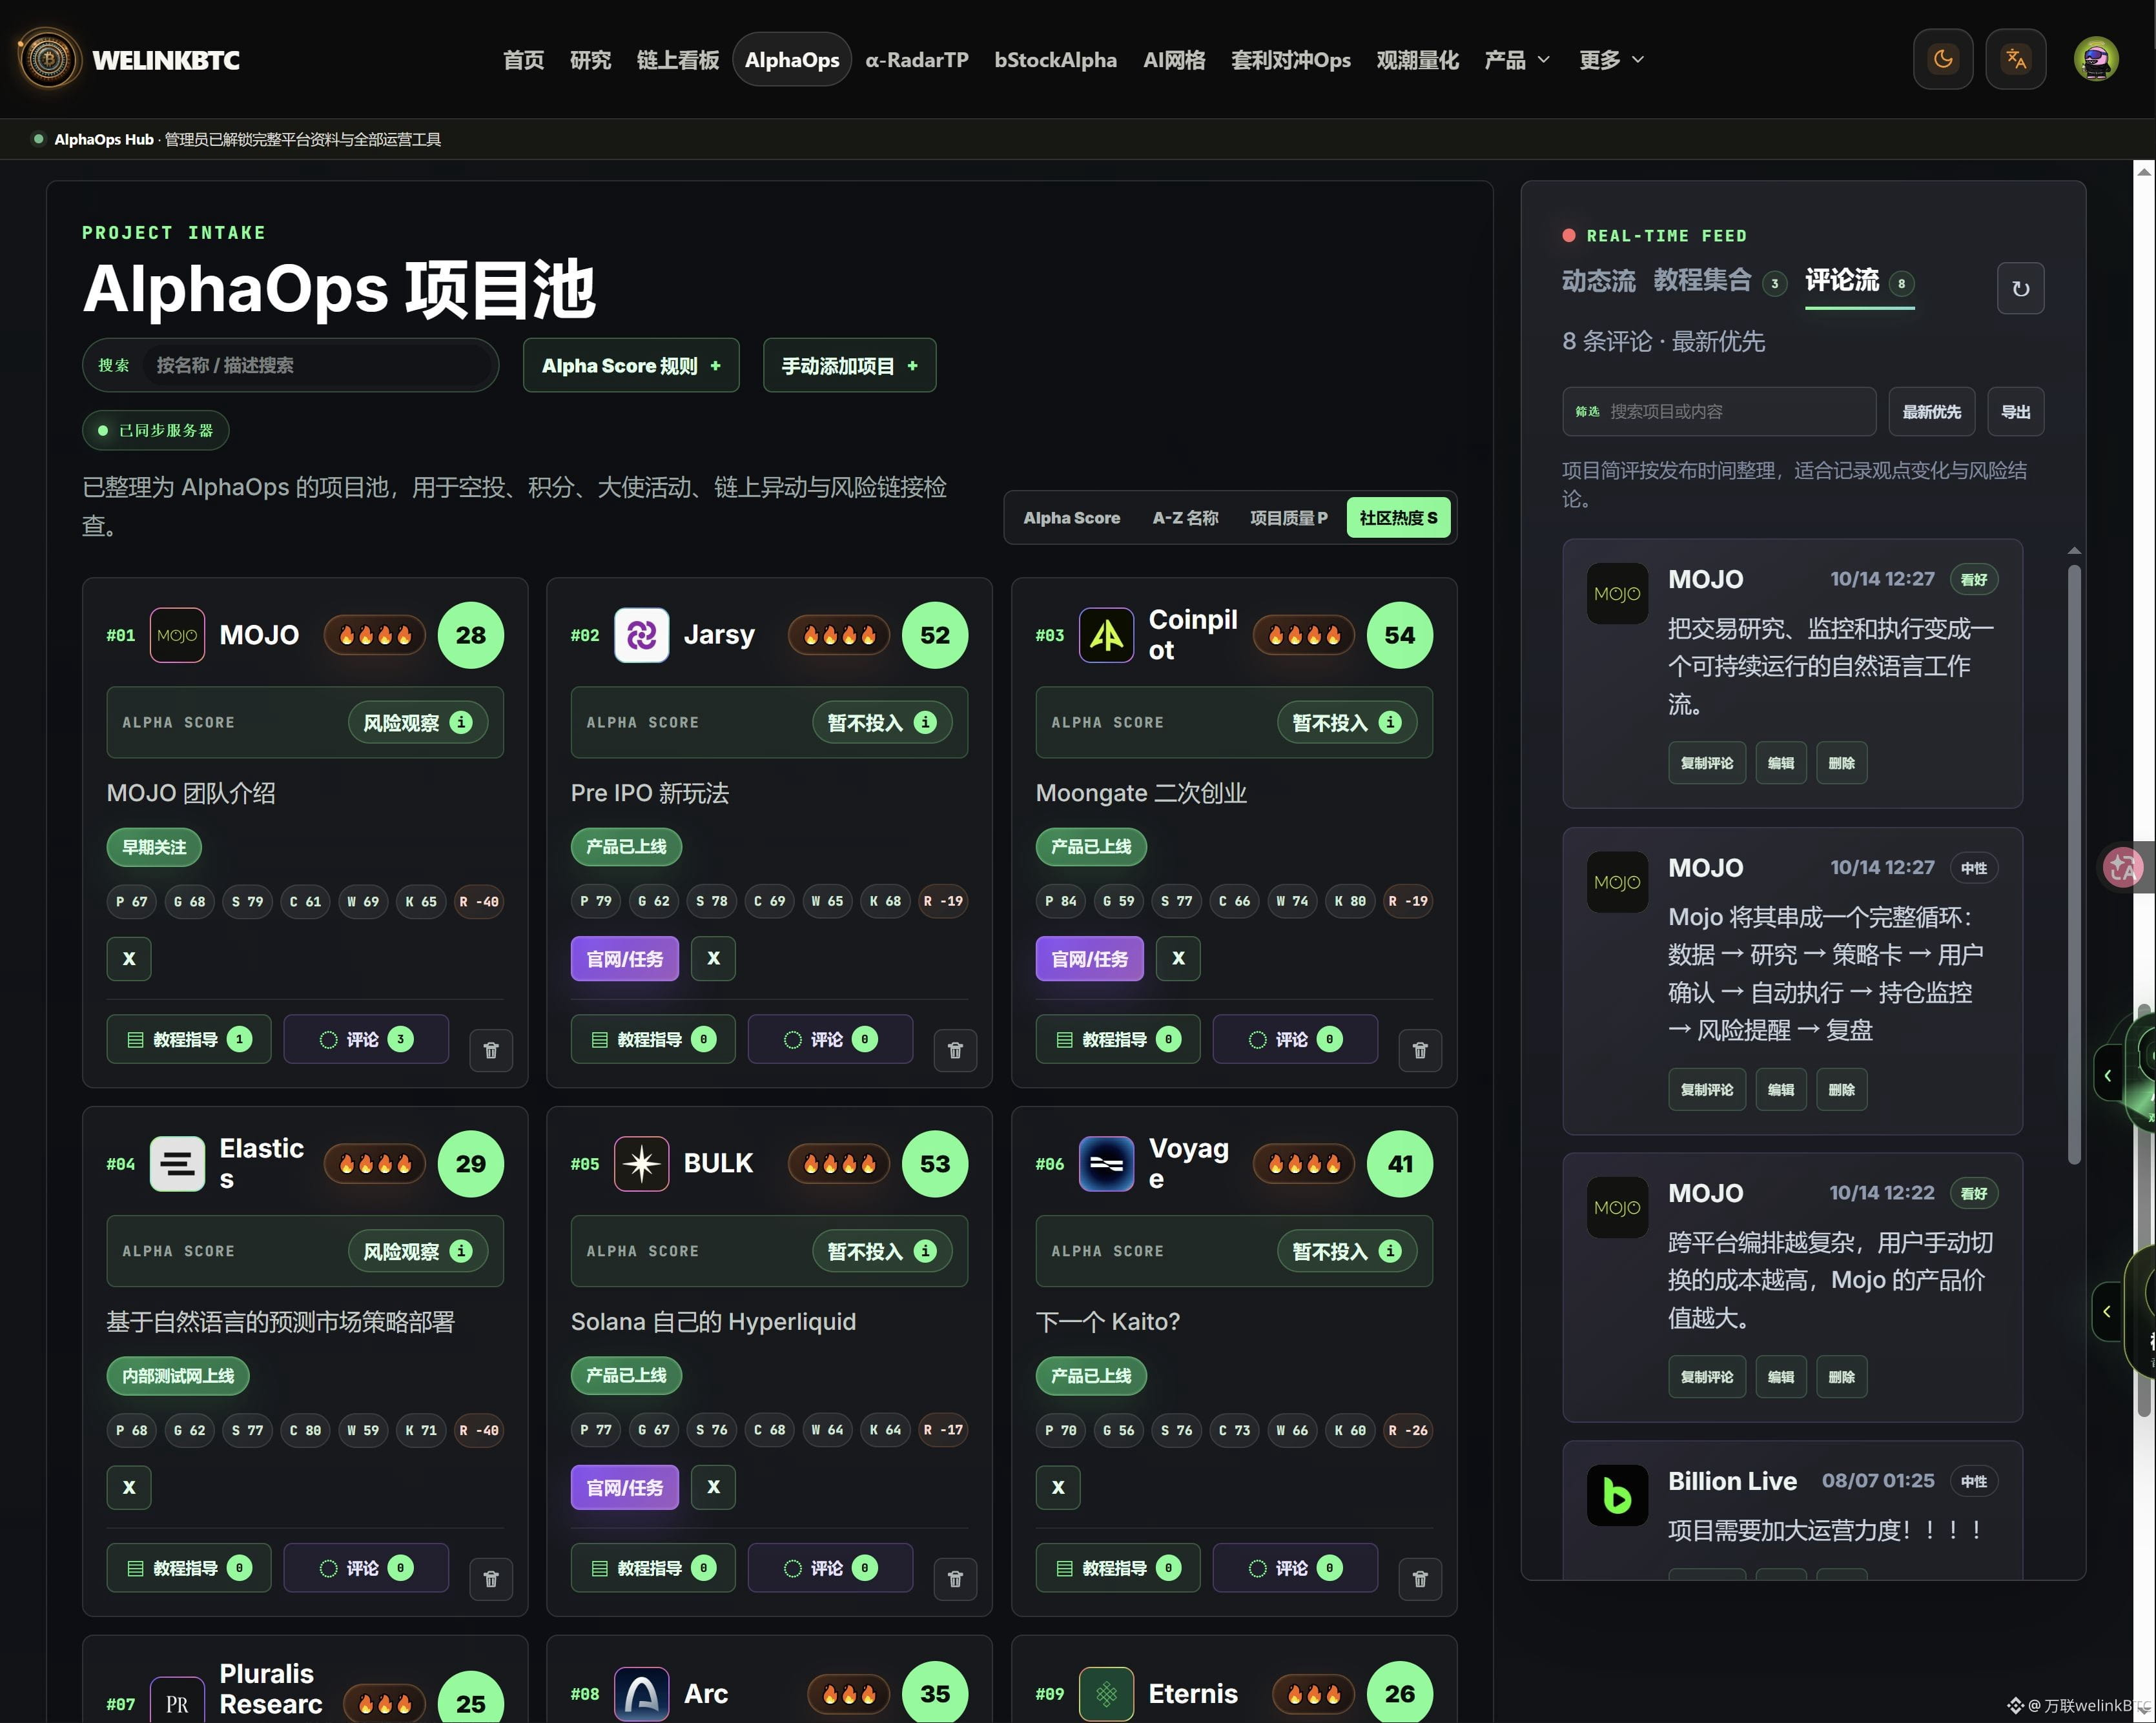
Sharing the latest selected airdrop info
1. Binance gradually resumes withdrawals, StandX claim opening is being watched
👉 Binance officially resumes multi-chain withdrawals in phases starting today (BTC/ETH/BSC/SOL/Arb, etc. will open one after another)
👉 StandX $DUSD: the official says claims will still open after withdrawals resume
Portal
https://standx.com/airdrop
https://kaito.ai/airdrops
2. Predict.fun $PREDICT TGE/S1 claim delayed
The official schedule has been aligned with Binance Alpha/spot being postponed; the new time will be announced later
Portal
https://predict.fun/
3. Ondo Perps cash rewards continue
The new version’s first-week cash prize pool is 220,000 USDC + 5 million points reward pool
https://app.ondoperps.xyz/?ref=6G11VG
4. arcus_xyz raised $97 million
Arcus points program:
https://app.arcus.xyz/ref/WELINKBTC
5. entropyIO raised $14 million, based on Hyperliquid
Interaction access:
https://entropy.io/?r=welinkbtc
6. metricxyz, built by former Uni folks
Both swap and LP provision can earn points; the referral feature is already live
Portal:
https://app.metric.xyz/r/welinkbtc
7. KOR airdrop registration is about to close
Registration until 11.2 14:00 UTC
Portal
airdrop.korprotocol.foundation
8. Hypest Access Pass: Phase 2 WL + mint on 11.3
Phase 2 applications are still within the window, eligibility check around 11.2
11.3 16:00 UTC mint on OpenSea, 2,222 pieces at 0.015 ETH, Robinhood Chain, bridge ETH first
Portal
https://apply.hypest.gg/
9. Extended Final Arc trading competition is wrapping up
Competition runs until 11.3 00:00 UTC, with a $250k cash prize + 750k Xpoints
10. Forever / Fables / Billions are claimable / checkable
👉 Forever NFT holders can claim tokens
enterforever.com/claim
👉 Fables claim
claim.fables.fi
👉 Billions $BILL staking page
staking.billions.network
11. USDAI $CHIP, Axis have long claim windows
👉 $CHIP claim until about 2027.1.31
app.usd.ai/chip
👉 Axis claim until about 2027.1.21
airdrop.axisrobotics.ai
12. KieDex TGE watch on 11.18
Official schedule is 11.18; contract/listing details will be announced by the team later
https://www.kiedex.app/
13. Primus Labs tasks expanded to about 25
Accumulate reputation points, which will affect future weight
Portal
points.primuslabs.xyz
10. Catalyst waitlist
Portal
https://catalyst.app/?r=WdHBC
#welinkBTC
Everything connected, data is king | Follow for more airdrop events
$BNB
{future}(SOLUSDT)
{future}(BNBUSDT)
Sharing the latest selected airdrop info
1. Binance gradually resumes withdrawals, StandX claim opening is being watched
👉 Binance officially resumes multi-chain withdrawals in phases starting today (BTC/ETH/BSC/SOL/Arb, etc. will open one after another)
👉 StandX $DUSD: the official says claims will still open after withdrawals resume
Portal
https://standx.com/airdrop
https://kaito.ai/airdrops
2. Predict.fun $PREDICT TGE/S1 claim delayed
The official schedule has been aligned with Binance Alpha/spot being postponed; the new time will be announced later
Portal
https://predict.fun/
3. Ondo Perps cash rewards continue
The new version’s first-week cash prize pool is 220,000 USDC + 5 million points reward pool
https://app.ondoperps.xyz/?ref=6G11VG
4. arcus_xyz raised $97 million
Arcus points program:
https://app.arcus.xyz/ref/WELINKBTC
5. entropyIO raised $14 million, based on Hyperliquid
Interaction access:
https://entropy.io/?r=welinkbtc
6. metricxyz, built by former Uni folks
Both swap and LP provision can earn points; the referral feature is already live
Portal:
https://app.metric.xyz/r/welinkbtc
7. KOR airdrop registration is about to close
Registration until 11.2 14:00 UTC
Portal
airdrop.korprotocol.foundation
8. Hypest Access Pass: Phase 2 WL + mint on 11.3
Phase 2 applications are still within the window, eligibility check around 11.2
11.3 16:00 UTC mint on OpenSea, 2,222 pieces at 0.015 ETH, Robinhood Chain, bridge ETH first
Portal
https://apply.hypest.gg/
9. Extended Final Arc trading competition is wrapping up
Competition runs until 11.3 00:00 UTC, with a $250k cash prize + 750k Xpoints
10. Forever / Fables / Billions are claimable / checkable
👉 Forever NFT holders can claim tokens
enterforever.com/claim
👉 Fables claim
claim.fables.fi
👉 Billions $BILL staking page
staking.billions.network
11. USDAI $CHIP, Axis have long claim windows
👉 $CHIP claim until about 2027.1.31
app.usd.ai/chip
👉 Axis claim until about 2027.1.21
airdrop.axisrobotics.ai
12. KieDex TGE watch on 11.18
Official schedule is 11.18; contract/listing details will be announced by the team later
https://www.kiedex.app/
13. Primus Labs tasks expanded to about 25
Accumulate reputation points, which will affect future weight
Portal
points.primuslabs.xyz
10. Catalyst waitlist
Portal
https://catalyst.app/?r=WdHBC
#welinkBTC
Everything connected, data is king | Follow for more airdrop events
$BNB
1. Binance gradually resumes withdrawals, StandX claim opening is being watched
👉 Binance officially resumes multi-chain withdrawals in phases starting today (BTC/ETH/BSC/SOL/Arb, etc. will open one after another)
👉 StandX $DUSD: the official says claims will still open after withdrawals resume
Portal
https://standx.com/airdrop
https://kaito.ai/airdrops
2. Predict.fun $PREDICT TGE/S1 claim delayed
The official schedule has been aligned with Binance Alpha/spot being postponed; the new time will be announced later
Portal
https://predict.fun/
3. Ondo Perps cash rewards continue
The new version’s first-week cash prize pool is 220,000 USDC + 5 million points reward pool
https://app.ondoperps.xyz/?ref=6G11VG
4. arcus_xyz raised $97 million
Arcus points program:
https://app.arcus.xyz/ref/WELINKBTC
5. entropyIO raised $14 million, based on Hyperliquid
Interaction access:
https://entropy.io/?r=welinkbtc
6. metricxyz, built by former Uni folks
Both swap and LP provision can earn points; the referral feature is already live
Portal:
https://app.metric.xyz/r/welinkbtc
7. KOR airdrop registration is about to close
Registration until 11.2 14:00 UTC
Portal
airdrop.korprotocol.foundation
8. Hypest Access Pass: Phase 2 WL + mint on 11.3
Phase 2 applications are still within the window, eligibility check around 11.2
11.3 16:00 UTC mint on OpenSea, 2,222 pieces at 0.015 ETH, Robinhood Chain, bridge ETH first
Portal
https://apply.hypest.gg/
9. Extended Final Arc trading competition is wrapping up
Competition runs until 11.3 00:00 UTC, with a $250k cash prize + 750k Xpoints
10. Forever / Fables / Billions are claimable / checkable
👉 Forever NFT holders can claim tokens
enterforever.com/claim
👉 Fables claim
claim.fables.fi
👉 Billions $BILL staking page
staking.billions.network
11. USDAI $CHIP, Axis have long claim windows
👉 $CHIP claim until about 2027.1.31
app.usd.ai/chip
👉 Axis claim until about 2027.1.21
airdrop.axisrobotics.ai
12. KieDex TGE watch on 11.18
Official schedule is 11.18; contract/listing details will be announced by the team later
https://www.kiedex.app/
13. Primus Labs tasks expanded to about 25
Accumulate reputation points, which will affect future weight
Portal
points.primuslabs.xyz
10. Catalyst waitlist
Portal
https://catalyst.app/?r=WdHBC
#welinkBTC
Everything connected, data is king | Follow for more airdrop events
$BNB
2
4
4.4k
·
--
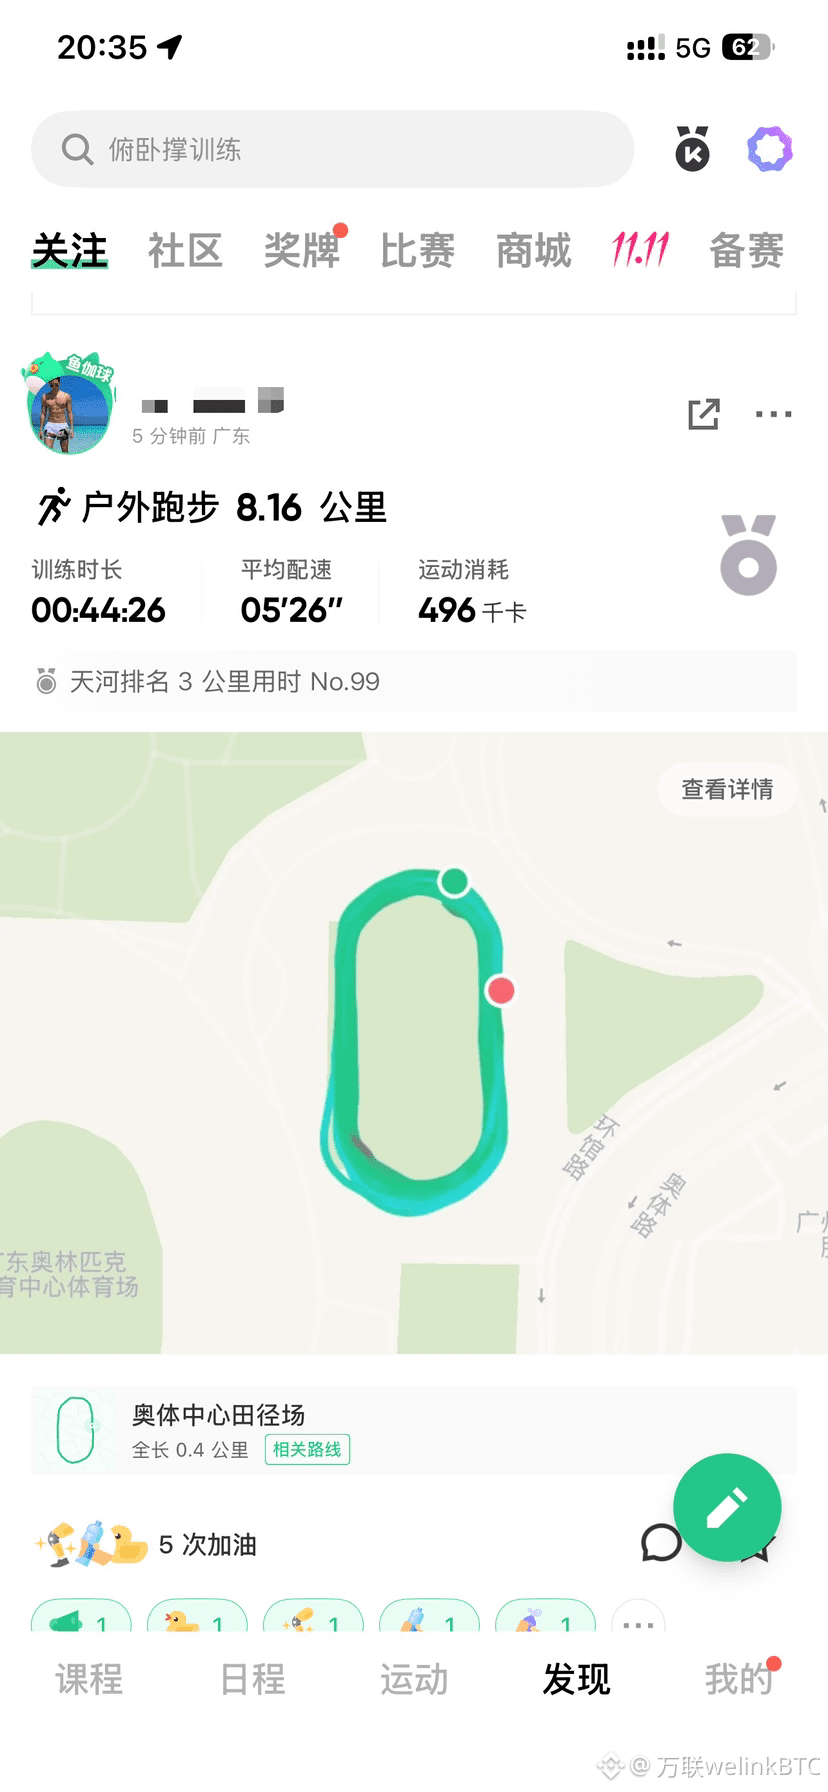
Finished today's 8 km run
Not bad!
I went a bit too fast in the first three kilometers
Hahaha😁
Now I can run pretty comfortably too
😎😎😎
vote for me
#币安陆续恢复多个资产及网络提现服务
#币安更新储备证明地址
#币安已覆盖60亿美元被盗损失
$BNB
{future}(BNBUSDT)
Finished today's 8 km run
Not bad!
I went a bit too fast in the first three kilometers
Hahaha😁
Now I can run pretty comfortably too
😎😎😎
vote for me
#币安陆续恢复多个资产及网络提现服务
#币安更新储备证明地址
#币安已覆盖60亿美元被盗损失
$BNB
Not bad!
I went a bit too fast in the first three kilometers
Hahaha😁
Now I can run pretty comfortably too
😎😎😎
vote for me
#币安陆续恢复多个资产及网络提现服务
#币安更新储备证明地址
#币安已覆盖60亿美元被盗损失
$BNB



1
4
1.7k
·
--
#On-chain Metrics Analysis
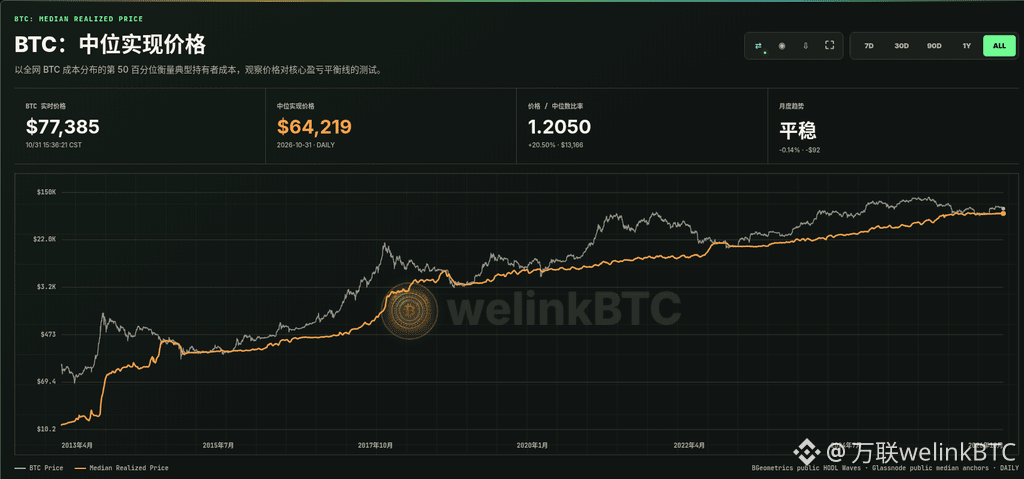
BTC: Median Realized Price
The median realized price is the median of the cost basis distribution based on the last time each BTC moved on-chain across the entire network: half of the supply has a higher cost basis, and half has a lower one. Compared with the average cost basis, which can be skewed by large holders, it more closely reflects the break-even level of a “typical holder.”
Current Status · Modest Profit Zone
BTC is currently trading at around $77,385, with a median realized price of $64,219 (2026-10-31) and a price-to-median ratio of 1.2050. The current price is about 20.50% (approximately $13,166) above the median, so typical holders remain broadly in profit. The monthly trend is steady (-0.14%, approximately -$92). This cost basis was $44,936 a year ago (up 42.9% year over year) and $19,384 four years ago (up 231.3% over four years), showing that the cost basis of core holders continues to rise.
Historical context: When the current price nears the median realized price, the market is testing the break-even level of core participants, which often acts as significant support or resistance. Being slightly above this level indicates modest overall profits, but does not mean a bottom has been confirmed. Watch whether the price can stabilize above the median cost basis, and look for confirmation from trading volume, short-term holder cost basis, and liquidity. If the price falls below this level and fails to recover quickly, it may turn into resistance. For cycle research only; this is not investment advice.
【BTC Short-Term Snapshot】
BTCUSDT is trading at around 77,540 USDT on Binance, nearly flat over 24 hours (about +0.05%), and consolidating within an intraday range of approximately 76,326–78,110.
Macro: The Fed kept rates unchanged at 3.75%–4% at its 10/28 meeting (10–2 vote, with two members favoring a hike). In the short term, prices remain sensitive to the “pause, but hawkish” outlook.
Flows: U.S. spot BTC ETFs saw net outflows of approximately $643 million on 10/30 (Farside), their largest single-day redemption since June. Weekly flows and the October total also turned negative.
Short-term outlook: Price is consolidating above approximately 76,000. Resistance is around 78,000–81,000, while support near the intraday low is worth watching. For discussion only; this is not investment advice.
More Selected On-Chain Cycle Indicators
Portal
https://welinkbtc-onchainmain.xyz/
Understand market cycles like a professional analyst
$BTC
#On-chain Metrics Analysis
BTC: Median Realized Price
The median realized price is the median of the cost basis distribution based on the last time each BTC moved on-chain across the entire network: half of the supply has a higher cost basis, and half has a lower one. Compared with the average cost basis, which can be skewed by large holders, it more closely reflects the break-even level of a “typical holder.”
Current Status · Modest Profit Zone
BTC is currently trading at around $77,385, with a median realized price of $64,219 (2026-10-31) and a price-to-median ratio of 1.2050. The current price is about 20.50% (approximately $13,166) above the median, so typical holders remain broadly in profit. The monthly trend is steady (-0.14%, approximately -$92). This cost basis was $44,936 a year ago (up 42.9% year over year) and $19,384 four years ago (up 231.3% over four years), showing that the cost basis of core holders continues to rise.
Historical context: When the current price nears the median realized price, the market is testing the break-even level of core participants, which often acts as significant support or resistance. Being slightly above this level indicates modest overall profits, but does not mean a bottom has been confirmed. Watch whether the price can stabilize above the median cost basis, and look for confirmation from trading volume, short-term holder cost basis, and liquidity. If the price falls below this level and fails to recover quickly, it may turn into resistance. For cycle research only; this is not investment advice.
【BTC Short-Term Snapshot】
BTCUSDT is trading at around 77,540 USDT on Binance, nearly flat over 24 hours (about +0.05%), and consolidating within an intraday range of approximately 76,326–78,110.
Macro: The Fed kept rates unchanged at 3.75%–4% at its 10/28 meeting (10–2 vote, with two members favoring a hike). In the short term, prices remain sensitive to the “pause, but hawkish” outlook.
Flows: U.S. spot BTC ETFs saw net outflows of approximately $643 million on 10/30 (Farside), their largest single-day redemption since June. Weekly flows and the October total also turned negative.
Short-term outlook: Price is consolidating above approximately 76,000. Resistance is around 78,000–81,000, while support near the intraday low is worth watching. For discussion only; this is not investment advice.
More Selected On-Chain Cycle Indicators
Portal
https://welinkbtc-onchainmain.xyz/
Understand market cycles like a professional analyst
$BTC
BTC: Median Realized Price
The median realized price is the median of the cost basis distribution based on the last time each BTC moved on-chain across the entire network: half of the supply has a higher cost basis, and half has a lower one. Compared with the average cost basis, which can be skewed by large holders, it more closely reflects the break-even level of a “typical holder.”
Current Status · Modest Profit Zone
BTC is currently trading at around $77,385, with a median realized price of $64,219 (2026-10-31) and a price-to-median ratio of 1.2050. The current price is about 20.50% (approximately $13,166) above the median, so typical holders remain broadly in profit. The monthly trend is steady (-0.14%, approximately -$92). This cost basis was $44,936 a year ago (up 42.9% year over year) and $19,384 four years ago (up 231.3% over four years), showing that the cost basis of core holders continues to rise.
Historical context: When the current price nears the median realized price, the market is testing the break-even level of core participants, which often acts as significant support or resistance. Being slightly above this level indicates modest overall profits, but does not mean a bottom has been confirmed. Watch whether the price can stabilize above the median cost basis, and look for confirmation from trading volume, short-term holder cost basis, and liquidity. If the price falls below this level and fails to recover quickly, it may turn into resistance. For cycle research only; this is not investment advice.
【BTC Short-Term Snapshot】
BTCUSDT is trading at around 77,540 USDT on Binance, nearly flat over 24 hours (about +0.05%), and consolidating within an intraday range of approximately 76,326–78,110.
Macro: The Fed kept rates unchanged at 3.75%–4% at its 10/28 meeting (10–2 vote, with two members favoring a hike). In the short term, prices remain sensitive to the “pause, but hawkish” outlook.
Flows: U.S. spot BTC ETFs saw net outflows of approximately $643 million on 10/30 (Farside), their largest single-day redemption since June. Weekly flows and the October total also turned negative.
Short-term outlook: Price is consolidating above approximately 76,000. Resistance is around 78,000–81,000, while support near the intraday low is worth watching. For discussion only; this is not investment advice.
More Selected On-Chain Cycle Indicators
Portal
https://welinkbtc-onchainmain.xyz/
Understand market cycles like a professional analyst
$BTC
2
1.4k
·
--
#On-Chain Indicator Analysis
BTC: MVRV Z-Score
The MVRV Z-Score measures how far the spot market cap deviates from the network’s true cost basis. It is calculated by dividing (market cap − realized cap) by the cumulative standard deviation since Bitcoin’s genesis, then taking the 7-day moving average. It is useful for assessing where we are in the cycle and identifying extreme valuations.
Current status · Trend Expansion · 7D Z-Score 0.8327
The 7-day Z-Score is 0.8327, above the research threshold of 0.7539 by +0.0788. The raw value for the day is 0.7489, current MVRV is 1.427×, the 180-day peak is 1.028 (2026-09-27), and the BGeometrics validation value is 0.7585 (2026-10-30). The most recent move above the threshold occurred on 2026-08-25, 66 days ago as of 2026-10-30. The remaining days have fallen to zero under both the classic 42-day average across the first three cycles and the extended 66-day average that includes the 140-day sample from 2022.
Historical reference: After crossing above the threshold in the 2012, 2016, and 2019 cycles, the countdowns were 32, 49, and 44 days, respectively, while the 2022 cycle lasted 140 days. The samples differ significantly, so both windows are shown side by side; small-sample statistics should not be treated as a definitive market top. Ranges: <0 Cost Discount, 0–0.7539 Recovery and Accumulation, 0.7539–3 Trend Expansion, ≥7 Extreme Overheating. Cycle day counts are for research purposes only; they do not predict prices and are not investment advice.
【BTC Short-Term Snapshot】
Binance BTCUSDT is trading at around 77,540 USDT, nearly flat over 24 hours (around +0.05%), consolidating intraday between approximately 76,326 and 78,110.
Macro: The Federal Reserve held rates at 3.75%–4% at its 10/28 meeting (10–2 vote, with two members favoring a rate hike). In the short term, pricing remains affected by the “pause, but hawkish” stance.
Flows: U.S. spot BTC ETFs saw net outflows of around $643 million on 10/30 (Farside), their largest single-day redemption since June. Weekly and October-to-date flows also turned negative.
Short-term outlook: Price is consolidating above around 76,000. Resistance is around 78,000–81,000; watch for support near the intraday low. For discussion only; not investment advice.
More selected on-chain cycle indicators
Portal
https://welinkbtc-onchainmain.xyz/
Understand market cycles like a professional analyst
$BTC
#On-Chain Indicator Analysis
BTC: MVRV Z-Score
The MVRV Z-Score measures how far the spot market cap deviates from the network’s true cost basis. It is calculated by dividing (market cap − realized cap) by the cumulative standard deviation since Bitcoin’s genesis, then taking the 7-day moving average. It is useful for assessing where we are in the cycle and identifying extreme valuations.
Current status · Trend Expansion · 7D Z-Score 0.8327
The 7-day Z-Score is 0.8327, above the research threshold of 0.7539 by +0.0788. The raw value for the day is 0.7489, current MVRV is 1.427×, the 180-day peak is 1.028 (2026-09-27), and the BGeometrics validation value is 0.7585 (2026-10-30). The most recent move above the threshold occurred on 2026-08-25, 66 days ago as of 2026-10-30. The remaining days have fallen to zero under both the classic 42-day average across the first three cycles and the extended 66-day average that includes the 140-day sample from 2022.
Historical reference: After crossing above the threshold in the 2012, 2016, and 2019 cycles, the countdowns were 32, 49, and 44 days, respectively, while the 2022 cycle lasted 140 days. The samples differ significantly, so both windows are shown side by side; small-sample statistics should not be treated as a definitive market top. Ranges: <0 Cost Discount, 0–0.7539 Recovery and Accumulation, 0.7539–3 Trend Expansion, ≥7 Extreme Overheating. Cycle day counts are for research purposes only; they do not predict prices and are not investment advice.
【BTC Short-Term Snapshot】
Binance BTCUSDT is trading at around 77,540 USDT, nearly flat over 24 hours (around +0.05%), consolidating intraday between approximately 76,326 and 78,110.
Macro: The Federal Reserve held rates at 3.75%–4% at its 10/28 meeting (10–2 vote, with two members favoring a rate hike). In the short term, pricing remains affected by the “pause, but hawkish” stance.
Flows: U.S. spot BTC ETFs saw net outflows of around $643 million on 10/30 (Farside), their largest single-day redemption since June. Weekly and October-to-date flows also turned negative.
Short-term outlook: Price is consolidating above around 76,000. Resistance is around 78,000–81,000; watch for support near the intraday low. For discussion only; not investment advice.
More selected on-chain cycle indicators
Portal
https://welinkbtc-onchainmain.xyz/
Understand market cycles like a professional analyst
$BTC
BTC: MVRV Z-Score
The MVRV Z-Score measures how far the spot market cap deviates from the network’s true cost basis. It is calculated by dividing (market cap − realized cap) by the cumulative standard deviation since Bitcoin’s genesis, then taking the 7-day moving average. It is useful for assessing where we are in the cycle and identifying extreme valuations.
Current status · Trend Expansion · 7D Z-Score 0.8327
The 7-day Z-Score is 0.8327, above the research threshold of 0.7539 by +0.0788. The raw value for the day is 0.7489, current MVRV is 1.427×, the 180-day peak is 1.028 (2026-09-27), and the BGeometrics validation value is 0.7585 (2026-10-30). The most recent move above the threshold occurred on 2026-08-25, 66 days ago as of 2026-10-30. The remaining days have fallen to zero under both the classic 42-day average across the first three cycles and the extended 66-day average that includes the 140-day sample from 2022.
Historical reference: After crossing above the threshold in the 2012, 2016, and 2019 cycles, the countdowns were 32, 49, and 44 days, respectively, while the 2022 cycle lasted 140 days. The samples differ significantly, so both windows are shown side by side; small-sample statistics should not be treated as a definitive market top. Ranges: <0 Cost Discount, 0–0.7539 Recovery and Accumulation, 0.7539–3 Trend Expansion, ≥7 Extreme Overheating. Cycle day counts are for research purposes only; they do not predict prices and are not investment advice.
【BTC Short-Term Snapshot】
Binance BTCUSDT is trading at around 77,540 USDT, nearly flat over 24 hours (around +0.05%), consolidating intraday between approximately 76,326 and 78,110.
Macro: The Federal Reserve held rates at 3.75%–4% at its 10/28 meeting (10–2 vote, with two members favoring a rate hike). In the short term, pricing remains affected by the “pause, but hawkish” stance.
Flows: U.S. spot BTC ETFs saw net outflows of around $643 million on 10/30 (Farside), their largest single-day redemption since June. Weekly and October-to-date flows also turned negative.
Short-term outlook: Price is consolidating above around 76,000. Resistance is around 78,000–81,000; watch for support near the intraday low. For discussion only; not investment advice.
More selected on-chain cycle indicators
Portal
https://welinkbtc-onchainmain.xyz/
Understand market cycles like a professional analyst
$BTC
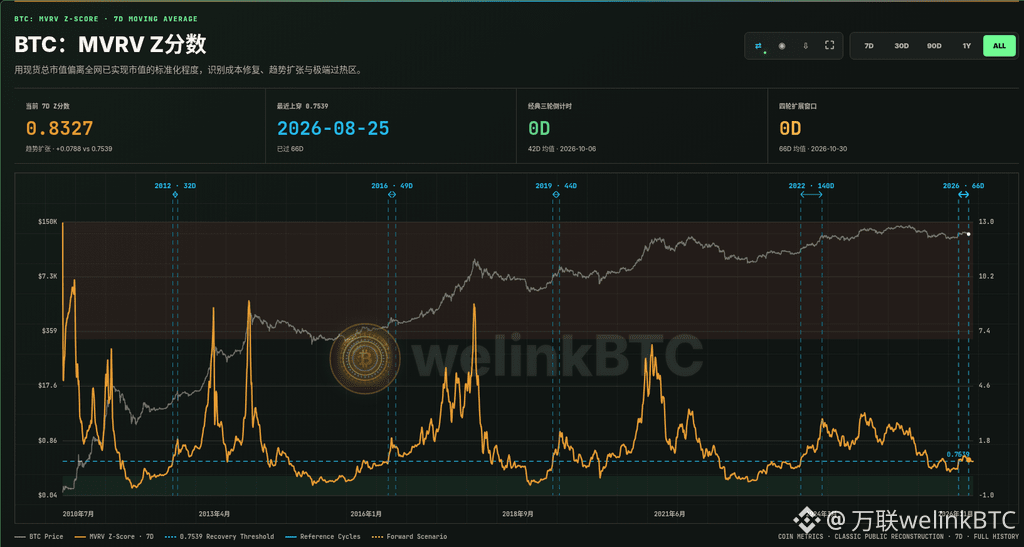
2
1k
·
--
Sharing the latest airdrop picks
1. StandX $DUSD airdrop claim delayed ⚠️
👉 Official announcement on 10.31: Claims were originally scheduled to open on 11.1 at 08:00 (Beijing Time). Due to Binance suspending withdrawals, claims will open after Binance resumes withdrawals. Wait for the official announcement.
👉 You can also check the StandX × Kaito airdrop farming campaign in advance.
Link:
standx.com/airdrop
kaito.ai/airdrops
2. Ondo Perps cash rewards revamped
The first week of the new version features a 220,000 USDC cash prize pool + a 5 million points pool.
Rewards link:
https://app.ondoperps.xyz/?ref=6G11VG
3. arcus_xyz raises $97 million
Arcus points program:
https://app.arcus.xyz/ref/WELINKBTC
4. entropyIO raises $14 million; built on Hyperliquid
Get started:
https://entropy.io/?r=welinkbtc
5. metricxyz hasn't officially announced its points system yet, so get in early.
Earn points through swaps and providing LP. The referral feature is now live.
Link:
https://app.metric.xyz/r/welinkbtc
6. Predict.fun $PREDICT TGE + S1 claims delayed
Due to the delay of the Binance Alpha/spot listing, the new claim date will be announced officially.
You can check S1 points now; S2 has begun.
predict.fun/points/season/1
7. KOR Protocol $KOR airdrop registration closing soon
Deadline: 11.2 22:00
airdrop.korprotocol.foundation
8. Hypest Access Pass Phase 2 whitelist applications
2,222 passes in total, 0.015 ETH each. 11.4 00:00 (Beijing Time)
Mint on OpenSea; eligibility checker goes live on 11.2.
apply.hypest.gg
9. Extended Final Arc trading competition final sprint
Deadline: 11.3 08:00 (Beijing Time)
Prize pool: 250,000 USDC + 750,000 XP.
Spot trading is live; $XTEN TGE expected in November.
10. Spicenet early points tasks
DeFi brokerage network; raised $5 million in Series A funding, with $8.4 million in total funding.
Complete public beta tasks to earn points.
portal.spicenet.io
11. Billions staking rewards can now be unlocked
If you claimed before, go check.
staking.billions.network
12. USDAI $CHIP claims are live
Deadline: 2027.1.31
app.usd.ai/chip
13. KieDex TGE scheduled for 11.18
Airdrop details to be announced officially
#welinkBTC
Follow more airdrop campaigns
Focused on Web3, blockchain games, AI, and AirDrop investment opportunities 🫙
Tracking 100 crypto influencers across the web 🔥 Let's ride out the bull and bear markets together $BNB
{future}(BNBUSDT)
Sharing the latest airdrop picks
1. StandX $DUSD airdrop claim delayed ⚠️
👉 Official announcement on 10.31: Claims were originally scheduled to open on 11.1 at 08:00 (Beijing Time). Due to Binance suspending withdrawals, claims will open after Binance resumes withdrawals. Wait for the official announcement.
👉 You can also check the StandX × Kaito airdrop farming campaign in advance.
Link:
standx.com/airdrop
kaito.ai/airdrops
2. Ondo Perps cash rewards revamped
The first week of the new version features a 220,000 USDC cash prize pool + a 5 million points pool.
Rewards link:
https://app.ondoperps.xyz/?ref=6G11VG
3. arcus_xyz raises $97 million
Arcus points program:
https://app.arcus.xyz/ref/WELINKBTC
4. entropyIO raises $14 million; built on Hyperliquid
Get started:
https://entropy.io/?r=welinkbtc
5. metricxyz hasn't officially announced its points system yet, so get in early.
Earn points through swaps and providing LP. The referral feature is now live.
Link:
https://app.metric.xyz/r/welinkbtc
6. Predict.fun $PREDICT TGE + S1 claims delayed
Due to the delay of the Binance Alpha/spot listing, the new claim date will be announced officially.
You can check S1 points now; S2 has begun.
predict.fun/points/season/1
7. KOR Protocol $KOR airdrop registration closing soon
Deadline: 11.2 22:00
airdrop.korprotocol.foundation
8. Hypest Access Pass Phase 2 whitelist applications
2,222 passes in total, 0.015 ETH each. 11.4 00:00 (Beijing Time)
Mint on OpenSea; eligibility checker goes live on 11.2.
apply.hypest.gg
9. Extended Final Arc trading competition final sprint
Deadline: 11.3 08:00 (Beijing Time)
Prize pool: 250,000 USDC + 750,000 XP.
Spot trading is live; $XTEN TGE expected in November.
10. Spicenet early points tasks
DeFi brokerage network; raised $5 million in Series A funding, with $8.4 million in total funding.
Complete public beta tasks to earn points.
portal.spicenet.io
11. Billions staking rewards can now be unlocked
If you claimed before, go check.
staking.billions.network
12. USDAI $CHIP claims are live
Deadline: 2027.1.31
app.usd.ai/chip
13. KieDex TGE scheduled for 11.18
Airdrop details to be announced officially
#welinkBTC
Follow more airdrop campaigns
Focused on Web3, blockchain games, AI, and AirDrop investment opportunities 🫙
Tracking 100 crypto influencers across the web 🔥 Let's ride out the bull and bear markets together $BNB
1. StandX $DUSD airdrop claim delayed ⚠️
👉 Official announcement on 10.31: Claims were originally scheduled to open on 11.1 at 08:00 (Beijing Time). Due to Binance suspending withdrawals, claims will open after Binance resumes withdrawals. Wait for the official announcement.
👉 You can also check the StandX × Kaito airdrop farming campaign in advance.
Link:
standx.com/airdrop
kaito.ai/airdrops
2. Ondo Perps cash rewards revamped
The first week of the new version features a 220,000 USDC cash prize pool + a 5 million points pool.
Rewards link:
https://app.ondoperps.xyz/?ref=6G11VG
3. arcus_xyz raises $97 million
Arcus points program:
https://app.arcus.xyz/ref/WELINKBTC
4. entropyIO raises $14 million; built on Hyperliquid
Get started:
https://entropy.io/?r=welinkbtc
5. metricxyz hasn't officially announced its points system yet, so get in early.
Earn points through swaps and providing LP. The referral feature is now live.
Link:
https://app.metric.xyz/r/welinkbtc
6. Predict.fun $PREDICT TGE + S1 claims delayed
Due to the delay of the Binance Alpha/spot listing, the new claim date will be announced officially.
You can check S1 points now; S2 has begun.
predict.fun/points/season/1
7. KOR Protocol $KOR airdrop registration closing soon
Deadline: 11.2 22:00
airdrop.korprotocol.foundation
8. Hypest Access Pass Phase 2 whitelist applications
2,222 passes in total, 0.015 ETH each. 11.4 00:00 (Beijing Time)
Mint on OpenSea; eligibility checker goes live on 11.2.
apply.hypest.gg
9. Extended Final Arc trading competition final sprint
Deadline: 11.3 08:00 (Beijing Time)
Prize pool: 250,000 USDC + 750,000 XP.
Spot trading is live; $XTEN TGE expected in November.
10. Spicenet early points tasks
DeFi brokerage network; raised $5 million in Series A funding, with $8.4 million in total funding.
Complete public beta tasks to earn points.
portal.spicenet.io
11. Billions staking rewards can now be unlocked
If you claimed before, go check.
staking.billions.network
12. USDAI $CHIP claims are live
Deadline: 2027.1.31
app.usd.ai/chip
13. KieDex TGE scheduled for 11.18
Airdrop details to be announced officially
#welinkBTC
Follow more airdrop campaigns
Focused on Web3, blockchain games, AI, and AirDrop investment opportunities 🫙
Tracking 100 crypto influencers across the web 🔥 Let's ride out the bull and bear markets together $BNB
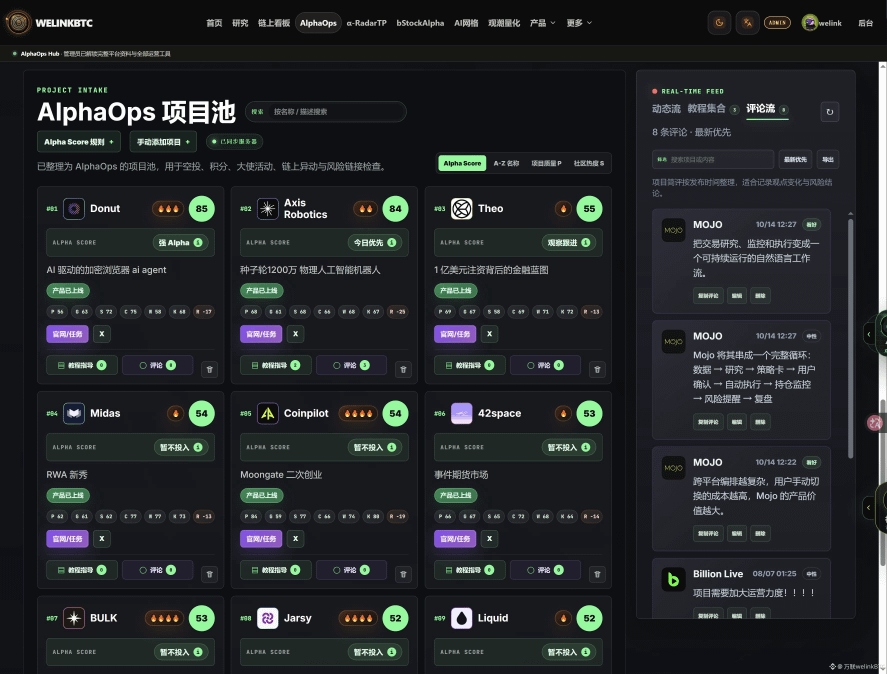
11
8
47
11.9k
·
--
Night run check-in: finished 10 kilometers
Not bad, not bad
3 kilometers to warm up, 7 kilometers at a hard pace
Pretty decent, I'd say
#币安披露黑客事件进展63亿美元损失已弥补八成
$BNB
{future}(BNBUSDT)
Night run check-in: finished 10 kilometers
Not bad, not bad
3 kilometers to warm up, 7 kilometers at a hard pace
Pretty decent, I'd say
#币安披露黑客事件进展63亿美元损失已弥补八成
$BNB
Not bad, not bad
3 kilometers to warm up, 7 kilometers at a hard pace
Pretty decent, I'd say
#币安披露黑客事件进展63亿美元损失已弥补八成
$BNB
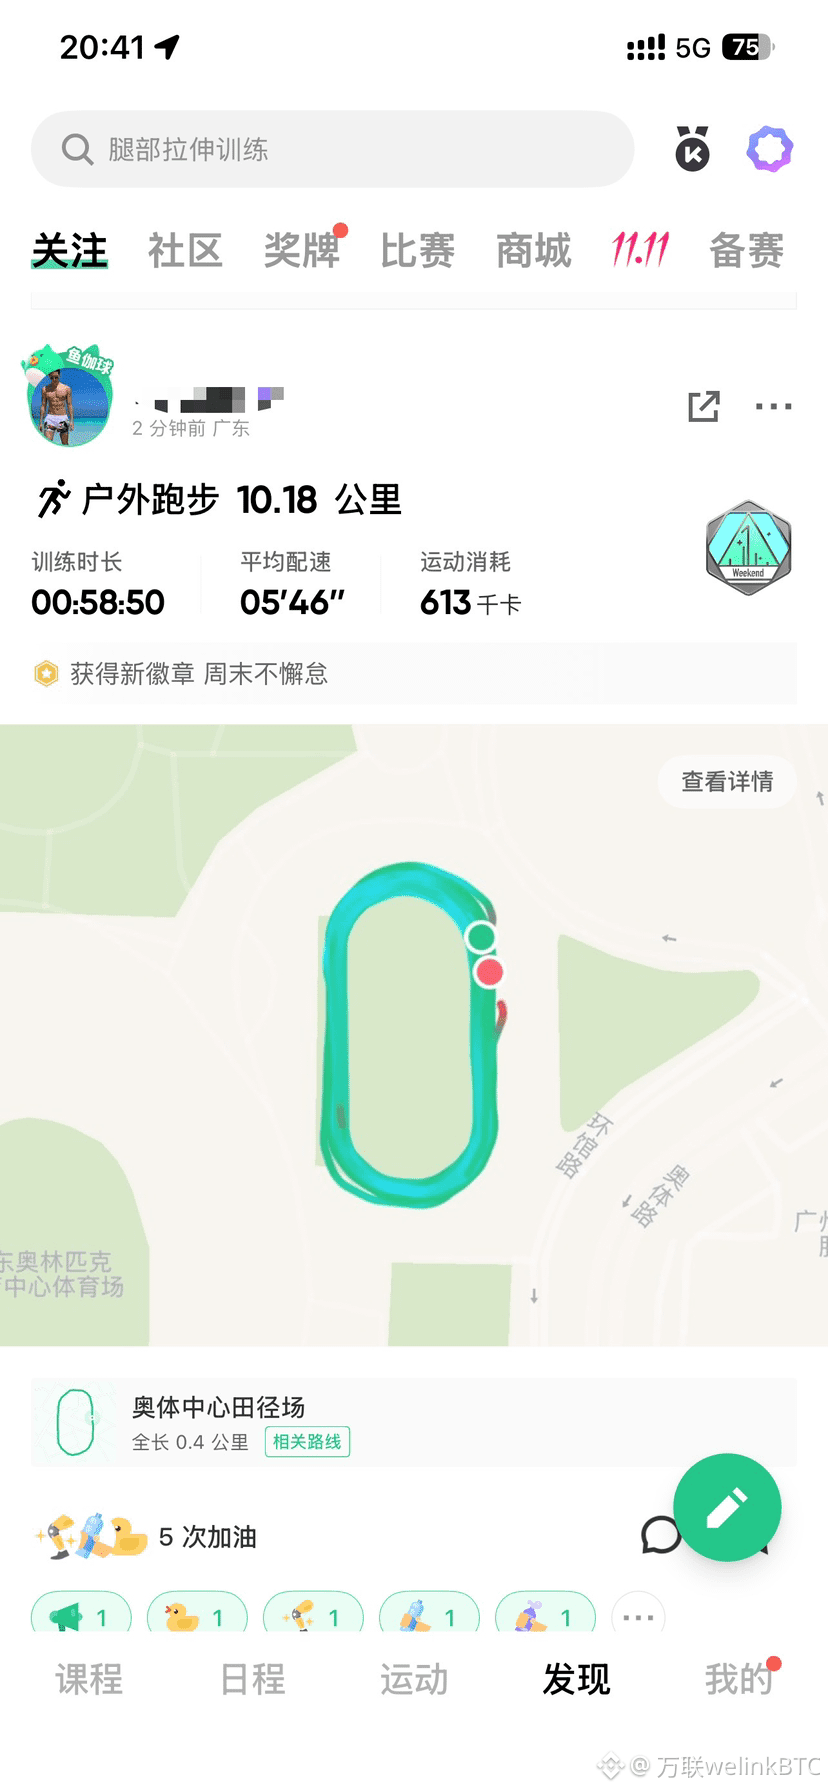
2
4
1.2k
·
--
#On-Chain Indicator Analysis
Bitcoin: Supply in Profit/Loss Ratio (excluding >7Y)
This publicly available proxy model subtracts dormant coins aged 7–10 years and over 10 years from the total supply in profit, then divides the result by the total supply in loss and calculates a 7-day moving average. A ratio above 1.0 indicates that more active coins are in profit; below 1.0, coins in loss are dominant.
Current Status · Recovery Zone
The latest 7-day moving average ratio is 1.14, with approximately 53.3% of the active supply in profit and 46.7% in loss. The 7-day average is 1.28 and the 30-day average is 1.56, still about 0.14 above the 1.0 threshold (on-chain date: 2026-10-29). The 7-day trend is declining, with pressure increasing; the cumulative number of days below 1.0 in this cycle is 0.
Historical reference: Sustained periods with the ratio below 1.0 have overlapped with the deep bear-market basing periods of 2014–2015, 2018–2019, and 2022–2023. A single dip below the threshold does not automatically confirm an absolute bottom; the duration below the threshold, the slope, and spot demand and liquidity are more important. A move back above 1.0 with the 7-day average continuing to rise is generally more informative than a brief touch of the threshold. For cycle research only; this is not investment advice.
【BTC Short-Term Snapshot · As of 00:05 Beijing Time on 10/31】
Current price is around 77,462 USDT (Binance), down about 5.33% over 24 hours, with a range of 76,500–81,971; down about 4.6% since the 10/24 open and about 6.7% since the 10/21 open. On 10/29, price broke below the former support at 79,200–79,500 on heavy volume; on 10/30, it retested 76,500 and then moved sideways on declining volume. First support is at 76,500–76,650, then 77,910; resistance is at 78,800 → 79,700–80,000 → 81,823–81,971. Drivers: the Fed held rates at 3.75%–4.00% (10–2), taking a hawkish stance; spot ETFs saw net inflows of about $424 million over roughly three days (mainly IBIT), but the price remains weak. An exchange security incident and liquidations on the order of $1.5 billion also amplified volatility. For observation only; this is not investment advice.
More Selected On-Chain Cycle Indicators
Portal
https://welinkbtc-onchainmain.xyz/
Understand market cycles like a professional analyst
$BTC
#On-Chain Indicator Analysis
Bitcoin: Supply in Profit/Loss Ratio (excluding >7Y)
This publicly available proxy model subtracts dormant coins aged 7–10 years and over 10 years from the total supply in profit, then divides the result by the total supply in loss and calculates a 7-day moving average. A ratio above 1.0 indicates that more active coins are in profit; below 1.0, coins in loss are dominant.
Current Status · Recovery Zone
The latest 7-day moving average ratio is 1.14, with approximately 53.3% of the active supply in profit and 46.7% in loss. The 7-day average is 1.28 and the 30-day average is 1.56, still about 0.14 above the 1.0 threshold (on-chain date: 2026-10-29). The 7-day trend is declining, with pressure increasing; the cumulative number of days below 1.0 in this cycle is 0.
Historical reference: Sustained periods with the ratio below 1.0 have overlapped with the deep bear-market basing periods of 2014–2015, 2018–2019, and 2022–2023. A single dip below the threshold does not automatically confirm an absolute bottom; the duration below the threshold, the slope, and spot demand and liquidity are more important. A move back above 1.0 with the 7-day average continuing to rise is generally more informative than a brief touch of the threshold. For cycle research only; this is not investment advice.
【BTC Short-Term Snapshot · As of 00:05 Beijing Time on 10/31】
Current price is around 77,462 USDT (Binance), down about 5.33% over 24 hours, with a range of 76,500–81,971; down about 4.6% since the 10/24 open and about 6.7% since the 10/21 open. On 10/29, price broke below the former support at 79,200–79,500 on heavy volume; on 10/30, it retested 76,500 and then moved sideways on declining volume. First support is at 76,500–76,650, then 77,910; resistance is at 78,800 → 79,700–80,000 → 81,823–81,971. Drivers: the Fed held rates at 3.75%–4.00% (10–2), taking a hawkish stance; spot ETFs saw net inflows of about $424 million over roughly three days (mainly IBIT), but the price remains weak. An exchange security incident and liquidations on the order of $1.5 billion also amplified volatility. For observation only; this is not investment advice.
More Selected On-Chain Cycle Indicators
Portal
https://welinkbtc-onchainmain.xyz/
Understand market cycles like a professional analyst
$BTC
Bitcoin: Supply in Profit/Loss Ratio (excluding >7Y)
This publicly available proxy model subtracts dormant coins aged 7–10 years and over 10 years from the total supply in profit, then divides the result by the total supply in loss and calculates a 7-day moving average. A ratio above 1.0 indicates that more active coins are in profit; below 1.0, coins in loss are dominant.
Current Status · Recovery Zone
The latest 7-day moving average ratio is 1.14, with approximately 53.3% of the active supply in profit and 46.7% in loss. The 7-day average is 1.28 and the 30-day average is 1.56, still about 0.14 above the 1.0 threshold (on-chain date: 2026-10-29). The 7-day trend is declining, with pressure increasing; the cumulative number of days below 1.0 in this cycle is 0.
Historical reference: Sustained periods with the ratio below 1.0 have overlapped with the deep bear-market basing periods of 2014–2015, 2018–2019, and 2022–2023. A single dip below the threshold does not automatically confirm an absolute bottom; the duration below the threshold, the slope, and spot demand and liquidity are more important. A move back above 1.0 with the 7-day average continuing to rise is generally more informative than a brief touch of the threshold. For cycle research only; this is not investment advice.
【BTC Short-Term Snapshot · As of 00:05 Beijing Time on 10/31】
Current price is around 77,462 USDT (Binance), down about 5.33% over 24 hours, with a range of 76,500–81,971; down about 4.6% since the 10/24 open and about 6.7% since the 10/21 open. On 10/29, price broke below the former support at 79,200–79,500 on heavy volume; on 10/30, it retested 76,500 and then moved sideways on declining volume. First support is at 76,500–76,650, then 77,910; resistance is at 78,800 → 79,700–80,000 → 81,823–81,971. Drivers: the Fed held rates at 3.75%–4.00% (10–2), taking a hawkish stance; spot ETFs saw net inflows of about $424 million over roughly three days (mainly IBIT), but the price remains weak. An exchange security incident and liquidations on the order of $1.5 billion also amplified volatility. For observation only; this is not investment advice.
More Selected On-Chain Cycle Indicators
Portal
https://welinkbtc-onchainmain.xyz/
Understand market cycles like a professional analyst
$BTC
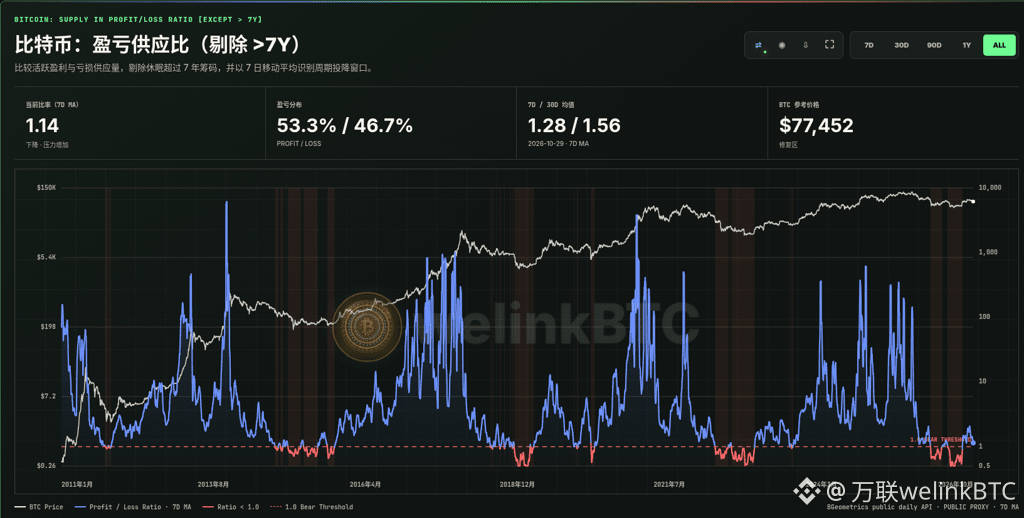
2
1.7k
·
--
# On-chain Metrics Analysis
BTC: Realized Cap HODL Waves
Realized Cap HODL Waves weight each Bitcoin by its cost basis—the price at which it last moved on-chain—and then group it by age since last movement. Unlike a simple coin-count breakdown, this metric offers a clearer view of how cost basis shifts between short-term traders and long-term holders.
Current Status · Deeply Locked · Historical Highs
The cost-basis-weighted share of coins held for more than 3 months is 84.60%, with a 7-day average of 84.74% and a 30-day average of 85.38%. This is about 0.60% above the 84% deep-lock reference line (on-chain date: 2026-10-29). The 7-day change is about -0.40%, indicating a short-term decline and renewed activity among older coins. The peak for this cycle was about 88.10% (2026-07-26), while the historical peak was about 89.85% (2022-10-24).
Historical context: High levels of lock-up are commonly seen in the later stages of accumulation after heavy turnover during bear markets, but they do not guarantee an immediate price rise. This metric describes the supply-side state and should still be assessed alongside spot demand, global liquidity, and realized profit and loss. When the share falls rapidly, pay closer attention to distribution of older coins and turnover. For cycle research only; not investment advice.
【BTC Short-Term Snapshot · As of 10/31 00:05 Beijing Time】
Spot price is about 77,462 USDT (Binance), down about 5.33% over 24 hours, with a range of 76,500–81,971. It is down about 4.6% from the 10/24 open and about 6.7% from the 10/21 open. On 10/29, BTC broke below the former 79,200–79,500 support on heavy volume; on 10/30, it retested 76,500 before moving sideways on declining volume. First support is at 76,500–76,650, followed by 77,910; resistance levels are 78,800 → 79,700–80,000 → 81,823–81,971. Drivers: the Fed held rates at 3.75%–4.00% (10–2), a hawkish stance; spot ETFs recorded about $424 million in net inflows over roughly three days (mainly IBIT), but prices remained weak. An exchange security incident and liquidations worth around $1.5 billion also amplified volatility. For observation only; not investment advice.
More Selected On-Chain Cycle Metrics
Portal
https://welinkbtc-onchainmain.xyz/
Understand market cycles like a professional analyst
$BTC
# On-chain Metrics Analysis
BTC: Realized Cap HODL Waves
Realized Cap HODL Waves weight each Bitcoin by its cost basis—the price at which it last moved on-chain—and then group it by age since last movement. Unlike a simple coin-count breakdown, this metric offers a clearer view of how cost basis shifts between short-term traders and long-term holders.
Current Status · Deeply Locked · Historical Highs
The cost-basis-weighted share of coins held for more than 3 months is 84.60%, with a 7-day average of 84.74% and a 30-day average of 85.38%. This is about 0.60% above the 84% deep-lock reference line (on-chain date: 2026-10-29). The 7-day change is about -0.40%, indicating a short-term decline and renewed activity among older coins. The peak for this cycle was about 88.10% (2026-07-26), while the historical peak was about 89.85% (2022-10-24).
Historical context: High levels of lock-up are commonly seen in the later stages of accumulation after heavy turnover during bear markets, but they do not guarantee an immediate price rise. This metric describes the supply-side state and should still be assessed alongside spot demand, global liquidity, and realized profit and loss. When the share falls rapidly, pay closer attention to distribution of older coins and turnover. For cycle research only; not investment advice.
【BTC Short-Term Snapshot · As of 10/31 00:05 Beijing Time】
Spot price is about 77,462 USDT (Binance), down about 5.33% over 24 hours, with a range of 76,500–81,971. It is down about 4.6% from the 10/24 open and about 6.7% from the 10/21 open. On 10/29, BTC broke below the former 79,200–79,500 support on heavy volume; on 10/30, it retested 76,500 before moving sideways on declining volume. First support is at 76,500–76,650, followed by 77,910; resistance levels are 78,800 → 79,700–80,000 → 81,823–81,971. Drivers: the Fed held rates at 3.75%–4.00% (10–2), a hawkish stance; spot ETFs recorded about $424 million in net inflows over roughly three days (mainly IBIT), but prices remained weak. An exchange security incident and liquidations worth around $1.5 billion also amplified volatility. For observation only; not investment advice.
More Selected On-Chain Cycle Metrics
Portal
https://welinkbtc-onchainmain.xyz/
Understand market cycles like a professional analyst
$BTC
BTC: Realized Cap HODL Waves
Realized Cap HODL Waves weight each Bitcoin by its cost basis—the price at which it last moved on-chain—and then group it by age since last movement. Unlike a simple coin-count breakdown, this metric offers a clearer view of how cost basis shifts between short-term traders and long-term holders.
Current Status · Deeply Locked · Historical Highs
The cost-basis-weighted share of coins held for more than 3 months is 84.60%, with a 7-day average of 84.74% and a 30-day average of 85.38%. This is about 0.60% above the 84% deep-lock reference line (on-chain date: 2026-10-29). The 7-day change is about -0.40%, indicating a short-term decline and renewed activity among older coins. The peak for this cycle was about 88.10% (2026-07-26), while the historical peak was about 89.85% (2022-10-24).
Historical context: High levels of lock-up are commonly seen in the later stages of accumulation after heavy turnover during bear markets, but they do not guarantee an immediate price rise. This metric describes the supply-side state and should still be assessed alongside spot demand, global liquidity, and realized profit and loss. When the share falls rapidly, pay closer attention to distribution of older coins and turnover. For cycle research only; not investment advice.
【BTC Short-Term Snapshot · As of 10/31 00:05 Beijing Time】
Spot price is about 77,462 USDT (Binance), down about 5.33% over 24 hours, with a range of 76,500–81,971. It is down about 4.6% from the 10/24 open and about 6.7% from the 10/21 open. On 10/29, BTC broke below the former 79,200–79,500 support on heavy volume; on 10/30, it retested 76,500 before moving sideways on declining volume. First support is at 76,500–76,650, followed by 77,910; resistance levels are 78,800 → 79,700–80,000 → 81,823–81,971. Drivers: the Fed held rates at 3.75%–4.00% (10–2), a hawkish stance; spot ETFs recorded about $424 million in net inflows over roughly three days (mainly IBIT), but prices remained weak. An exchange security incident and liquidations worth around $1.5 billion also amplified volatility. For observation only; not investment advice.
More Selected On-Chain Cycle Metrics
Portal
https://welinkbtc-onchainmain.xyz/
Understand market cycles like a professional analyst
$BTC
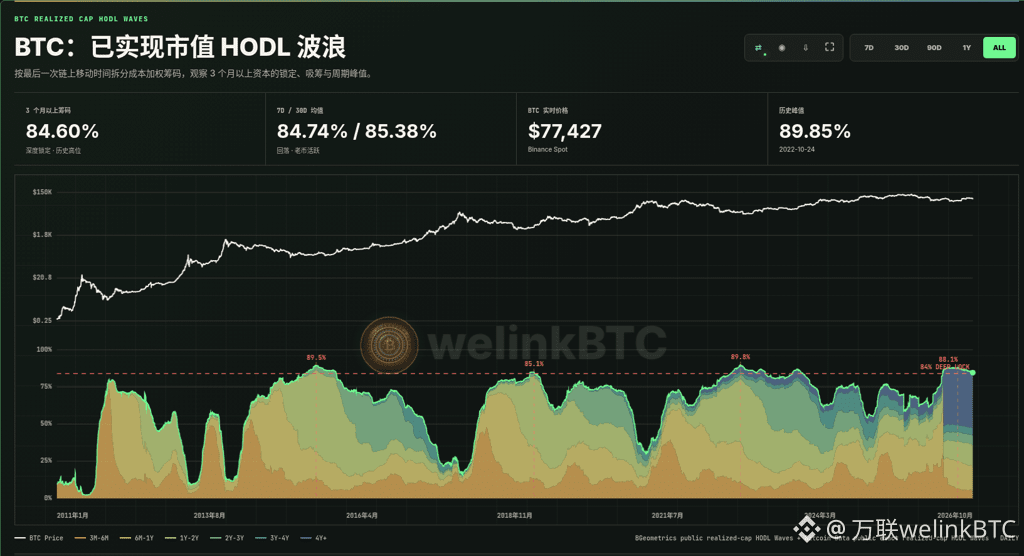
3
1.8k
·
--
From Mt. Gox to Binance: 13 years,
exchanges hacked every year
Does blockchain really need decentralization?
2014: Mt. Gox: approximately $470 million
2015: Bitstamp: approximately $5.1 million
2016: Bitfinex: $72 million
2017: NiceHash: approximately $64 million
2018: Coincheck: $534 million
2018: BitGrail: $170 million
2019: Binance: $40 million
2020: KuCoin: $281 million
2021: BitMart: $196 million 2022:
FTX: $415 million 2023:
Poloniex: approximately $126 million 2023:
CoinEx: approximately $54 million 2024:
DMM Bitcoin: approximately $305 million
2024: WazirX: $235 million
2025: Phemex: approximately $73–85 million
2025: Bybit: $1.46 billion 2025:
Upbit: approximately $30–38.5 million
2025: BtcTurk: approximately $48 million
2026: Coldcard: approximately $116 million
2026: Bitget: approximately $352 million
2026: Binance: approximately $6.2 billion
So who will be next?
Perhaps blockchain needs decentralization,
but funds don't.
#加密杠杆头寸24小时清算15亿美元
$BNB
{future}(BNBUSDT)
From Mt. Gox to Binance: 13 years,
exchanges hacked every year
Does blockchain really need decentralization?
2014: Mt. Gox: approximately $470 million
2015: Bitstamp: approximately $5.1 million
2016: Bitfinex: $72 million
2017: NiceHash: approximately $64 million
2018: Coincheck: $534 million
2018: BitGrail: $170 million
2019: Binance: $40 million
2020: KuCoin: $281 million
2021: BitMart: $196 million 2022:
FTX: $415 million 2023:
Poloniex: approximately $126 million 2023:
CoinEx: approximately $54 million 2024:
DMM Bitcoin: approximately $305 million
2024: WazirX: $235 million
2025: Phemex: approximately $73–85 million
2025: Bybit: $1.46 billion 2025:
Upbit: approximately $30–38.5 million
2025: BtcTurk: approximately $48 million
2026: Coldcard: approximately $116 million
2026: Bitget: approximately $352 million
2026: Binance: approximately $6.2 billion
So who will be next?
Perhaps blockchain needs decentralization,
but funds don't.
#加密杠杆头寸24小时清算15亿美元
$BNB
exchanges hacked every year
Does blockchain really need decentralization?
2014: Mt. Gox: approximately $470 million
2015: Bitstamp: approximately $5.1 million
2016: Bitfinex: $72 million
2017: NiceHash: approximately $64 million
2018: Coincheck: $534 million
2018: BitGrail: $170 million
2019: Binance: $40 million
2020: KuCoin: $281 million
2021: BitMart: $196 million 2022:
FTX: $415 million 2023:
Poloniex: approximately $126 million 2023:
CoinEx: approximately $54 million 2024:
DMM Bitcoin: approximately $305 million
2024: WazirX: $235 million
2025: Phemex: approximately $73–85 million
2025: Bybit: $1.46 billion 2025:
Upbit: approximately $30–38.5 million
2025: BtcTurk: approximately $48 million
2026: Coldcard: approximately $116 million
2026: Bitget: approximately $352 million
2026: Binance: approximately $6.2 billion
So who will be next?
Perhaps blockchain needs decentralization,
but funds don't.
#加密杠杆头寸24小时清算15亿美元
$BNB
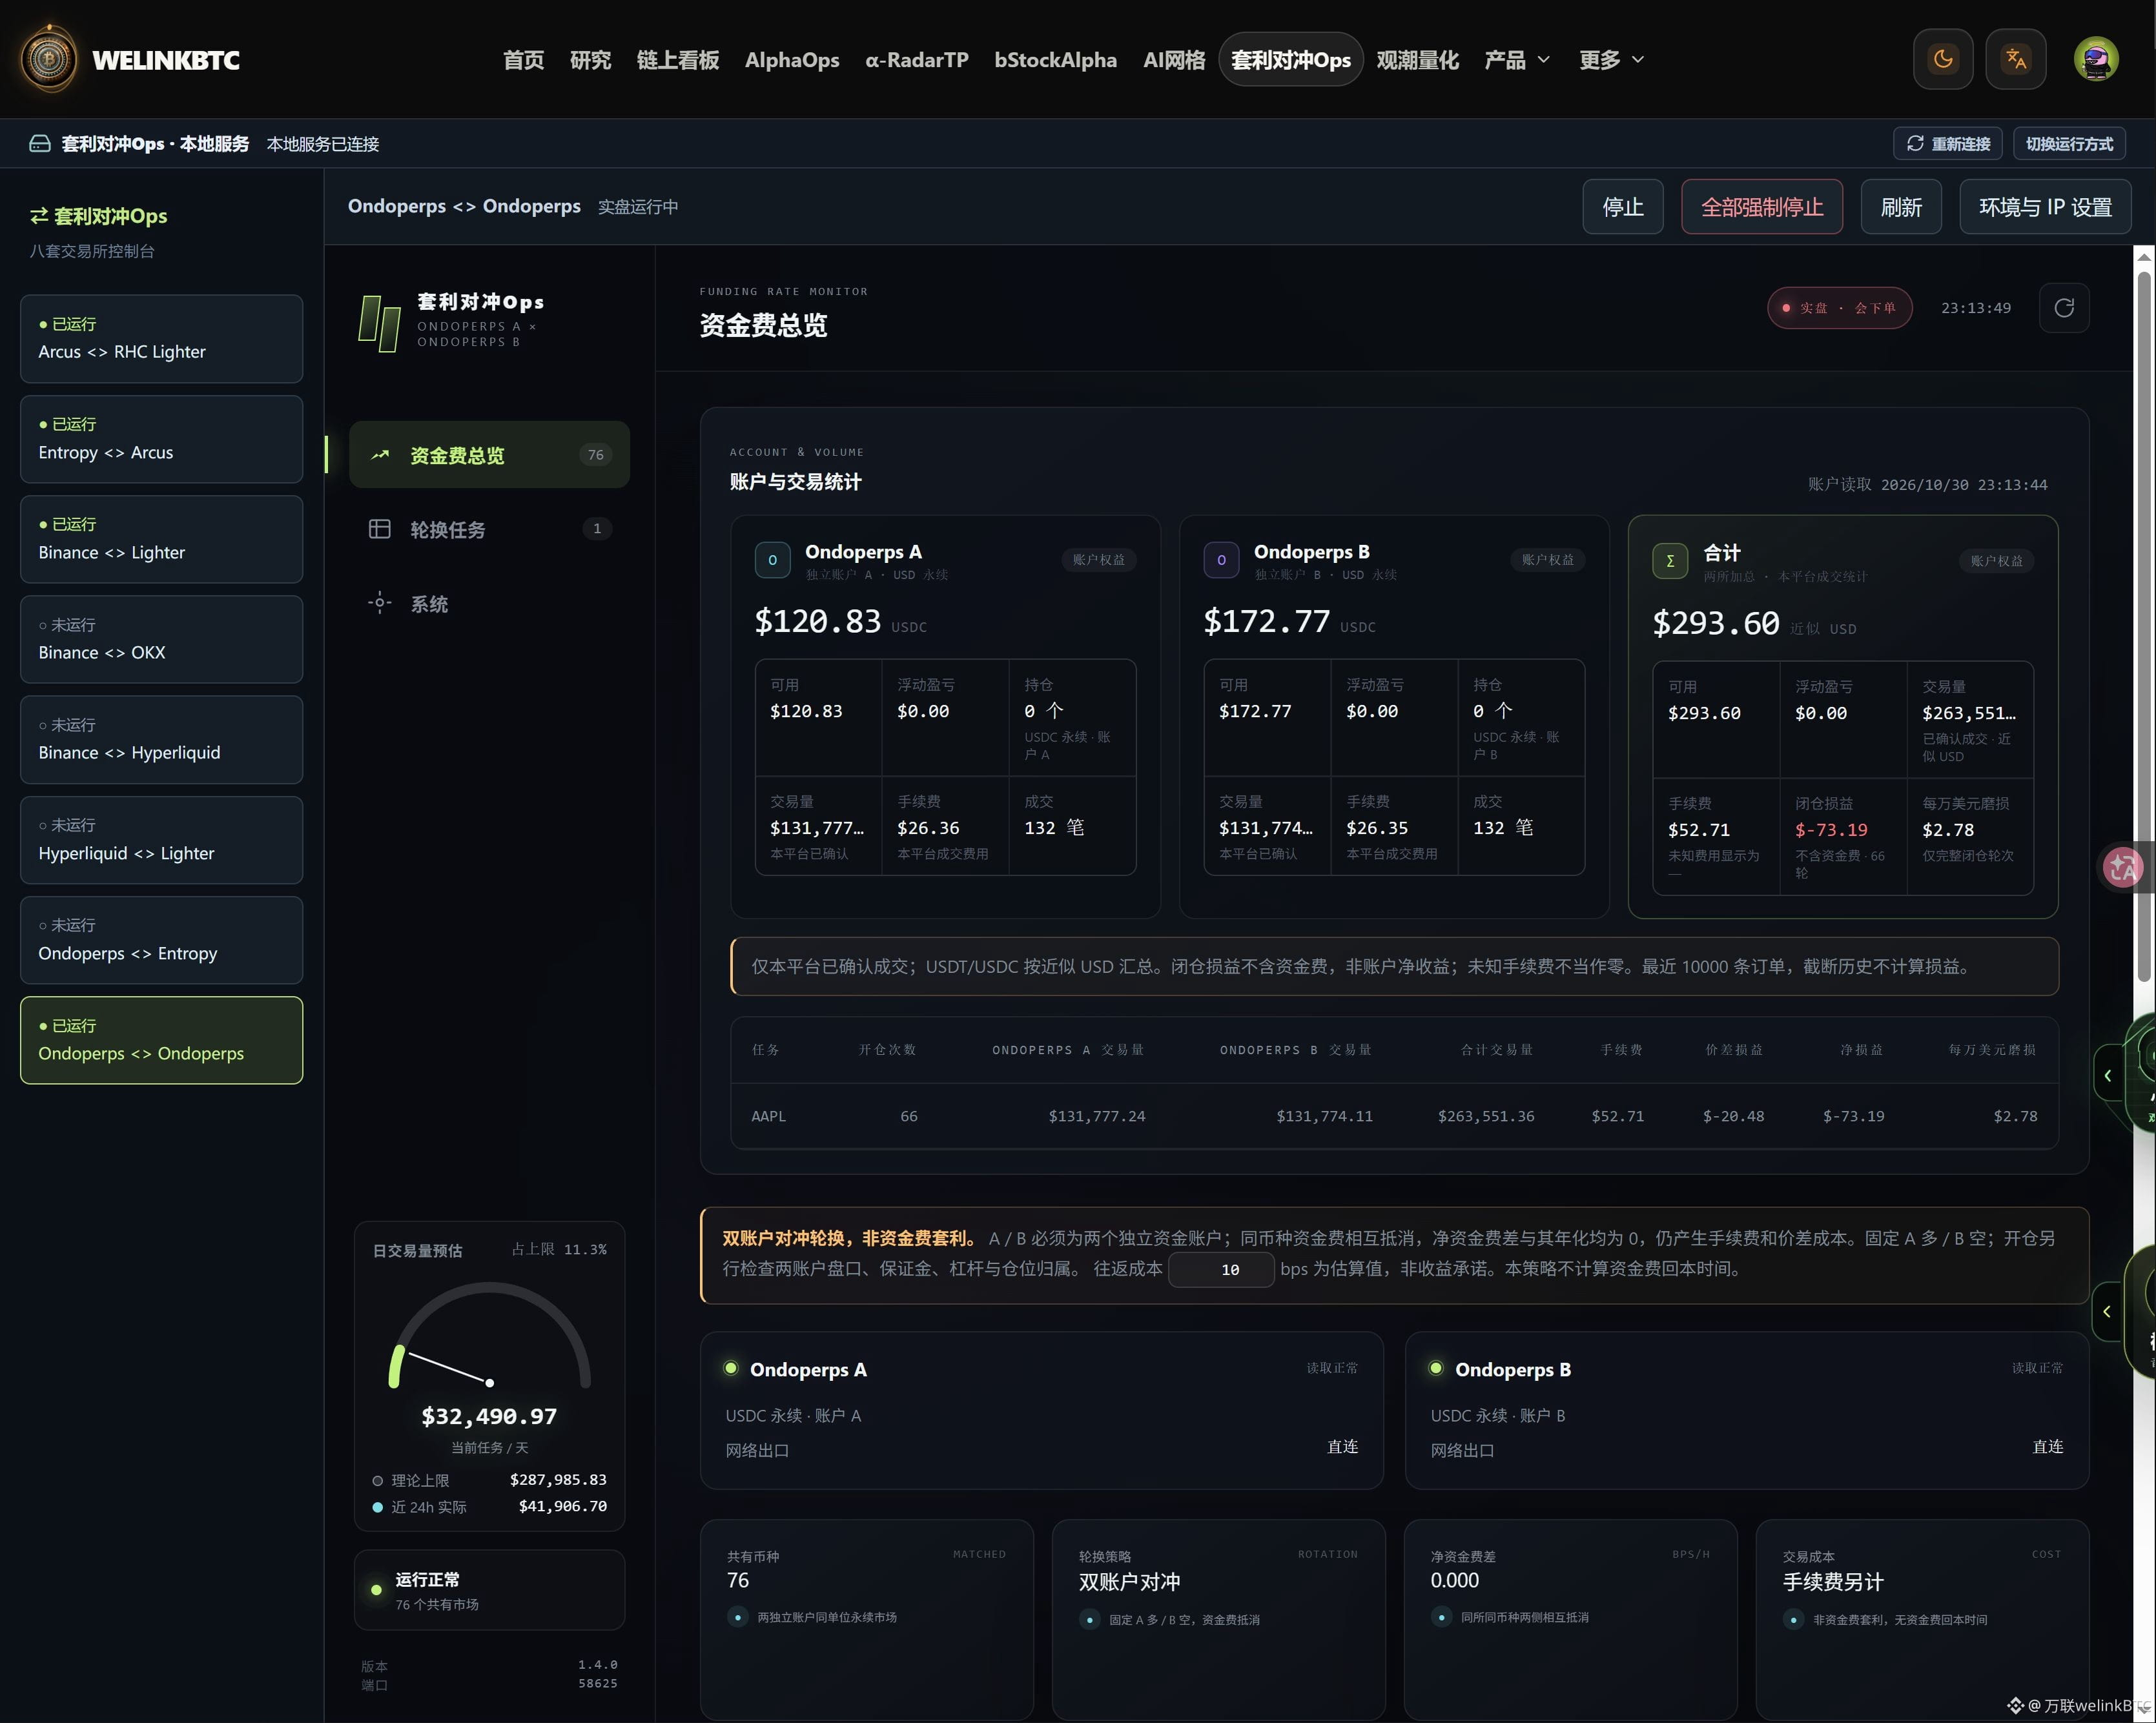
2
1.7k
Log in to explore more content
Join global crypto users on Binance Square
⚡️ Get latest and useful information about crypto.
💬 Trusted by the world’s largest crypto exchange.
👍 Discover real insights from verified creators.
Email / Phone number
Trending Topics
BinanceWithdrawalScamWarning
17,770 views
459 Discussing
Binance Warns Users of Withdrawal Scams as Services Resume: It Will Never Charge Fees, Sell Queue Spots or Ask You to Move Funds to a “Vault”
Binance News
·10 Likes
·5.6k views
USMidtermElections
570,264 views
3,023 Discussing
USOctoberNFP-AreRateCutsStillPossible
25,855 views
418 Discussing