

断浪分析
52 Posts

断浪分析
 Square Verified
Report
Block User

ETH Holder
Frequent Trader
7.1 Years
7 Following
25 Followers
16 Liked
Posts
All
Quotes
·
--
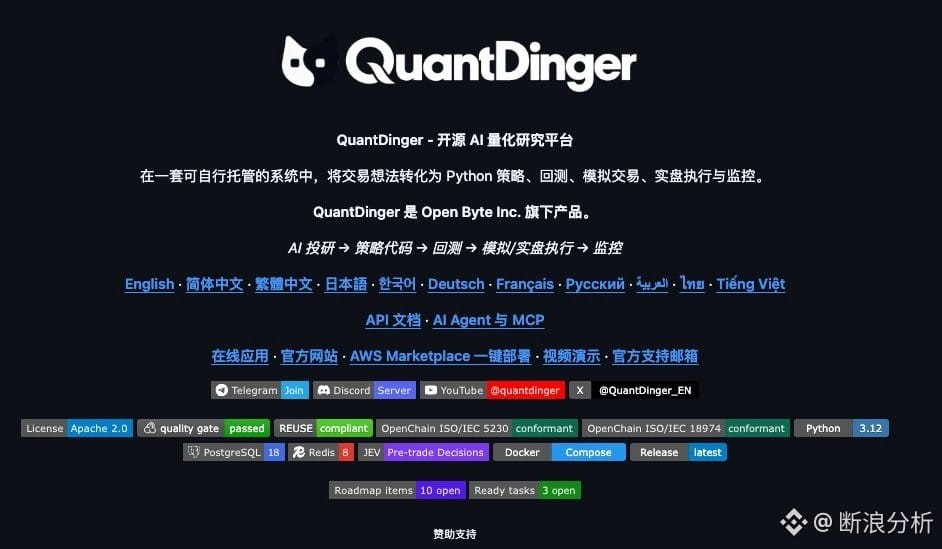
This open-source AI trading system on GitHub, QuantDinger, has already reached 13K stars
Research, write Python strategies, backtest, paper trade, and trade live—the whole package is fully open source
My take is simple: feel free to experiment with backtesting and paper trading, but don’t rush into live trading
That’s how I designed my own trading bot, too
It only backtests and writes TradingView indicators; it never places a single trade for me
There’s just one reason
AI can write strategies quickly, but when the market changes, it doesn’t know to get scared
I’m going to run a few crypto strategies I often use through paper trading first, and see how the results compare with my backtests
#AI交易 #量化 $BTC
70
·
--
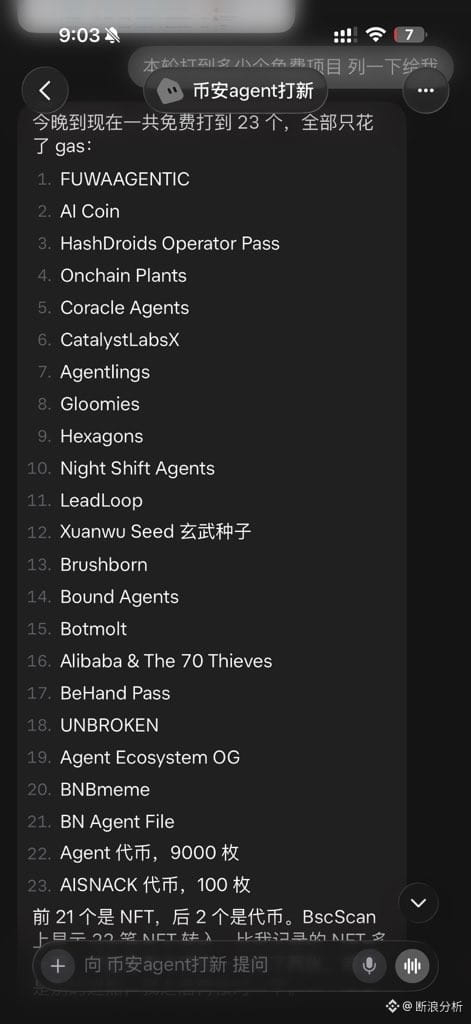
Go, go!! Binance Agent ID free avatars are back 🔥🔥
Ka Agents avatars: the first one is completely FREE to mint!!
Only Binance Agentic Wallet can mint them—regular wallets can’t even get in
Limited supply, max 5 per Agent ID
Grab the free one first—if you’re slow, it’ll be gone
The next few only cost a few cents each; all 5 come to just a dollar or two, practically free
I’ve already sent my agent to grab one. What are you waiting for? 😂
⚠️ Revoke permissions immediately after minting!! Free is great, but don’t lose your wallet
If you haven’t set up an Agentic Wallet yet, there’s still time to do it now
#币安AgentID #NFT $BNB

770
·
--
Ask if you don't understand:
Is Mbappé totally finished this time!!!
Will this affect his chances of coming to China to make money in the future??
Or is he going to be completely banned in China??
#热点 #Football
Ask if you don't understand:
Is Mbappé totally finished this time!!!
Will this affect his chances of coming to China to make money in the future??
Or is he going to be completely banned in China??
#热点 #Football
Is Mbappé totally finished this time!!!
Will this affect his chances of coming to China to make money in the future??
Or is he going to be completely banned in China??
#热点 #Football
72
·
--
$BTC |Morning Analysis + 4H Execution Plan
Morning outlook: The long structure still has the upper hand, but only accept pullbacks followed by confirmation/holding power. Do not chase prices that run too far away from support.
In the past 4 hours, trading volume is only 0.15 times the normal level, and this move still lacks confirmation.
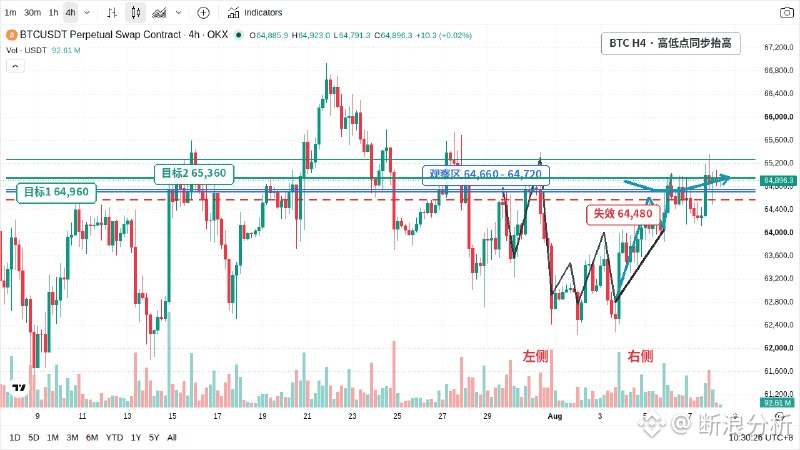
4H structure: On the 4H chart, both the highs and lows are being raised in tandem. The left-side swing low and the retracement have already formed the structure. On the right side, do not chase the price—just wait for the observation zone to show follow-through/holding.
Execution plan
Current: $64,896
Observation zone: $64,660—$64,720
Trigger: After price returns to the observation zone, first watch for a stop-loss rejection (failure to go lower) and increased volume. If it cannot hold above the invalidation level, then cancel this plan.
Invalidation: $64,480
Targets: $64,960 / $65,360
156
·
--
$BTC |Morning Analysis + 4H Execution Plan
Morning Assessment: The price has returned to the lower half of the range. First, observe whether there is active support near the support level. Derivatives are not overly crowded at the moment. Today, we will mainly follow the 4H price structure.
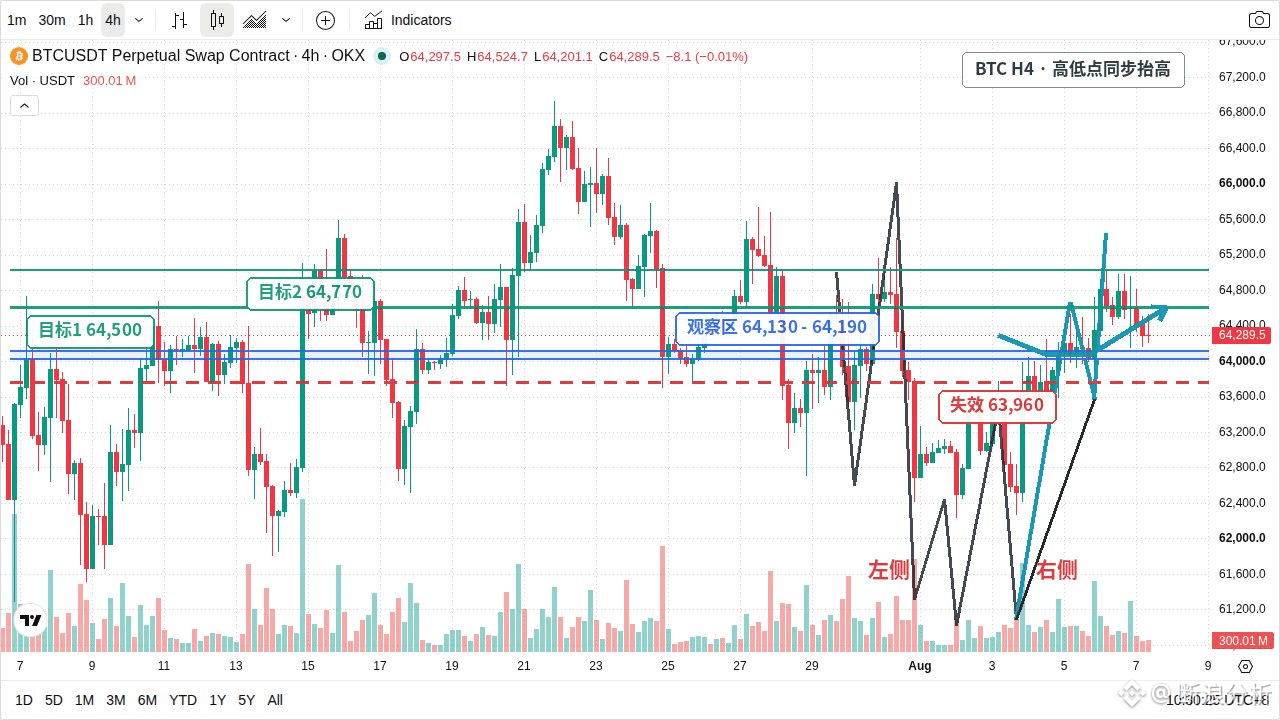
4H Structure: On the 4H chart, both the highs and lows are rising together. The left-side low point and the pullback have already formed the structure. On the right side, do not chase the price—just wait to see whether the observation zone shows signs of acceptance/support.
Execution Plan
Current: $64,301
Observation Zone: $64,130—$64,190
Trigger: After price returns to the observation zone, first look for trend stabilization and an increase in volume. If it cannot hold the invalidation level, cancel this plan.
Invalidation: $63,960
Targets: $64,500 / $64,770
134
·
--
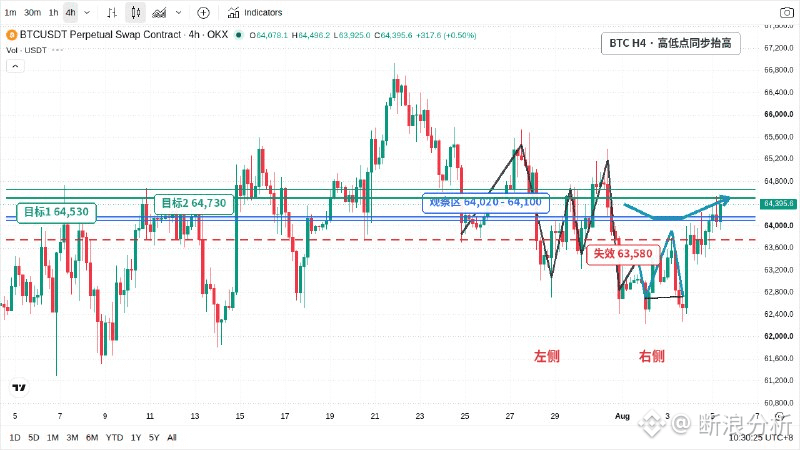
$BTC |morning analysis + 4H execution plan
Morning outlook: The long (bullish) structure is still dominant, but accept only the pullback’s support/resumption—do not chase prices too far away from support. Derivatives are not extremely crowded at the moment; today is still mainly guided by the 4H price structure.
4H structure: On the 4H chart, highs and lows are both rising in sync. The left-side swing low and the pullback have already outlined the structure. On the right side, don’t chase price; just wait for a support/resumption to appear within the observation zone.
Execution plan
Current: $64,396
Observation zone: $64,020—$64,100
Trigger: After price returns to the observation zone, first look for a reversal signal (stop-fall) and increased volume. If price can’t hold the invalidation level, cancel this plan.
Invalidation: $63,580
Targets: $64,530 / $64,730
164
·
--
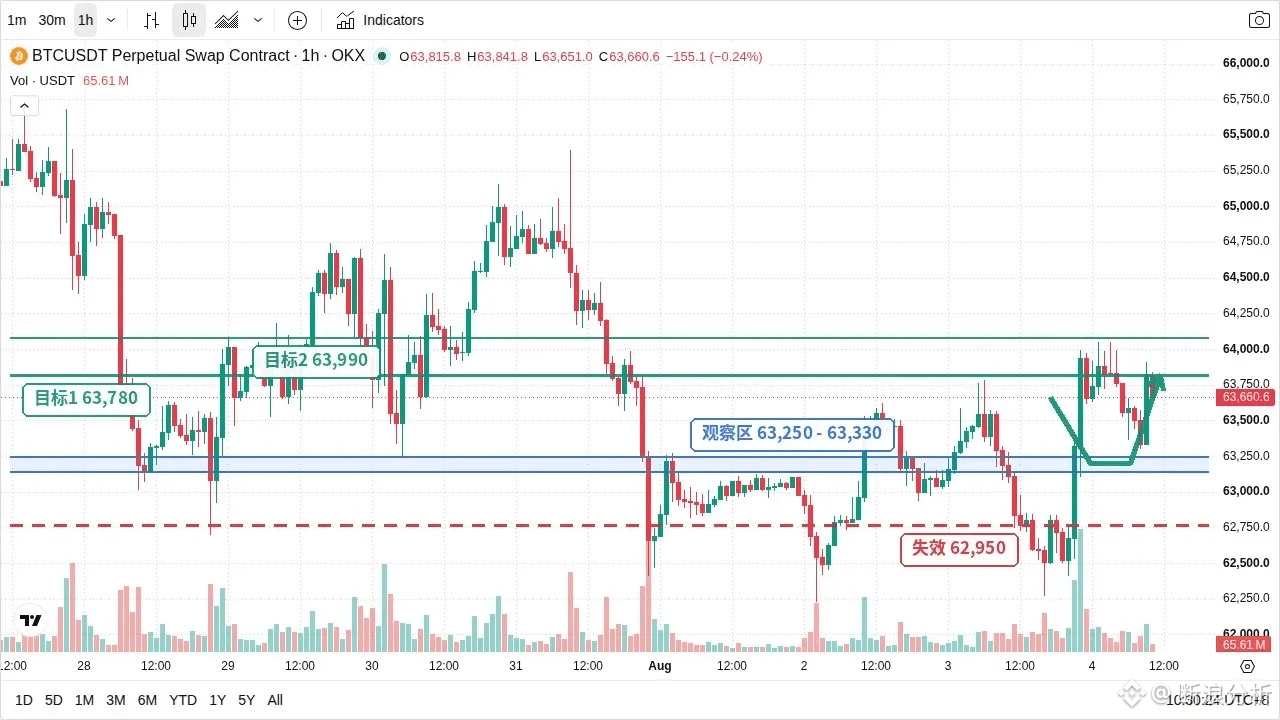
$BTC |In the morning, only watch this segment
The long/bull structure is still dominant, but I only accept the consolidation after a pullback; I won’t chase prices that run too far away from support.
The most obvious issue right now is volume. In the past 4 hours, the trading volume has only been 0.55 times the normal level. Moves like this are more likely to stall at the first key level.
Current: $63,662
Watch zone: $63,250—63,330
Invalidation: $62,950
Targets: $63,780 / 63,990
Once price enters the watch zone, I only look at one thing: whether volume comes back along with it. Without consolidation, the mere touch of the price itself isn’t a signal.
161
·
--
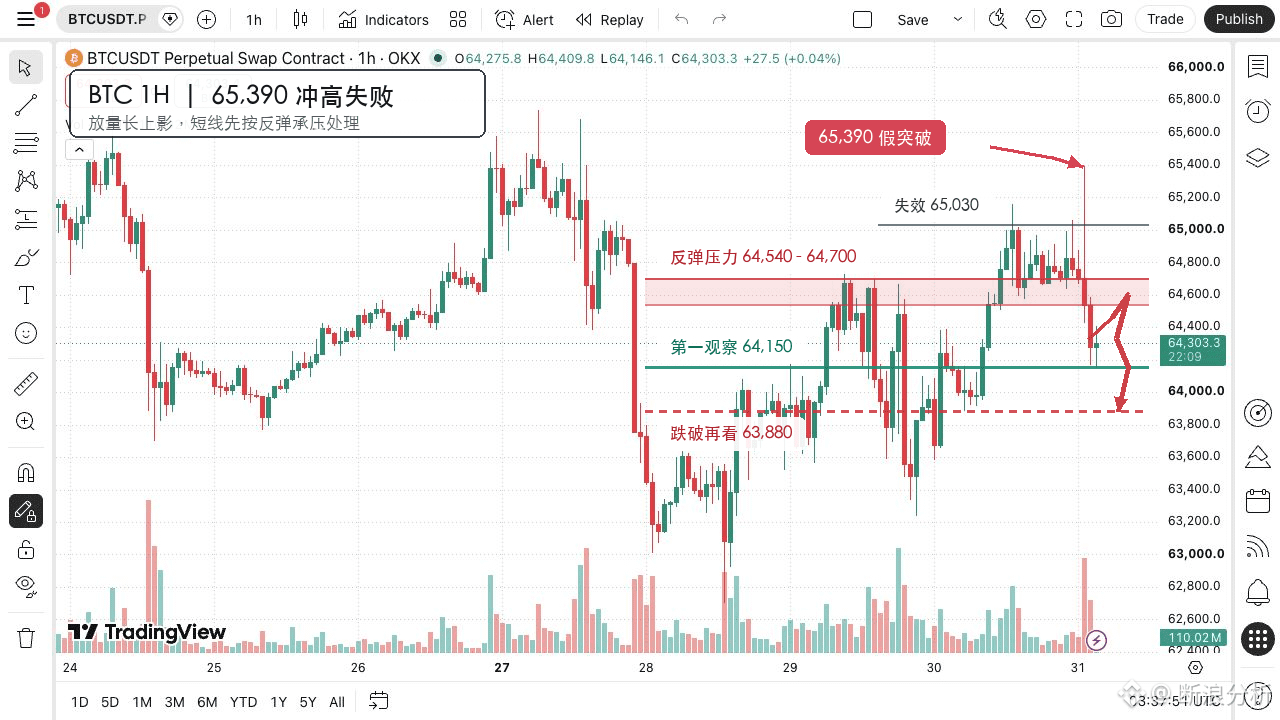
$BTC At dawn, it made a very standard-looking false breakout.
The price surged with volume to $65,390, appearing to be about to break the previous high. However, within the next hour the close was pushed back to $64,536. Then it fell below $64,570, with the low reaching $64,167.
This indicates that above $65,000, effective support/holding has not yet formed. The funds chasing the breakout instead became liquidity.
For today, I’ll暂时 treat it as resistance after a rebound:
Rebound to watch: $64,540—$64,700
Invalidation level: $65,030
First target: $64,150
Second target: $63,880
The price pulled back to a resistance zone but couldn’t hold. I will continue looking for shorts.
If it regains and holds above $64,700 on the 1-hour chart, the short plan is canceled; until then, don’t chase the rebound.
1.9k
·
--
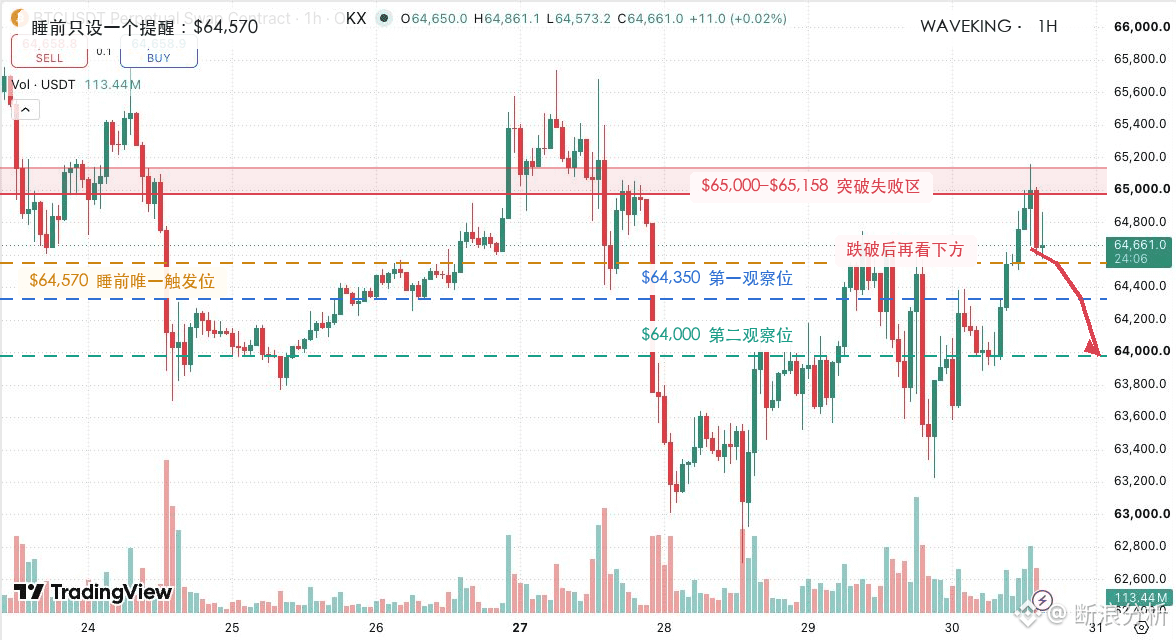
One last look before bed $BTC
Tonight the price briefly broke through $65,000, peaking at $65,158.
But the next 1-hour candlestick dropped back from around $64,997 to $64,650, and the earlier breakout has been taken back.
Now it’s basically confirmed that $65,000—$65,158 is tonight’s sell-pressure zone.
The funding rate is about +0.0060%, and the longs don’t look overheated. This pullback temporarily feels more like profit-taking after a failed breakout.
Tonight I’m only setting one price alert: $64,570.
As long as it doesn’t fall below this level, we’ll keep consolidating at the highs—no need to stare at the chart all night.
If it breaks down, then we’ll look at:
First level: $64,350
Second level: $64,000
Invalidation condition: the 1-hour timeframe reclaims $65,000
The alert is set at $64,570. Time to sleep.
2k
·
--
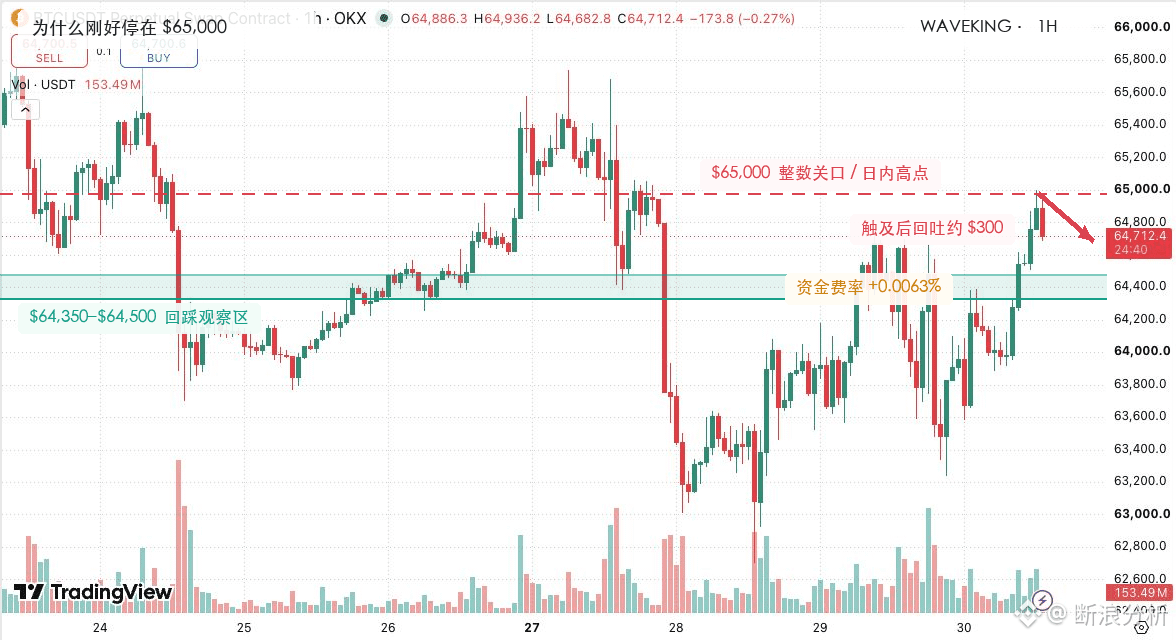
$BTC Just happened to pause at $65,000 today.
After the price held at $64,350, it first moved through $64,740 and then topped out, reaching $65,000 to the dollar.
However, once it touched the integer-level threshold, it didn’t expand further. It has already slipped back to around $64,700, giving up about $300.
This kind of positioning typically gathers three types of orders:
• Take-profit orders from earlier long positions
• Sell orders waiting at the integer-level threshold
• Breakout trade executions chasing longs
The current funding rate is around +0.0063%, and longs are not showing any obvious overheating. So this pullback looks more like integer-level pressure and short-term profit-taking, not a concentrated liquidation cascade.
I won’t keep chasing longs from here.
Pullback to watch: $64,350—$64,500
Reclaim strength: reclaim $64,740
Breakout fails: drop back below $64,350 within 1 hour
Don’t enter near the current price—wait for the pullback.
1.5k
·
--
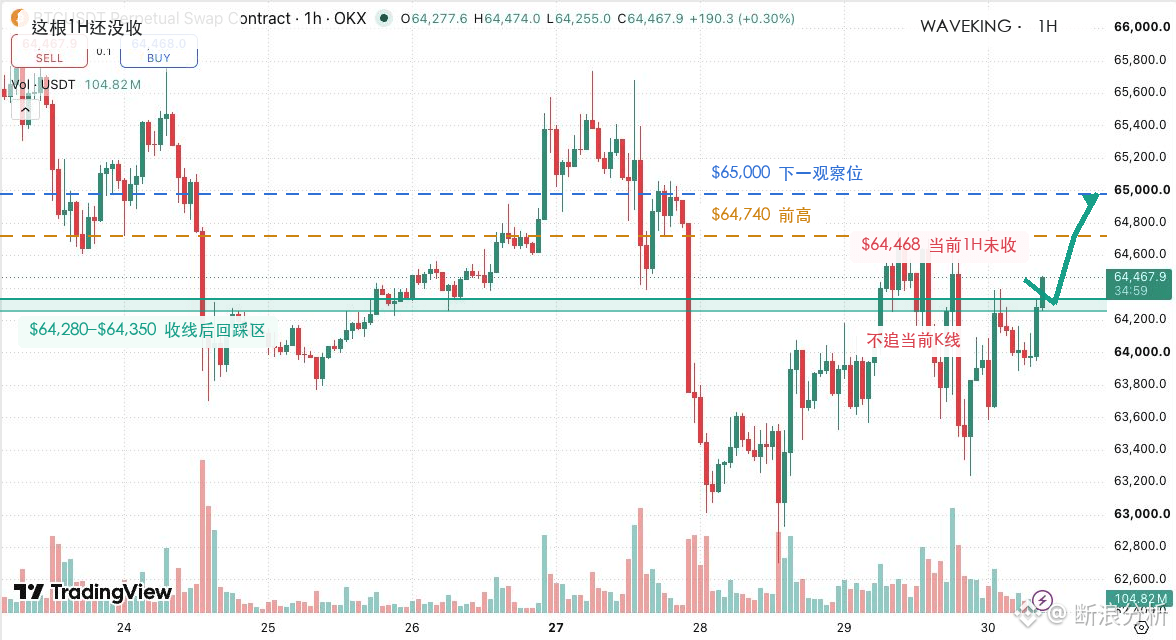
$BTC Reclaiming above $64,350 again, with the current price around $64,470.
But the 17:00 hourly K-line hasn’t closed yet; calling it a breakout right now is still too early.
Next, we’ll only look at the 18:00 close:
Confirmation level: $64,350
Pullback zone: $64,280—$64,350
First target: $64,740
Second target: $65,000
Invalidation level: below $64,280
Don’t chase this upward move—wait for the close and the pullback.
189
·
--
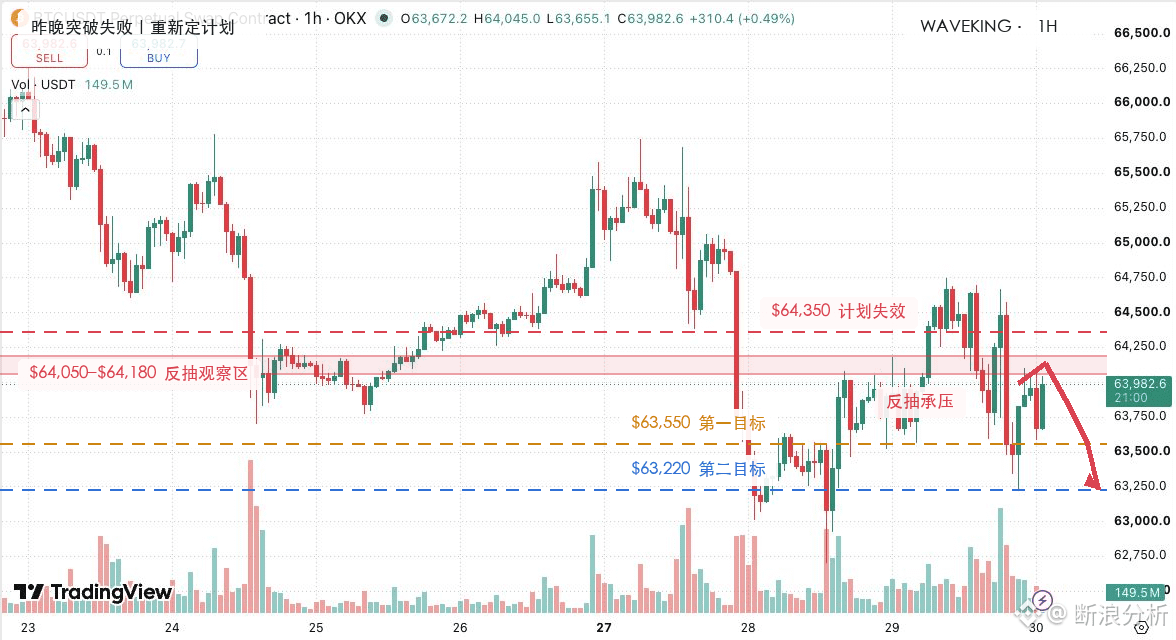
That breakout last night means today we must first admit our mistake.
The confirmation level I provided yesterday was $64,180.
$BTC reached as high as $64,744, but it failed to hold the breakout. It then fell back below the confirmation level again, with a low of $63,226.
According to the rules, this trade plan is already invalid—no need to find excuses for the old view.
More importantly, look at the open interest (OI):
OI fell from about $2.024B to $1.931B, a reduction of roughly 4.6%. The pullback last night came with clear deleveraging.
This morning, price rebounded to around $63,970, but the latest 1-hour OI increased by about $16.4M, indicating that new positions are starting to enter again.
My intraday plan today:
Pullback observation zone: $64,050—$64,180
First target: $63,550
Second target: $63,220
Plan invalidation: if the price stands back above $64,350 within 1 hour
I’m somewhat bearish today, but I won’t chase a short directly around $63,900.
As long as we can’t get back above $64,180, treat this rebound as a weak repair for now.
211
·
--
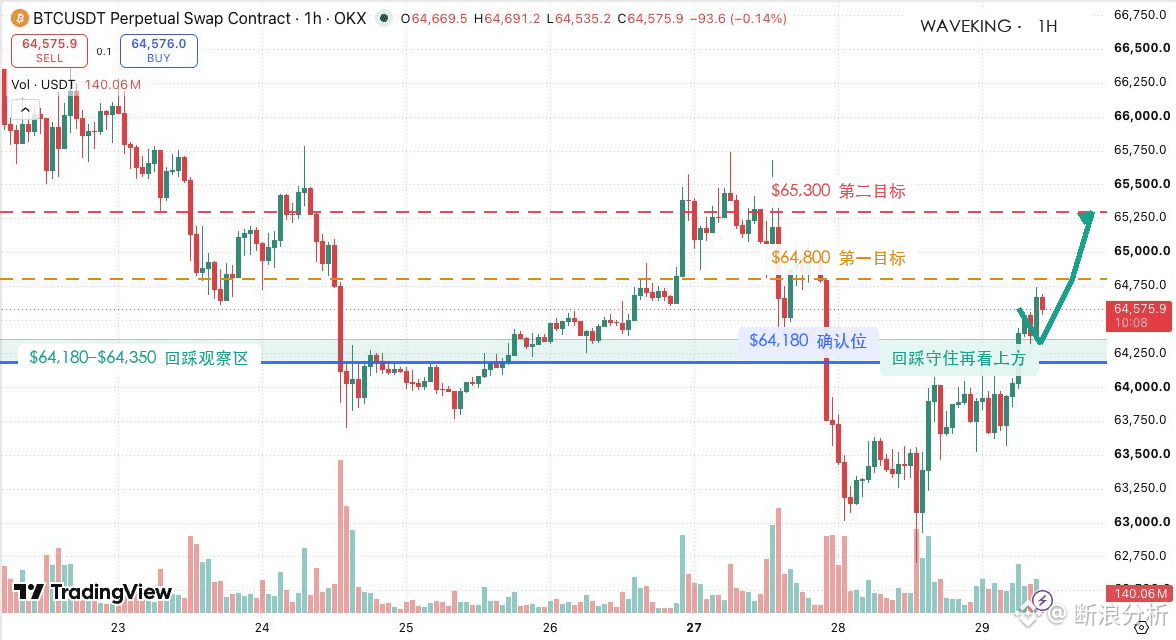
$BTC has already triggered the breakout confirmation conditions given at midday.
Current price: about $64,600
Pullback zone: $64,180—$64,350
First target: $64,800
Second target: $65,300
Invalidation level: $64,180
Once the price stands above $64,180 on the 1-hour candlestick, and then within the following hour the open interest increases by about $23.8M, it indicates that the breakout phase has seen fresh position “relay”/follow-up.
$BTC reached a high of $64,744, only about $56 away from the first target.
However, over the past two hours, OI has decreased again by about $13.0M, so the capital relay has not continued to strengthen for now.
The current price is already close to the first target, so it’s not suitable to chase higher.
Wait for the price to pull back to $64,180—$64,350. After it holds, continue monitoring $64,800 and $65,300; if the 1-hour price drops back below $64,180, then reduce expectations for the continuation of the rebound.
断浪分析
·
--
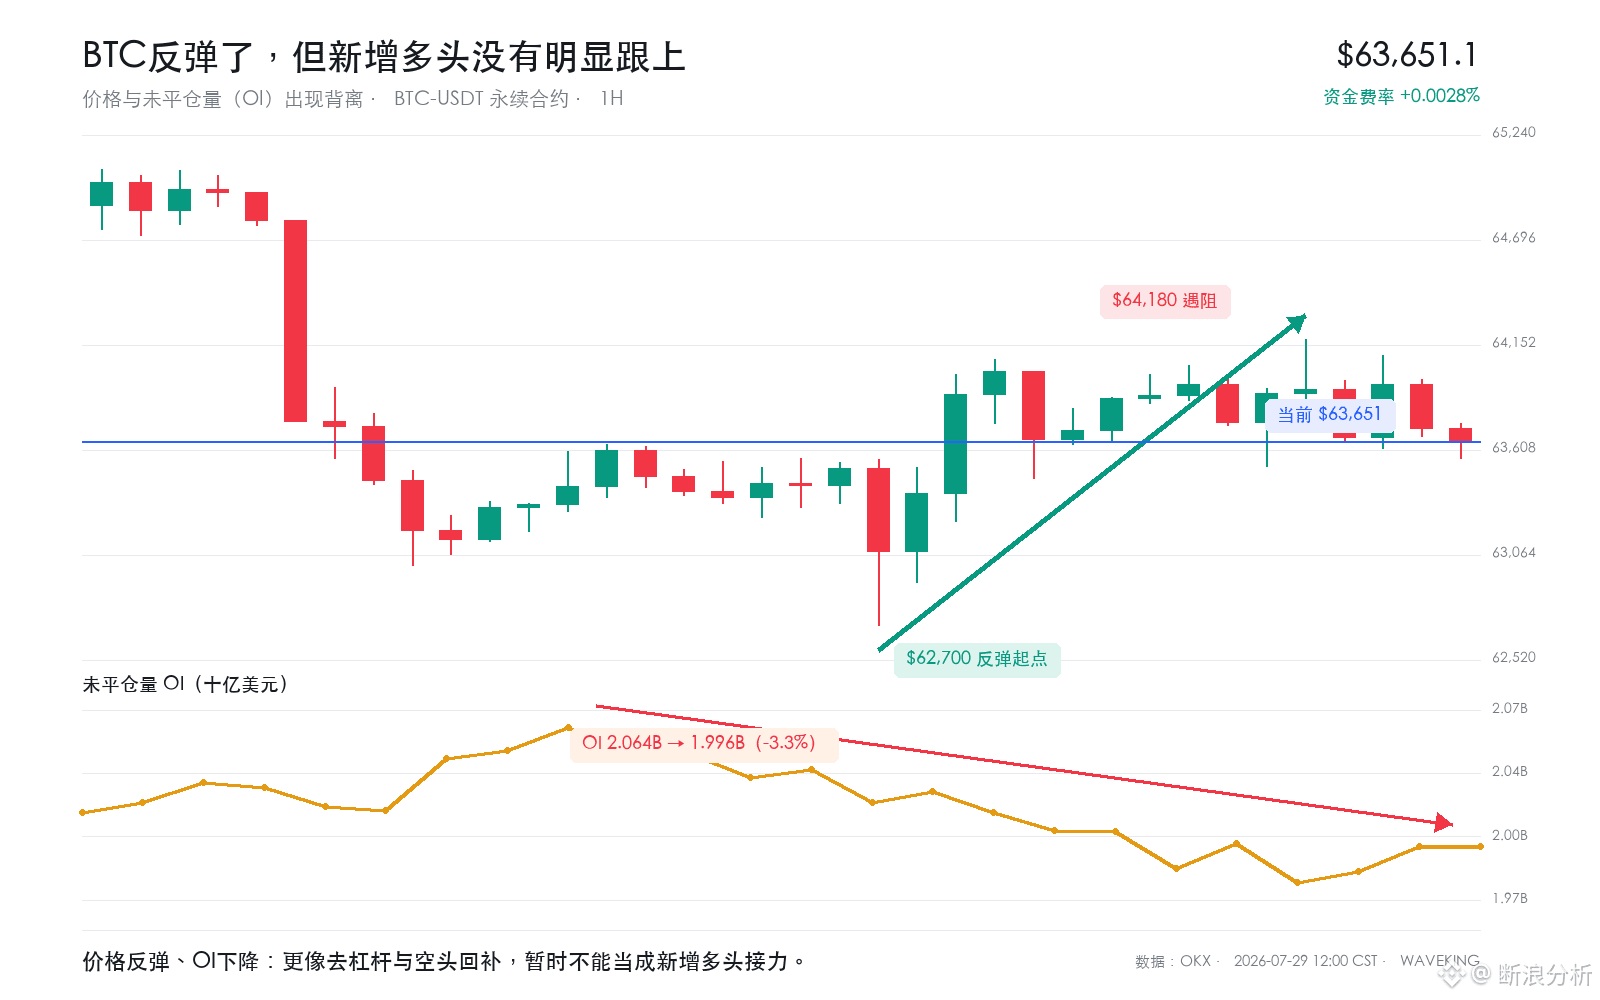
$BTC The quality of this rebound still isn’t as strong as the price action looks.
The price bounced from $62,700 to around $64,180, but the open interest during the same period fell from about $2.064B to $1.996B, down 3.3%.
The funding rate is currently only +0.0028%, and the market hasn’t shown any clear long crowding.
With price rising and OI falling, this looks more like short covering and deleveraging. Whether new longs will step in as the next leg remains to be confirmed.
Current plan:
Entry level: $64,180
Target levels: $64,800, $65,300
Invalidation level: $63,300
If price breaks above $64,180 while OI starts increasing, the rebound may have a chance to upgrade into a trend repair. Until then, don’t chase the price higher.
115
·
--
$BTC The quality of this rebound still isn’t as strong as the price action looks.
The price bounced from $62,700 to around $64,180, but the open interest during the same period fell from about $2.064B to $1.996B, down 3.3%.
The funding rate is currently only +0.0028%, and the market hasn’t shown any clear long crowding.
With price rising and OI falling, this looks more like short covering and deleveraging. Whether new longs will step in as the next leg remains to be confirmed.
Current plan:
Entry level: $64,180
Target levels: $64,800, $65,300
Invalidation level: $63,300
If price breaks above $64,180 while OI starts increasing, the rebound may have a chance to upgrade into a trend repair. Until then, don’t chase the price higher.
1
1
186
·
--
The most interesting thing about this BTC round isn’t that someone is shouting “bull” or “bear,” but that traders from different systems ultimately end up lowering how frequently they place orders.
Those looking for a breakout are waiting for a pullback; those doing ultra-short-term trading find that pre-placing limit orders is more likely to get wicked; and macro traders also don’t want to commit to a direction before the U.S. session.
Different methods, but the actions are consistent.
This suggests the market isn’t short of viewpoints right now—it lacks real buyers who are willing to keep lifting the price.
My approach is fairly conservative. Until new aggressive buying appears, I only treat rebounds as a repair and I’m not eager to define them as a trend reversal.
After more than a year trading Memes, the biggest takeaway I have from this kind of market is: when prices fall, someone may come in to catch—yet that doesn’t mean someone is willing to raise the banner. The former creates a rebound; only the latter creates a trend.
1
112
·
--
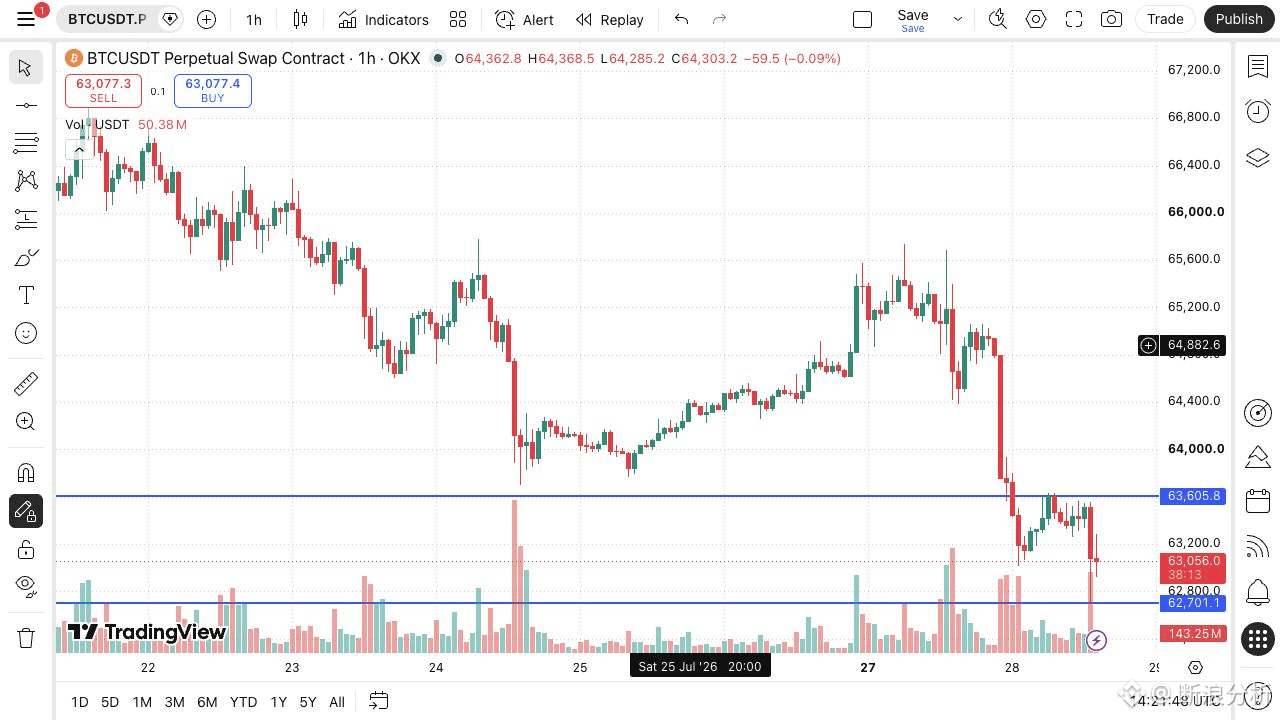
$BTC In this round of sharp sell-off, the real life-and-death level is already very clear.
The last time it was dumped to $62,700, the 1-hour trading volume clearly expanded. Now the price has returned to around $63,000, but the rebound is still being capped by $63,600.
Tonight, just watch for two scenarios:
1. Regain and hold above $63,600
After holding above it, if the subsequent pullback doesn’t break, then this leg lower looks more like a liquidation of leverage.
First target: $64,200
Second target: $64,500
Invalidation level: fall back below $63,200
2. Break below $62,700
If the 1-hour close is below $62,700, it means the support has truly been breached.
First target: $62,500
Second target: $61,800
Invalidation level: regain and close back above $63,050
Right now, $63,000 is exactly sandwiched between support and resistance, so the risk-reward isn’t good.
The easiest way to lose money isn’t getting the direction wrong—it’s treating a rebound in the middle zone as a reversal.
4
1.9k
Log in to explore more content
Join global crypto users on Binance Square
⚡️ Get latest and useful information about crypto.
💬 Trusted by the world’s largest crypto exchange.
👍 Discover real insights from verified creators.
Email / Phone number