Binance Square
那个王二狗呀
1.2k Posts

那个王二狗呀

野生分析师 推:那个王二狗呀 微博:汪情探员二狗
0 Following
431 Followers
1.0K+ Liked
Posts
·
--
#ETH We captured the second leg up to TP1 Valid trades > frequent trading {future}(ETHUSDT)
#ETH We captured the second leg up to TP1
Valid trades > frequent trading
那个王二狗呀
·
--
#ETH 4H update
The trend has shifted from an uptrend channel breaking down to a descending wedge
The current wedge is facing an upward breakout

In the previous trend (marked by the red circles), even if it is a downward trend, short-term rallies can come in two waves
For there to be a second wave, the subsequent price action must not break below the first upward leg marked by the red circle

So ETH’s safest stop-loss should be on the blue line
The red line is a high-risk stop-loss for attempting an upward breakout
The red line is the bottom of a smaller-interval rectangular consolidation

In summary, as long as 4H does not lose the red line, it will test the green line to the upside
However, since the stop-loss is at the smaller-interval rectangle bottom,
please do not use too much capital
那个王二狗呀
·
--
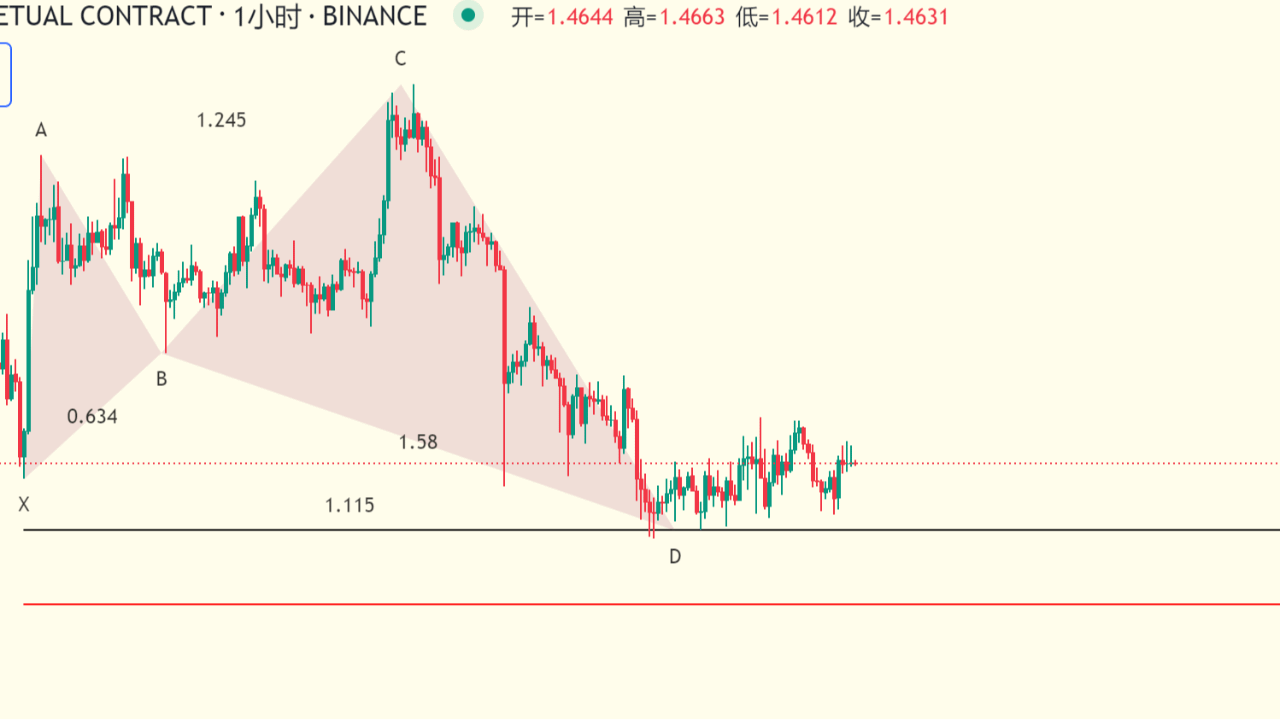
#TER 1D Outlook
1D has an unfinished bearish setup
If C-point is not lost, it will test a drop to D-point
If the view that loses C-point is invalid
#SOL 4H Attempt small-level head-and-shoulders neckline breakout to capture the larger head-and-shoulders neckline position {future}(SOLUSDT)
#SOL 4H
Attempt small-level head-and-shoulders neckline breakout to capture the larger head-and-shoulders neckline position
#ETH 4H update The trend has shifted from an uptrend channel breaking down to a descending wedge The current wedge is facing an upward breakout In the previous trend (marked by the red circles), even if it is a downward trend, short-term rallies can come in two waves For there to be a second wave, the subsequent price action must not break below the first upward leg marked by the red circle So ETH’s safest stop-loss should be on the blue line The red line is a high-risk stop-loss for attempting an upward breakout The red line is the bottom of a smaller-interval rectangular consolidation In summary, as long as 4H does not lose the red line, it will test the green line to the upside However, since the stop-loss is at the smaller-interval rectangle bottom, please do not use too much capital {future}(ETHUSDT)
#ETH 4H update
The trend has shifted from an uptrend channel breaking down to a descending wedge
The current wedge is facing an upward breakout

In the previous trend (marked by the red circles), even if it is a downward trend, short-term rallies can come in two waves
For there to be a second wave, the subsequent price action must not break below the first upward leg marked by the red circle

So ETH’s safest stop-loss should be on the blue line
The red line is a high-risk stop-loss for attempting an upward breakout
The red line is the bottom of a smaller-interval rectangular consolidation

In summary, as long as 4H does not lose the red line, it will test the green line to the upside
However, since the stop-loss is at the smaller-interval rectangle bottom,
please do not use too much capital
#BTC 4H Update 4H is a descending channel There is a 70% probability that a descending channel will be broken upward There is a 70% probability that an ascending channel will be broken downward A typical sign of a breakout is using the 20 moving average (ema20, ma20) for confirmation As shown by the blue circle, if the price stays above the 20 moving average (the blue double lines) and a large-bodied bullish candle appears, it can confirm that the upward breakout is successful with a probability higher than 60% This situation has not occurred yet. Channel trading means: when there is a second-high, place a short; when a new low forms, go long. The market has momentum. Do not try to gamble on every breakout and breakdown. {future}(BTCUSDT)
#BTC 4H Update
4H is a descending channel

There is a 70% probability that a descending channel will be broken upward
There is a 70% probability that an ascending channel will be broken downward
A typical sign of a breakout is using the 20 moving average (ema20, ma20) for confirmation

As shown by the blue circle, if the price stays above the 20 moving average (the blue double lines) and a large-bodied bullish candle appears, it can confirm that the upward breakout is successful with a probability higher than 60%
This situation has not occurred yet.

Channel trading means: when there is a second-high, place a short; when a new low forms, go long.
The market has momentum.
Do not try to gamble on every breakout and breakdown.
#AXTI 4H更新 20%+
#AXTI 4H更新 20%+
那个王二狗呀
·
--
#AXTI 1D Outlook
1D there are bullish signs completing
You’ve already missed the best D-point entry
Now the reaction at D looks good
1, consolidating before 57.62-36.34
2, if it stays above 57.62, it will test up to 80
Suggestions
1, wait for the test near 36 to enter
2, wait for the 4H close above 57.62 to enter
Target green line
15B Harmonious Bat Form Trading
#SKHY 2H Update The 2H close does not meet the market conditions for a bullish setup Market is falling~ {future}(SKHYUSDT)
#SKHY 2H Update
The 2H close does not meet the market conditions for a bullish setup
Market is falling~
那个王二狗呀
·
--
#SKHY Update 2H
The previous update said that after waiting 4H, the close should be higher than the long entry.
Now it’s clear that this didn’t meet expectations.

If the market is going to rise now, it needs a 2H close above the black line.
#ETH 2H price trend update Meets the test expectation of a market upward move around 1847 {future}(ETHUSDT)
#ETH 2H price trend update
Meets the test expectation of a market upward move around 1847
那个王二狗呀
·
--
#ETH 2H price trend update
The 2H upward channel has been broken below the current upward testing channel’s bottom
The 2H timeframe needs to close above the red line (1892) in order to continue with a bullish outlook

If the 2H does not close above 1892, there is a chance to test the black line (1847)
Try to move up again
But a head-and-shoulders pattern generally doesn’t appear in the middle of a move, so you shouldn’t overuse capital here

It’s worth noting that after the channel is broken, the downward pull of the move
has a 60% probability of clearing the channel’s starting point—that is, the lower black line (1685)
#BTC 2H Update As expected Testing the shark CD around 0.5 (63810) The 2H did not close above the red line 63982 Does not meet the conditions to establish a long position Market is falling {future}(BTCUSDT)
#BTC 2H Update
As expected
Testing the shark CD around 0.5 (63810)
The 2H did not close above the red line 63982
Does not meet the conditions to establish a long position
Market is falling
那个王二狗呀
·
--
#BTC 2H Trend Update
Bullish shark structure has completed on the 2H market
The target of a typical shark pattern trade is 0.5 of CD (63810)

The current market has already reached the pressure zone
Longs have established and are waiting for the 2H close to be above the upper red line (63982)
Then re-test that red line for the best trading entry approach
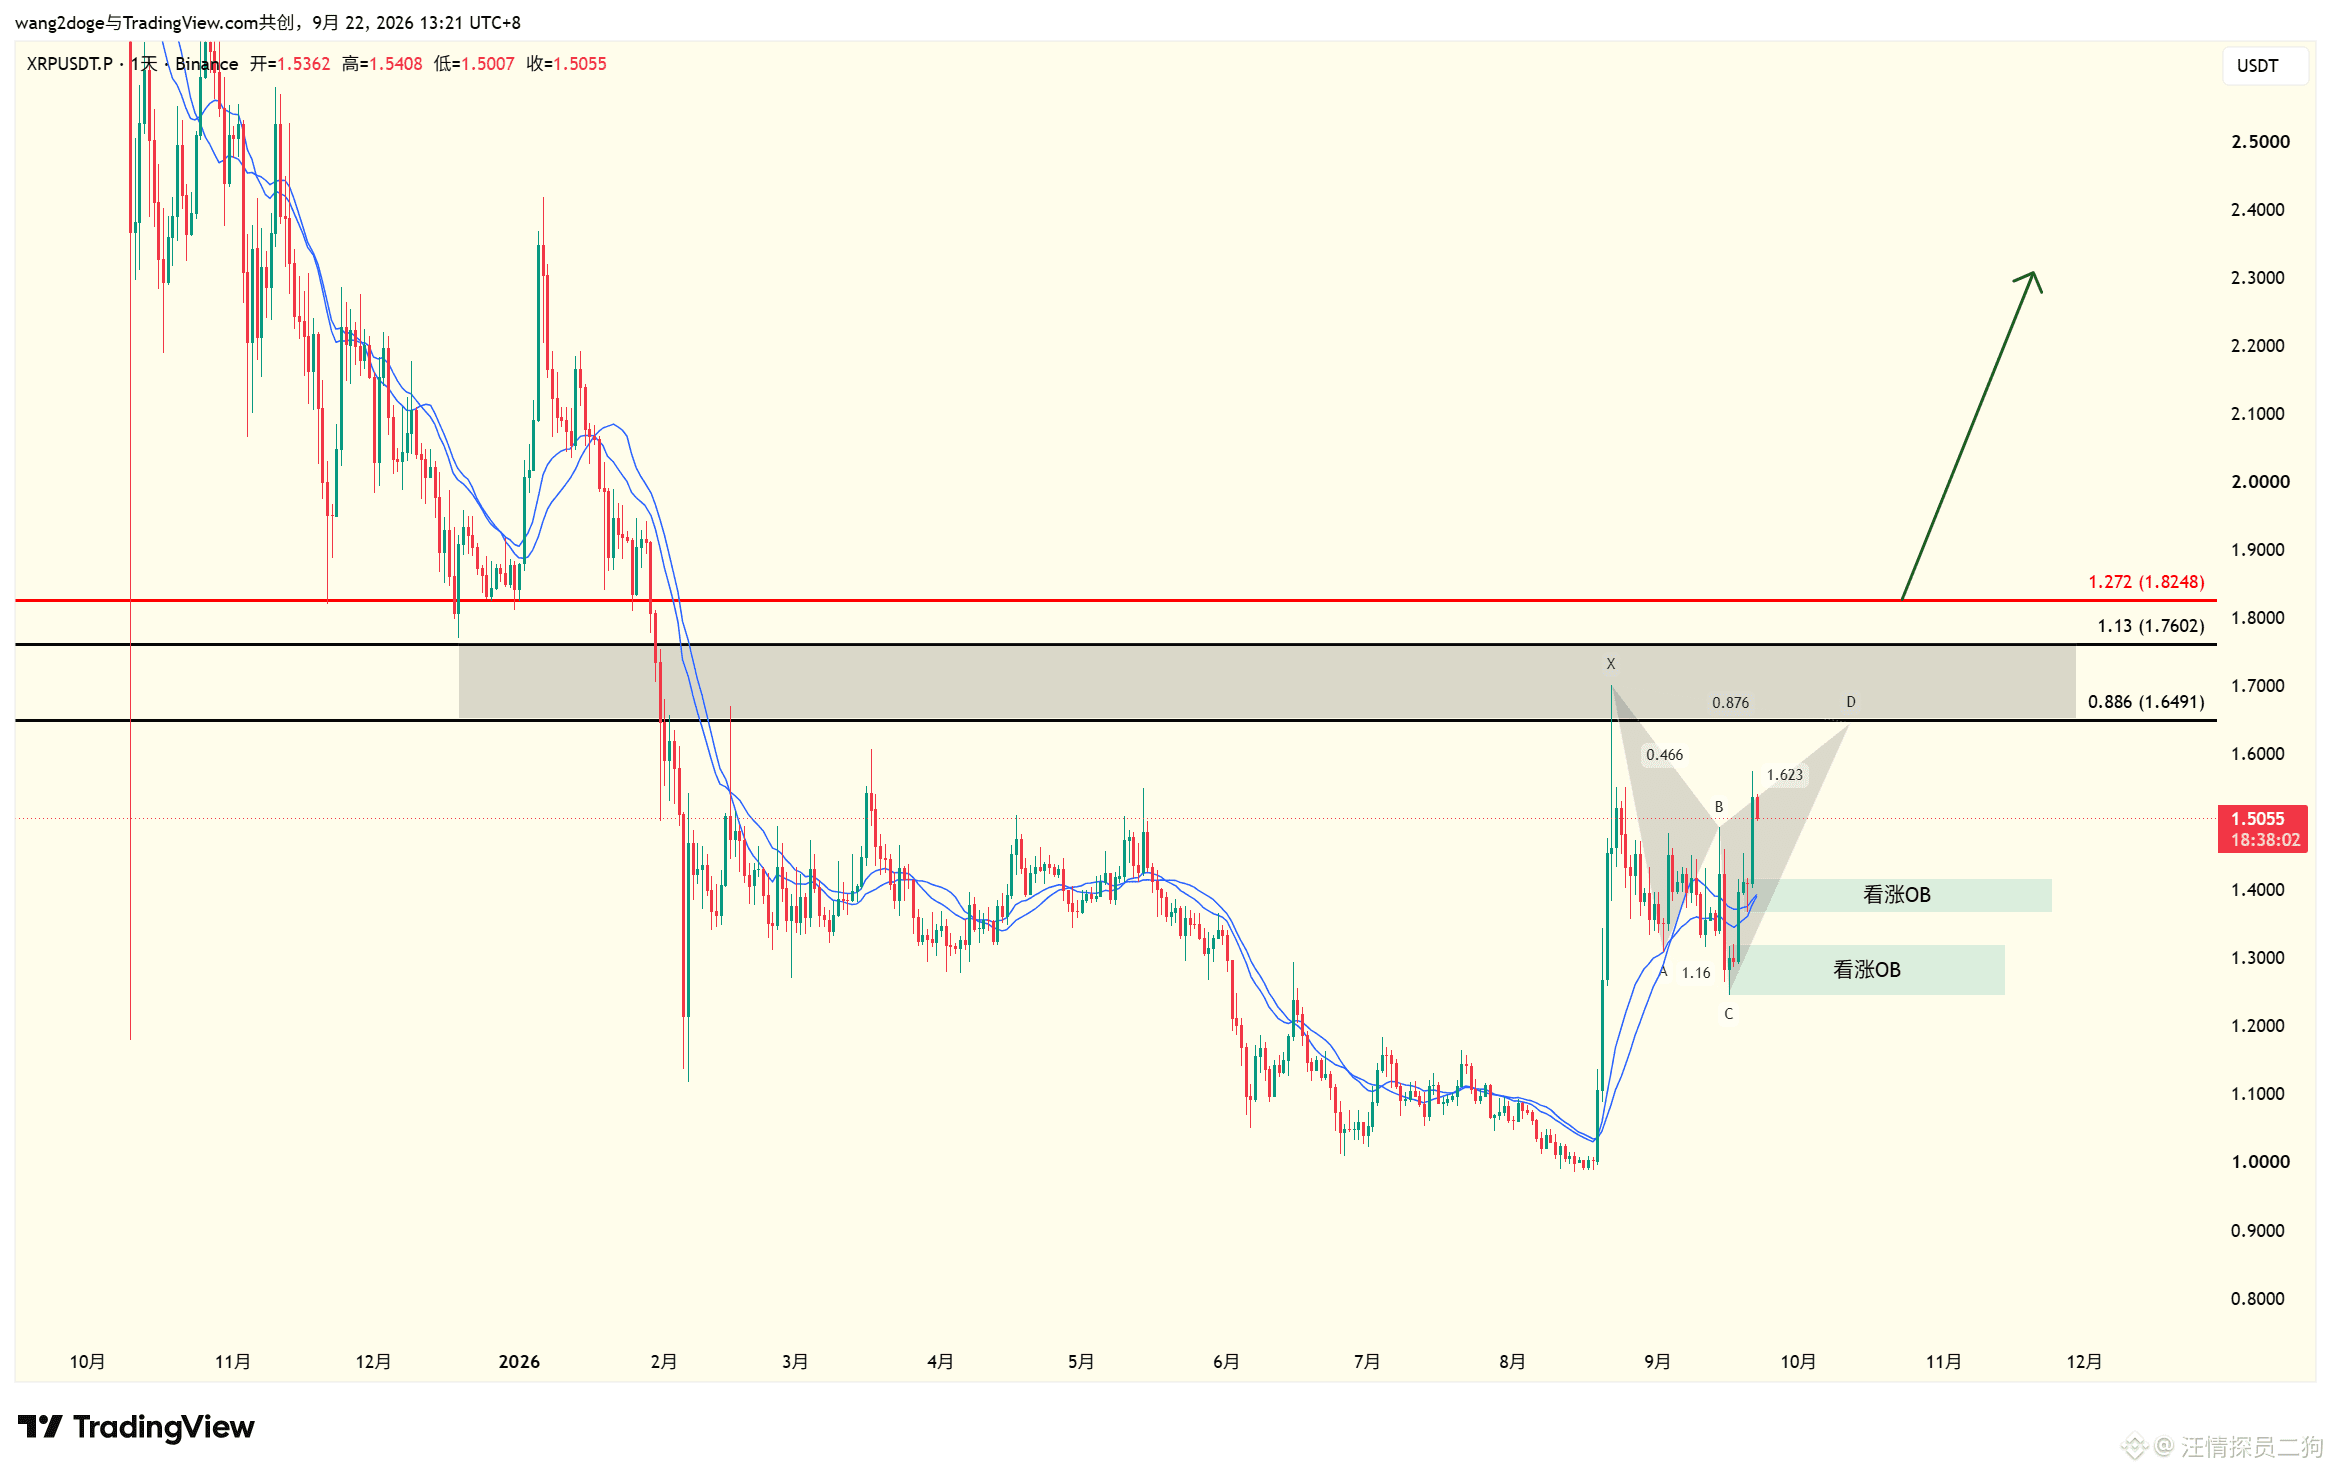
#XRP 1D Update The 1D price action is consolidating within a descending channel. The best range for 1D long positions is the black area at the lower edge of the channel. A 1D close above the red line is invalid. {future}(XRPUSDT)
#XRP 1D Update
The 1D price action is consolidating within a descending channel.
The best range for 1D long positions is the black area at the lower edge of the channel.
A 1D close above the red line is invalid.
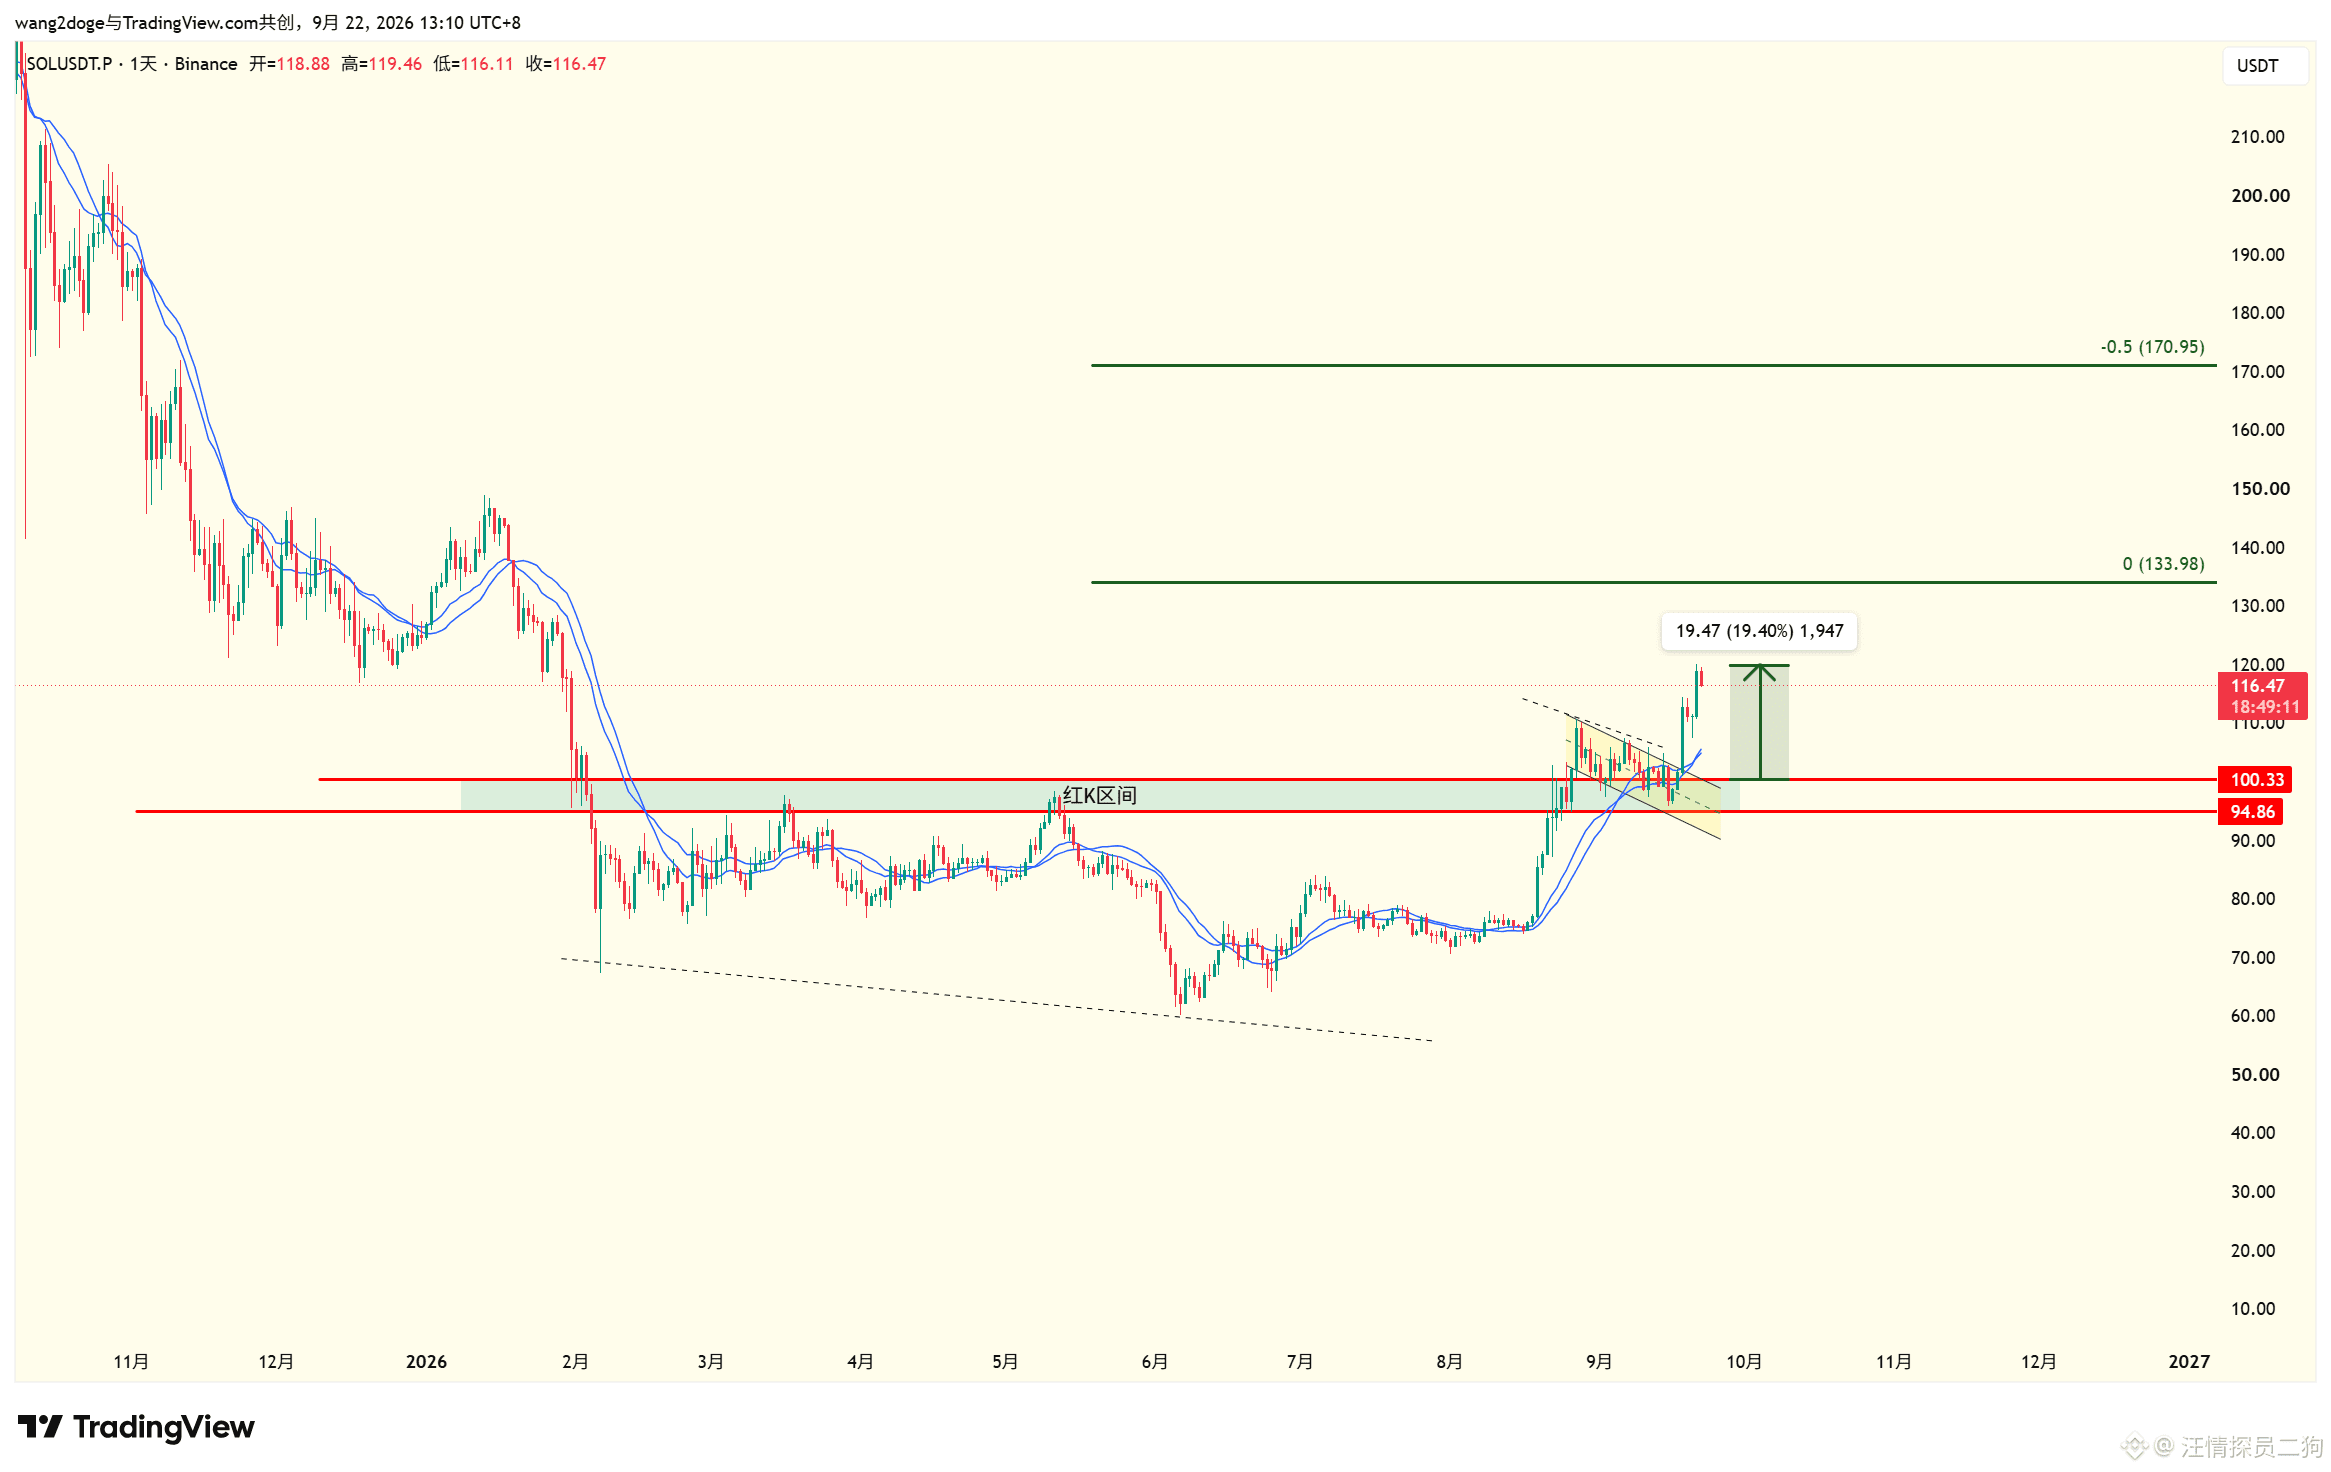
#SOL 1D Update There are two bullish unfinished bat structures on the 1D chart The range formed by the two D points of this structure is defined as the support zone For the 1D close to remain above 76.3 only then can it be considered that SOL has returned to the prior consolidation range of 76.3–93.9 From the daily timeframe, SOL’s long positions: Either wait for a breakout above 76.3 and a retest of the green zone of 76.3 to enter as a support entry, or wait for an entry into the black line zone. {future}(SOLUSDT)
#SOL 1D Update
There are two bullish unfinished bat structures on the 1D chart
The range formed by the two D points of this structure
is defined as the support zone

For the 1D close to remain above 76.3
only then can it be considered that SOL has returned to the prior consolidation range of 76.3–93.9
From the daily timeframe,
SOL’s long positions:
Either wait for a breakout above 76.3 and a retest of the green zone of 76.3 to enter as a support entry,
or wait for an entry into the black line zone.
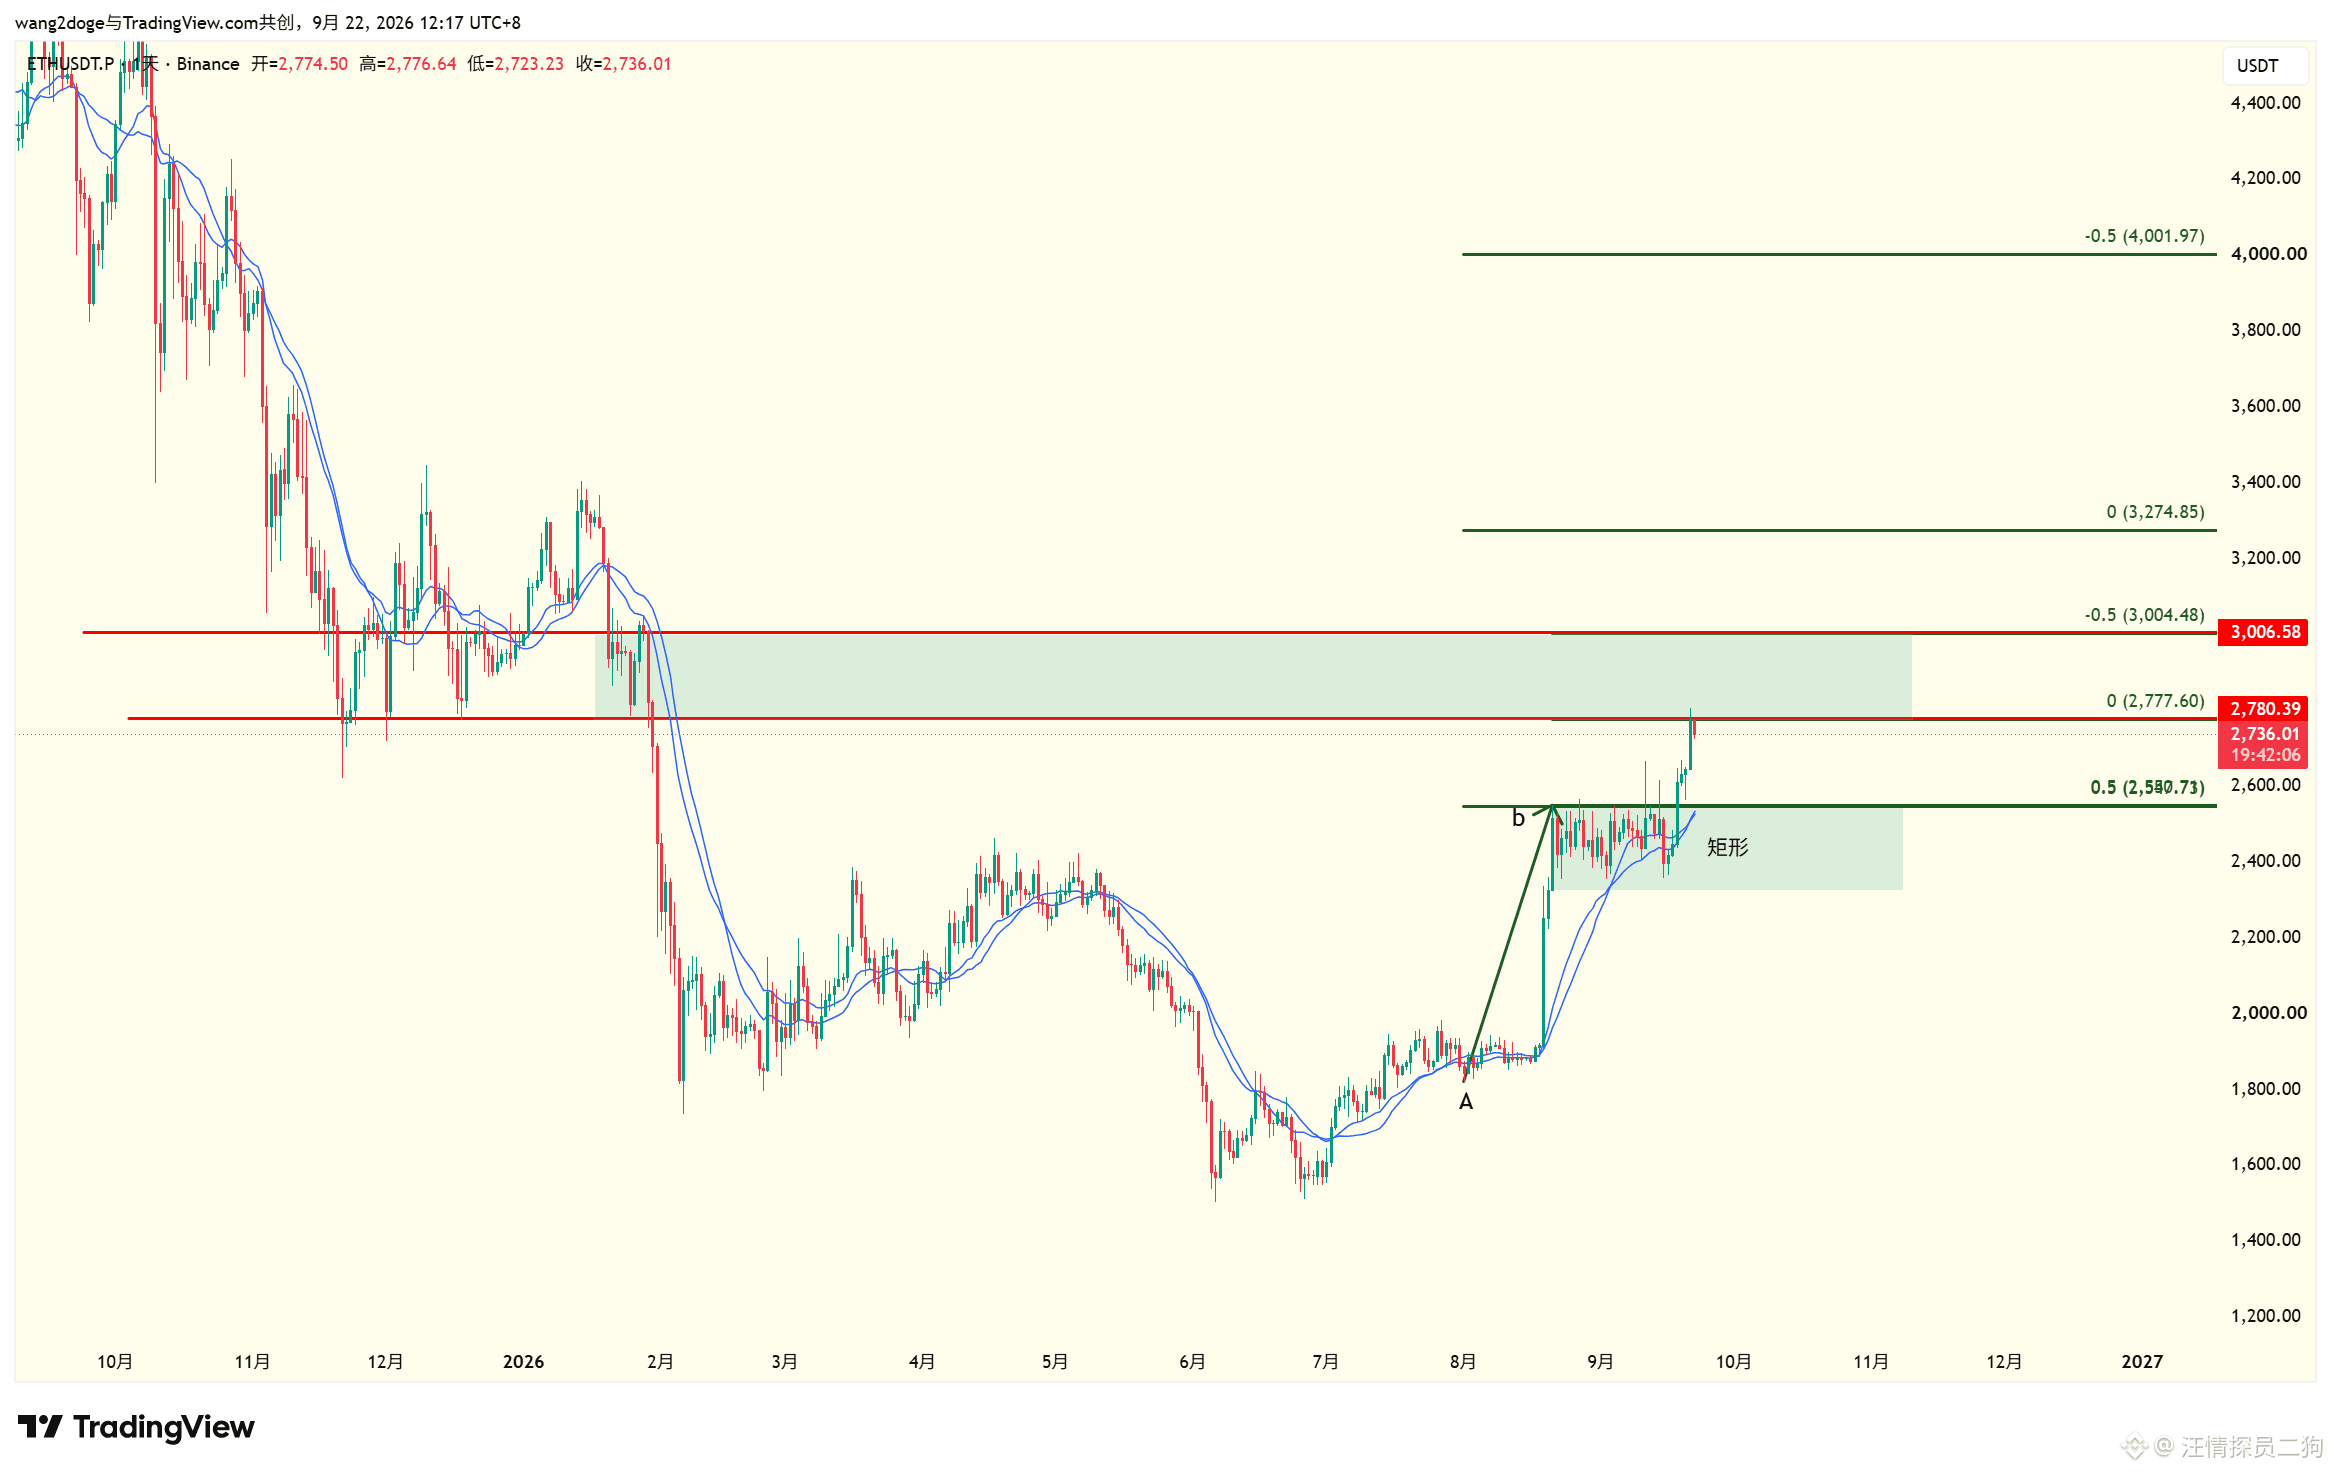
#ETH 2H price trend update The 2H upward channel has been broken below the current upward testing channel’s bottom The 2H timeframe needs to close above the red line (1892) in order to continue with a bullish outlook If the 2H does not close above 1892, there is a chance to test the black line (1847) Try to move up again But a head-and-shoulders pattern generally doesn’t appear in the middle of a move, so you shouldn’t overuse capital here It’s worth noting that after the channel is broken, the downward pull of the move has a 60% probability of clearing the channel’s starting point—that is, the lower black line (1685) {future}(ETHUSDT)
#ETH 2H price trend update
The 2H upward channel has been broken below the current upward testing channel’s bottom
The 2H timeframe needs to close above the red line (1892) in order to continue with a bullish outlook

If the 2H does not close above 1892, there is a chance to test the black line (1847)
Try to move up again
But a head-and-shoulders pattern generally doesn’t appear in the middle of a move, so you shouldn’t overuse capital here

It’s worth noting that after the channel is broken, the downward pull of the move
has a 60% probability of clearing the channel’s starting point—that is, the lower black line (1685)
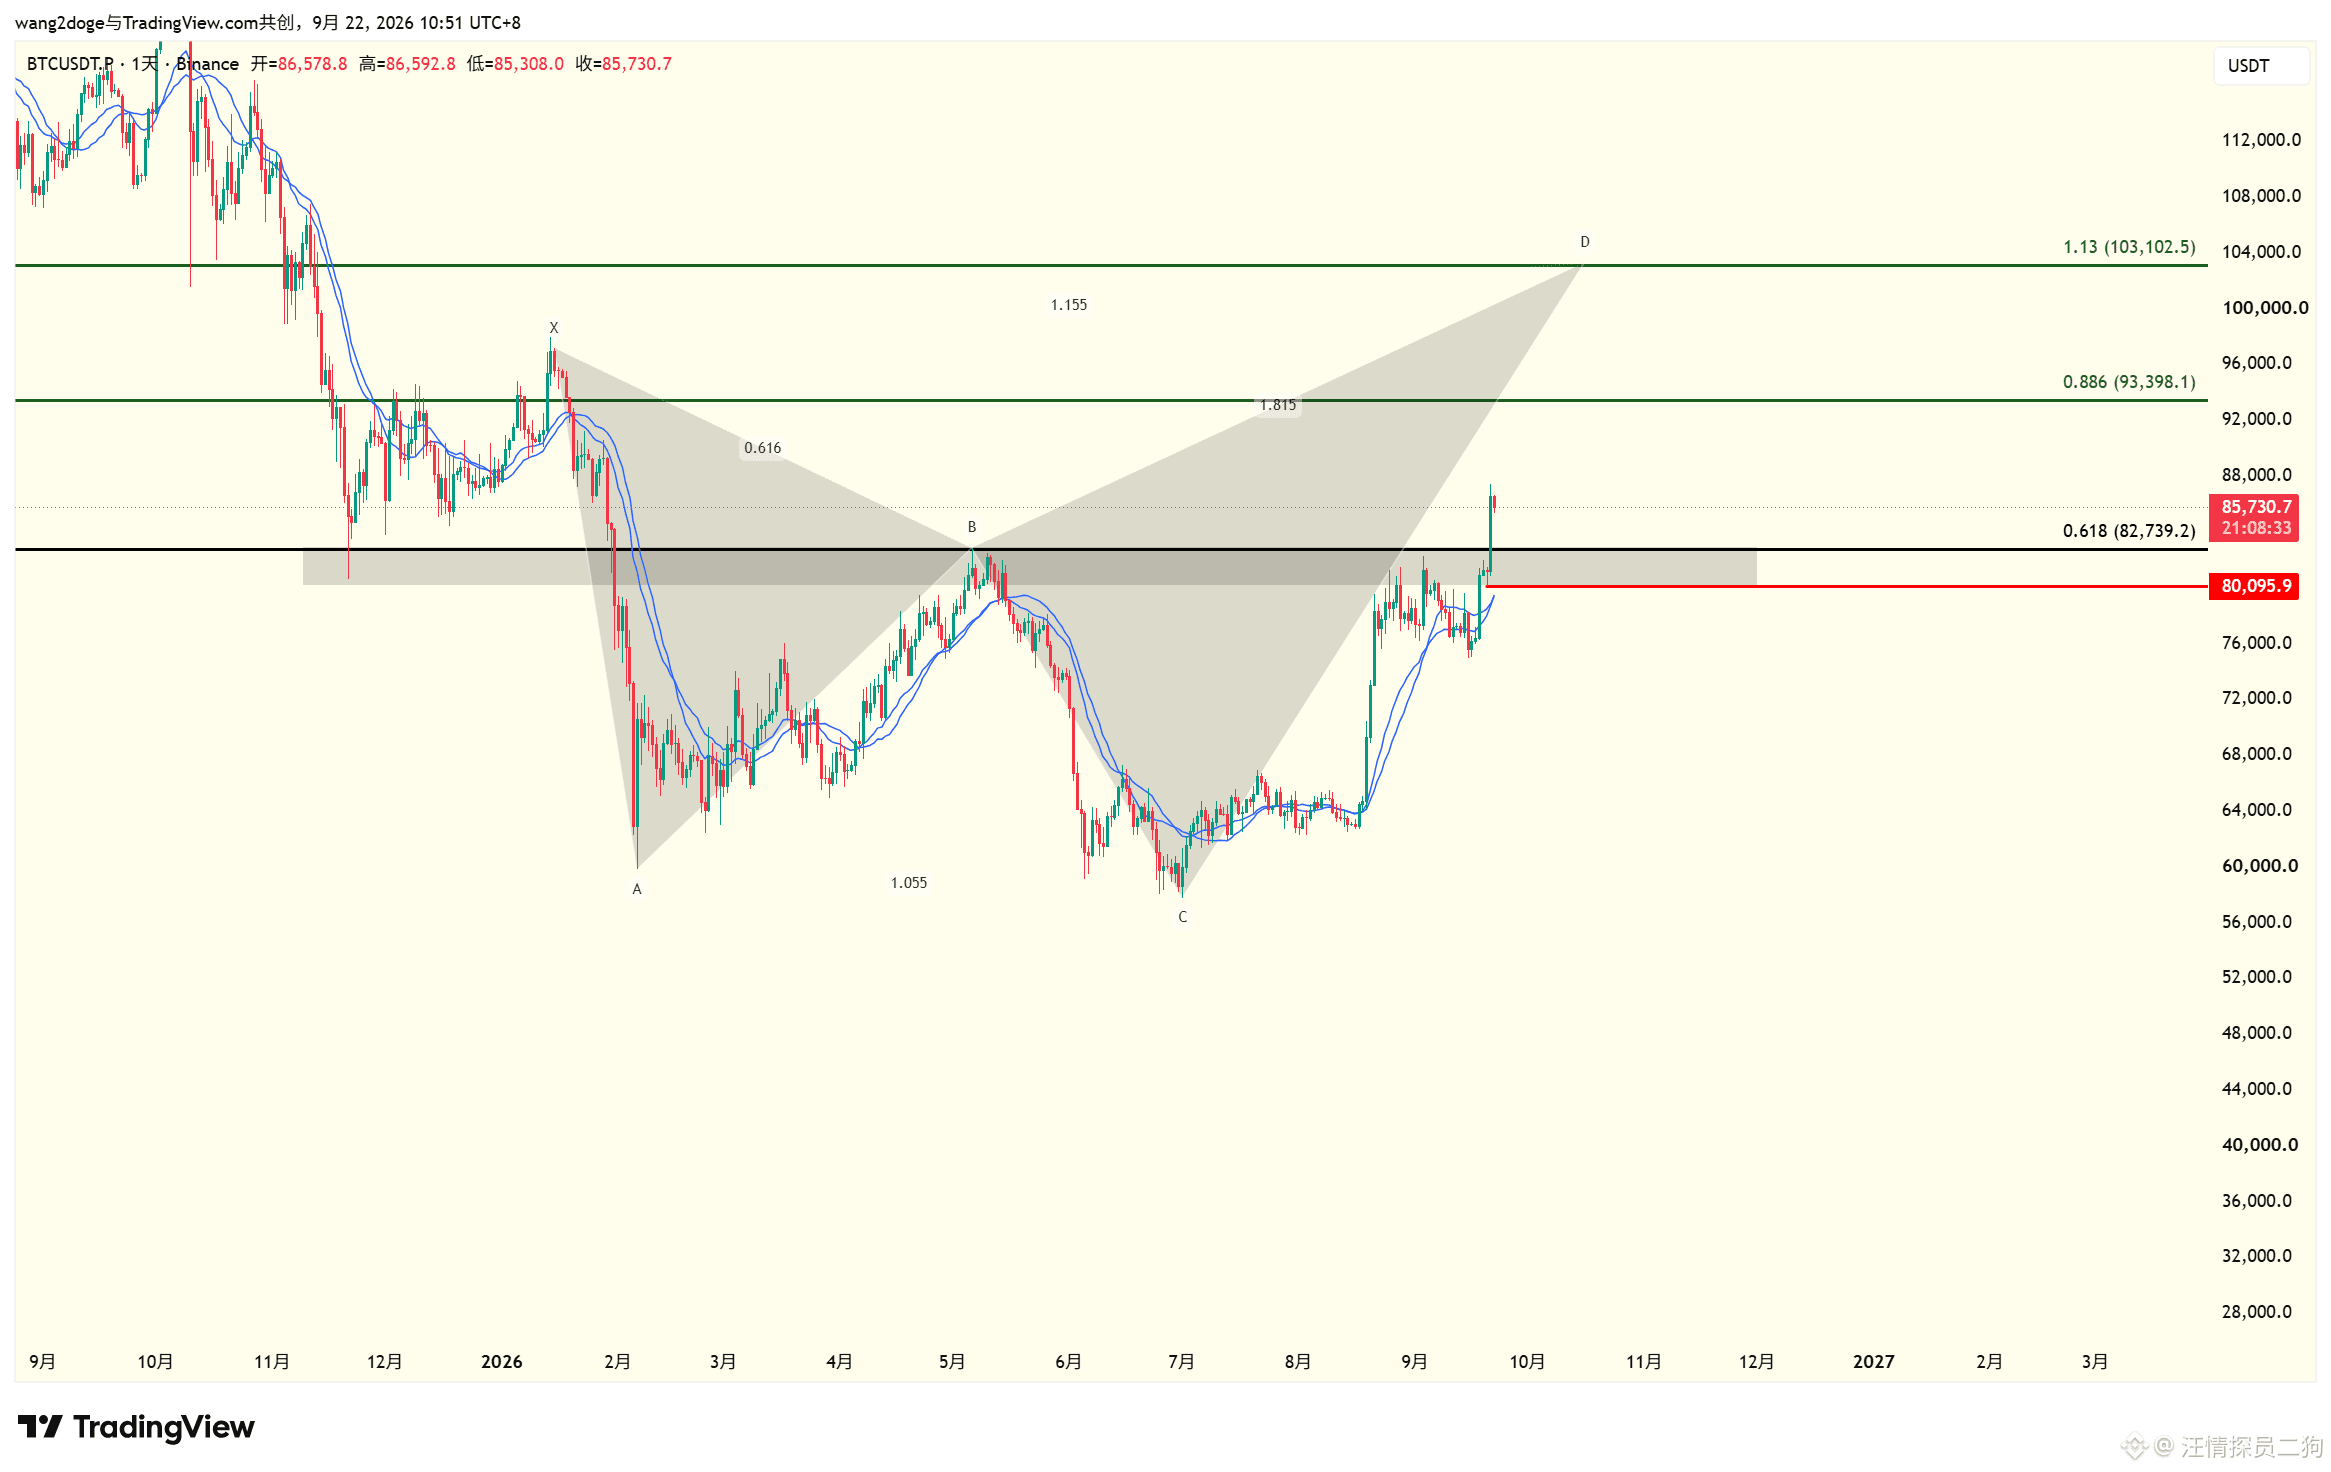
#BTC 2H Trend Update Bullish shark structure has completed on the 2H market The target of a typical shark pattern trade is 0.5 of CD (63810) The current market has already reached the pressure zone Longs have established and are waiting for the 2H close to be above the upper red line (63982) Then re-test that red line for the best trading entry approach {future}(BTCUSDT)
#BTC 2H Trend Update
Bullish shark structure has completed on the 2H market
The target of a typical shark pattern trade is 0.5 of CD (63810)

The current market has already reached the pressure zone
Longs have established and are waiting for the 2H close to be above the upper red line (63982)
Then re-test that red line for the best trading entry approach
Log in to explore more content
Join global crypto users on Binance Square
⚡️ Get latest and useful information about crypto.
💬 Trusted by the world’s largest crypto exchange.
👍 Discover real insights from verified creators.
Email / Phone number
Sitemap
Cookie Preferences
Platform T&Cs