
Crypto Insights 360
3.9k Posts

Crypto Insights 360
Breaking Crypto News & Daily Market Analysis. Providing real-time updates and hidden gems you don't want to miss. Follow for daily Alpha! 💎
Frequent Trader
3.7 Years
4 Following
59 Followers
143 Liked
Posts
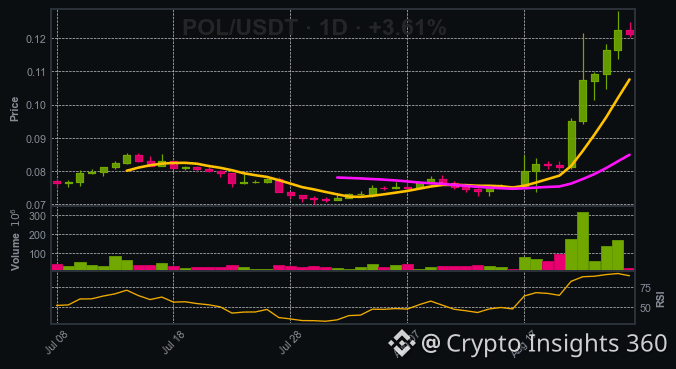
People keep saying $POL is overextended and due for a dump, but that’s a classic contrarian trap. The price is at 0.12122, a level that sits just above the 7‑day SMA and 25‑day SMA—both of which are converging, a strong sign of momentum. I’m putting a long on $POL at 0.12122, with a stop just below the 0.0702 support, and a target at 0.1283 where resistance lines up. If the price keeps moving above the 25‑day SMA, we could be looking at a fresh wave of buying pressure. Keep an eye on the volume—it's climbing, and that’s a bullish confirmation. Time to ride the next wave.
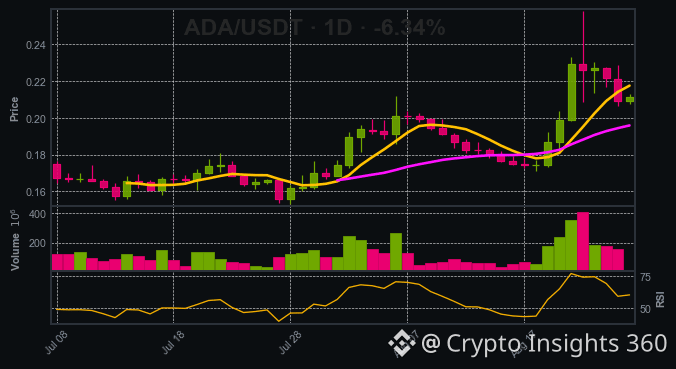
Everyone’s hunkered down after the 6.3% slide, but that’s just a temporary wobble. $ADA is still marching higher – the 10‑bar trend is bullish, 7‑day SMA is ahead of 25‑day SMA, and the price is hovering just below the 7‑day SMA, which is a classic buying zone. I’m putting my money in at 0.2113, set the stop just below the 0.1533 support, and aim for the 0.2584 resistance. If the trend holds, we’re looking at a ~22% upside before the next pullback. Don’t let the fear of a 6% dip scare you out of a coin that’s still on the move.
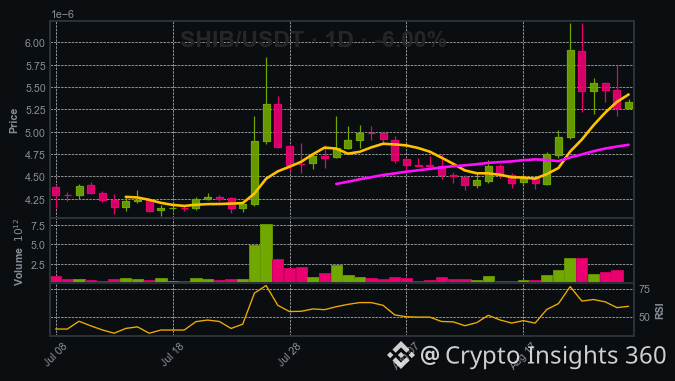
Last night’s rally saw $SHIB break out above its 25‑period SMA, a sign that the bulls are still in control. I’m taking a long position right now at 5.33e-06, setting my stop just below the 0.00000435 support to protect against a quick pullback. My target is the 0.00000622 resistance level, where a strong bounce could send the price back up. If the momentum continues, we could see $SHIB touch that resistance in the next few hours—don
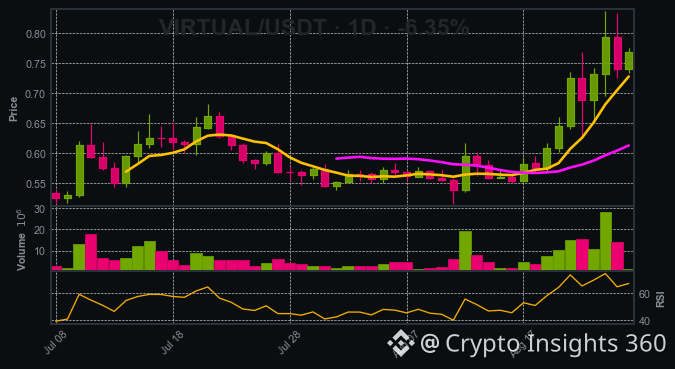
I’m looking at $VIRTUAL right now, price at 0.7674. The 7‑day SMA is 0.7272, the 25‑day SMA is 0.6121 – both below the current close, confirming the uptrend. My entry sits around 0.7674, a tight stop below the 0.5150 support, and a take‑profit near the 0.8372 resistance. With volume up and the chart bias scoring 5‑3 for LONG, I feel the momentum is in my favor. Let’s see if this bullish run carries on.
- Buying around 0.3361 with a stop just below 0.3235 and targeting 0.3502 gives a solid risk‑reward of 1:1.3.
- The price stays above the 25‑day SMA while flirting with the 7‑day SMA, a textbook pullback pattern.
- Strong support at 0.3235 and resistance at 0.3502 provide clear entry, exit, and exit targets.
- The price stays above the 25‑day SMA while flirting with the 7‑day SMA, a textbook pullback pattern.
- Strong support at 0.3235 and resistance at 0.3502 provide clear entry, exit, and exit targets.
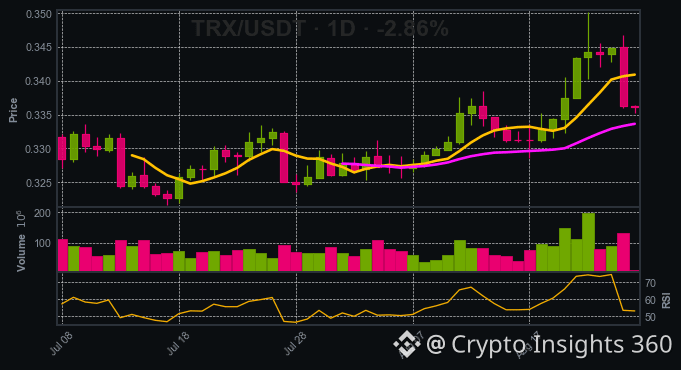
- Price is 19.3% above SMA25, showing strong buying pressure.
- SMA7 > SMA25 and a bullish 10-bar trend confirm the long bias.
- 5-bar volume is rising, indicating growing momentum.
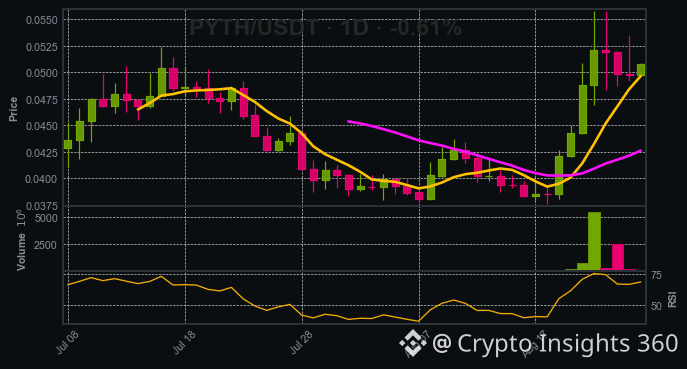
Buying around 0.05084 with a stop below 0.0376 and targeting 0.0558.
- SMA7 > SMA25 and a bullish 10-bar trend confirm the long bias.
- 5-bar volume is rising, indicating growing momentum.
Buying around 0.05084 with a stop below 0.0376 and targeting 0.0558.
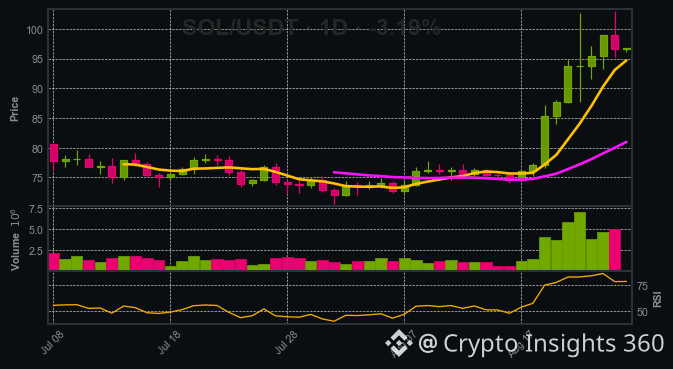
Last night the $SOL price crept up to $96.72 after a shaky 3% dip, but the chart tells a different story. The 10‑bar trend is still solidly bullish, with the price sitting 19% above SMA25 and both moving averages aligned in the green. This signals that the up‑momentum isn’t just a blip. I’m buying around $96.72, placing my stop just below the 70.58 support level, and aiming for the 103.08 resistance. If $SOL keeps riding the wave, the next target could be even higher. Stay tuned and keep your eyes on the chart.
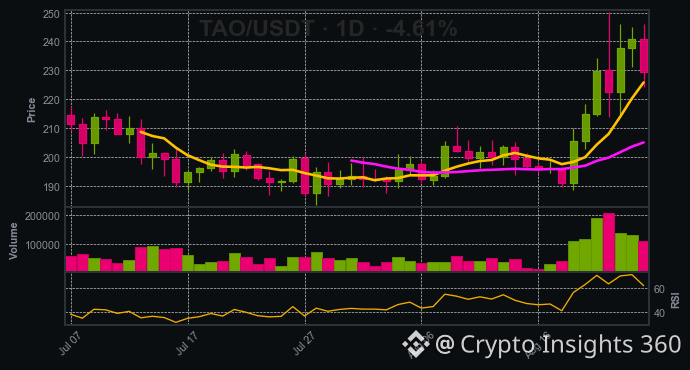
People keep calling $TAO a weak spot after its 4.6% slide, but that dip is actually the best entry point. The chart is screaming an uptrend: 10‑bar bullish momentum, SMA7 above SMA25, and price 11.9% above the 25‑day SMA. I’m buying around 229.6, with a stop just below the support line at 183.5, and targeting the resistance at 250.3. If the market ignores the usual fear, you can capture that upside while the crowd stays on the sidelines.
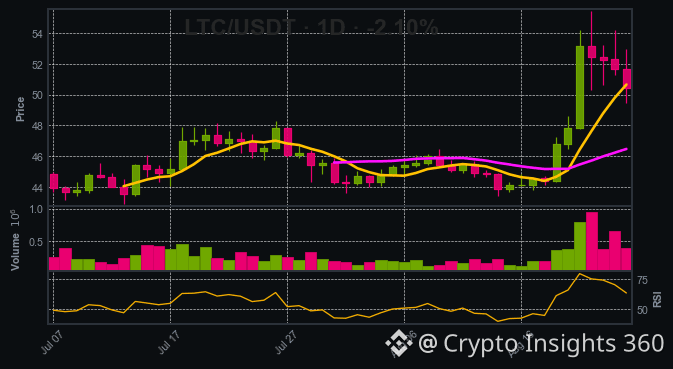
Seeing $LTC at $50.44, it’s looking overextended above its 25‑day SMA but still shy of the 7‑day line. The recent bearish candle and a bias score that favors short are nudging me to short now. I’d enter around $50.44, set a stop above the 55.45 resistance (say $56), and aim for the 43.39 support. Could this be the next quick pullback?
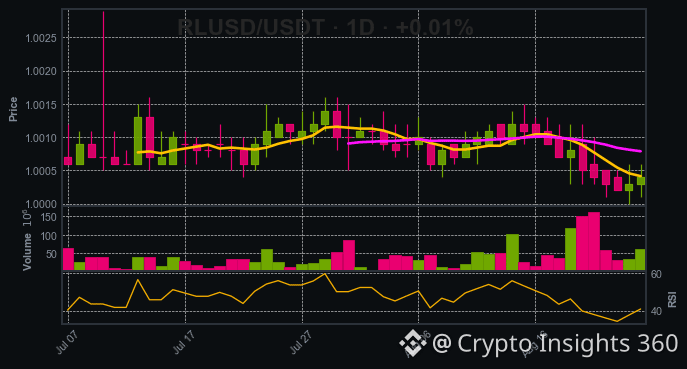
Most people are treating $RLUSD as a static token, but the data says otherwise. At 1.0004 the price has just bounced off its support, and the 10‑bar trend is stubbornly sideways—classic setup for a breakout. I’m buying near 1.0004, placing a stop just below the 1.0000 support and targeting the resistance at 1.0016. If the market takes off, this could be a quick win. Don’t let the noise drown this signal. Time to make the move.
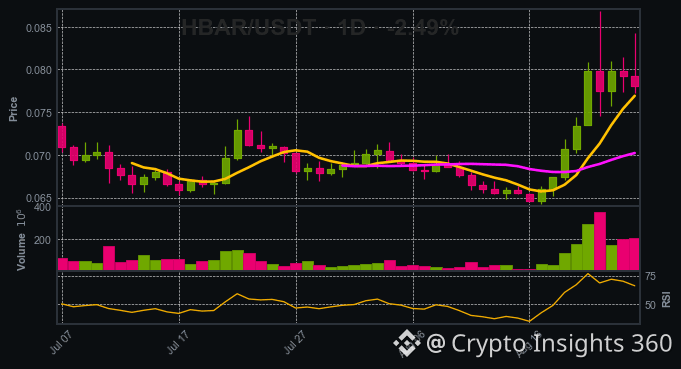
Just watched $HBAR climb past the 25‑period SMA, sitting 11.1% above it and looking a bit over‑extended. The last candle dipped, but the overall bias remains bullish. I'm taking a long at 0.07804, setting a stop just below the 0.0643 support and targeting the 0.0869 resistance. If it breaks that ceiling, the next leg could push us into the mid‑$0.10 range.
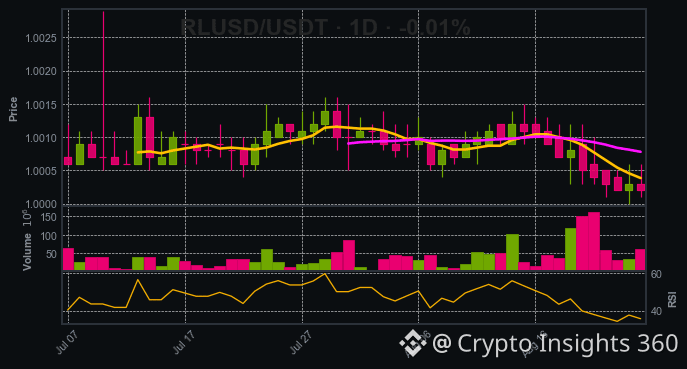
$RLUSD is sitting at 1.0002, just a whisker above the 1.0000 support line. The 7‑day SMA sits below the 25‑day SMA, and the last ten bars have been nothing more than a sideways shuffle—no real momentum. A bearish candle just popped, and the price has already bounced back from the lower end of the swing low, showing that the market is rejecting any further downside. That’s why I’m leaning short.
**Entry** – 1.0002 (right where the price is holding).
**Stop‑loss** – Set it above the 1.0016 resistance, say 1.0018, so you’re protected if the trend flips…
**Entry** – 1.0002 (right where the price is holding).
**Stop‑loss** – Set it above the 1.0016 resistance, say 1.0018, so you’re protected if the trend flips…
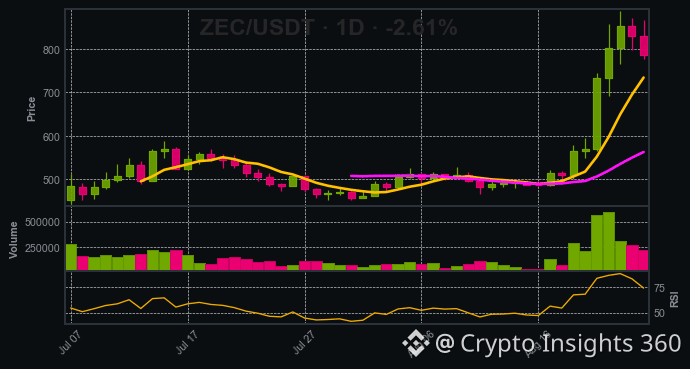
Just watched $ZEC climb past 785 after a steady run above its 25‑period SMA. The last candle was bearish, but the trend stays bullish and volume is still rising. I’m entering at 784.65, putting my stop just below the 451.75 support, and shooting for the 888.00 resistance. If the rally holds, we’re looking at a solid 13% move.
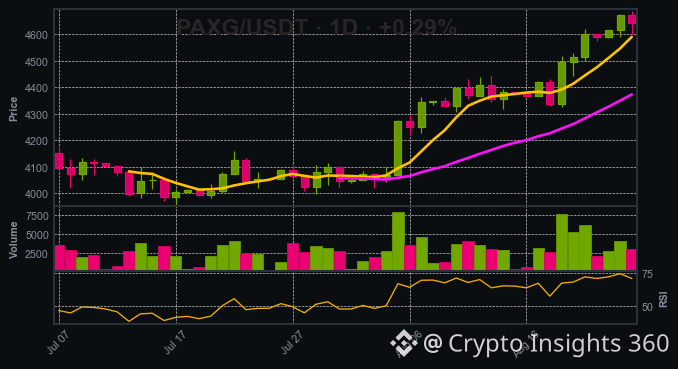
- Price is comfortably above the 7‑day and 25‑day moving averages, giving a solid support zone near 3,997.
- Higher highs and higher lows (HH=21, LL=12) plus a bullish 10‑bar trend confirm sustained momentum.
- Resistance at 4,689 offers a tight risk‑reward: buying around 4,642.18 with a stop below 3,996.65 and targeting 4,689 for a 1.2:1 payoff.
- Higher highs and higher lows (HH=21, LL=12) plus a bullish 10‑bar trend confirm sustained momentum.
- Resistance at 4,689 offers a tight risk‑reward: buying around 4,642.18 with a stop below 3,996.65 and targeting 4,689 for a 1.2:1 payoff.
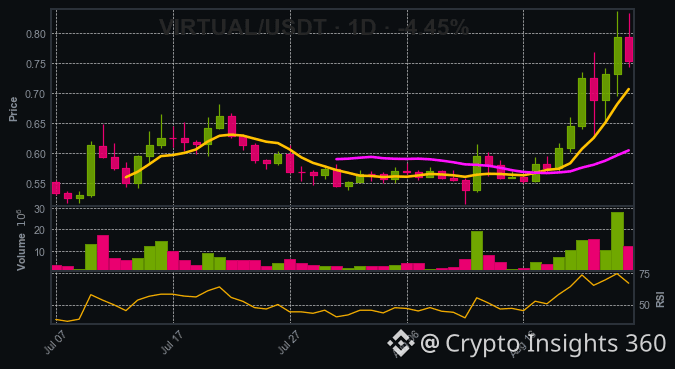
Everyone’s whispering that $VIRTUAL ’s 4.45% dip means doom, but the numbers say otherwise – the coin is 24.7% above SMA25, volume is climbing, and the 10‑bar trend remains bullish. It’s a textbook temporary correction before the next climb. I’m buying at 0.7532, setting a stop just below the support at 0.5150, and targeting the resistance at 0.8372. If the market plays the usual “sell the news” script, I’ll be the one who knows when to hold.
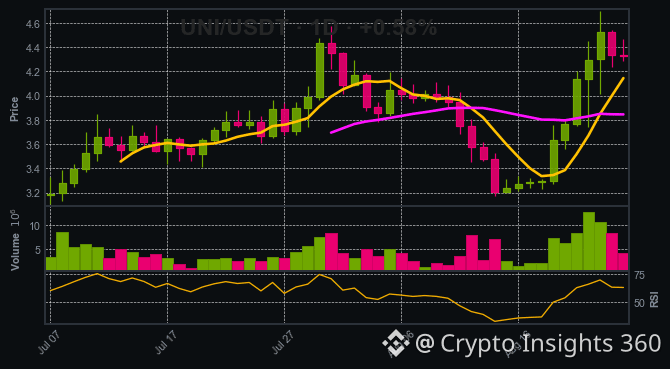
- $UNI is firmly above both 7‑ and 25‑day SMAs with a bullish 10‑bar trend – a clear signal that the uptrend continues.
- Rising 5‑bar volume confirms momentum, and the next key resistance at 4.70 is within reach.
- Even though the last candle was bearish, the price sits 12.5% above the 25‑day SMA; we can buy around 4.326, set a stop just below 3.1710, and target the 4.70 resistance.
- Rising 5‑bar volume confirms momentum, and the next key resistance at 4.70 is within reach.
- Even though the last candle was bearish, the price sits 12.5% above the 25‑day SMA; we can buy around 4.326, set a stop just below 3.1710, and target the 4.70 resistance.
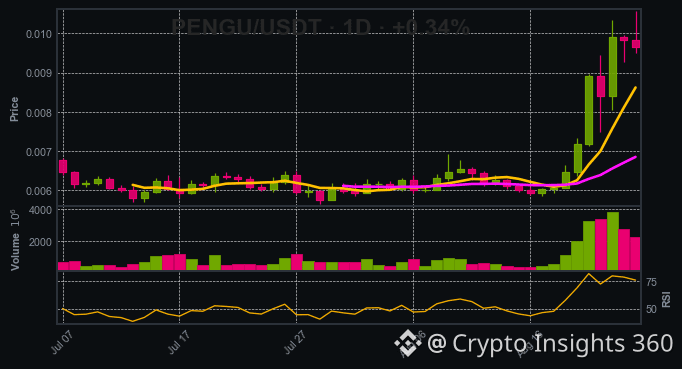
$PENGU is riding a solid uptrend, with price 40% above SMA25 and a bullish 10‑bar pattern, but the last candle still turned bearish. I'm buying around 0.009649 with a stop below 0.0057 and aiming for 0.0106. Will this rally keep climbing or is a pullback on the horizon?
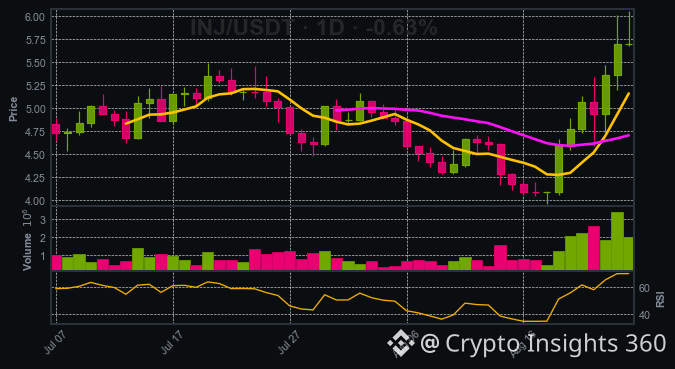
People are freaking out that $INJ is overextended and will crash. That’s exactly why I’m buying. The price is 21.2% above SMA25 and still pushing higher. With a 10‑bar bullish trend and no support or resistance near the current level, the momentum is alive. I’ll enter at 5.699, set a stop just below the 3.9570 support, and aim for the 6.0570 resistance. If the trend keeps riding, that’s a 20% upside before the market corrects. Don’t let fear of a pullback stop you from riding the wave.
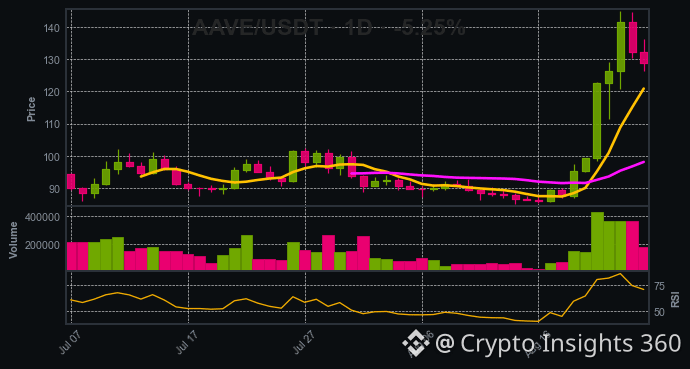
Hey fam, let’s break down $AAVE today. The price sits at 128.9, a solid 31.4% above the 25‑day SMA, and the 7‑day MA is still leading, so the long bias remains strong. We’ve had a bullish 10‑bar trend and swing highs at 15 with lows at 13, so the momentum’s been building. Even though the last candle is bearish, the overall picture is still in favor of a rally.
…
…
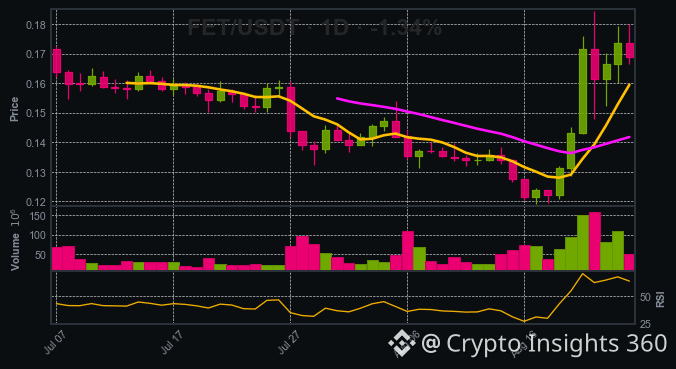
Everyone's whispering that $FET will slide because the last candle was bearish. That's the cheap narrative. The chart tells a different story. It’s still riding a 10‑bar uptrend, sits 19.1% above SMA25, and volume’s been on the rise. That means the current price of 0.1688 is a fair entry point. Set a stop just below the 0.1192 support, and aim for 0.1845 where resistance lines up. If you’re playing the popular fear game, you’ll miss this move. Let’s trade the momentum, not the hype.
Log in to explore more content