
Titans Trading
123 Posts

Titans Trading
Report
Block User
tle: @TitansTrading38 plan BTC ETH mỗi ngày
1 Following
194 Followers
313 Liked
Posts
All
Quotes
·
--
Bearish
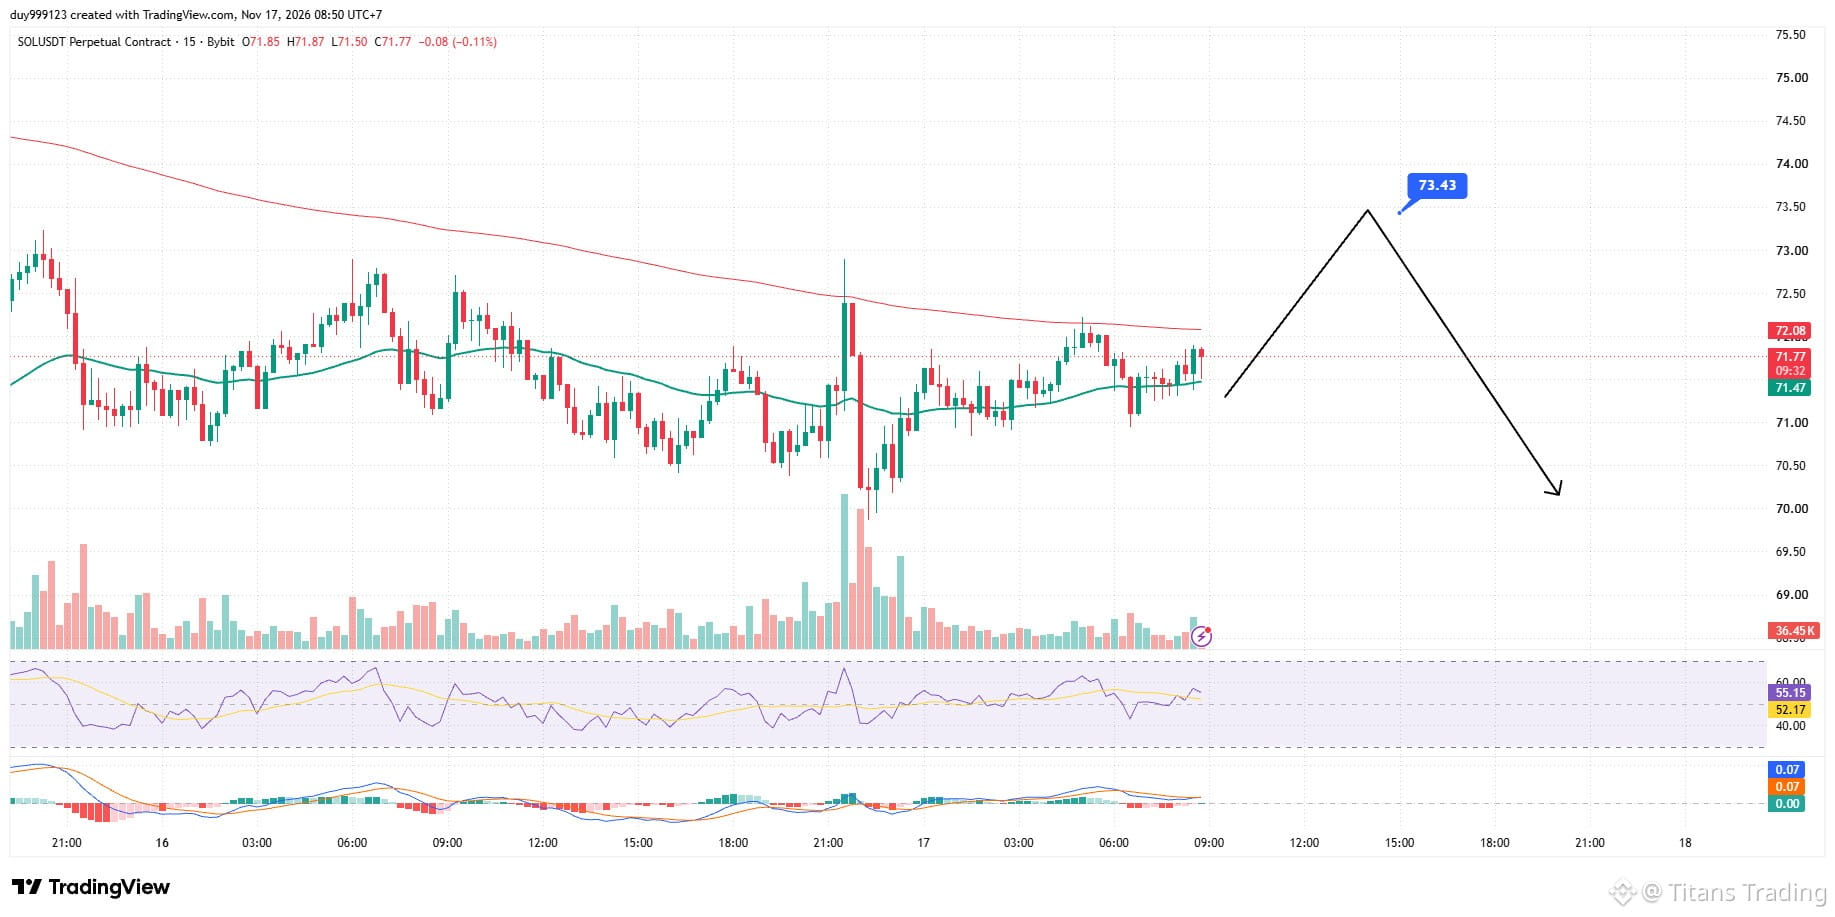
ANALYSIS #sol DATE 17/11: IS THE PUSH UP TO 73.8 A LONG TRAP OR THE START OF A BIG RALLY?
Please note: H1 is currently SIDEWAY after a strong drop, not yet an uptrend.
The W–D1–H4 timeframe is still bearish, continuously forming Lower Highs and Lower Lows. Price is below the dynamic resistance zone, while RSI D1 and H12 are deeply oversold.
After the drop to around 67.4, SOL bounced to 73.3 and then returned to balance around 70.4–72.9.
H1 RSI around 52 shows that short-term selling pressure has weakened, but a reliable bullish BOS has not yet appeared.
The current assessment is that SOL is in a sideways phase, sweeping liquidity above and possibly continuing to fall. The sweep above has not been confirmed.
Derivatives data shows about 79% of Bybit accounts are long, but funding is negative and taker buy is below 50%.
Above there is short liquidity at 72.84–73.20 and 73.92. Below there is long liquidity at 69.78–69.54 and 69.06.
This is an environment where both a short squeeze and a long trap may occur.
Price is compressing in the M15–H1 range, while short liquidity is relatively close above. A push up could trigger short stops and breakout buy orders.
If after the sweep price fails to hold the 73.2–73.9 zone, buying pressure may be absorbed and the H4 downtrend could take control again.
If H1 closes above 73.9 and the retest succeeds: cancel the short plan and shift to watching 75–76.8.
In the successful short scenario, price may test 70.4 AND 69.85.
Wait for price to sweep the 73.2–73.86 zone and then fail to hold resistance.
E 73.25
SL: 75.45.
TP: 69.85
ANALYSIS #sol DATE 17/11: IS THE PUSH UP TO 73.8 A LONG TRAP OR THE START OF A BIG RALLY?
Please note: H1 is currently SIDEWAY after a strong drop, not yet an uptrend.
The W–D1–H4 timeframe is still bearish, continuously forming Lower Highs and Lower Lows. Price is below the dynamic resistance zone, while RSI D1 and H12 are deeply oversold.
After the drop to around 67.4, SOL bounced to 73.3 and then returned to balance around 70.4–72.9.
H1 RSI around 52 shows that short-term selling pressure has weakened, but a reliable bullish BOS has not yet appeared.
The current assessment is that SOL is in a sideways phase, sweeping liquidity above and possibly continuing to fall. The sweep above has not been confirmed.
Derivatives data shows about 79% of Bybit accounts are long, but funding is negative and taker buy is below 50%.
Above there is short liquidity at 72.84–73.20 and 73.92. Below there is long liquidity at 69.78–69.54 and 69.06.
This is an environment where both a short squeeze and a long trap may occur.
Price is compressing in the M15–H1 range, while short liquidity is relatively close above. A push up could trigger short stops and breakout buy orders.
If after the sweep price fails to hold the 73.2–73.9 zone, buying pressure may be absorbed and the H4 downtrend could take control again.
If H1 closes above 73.9 and the retest succeeds: cancel the short plan and shift to watching 75–76.8.
In the successful short scenario, price may test 70.4 AND 69.85.
Wait for price to sweep the 73.2–73.86 zone and then fail to hold resistance.
E 73.25
SL: 75.45.
TP: 69.85
Please note: H1 is currently SIDEWAY after a strong drop, not yet an uptrend.
The W–D1–H4 timeframe is still bearish, continuously forming Lower Highs and Lower Lows. Price is below the dynamic resistance zone, while RSI D1 and H12 are deeply oversold.
After the drop to around 67.4, SOL bounced to 73.3 and then returned to balance around 70.4–72.9.
H1 RSI around 52 shows that short-term selling pressure has weakened, but a reliable bullish BOS has not yet appeared.
The current assessment is that SOL is in a sideways phase, sweeping liquidity above and possibly continuing to fall. The sweep above has not been confirmed.
Derivatives data shows about 79% of Bybit accounts are long, but funding is negative and taker buy is below 50%.
Above there is short liquidity at 72.84–73.20 and 73.92. Below there is long liquidity at 69.78–69.54 and 69.06.
This is an environment where both a short squeeze and a long trap may occur.
Price is compressing in the M15–H1 range, while short liquidity is relatively close above. A push up could trigger short stops and breakout buy orders.
If after the sweep price fails to hold the 73.2–73.9 zone, buying pressure may be absorbed and the H4 downtrend could take control again.
If H1 closes above 73.9 and the retest succeeds: cancel the short plan and shift to watching 75–76.8.
In the successful short scenario, price may test 70.4 AND 69.85.
Wait for price to sweep the 73.2–73.86 zone and then fail to hold resistance.
E 73.25
SL: 75.45.
TP: 69.85
7
1
1.8k
URGENT, URGENT! MY TELEGRAM ACCOUNT HAS BEEN HACKED. IF YOU GET A MESSAGE ASKING TO BORROW MONEY OR TELLING YOU TO TRANSFER MONEY, DON'T SEND IT.
URGENT, URGENT! MY TELEGRAM ACCOUNT HAS BEEN HACKED. IF YOU GET A MESSAGE ASKING TO BORROW MONEY OR TELLING YOU TO TRANSFER MONEY, DON'T SEND IT.
220
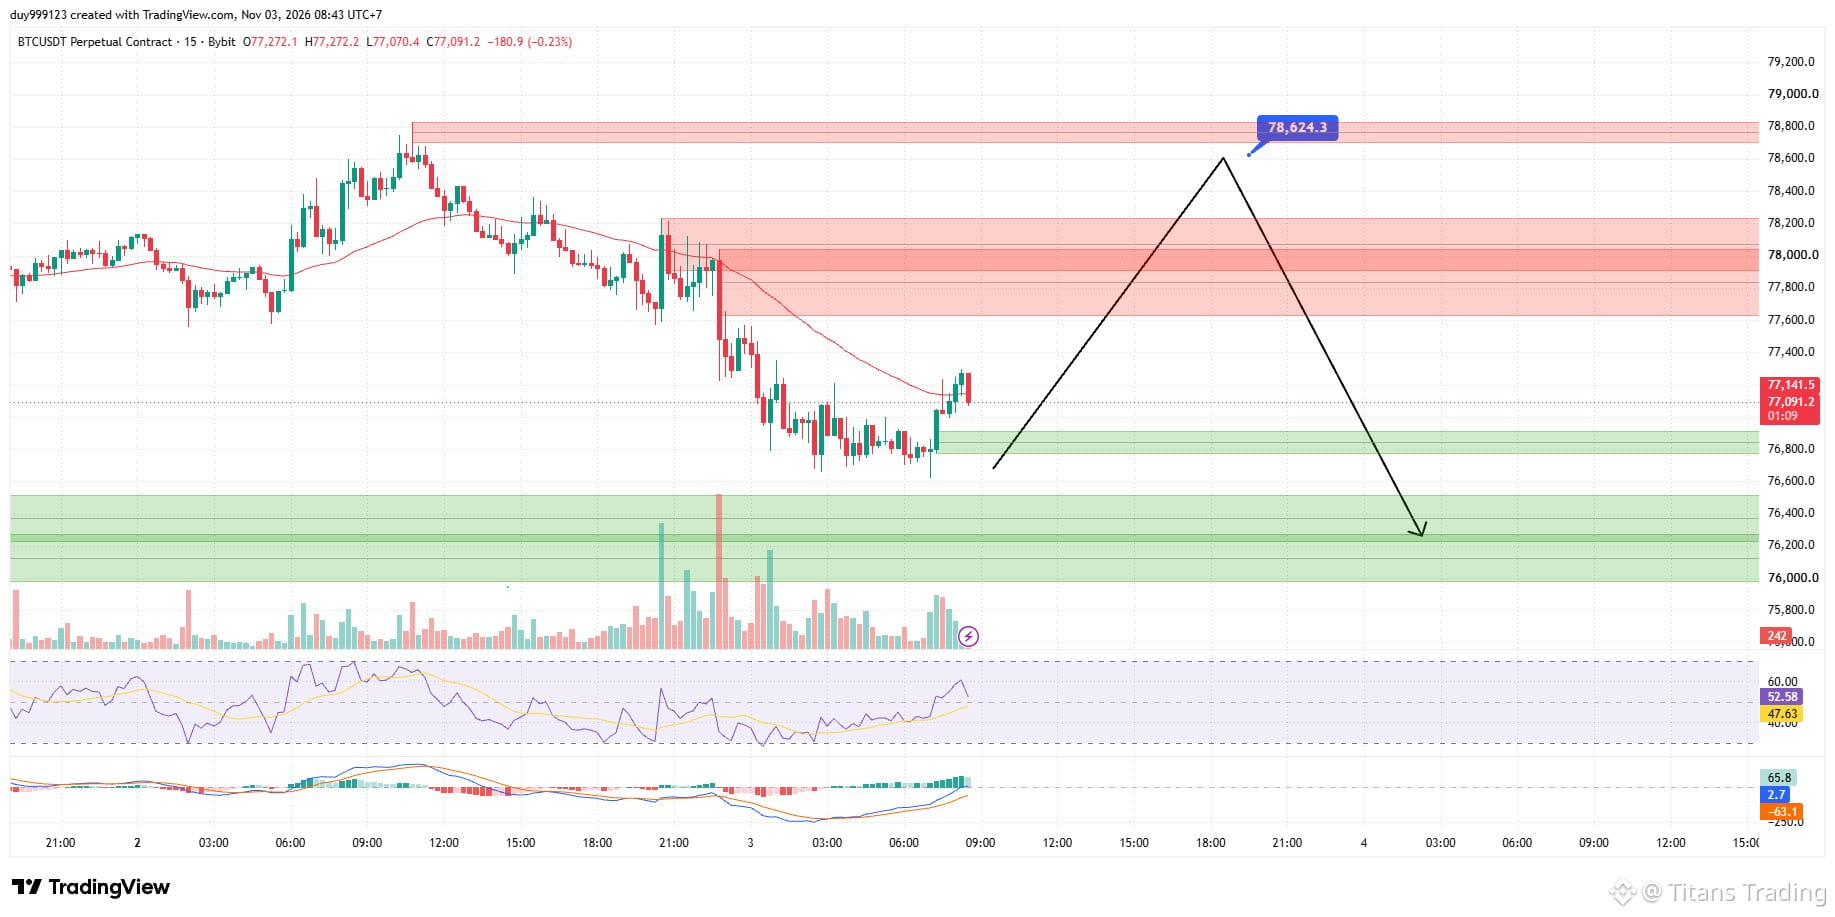
ANALYSIS #BTC ON 03/11: IS THE BOUNCE A TRAP? BTC MAY SWEEP THE 78,800 HIGH BEFORE DROPPING
H1 continues to show lower highs and lower lows. H1 RSI is around 44, below the neutral level of 50; MACD remains weak, with no confirmation of a bullish reversal.
Meanwhile, M15 RSI has recovered to nearly 60, and MACD has improved. This suggests short-term buying pressure is emerging, but it is not yet enough to change the H1 trend.
Watch for short entries, guys
ANALYSIS #BTC ON 03/11: IS THE BOUNCE A TRAP? BTC MAY SWEEP THE 78,800 HIGH BEFORE DROPPING
H1 continues to show lower highs and lower lows. H1 RSI is around 44, below the neutral level of 50; MACD remains weak, with no confirmation of a bullish reversal.
Meanwhile, M15 RSI has recovered to nearly 60, and MACD has improved. This suggests short-term buying pressure is emerging, but it is not yet enough to change the H1 trend.
Watch for short entries, guys
H1 continues to show lower highs and lower lows. H1 RSI is around 44, below the neutral level of 50; MACD remains weak, with no confirmation of a bullish reversal.
Meanwhile, M15 RSI has recovered to nearly 60, and MACD has improved. This suggests short-term buying pressure is emerging, but it is not yet enough to change the H1 trend.
Watch for short entries, guys
2
2k

·
--
Bearish
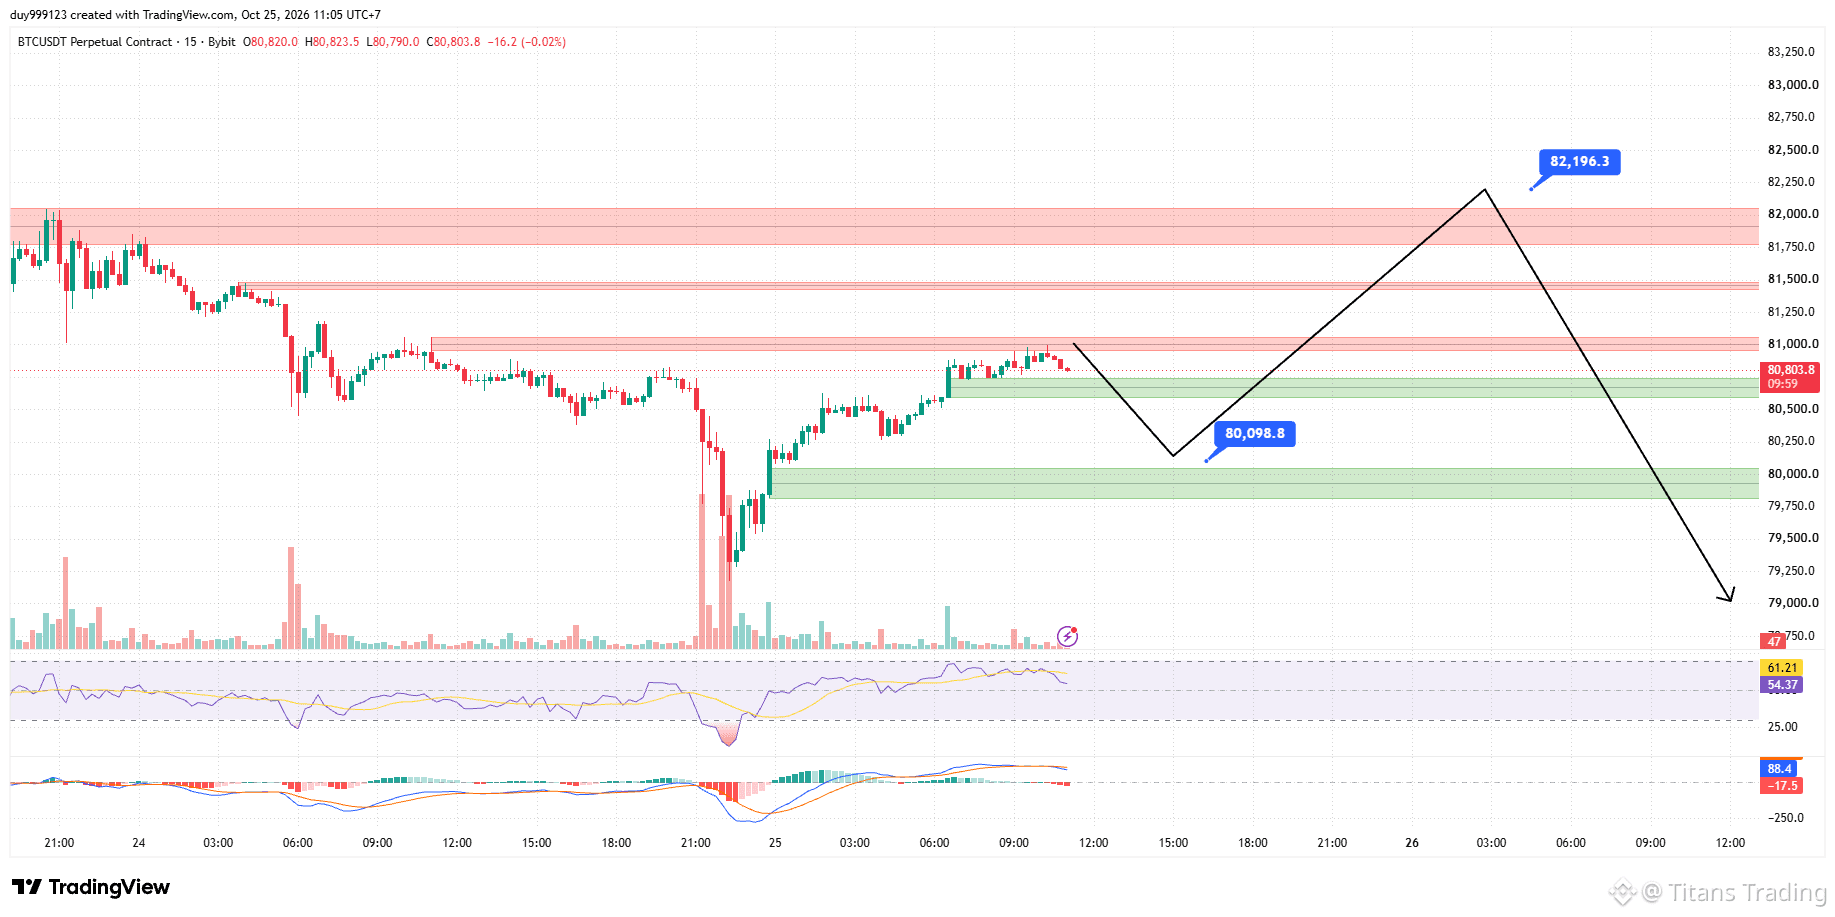
OUTLOOK #BTC FOR 25/10: BTC IS BOUNCING BACK UP — BUT COULD $81,900 BE A TRAP?
BTC is currently around $80,850. I lean toward a scenario where the price bounces up to sweep liquidity above before potentially resuming its decline. I wouldn’t prioritize chasing a Short at the current price.
H1 is showing a short-term BULLISH bounce, but the broader H4–H12–D trend structure still leans BEARISH.
BTC just swept the recent low near $79,190 and bounced back to $80,800.
The H1 RSI is around 53, and the MACD is recovering: short-term buying pressure is emerging.
However, BTC has yet to reclaim the $81,500–$82,200 supply zone to confirm a sustained reversal.
BTC could move up to the $81,500–$81,900 zone to test buy-side liquidity. If strong selling pressure appears there, BTC could continue lower to $80,300, or further down to $79,500–$79,200.
OUTLOOK #BTC FOR 25/10: BTC IS BOUNCING BACK UP — BUT COULD $81,900 BE A TRAP?
BTC is currently around $80,850. I lean toward a scenario where the price bounces up to sweep liquidity above before potentially resuming its decline. I wouldn’t prioritize chasing a Short at the current price.
H1 is showing a short-term BULLISH bounce, but the broader H4–H12–D trend structure still leans BEARISH.
BTC just swept the recent low near $79,190 and bounced back to $80,800.
The H1 RSI is around 53, and the MACD is recovering: short-term buying pressure is emerging.
However, BTC has yet to reclaim the $81,500–$82,200 supply zone to confirm a sustained reversal.
BTC could move up to the $81,500–$81,900 zone to test buy-side liquidity. If strong selling pressure appears there, BTC could continue lower to $80,300, or further down to $79,500–$79,200.
BTC is currently around $80,850. I lean toward a scenario where the price bounces up to sweep liquidity above before potentially resuming its decline. I wouldn’t prioritize chasing a Short at the current price.
H1 is showing a short-term BULLISH bounce, but the broader H4–H12–D trend structure still leans BEARISH.
BTC just swept the recent low near $79,190 and bounced back to $80,800.
The H1 RSI is around 53, and the MACD is recovering: short-term buying pressure is emerging.
However, BTC has yet to reclaim the $81,500–$82,200 supply zone to confirm a sustained reversal.
BTC could move up to the $81,500–$81,900 zone to test buy-side liquidity. If strong selling pressure appears there, BTC could continue lower to $80,300, or further down to $79,500–$79,200.
1
921
·
--
Bearish
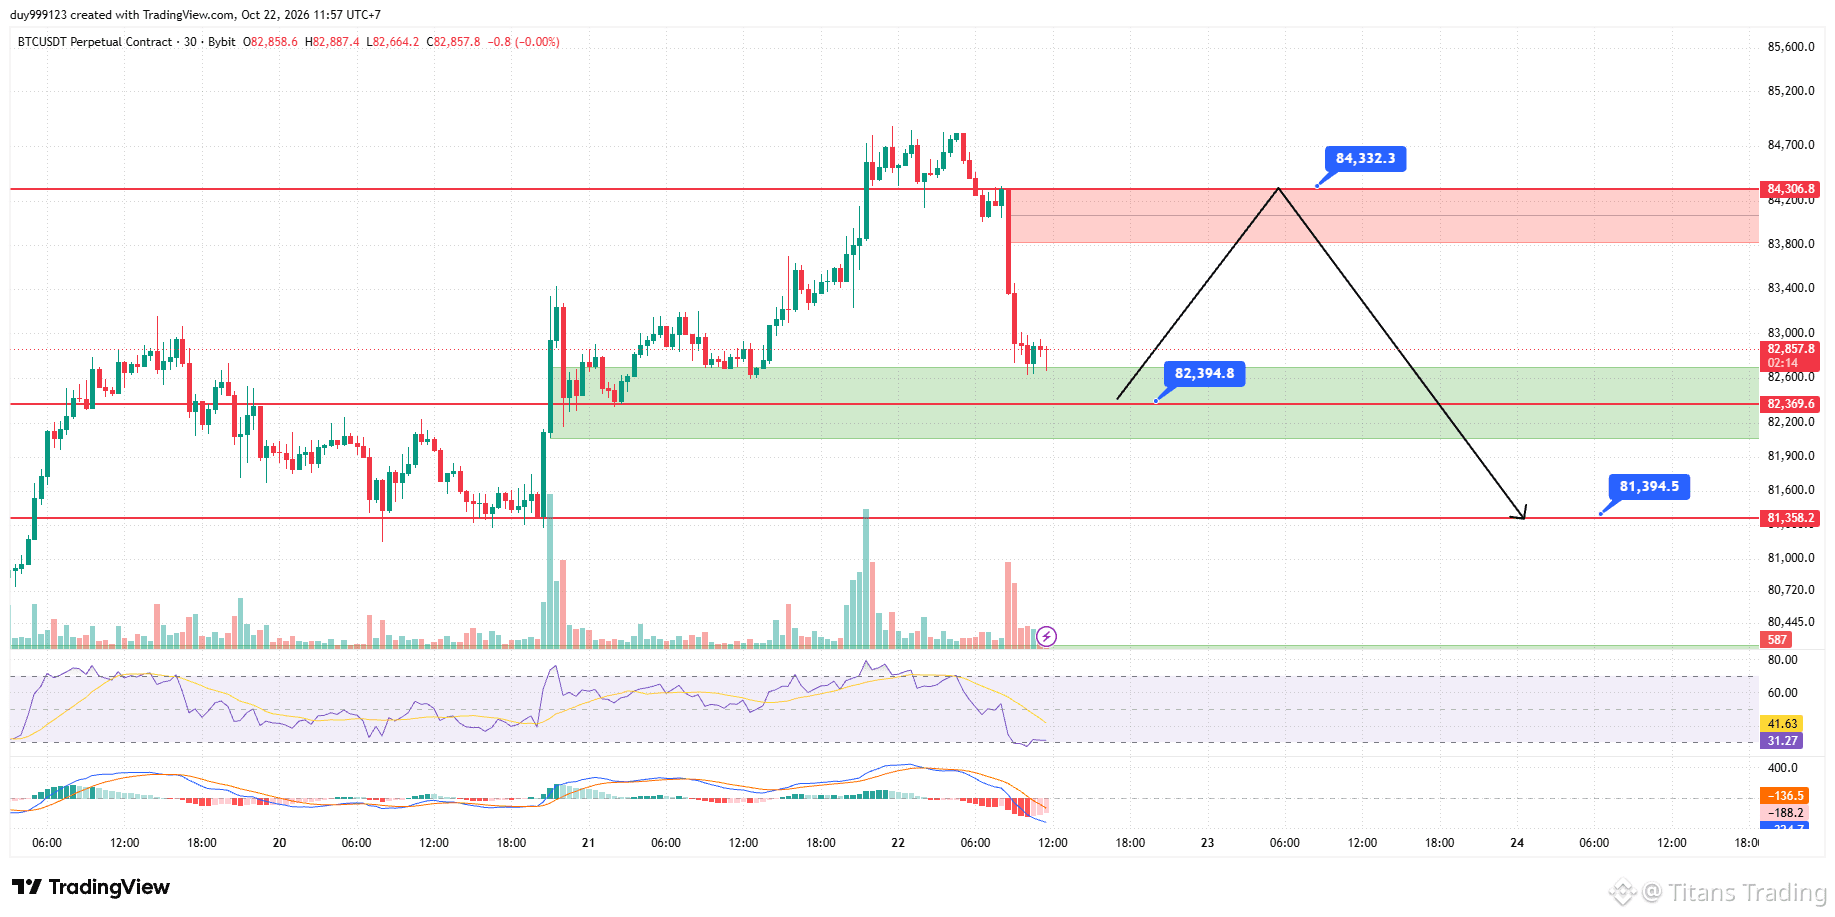
ANALYSIS #BTC FOR 22/10: IS THE DROP TO $82,800 THE BOTTOM, OR IS MM PREPARING FOR ANOTHER PUMP-AND-DUMP?
BTC was just rejected at $84,820, with a bearish BOS appearing on M15. The M15 RSI fell to 20.69 and the MACD is deeply negative, indicating that sellers are in control in the short term, although the price is also oversold.
Meanwhile, H4–H12 still have strong support. So don’t rush into chasing shorts here, guys.
BTC could sweep more liquidity down to $82,200–$82,550, followed by an expected B wave rebound to $84,340 to test the resistance zone and bearish FVG.
If M15 confirms a bearish reversal, wave C could take BTC down to $81,300
ANALYSIS #BTC FOR 22/10: IS THE DROP TO $82,800 THE BOTTOM, OR IS MM PREPARING FOR ANOTHER PUMP-AND-DUMP?
BTC was just rejected at $84,820, with a bearish BOS appearing on M15. The M15 RSI fell to 20.69 and the MACD is deeply negative, indicating that sellers are in control in the short term, although the price is also oversold.
Meanwhile, H4–H12 still have strong support. So don’t rush into chasing shorts here, guys.
BTC could sweep more liquidity down to $82,200–$82,550, followed by an expected B wave rebound to $84,340 to test the resistance zone and bearish FVG.
If M15 confirms a bearish reversal, wave C could take BTC down to $81,300
BTC was just rejected at $84,820, with a bearish BOS appearing on M15. The M15 RSI fell to 20.69 and the MACD is deeply negative, indicating that sellers are in control in the short term, although the price is also oversold.
Meanwhile, H4–H12 still have strong support. So don’t rush into chasing shorts here, guys.
BTC could sweep more liquidity down to $82,200–$82,550, followed by an expected B wave rebound to $84,340 to test the resistance zone and bearish FVG.
If M15 confirms a bearish reversal, wave C could take BTC down to $81,300
1
4
2.4k
·
--
Bearish
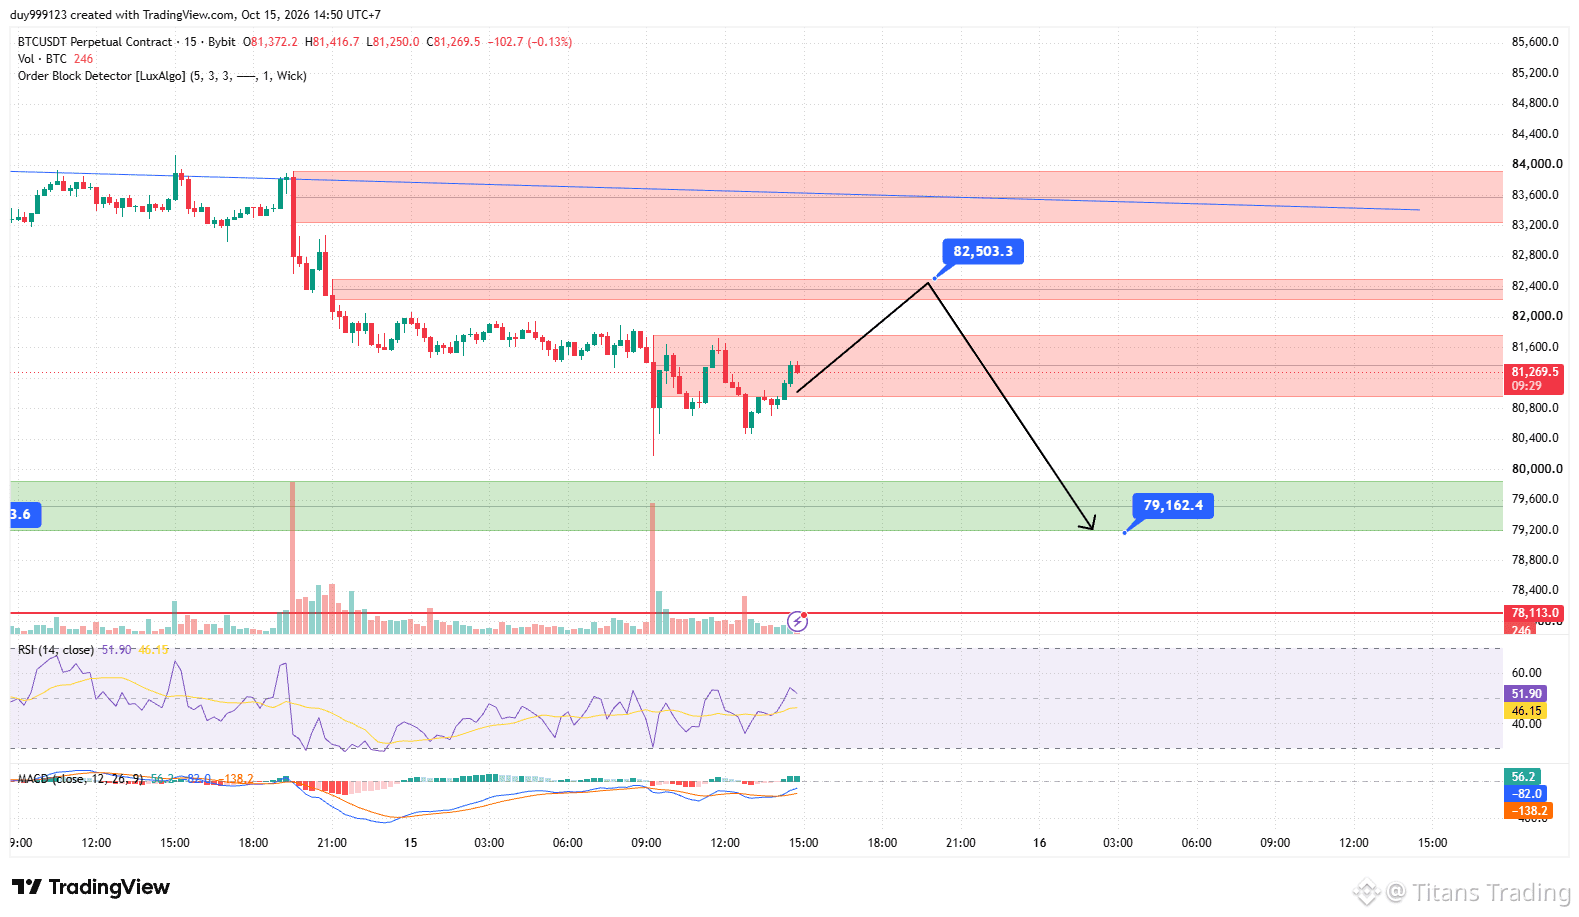
OUTLOOK #BTC DATE 15/10: THE PULLBACK TO 82,450 COULD BE A TRAP! #BTC ABOUT TO SWEEP BELOW 80,000
BTC is following the bearish wave C scenario. On H4–H1, the price is making lower highs and has lost support at 83,000–84,000; MACD is negative, and H4 RSI is around 35. There is still a bearish FVG overhead, with liquidity concentrated below around 80,000.
According to the current pattern, BTC could rebound into the supply zone to attract buyers, then reverse and sweep stop-losses below the low.
OUTLOOK #BTC DATE 15/10: THE PULLBACK TO 82,450 COULD BE A TRAP! #BTC ABOUT TO SWEEP BELOW 80,000
BTC is following the bearish wave C scenario. On H4–H1, the price is making lower highs and has lost support at 83,000–84,000; MACD is negative, and H4 RSI is around 35. There is still a bearish FVG overhead, with liquidity concentrated below around 80,000.
According to the current pattern, BTC could rebound into the supply zone to attract buyers, then reverse and sweep stop-losses below the low.
BTC is following the bearish wave C scenario. On H4–H1, the price is making lower highs and has lost support at 83,000–84,000; MACD is negative, and H4 RSI is around 35. There is still a bearish FVG overhead, with liquidity concentrated below around 80,000.
According to the current pattern, BTC could rebound into the supply zone to attract buyers, then reverse and sweep stop-losses below the low.
3
3.2k
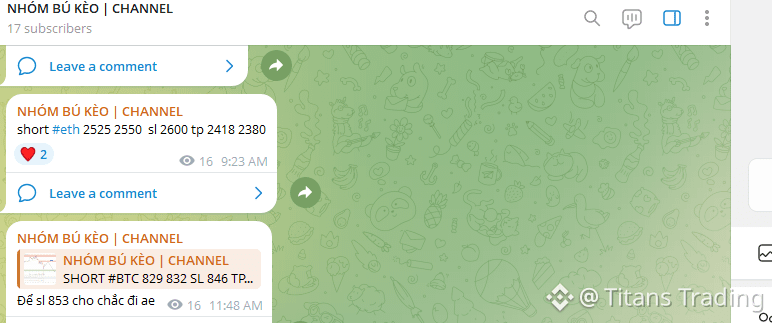
Anyone following my pick? #BTC
Anyone following my pick? #BTC
Titans Trading
·
--
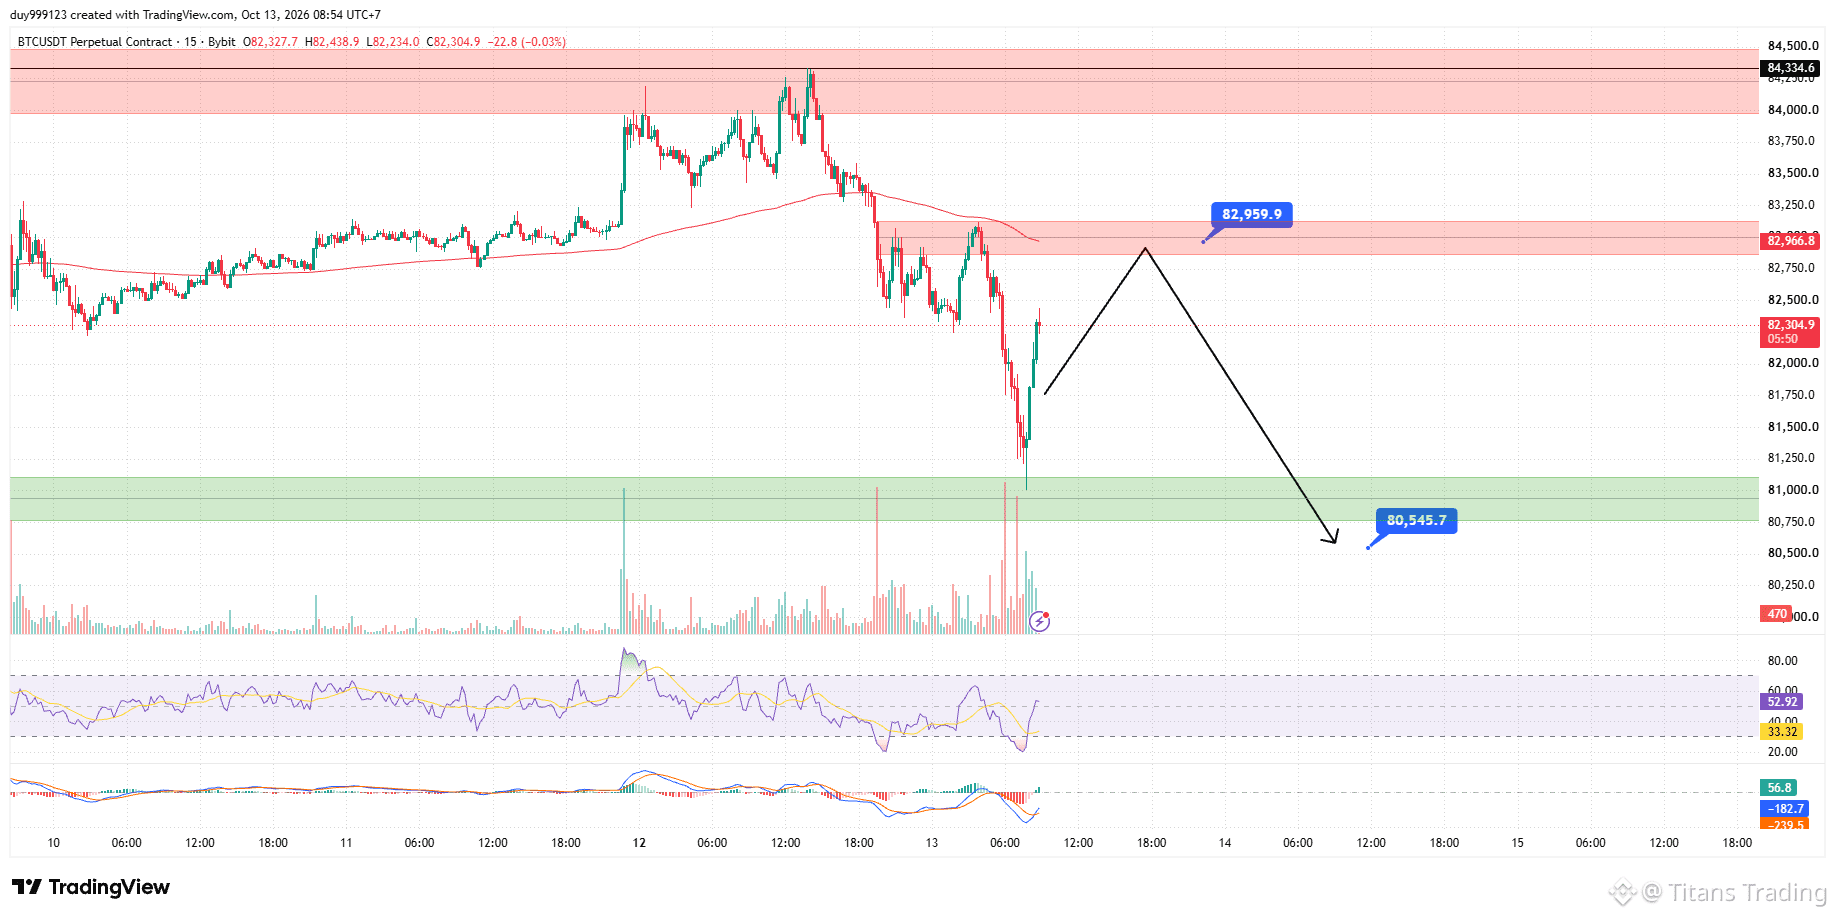
ANALYSIS #BTC FOR 13/10: IS THE MM ABOUT TO PUSH BTC UP TO 83,400 TO DUMP? THE TRAP BEFORE CPI!
BTC just swept the liquidity below 81,300 before bouncing back to 82,000. However, the H1–H3 charts are still making lower highs, RSI is below 40, and MACD is negative. The 82,800–83,400 FVG zone is acting as nearby resistance.
Based on the common liquidity-hunt pattern, price could be pushed up into the supply zone to sweep the Shorts’ Stop Losses and lure in chasing Longs, before turning back down to take the liquidity below 81,300–80,550.
BTC just swept the liquidity below 81,300 before bouncing back to 82,000. However, the H1–H3 charts are still making lower highs, RSI is below 40, and MACD is negative. The 82,800–83,400 FVG zone is acting as nearby resistance.
Based on the common liquidity-hunt pattern, price could be pushed up into the supply zone to sweep the Shorts’ Stop Losses and lure in chasing Longs, before turning back down to take the liquidity below 81,300–80,550.
365
ANALYSIS #BTC FOR 13/10: IS THE MM ABOUT TO PUSH BTC UP TO 83,400 TO DUMP? THE TRAP BEFORE CPI!
BTC just swept the liquidity below 81,300 before bouncing back to 82,000. However, the H1–H3 charts are still making lower highs, RSI is below 40, and MACD is negative. The 82,800–83,400 FVG zone is acting as nearby resistance.
Based on the common liquidity-hunt pattern, price could be pushed up into the supply zone to sweep the Shorts’ Stop Losses and lure in chasing Longs, before turning back down to take the liquidity below 81,300–80,550.
ANALYSIS #BTC FOR 13/10: IS THE MM ABOUT TO PUSH BTC UP TO 83,400 TO DUMP? THE TRAP BEFORE CPI!
BTC just swept the liquidity below 81,300 before bouncing back to 82,000. However, the H1–H3 charts are still making lower highs, RSI is below 40, and MACD is negative. The 82,800–83,400 FVG zone is acting as nearby resistance.
Based on the common liquidity-hunt pattern, price could be pushed up into the supply zone to sweep the Shorts’ Stop Losses and lure in chasing Longs, before turning back down to take the liquidity below 81,300–80,550.
BTC just swept the liquidity below 81,300 before bouncing back to 82,000. However, the H1–H3 charts are still making lower highs, RSI is below 40, and MACD is negative. The 82,800–83,400 FVG zone is acting as nearby resistance.
Based on the common liquidity-hunt pattern, price could be pushed up into the supply zone to sweep the Shorts’ Stop Losses and lure in chasing Longs, before turning back down to take the liquidity below 81,300–80,550.
2
1
5
3.3k
·
--
Bearish
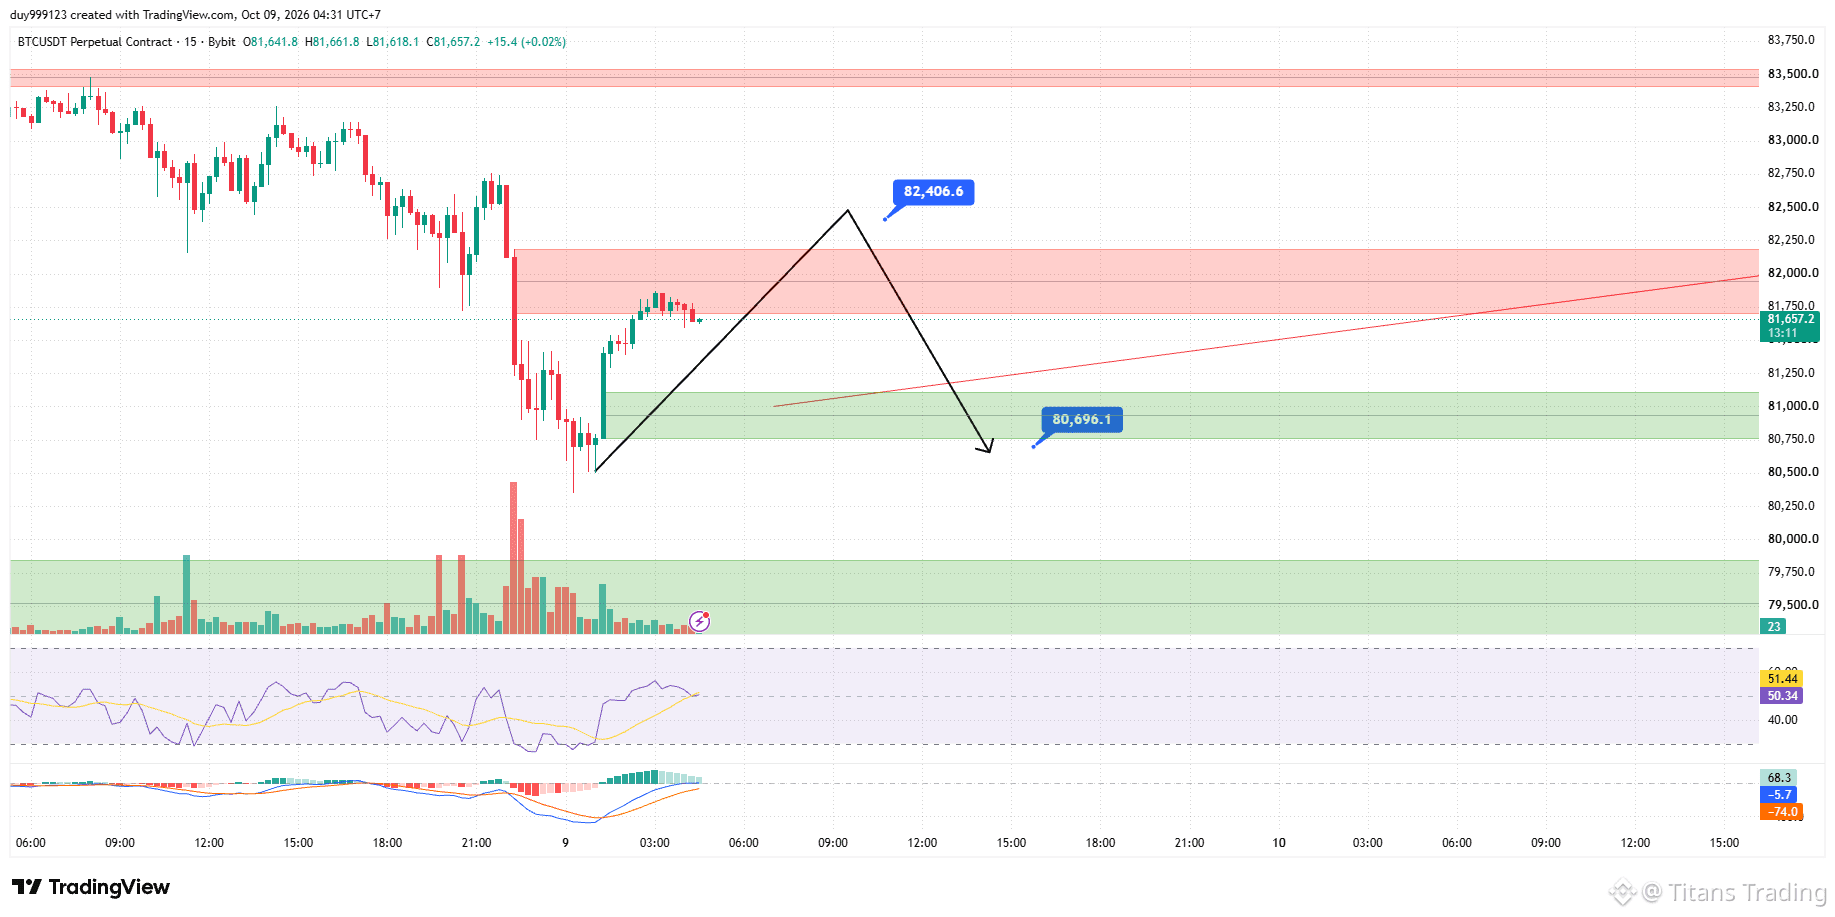
ASSESSMENT #BTC DATED 09/10: REBOUND TO 82,650 – GOOD OPPORTUNITY OR A LONG TRAP?
BTC has just swept the liquidity zone 80,400–80,600 and is currently making a technical rebound. RSI M15 has recovered above 50, but H4 is still near oversold; MACD H4 is bearish and the H1 structure continues to form lower highs.
In particular, above the price there is a bearish FVG supply at 82,200–82,750, and further out is 83,350–83,600.
The likelihood is that price #BTC may be pushed up into the supply zone to lure buy-side liquidity, and then reverse to test the bottom.
ASSESSMENT #BTC DATED 09/10: REBOUND TO 82,650 – GOOD OPPORTUNITY OR A LONG TRAP?
BTC has just swept the liquidity zone 80,400–80,600 and is currently making a technical rebound. RSI M15 has recovered above 50, but H4 is still near oversold; MACD H4 is bearish and the H1 structure continues to form lower highs.
In particular, above the price there is a bearish FVG supply at 82,200–82,750, and further out is 83,350–83,600.
The likelihood is that price #BTC may be pushed up into the supply zone to lure buy-side liquidity, and then reverse to test the bottom.
BTC has just swept the liquidity zone 80,400–80,600 and is currently making a technical rebound. RSI M15 has recovered above 50, but H4 is still near oversold; MACD H4 is bearish and the H1 structure continues to form lower highs.
In particular, above the price there is a bearish FVG supply at 82,200–82,750, and further out is 83,350–83,600.
The likelihood is that price #BTC may be pushed up into the supply zone to lure buy-side liquidity, and then reverse to test the bottom.
2
1
1.7k
·
--
Bearish
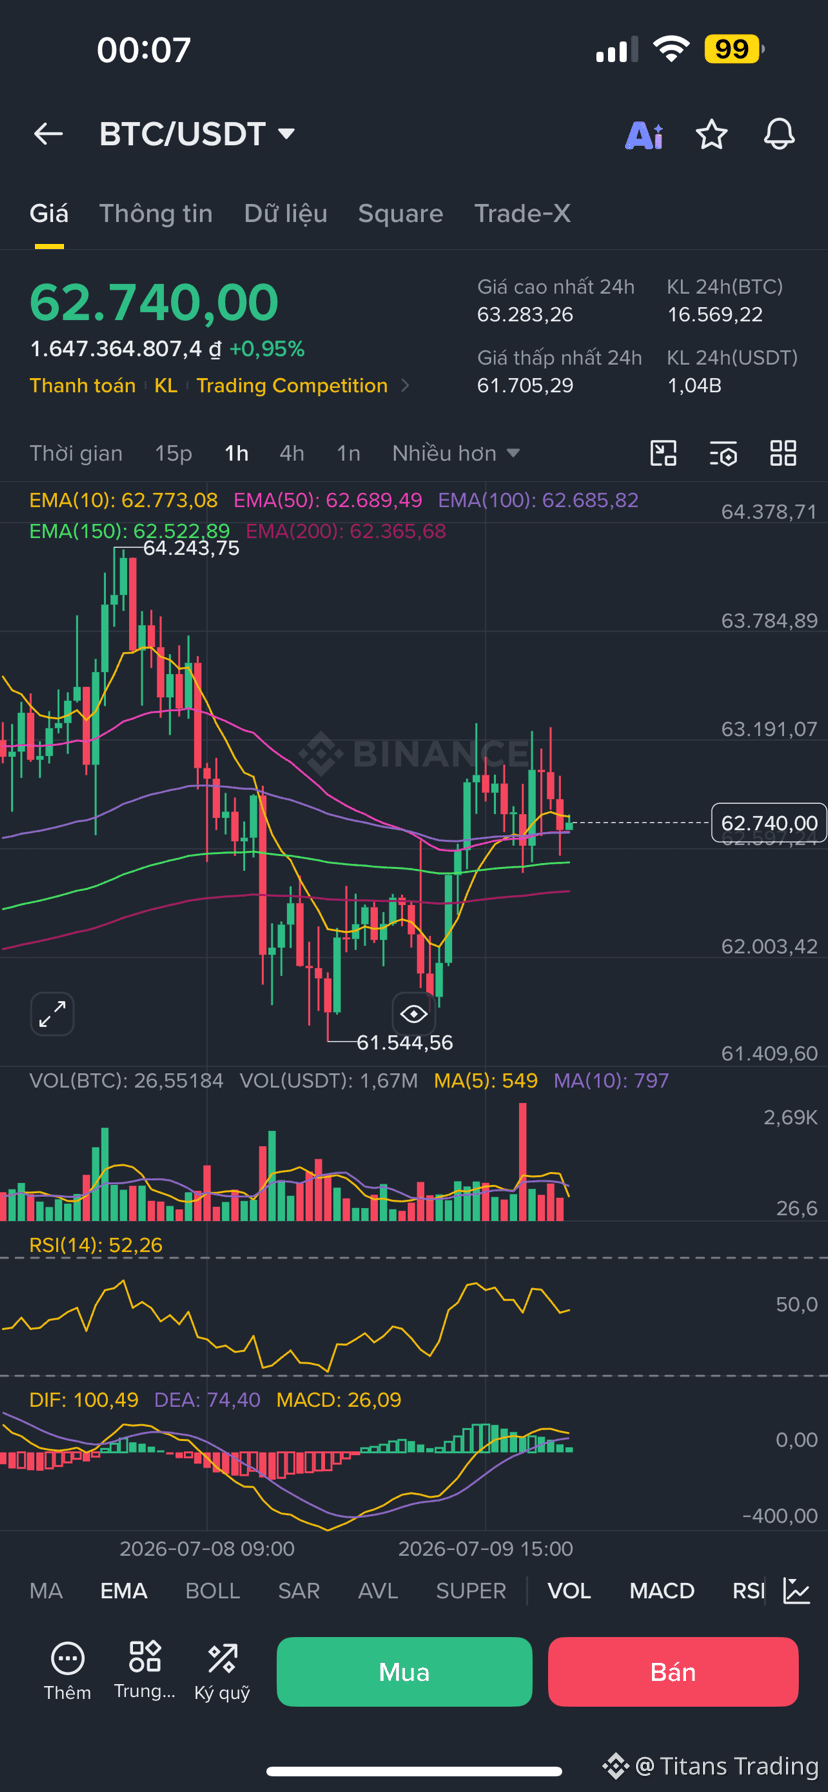
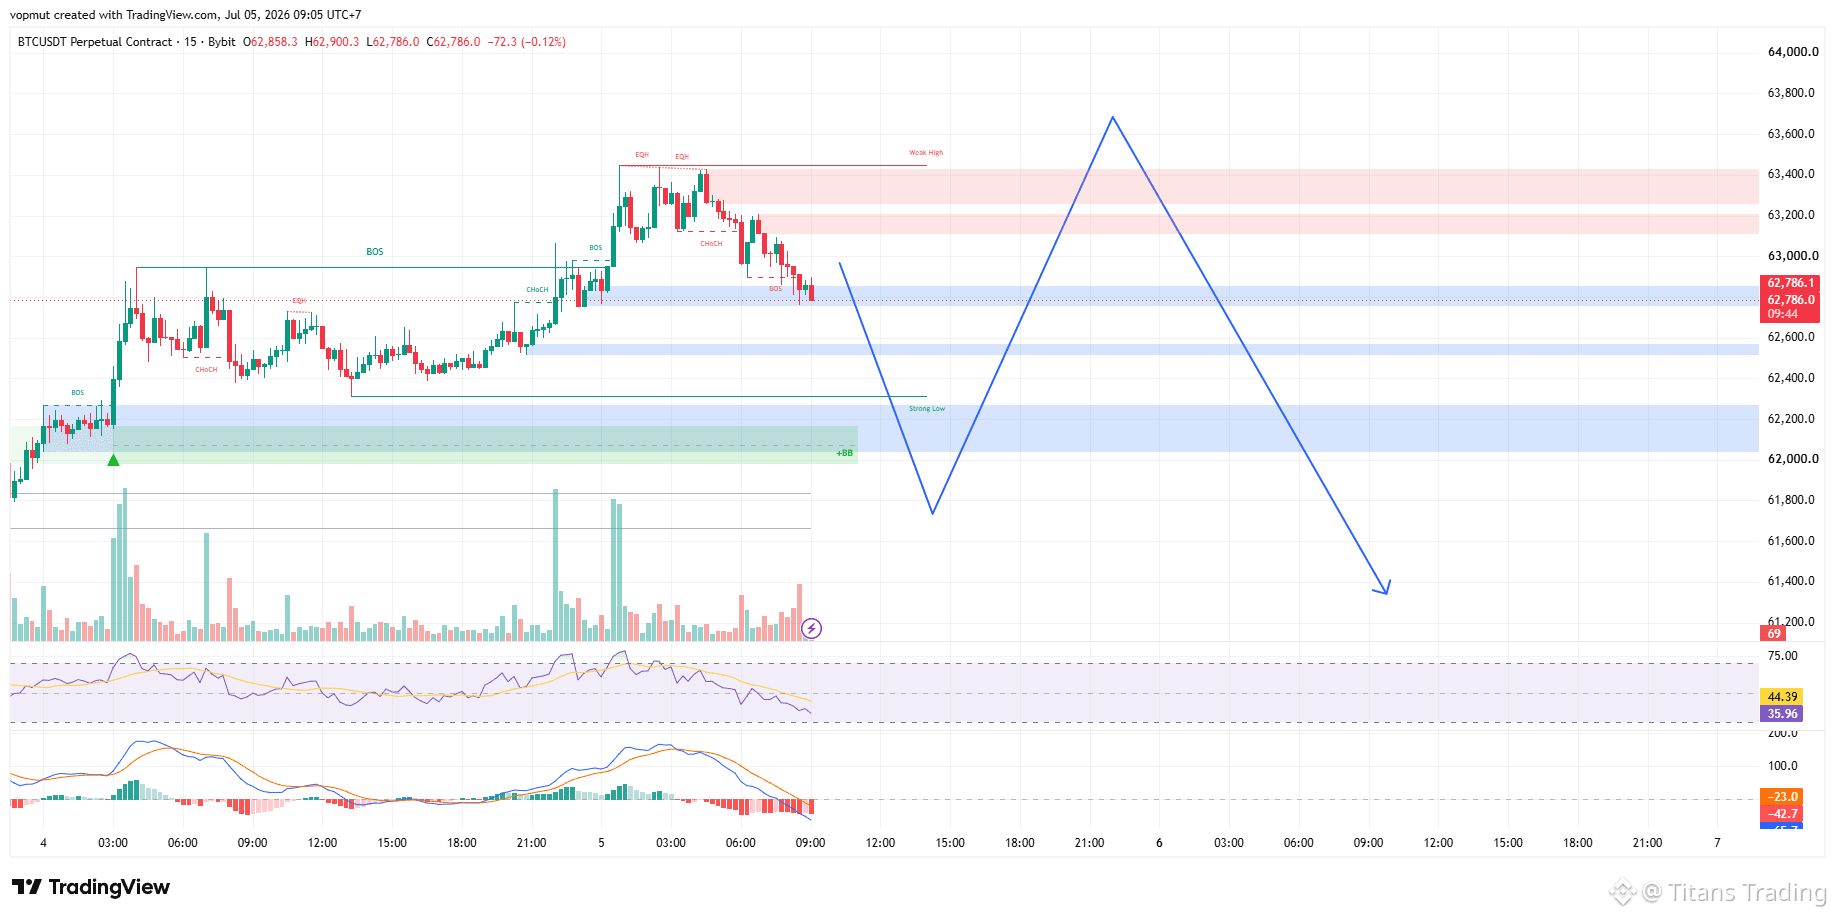
ASSESSMENT #BTC ON 05/07: CAN BTC PULL DOWN TO 62K BEFORE PUMPING?
BTC is currently around $62,841, near the middle of the short-term range; intraday high 63,395, low 62,296.
The chance is that BTC will sweep the lower wicks first, then rebound.
This is because M30/M15 just formed a short-term peak around 63.44k, after which momentum weakened and RSI/MACD cooled off. But H1/H4 have not broken down yet, so chasing shorts below 62.5k is risky. The best zone for BTC is a drop to 62.05k–61.75k to sweep long stops, lure retail into a short breakdown, then reclaim 62.55k and push back to 63.25k–63.44k. GO UP 642 IF POWERFUL (UPDATE LATER)
If BTC’s H1 closes below 61.30k, the long setup is invalid. Then price could easily move to 60.30k 59.70k 57.80k.
View the next 3 weeks
Over the next 3 weeks, BTC is still in the Accumulation / early Re-accumulation zone, without confirming a major Markup. For a clear bullish move, BTC needs to break above 63.60k, then break 67.30k. If 61.30k–60.60k can be held, the 3-week target is 67.30k - 70.10k - 73.00k. If 57.80k is lost, the entire accumulation count fails.
ASSESSMENT #BTC ON 05/07: CAN BTC PULL DOWN TO 62K BEFORE PUMPING?
BTC is currently around $62,841, near the middle of the short-term range; intraday high 63,395, low 62,296.
The chance is that BTC will sweep the lower wicks first, then rebound.
This is because M30/M15 just formed a short-term peak around 63.44k, after which momentum weakened and RSI/MACD cooled off. But H1/H4 have not broken down yet, so chasing shorts below 62.5k is risky. The best zone for BTC is a drop to 62.05k–61.75k to sweep long stops, lure retail into a short breakdown, then reclaim 62.55k and push back to 63.25k–63.44k. GO UP 642 IF POWERFUL (UPDATE LATER)
If BTC’s H1 closes below 61.30k, the long setup is invalid. Then price could easily move to 60.30k 59.70k 57.80k.
View the next 3 weeks
Over the next 3 weeks, BTC is still in the Accumulation / early Re-accumulation zone, without confirming a major Markup. For a clear bullish move, BTC needs to break above 63.60k, then break 67.30k. If 61.30k–60.60k can be held, the 3-week target is 67.30k - 70.10k - 73.00k. If 57.80k is lost, the entire accumulation count fails.
BTC is currently around $62,841, near the middle of the short-term range; intraday high 63,395, low 62,296.
The chance is that BTC will sweep the lower wicks first, then rebound.
This is because M30/M15 just formed a short-term peak around 63.44k, after which momentum weakened and RSI/MACD cooled off. But H1/H4 have not broken down yet, so chasing shorts below 62.5k is risky. The best zone for BTC is a drop to 62.05k–61.75k to sweep long stops, lure retail into a short breakdown, then reclaim 62.55k and push back to 63.25k–63.44k. GO UP 642 IF POWERFUL (UPDATE LATER)
If BTC’s H1 closes below 61.30k, the long setup is invalid. Then price could easily move to 60.30k 59.70k 57.80k.
View the next 3 weeks
Over the next 3 weeks, BTC is still in the Accumulation / early Re-accumulation zone, without confirming a major Markup. For a clear bullish move, BTC needs to break above 63.60k, then break 67.30k. If 61.30k–60.60k can be held, the 3-week target is 67.30k - 70.10k - 73.00k. If 57.80k is lost, the entire accumulation count fails.
4
1.8k
·
--
Bullish
ASSESSMENT #BTC DATED 03/07: 62K COULD BE THE TRAP BEFORE BTC SWEEPS LIQUIDITY DEEP
Current price: around 61.5k.
24h view: you shouldn’t go Long/Short right away because BTC is in a mid-range 61.15k–61.85k, the noisiest zone.
According to how BTC usually does it, the preferred scenario is:
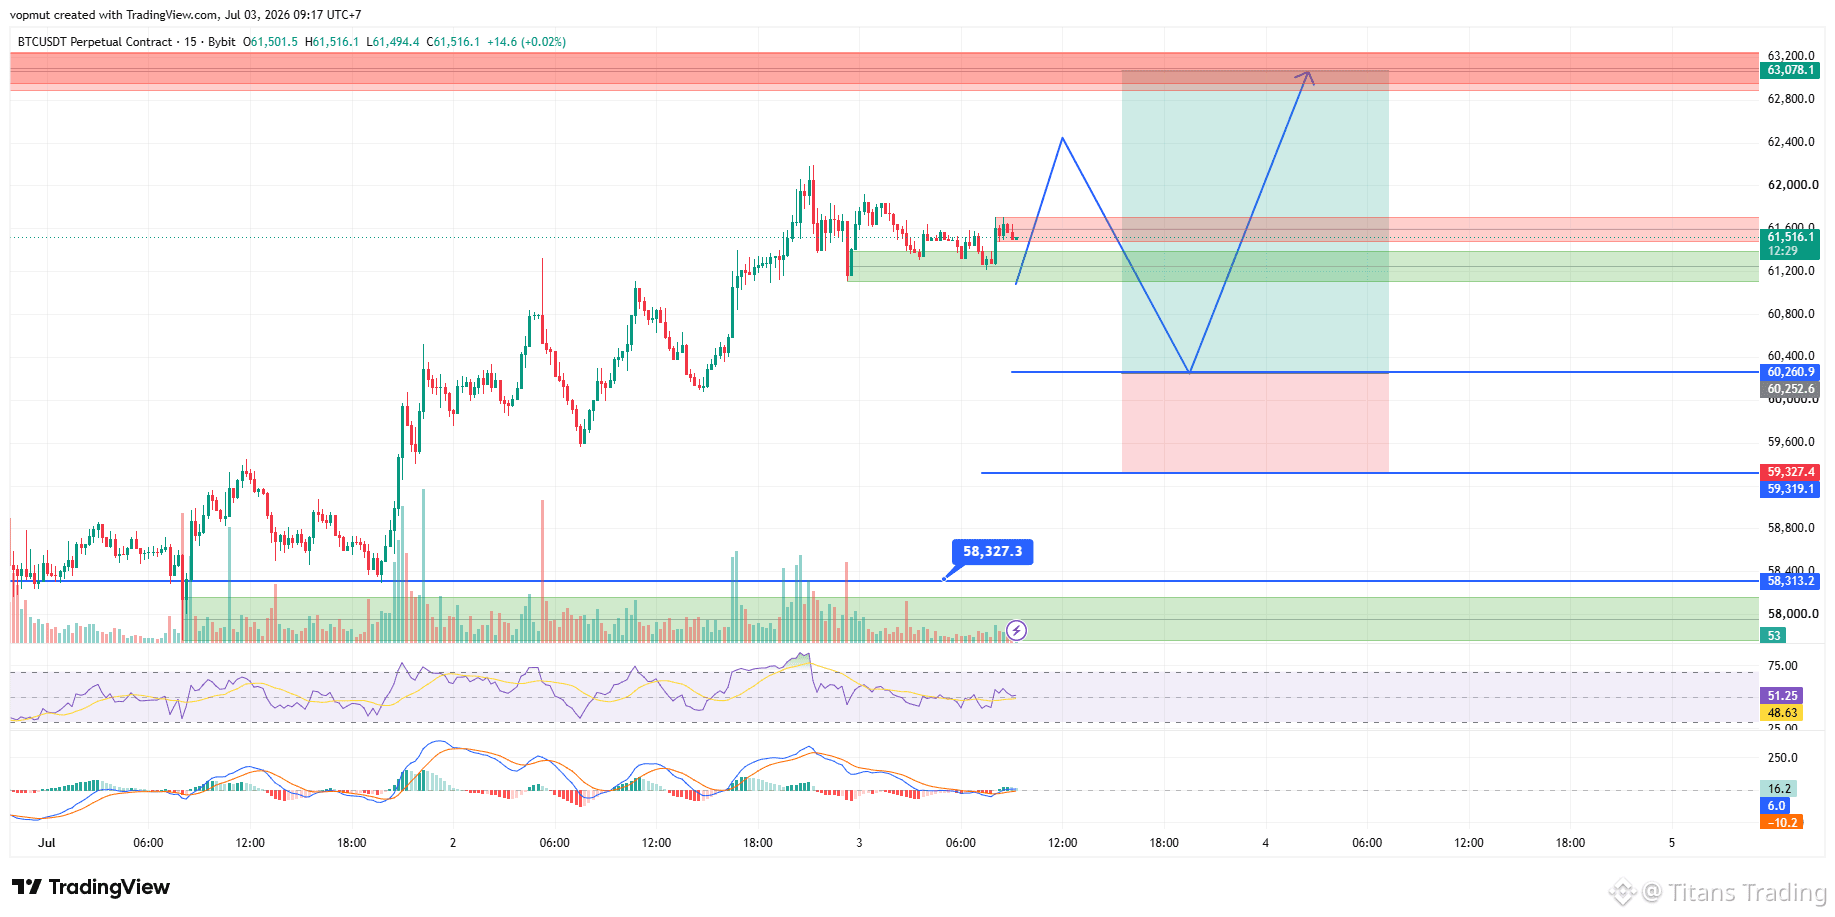
from 61.5k sweeping up to 62.05k–62.65k to lure a Long breakout / force Short cover, then dumping down to 60.85k–60.12k—deep wicks could reach 59.56k. If it reclaims 60.85k, then it may pull back up to 62.25k–63.65k.
Reason: On M30/H1, BTC just rebounded strongly from 57.8k to 62.2k, but it hasn’t broken through the supply 62.05k–62.65k yet. Above, there are Short stops; below, there are Long stops chasing price around 60.8k–61.5k. So BTC has the motive to sweep both ends first, then choose a direction.
Main probabilities:
Brothers, don’t Long at 61.5k. Wait for BTC to dip to: 596–603, LOOKING TO LONG
Only Long if M15 reclaims 60,850
SL: 59000
TP1: 62,250
TP2: 63,650
TP3: 67,300
If after 24h the price doesn’t dip and H1 closes above 62.65k and the retest holds 62.2k, skip the deep-wick Long idea and switch to waiting for the retest breakout.
ASSESSMENT #BTC DATED 03/07: 62K COULD BE THE TRAP BEFORE BTC SWEEPS LIQUIDITY DEEP
Current price: around 61.5k.
24h view: you shouldn’t go Long/Short right away because BTC is in a mid-range 61.15k–61.85k, the noisiest zone.
According to how BTC usually does it, the preferred scenario is:
from 61.5k sweeping up to 62.05k–62.65k to lure a Long breakout / force Short cover, then dumping down to 60.85k–60.12k—deep wicks could reach 59.56k. If it reclaims 60.85k, then it may pull back up to 62.25k–63.65k.
Reason: On M30/H1, BTC just rebounded strongly from 57.8k to 62.2k, but it hasn’t broken through the supply 62.05k–62.65k yet. Above, there are Short stops; below, there are Long stops chasing price around 60.8k–61.5k. So BTC has the motive to sweep both ends first, then choose a direction.
Main probabilities:
Brothers, don’t Long at 61.5k. Wait for BTC to dip to: 596–603, LOOKING TO LONG
Only Long if M15 reclaims 60,850
SL: 59000
TP1: 62,250
TP2: 63,650
TP3: 67,300
If after 24h the price doesn’t dip and H1 closes above 62.65k and the retest holds 62.2k, skip the deep-wick Long idea and switch to waiting for the retest breakout.
Current price: around 61.5k.
24h view: you shouldn’t go Long/Short right away because BTC is in a mid-range 61.15k–61.85k, the noisiest zone.
According to how BTC usually does it, the preferred scenario is:
from 61.5k sweeping up to 62.05k–62.65k to lure a Long breakout / force Short cover, then dumping down to 60.85k–60.12k—deep wicks could reach 59.56k. If it reclaims 60.85k, then it may pull back up to 62.25k–63.65k.
Reason: On M30/H1, BTC just rebounded strongly from 57.8k to 62.2k, but it hasn’t broken through the supply 62.05k–62.65k yet. Above, there are Short stops; below, there are Long stops chasing price around 60.8k–61.5k. So BTC has the motive to sweep both ends first, then choose a direction.
Main probabilities:
Brothers, don’t Long at 61.5k. Wait for BTC to dip to: 596–603, LOOKING TO LONG
Only Long if M15 reclaims 60,850
SL: 59000
TP1: 62,250
TP2: 63,650
TP3: 67,300
If after 24h the price doesn’t dip and H1 closes above 62.65k and the retest holds 62.2k, skip the deep-wick Long idea and switch to waiting for the retest breakout.
6
7
1.8k
·
--
Bullish
ASSESSMENT #BTC ON 02/07: 60K IS NOT YET BROKEN – BTC STILL WANTS TO TAKE THE BEARDS BEFORE RISING
BTC is currently around 60,132, with the daily range at 58,279–61,030.
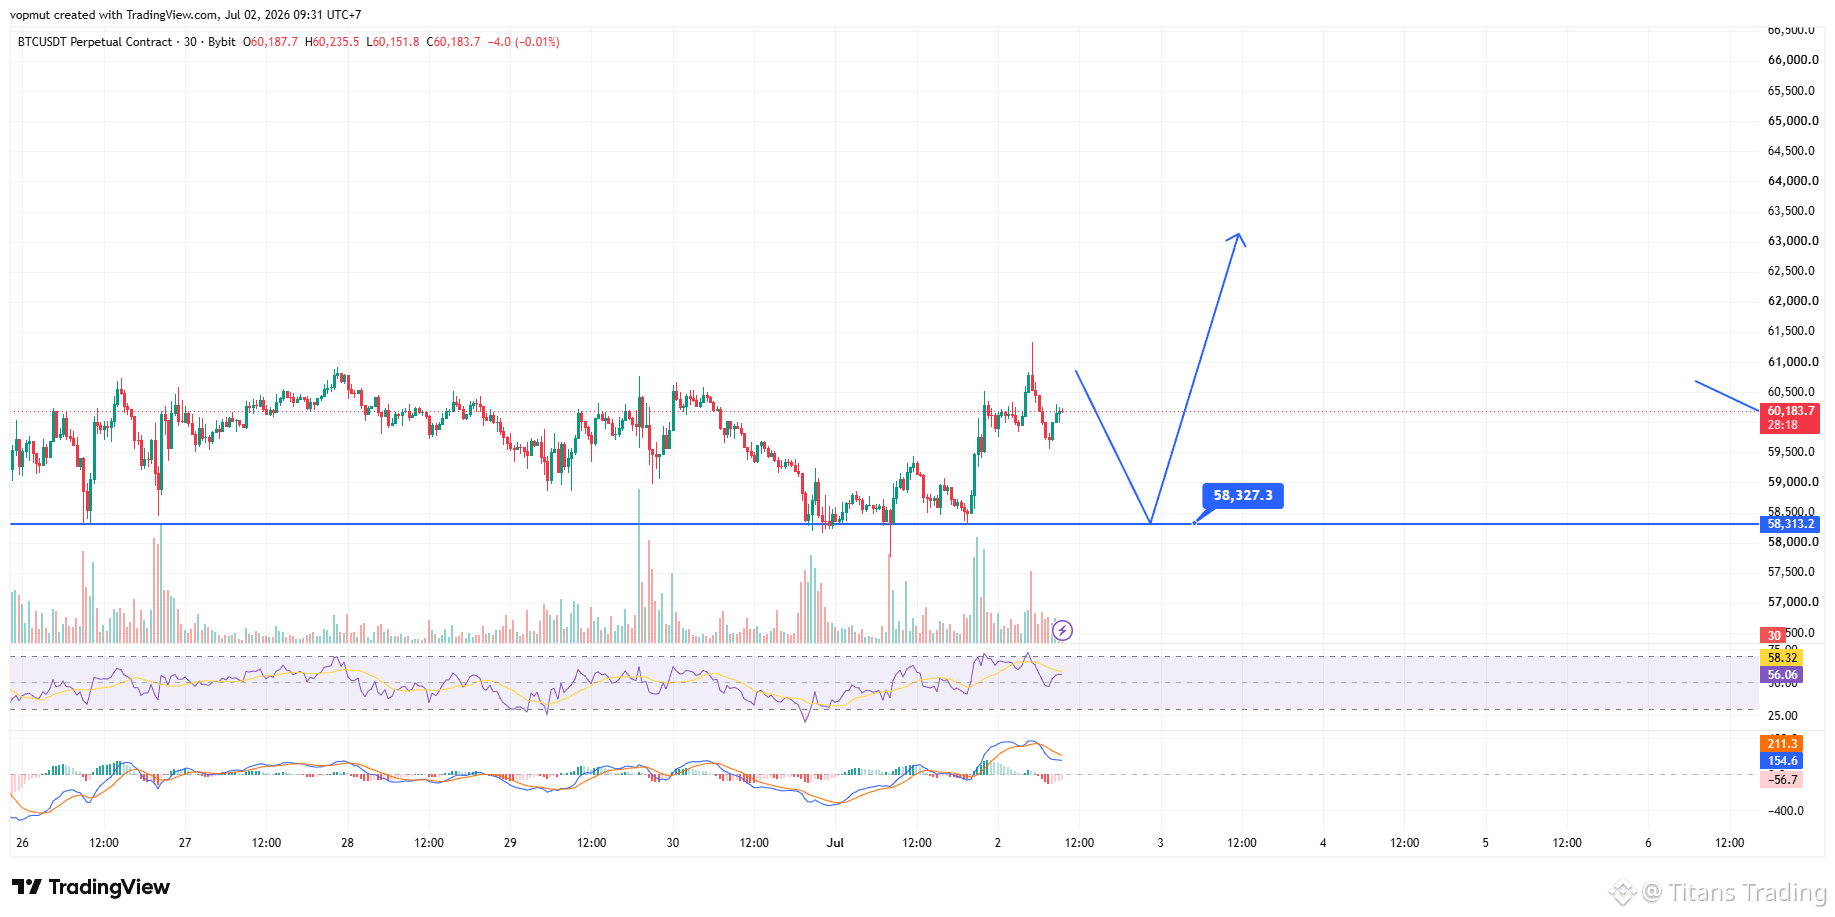
BTC is running a two-sided range trap, but the priority is to sweep downward first, then rebound. Reason: BTC was rejected around 61,030–61,350 and is getting stuck in the middle of the range at 59,700–60,400. This is a zone that should not be entered. BTC usually won’t allow the price to run cleanly from the middle of the range; instead, it will pull down to take the long stop below 59,300—deeper at 58,850–58,300—then see whether it reclaims 59,800–60,100.
If price sweeps up first to 61,030–61,350 but M30/H1 closes back below 60,600, that’s a bull trap; then BTC is likely to return to 59,500–58,850.
Brothers, do not go long at 60k. Wait for BTC to sweep the wicks downward:
Long Entry: 58,850 – 58,300, only when M15–M30 reclaim 59,800–60,100
SL 57,450
TP1: 60,650
TP2: 61,350
TP3: 62,300 if H1 closes above 61,350
ASSESSMENT #BTC ON 02/07: 60K IS NOT YET BROKEN – BTC STILL WANTS TO TAKE THE BEARDS BEFORE RISING
BTC is currently around 60,132, with the daily range at 58,279–61,030.
BTC is running a two-sided range trap, but the priority is to sweep downward first, then rebound. Reason: BTC was rejected around 61,030–61,350 and is getting stuck in the middle of the range at 59,700–60,400. This is a zone that should not be entered. BTC usually won’t allow the price to run cleanly from the middle of the range; instead, it will pull down to take the long stop below 59,300—deeper at 58,850–58,300—then see whether it reclaims 59,800–60,100.
If price sweeps up first to 61,030–61,350 but M30/H1 closes back below 60,600, that’s a bull trap; then BTC is likely to return to 59,500–58,850.
Brothers, do not go long at 60k. Wait for BTC to sweep the wicks downward:
Long Entry: 58,850 – 58,300, only when M15–M30 reclaim 59,800–60,100
SL 57,450
TP1: 60,650
TP2: 61,350
TP3: 62,300 if H1 closes above 61,350
BTC is currently around 60,132, with the daily range at 58,279–61,030.
BTC is running a two-sided range trap, but the priority is to sweep downward first, then rebound. Reason: BTC was rejected around 61,030–61,350 and is getting stuck in the middle of the range at 59,700–60,400. This is a zone that should not be entered. BTC usually won’t allow the price to run cleanly from the middle of the range; instead, it will pull down to take the long stop below 59,300—deeper at 58,850–58,300—then see whether it reclaims 59,800–60,100.
If price sweeps up first to 61,030–61,350 but M30/H1 closes back below 60,600, that’s a bull trap; then BTC is likely to return to 59,500–58,850.
Brothers, do not go long at 60k. Wait for BTC to sweep the wicks downward:
Long Entry: 58,850 – 58,300, only when M15–M30 reclaim 59,800–60,100
SL 57,450
TP1: 60,650
TP2: 61,350
TP3: 62,300 if H1 closes above 61,350
8
1.7k
·
--
Bullish
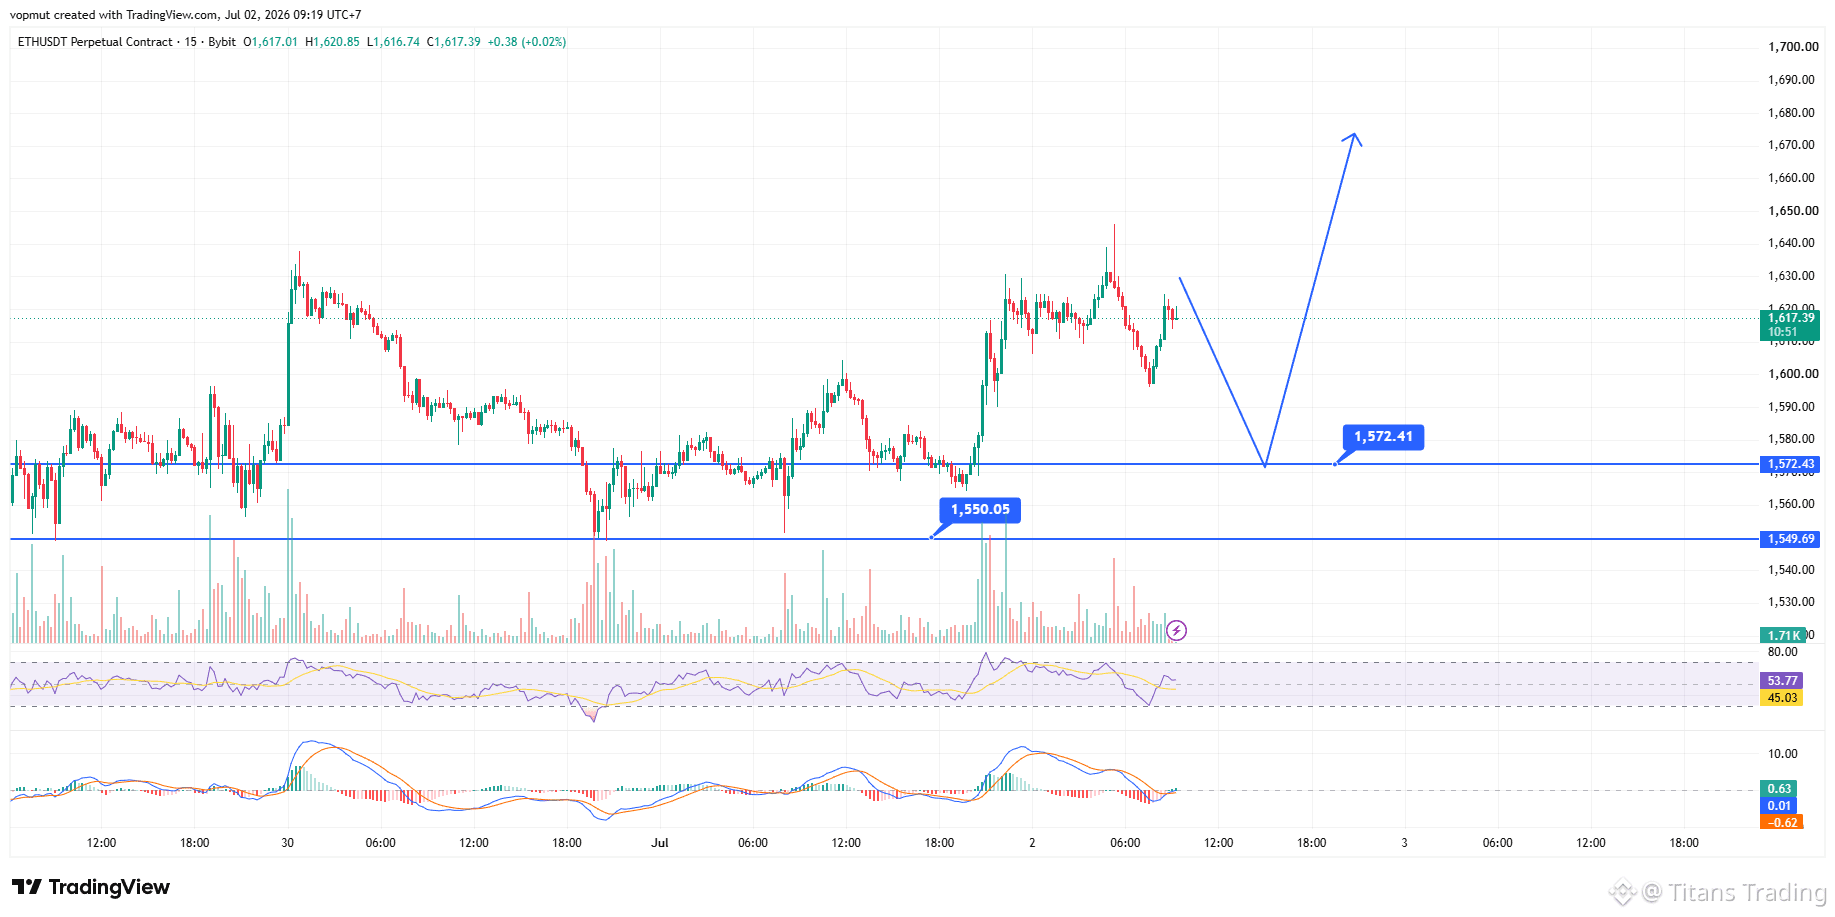
ASSESSMENT #ETH ON JULY 02: MM IS SETTING A TRAP — DON’T CHASE IN THE MIDDLE OF THE RANGE
ETH is hovering around 1,617, which is within the 1,596–1,645 range, so there’s no edge to enter the market right now. The most common move for ETH at this time is to push the price slightly up into 1,628–1,637 to create a breakout illusion, then shake it down to grab liquidity below 1,596—deeper would be 1,580–1,564—before reclaiming to drive it back up to 1,628–1,645–1,668. Since below 1,596 there are stop-losses for longs and the short breakdown is triggered only; above 1,645–1,668 there are buy-stops for shorts. ETH often sweeps below first to collect cheaper liquidity, then pulls it up toward buy-side liquidity.
Bro, wait for ETH to bounce/flush back to 1,580–1,564, then Long when it reclaims.
Entry: 1,588 -1572
SL 1,545
TP1: 1,628
TP2: 1,645
TP3: 1,660–1,668
View for the next 3 weeks: ETH is still in late markdown — early accumulation; it’s not markup yet. If it can hold the 1,508–1,548 zone, price may accumulate and then rebound toward 1,720–1,775–1,846. But if the daily closes below 1,508, the accumulation structure breaks, and the downside targets open up toward 1,340–1,250.
ASSESSMENT #ETH ON JULY 02: MM IS SETTING A TRAP — DON’T CHASE IN THE MIDDLE OF THE RANGE
ETH is hovering around 1,617, which is within the 1,596–1,645 range, so there’s no edge to enter the market right now. The most common move for ETH at this time is to push the price slightly up into 1,628–1,637 to create a breakout illusion, then shake it down to grab liquidity below 1,596—deeper would be 1,580–1,564—before reclaiming to drive it back up to 1,628–1,645–1,668. Since below 1,596 there are stop-losses for longs and the short breakdown is triggered only; above 1,645–1,668 there are buy-stops for shorts. ETH often sweeps below first to collect cheaper liquidity, then pulls it up toward buy-side liquidity.
Bro, wait for ETH to bounce/flush back to 1,580–1,564, then Long when it reclaims.
Entry: 1,588 -1572
SL 1,545
TP1: 1,628
TP2: 1,645
TP3: 1,660–1,668
View for the next 3 weeks: ETH is still in late markdown — early accumulation; it’s not markup yet. If it can hold the 1,508–1,548 zone, price may accumulate and then rebound toward 1,720–1,775–1,846. But if the daily closes below 1,508, the accumulation structure breaks, and the downside targets open up toward 1,340–1,250.
ETH is hovering around 1,617, which is within the 1,596–1,645 range, so there’s no edge to enter the market right now. The most common move for ETH at this time is to push the price slightly up into 1,628–1,637 to create a breakout illusion, then shake it down to grab liquidity below 1,596—deeper would be 1,580–1,564—before reclaiming to drive it back up to 1,628–1,645–1,668. Since below 1,596 there are stop-losses for longs and the short breakdown is triggered only; above 1,645–1,668 there are buy-stops for shorts. ETH often sweeps below first to collect cheaper liquidity, then pulls it up toward buy-side liquidity.
Bro, wait for ETH to bounce/flush back to 1,580–1,564, then Long when it reclaims.
Entry: 1,588 -1572
SL 1,545
TP1: 1,628
TP2: 1,645
TP3: 1,660–1,668
View for the next 3 weeks: ETH is still in late markdown — early accumulation; it’s not markup yet. If it can hold the 1,508–1,548 zone, price may accumulate and then rebound toward 1,720–1,775–1,846. But if the daily closes below 1,508, the accumulation structure breaks, and the downside targets open up toward 1,340–1,250.
1
3
2.2k
·
--
Bullish
Assessing #ETH on June 30: ETH is calling a trap at the bottom—don’t go long too early
ETH is currently around 1,591. The big picture is still “accumulation markdown”—it’s building at the bottom, and no reversal has been confirmed yet. In the next 24 hours, the preferred view for how ETH typically behaves is: dip lower first, sweep liquidity below 1,560–1,547, then decide whether to pull back up or truly break the bottom.
Reason: ETH just bounced from the 1,638 area but couldn’t hold. That means a minor breakout failed—the long positions chasing are getting stuck. When price returns to the middle of the range 1,585–1,605, ETH usually doesn’t push straight up right away; instead, it pulls down toward the long positions’ stop-loss first. The “wick” zone to watch is 1,560–1,547; deeper is 1,512–1,500.
ETH is likely to range around 1,585–1,605, then see a downward push to 1,560–1,547. If here you get a lower wick sweep but M15/M30 closes back above 1,585–1,590, that’s a sign of a short trap / Spring Test. In that case, ETH could rebound to 1,605–1,638–1,660. Conversely, if H1 closes below 1,547 and the retest of 1,560 fails, the rebound scenario is invalidated and price is more likely to drop to 1,512–1,500.
ETH is in a zone where a Wyckoff Accumulation Phase C could form. If it holds 1,500–1,547, then later reclaims 1,660, ETH has a chance to enter Phase D, targeting 1,727–1,867–2,092. But if 1,500 is lost, the entire accumulation setup fails, and price goes back to markdown around 1,420–1,306.
Brothers, don’t long right at 1,591. Wait for the sweep down to 1,560–1,547, then observe the reaction.
entry: 1,552–1,560
Conditions: wicks sweep below, then M15/M30 closes back above 1,585 or reclaims 1,605
SL 1,535
TP1: 1,605
TP2: 1,638
TP3: 1,660–1,727
Invalidation: H1 closes below 1,547 and the retest fails
Assessing #ETH on June 30: ETH is calling a trap at the bottom—don’t go long too early
ETH is currently around 1,591. The big picture is still “accumulation markdown”—it’s building at the bottom, and no reversal has been confirmed yet. In the next 24 hours, the preferred view for how ETH typically behaves is: dip lower first, sweep liquidity below 1,560–1,547, then decide whether to pull back up or truly break the bottom.
Reason: ETH just bounced from the 1,638 area but couldn’t hold. That means a minor breakout failed—the long positions chasing are getting stuck. When price returns to the middle of the range 1,585–1,605, ETH usually doesn’t push straight up right away; instead, it pulls down toward the long positions’ stop-loss first. The “wick” zone to watch is 1,560–1,547; deeper is 1,512–1,500.
ETH is likely to range around 1,585–1,605, then see a downward push to 1,560–1,547. If here you get a lower wick sweep but M15/M30 closes back above 1,585–1,590, that’s a sign of a short trap / Spring Test. In that case, ETH could rebound to 1,605–1,638–1,660. Conversely, if H1 closes below 1,547 and the retest of 1,560 fails, the rebound scenario is invalidated and price is more likely to drop to 1,512–1,500.
ETH is in a zone where a Wyckoff Accumulation Phase C could form. If it holds 1,500–1,547, then later reclaims 1,660, ETH has a chance to enter Phase D, targeting 1,727–1,867–2,092. But if 1,500 is lost, the entire accumulation setup fails, and price goes back to markdown around 1,420–1,306.
Brothers, don’t long right at 1,591. Wait for the sweep down to 1,560–1,547, then observe the reaction.
entry: 1,552–1,560
Conditions: wicks sweep below, then M15/M30 closes back above 1,585 or reclaims 1,605
SL 1,535
TP1: 1,605
TP2: 1,638
TP3: 1,660–1,727
Invalidation: H1 closes below 1,547 and the retest fails
ETH is currently around 1,591. The big picture is still “accumulation markdown”—it’s building at the bottom, and no reversal has been confirmed yet. In the next 24 hours, the preferred view for how ETH typically behaves is: dip lower first, sweep liquidity below 1,560–1,547, then decide whether to pull back up or truly break the bottom.
Reason: ETH just bounced from the 1,638 area but couldn’t hold. That means a minor breakout failed—the long positions chasing are getting stuck. When price returns to the middle of the range 1,585–1,605, ETH usually doesn’t push straight up right away; instead, it pulls down toward the long positions’ stop-loss first. The “wick” zone to watch is 1,560–1,547; deeper is 1,512–1,500.
ETH is likely to range around 1,585–1,605, then see a downward push to 1,560–1,547. If here you get a lower wick sweep but M15/M30 closes back above 1,585–1,590, that’s a sign of a short trap / Spring Test. In that case, ETH could rebound to 1,605–1,638–1,660. Conversely, if H1 closes below 1,547 and the retest of 1,560 fails, the rebound scenario is invalidated and price is more likely to drop to 1,512–1,500.
ETH is in a zone where a Wyckoff Accumulation Phase C could form. If it holds 1,500–1,547, then later reclaims 1,660, ETH has a chance to enter Phase D, targeting 1,727–1,867–2,092. But if 1,500 is lost, the entire accumulation setup fails, and price goes back to markdown around 1,420–1,306.
Brothers, don’t long right at 1,591. Wait for the sweep down to 1,560–1,547, then observe the reaction.
entry: 1,552–1,560
Conditions: wicks sweep below, then M15/M30 closes back above 1,585 or reclaims 1,605
SL 1,535
TP1: 1,605
TP2: 1,638
TP3: 1,660–1,727
Invalidation: H1 closes below 1,547 and the retest fails

8
5
2.4k
·
--
Bullish
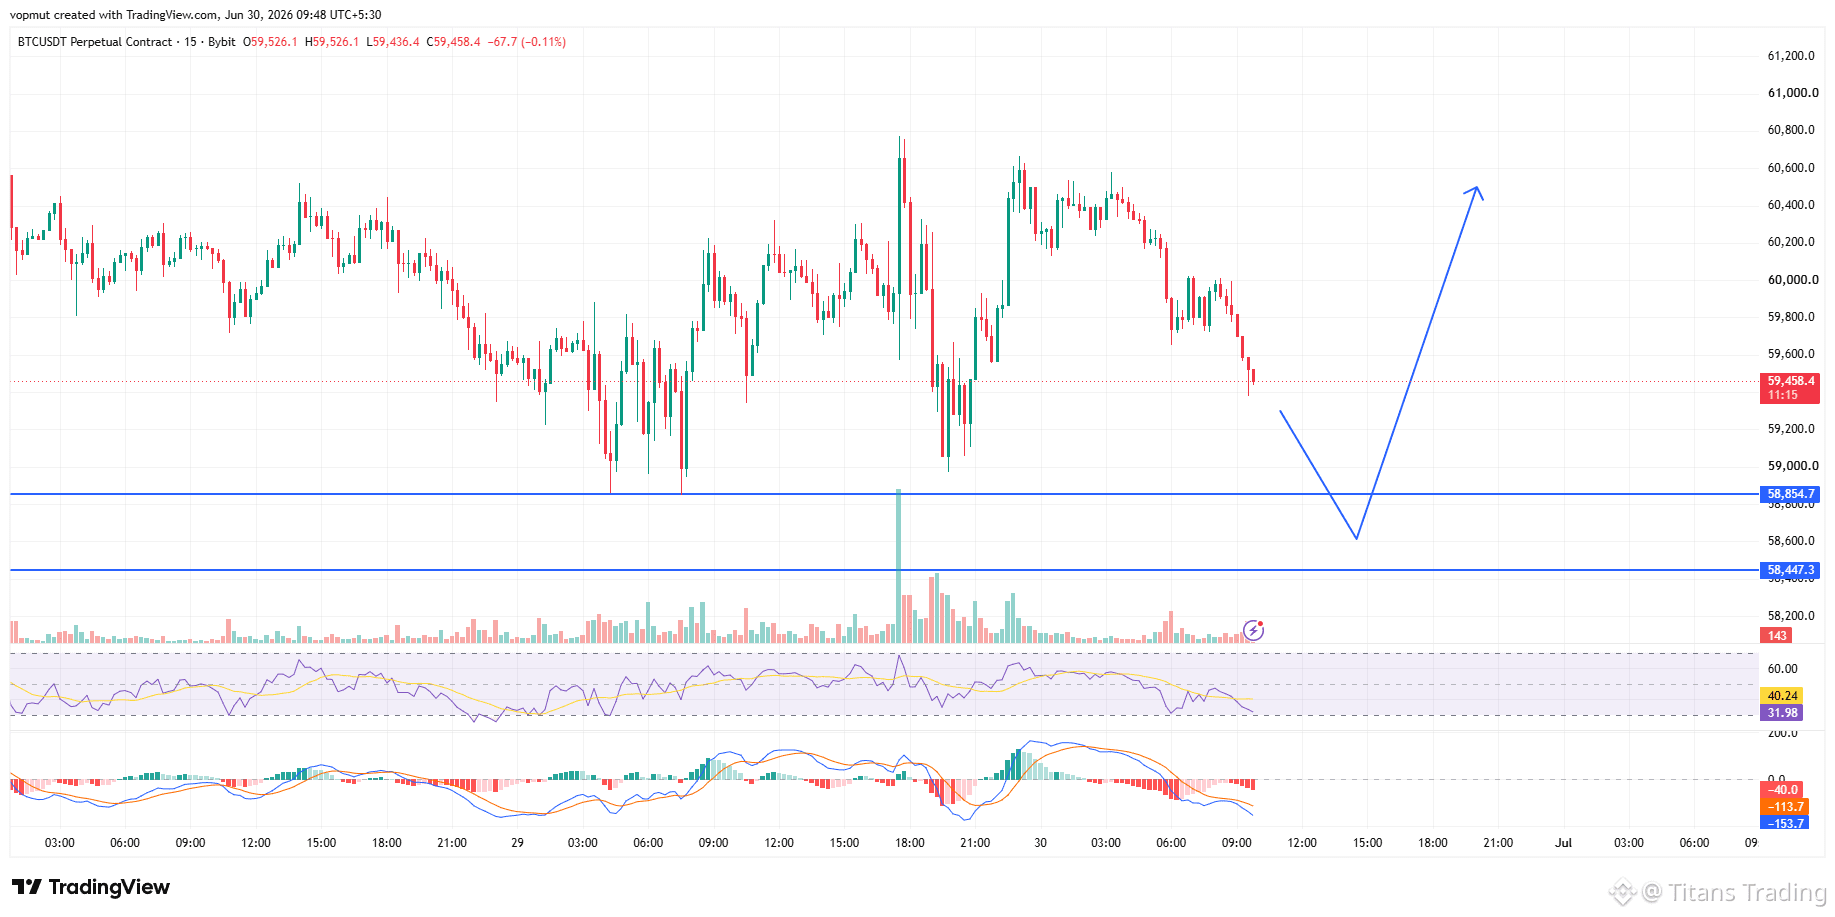
ASSESSMENT #BTC DATE 30/06: CAN MM PUSH DOWN TO 58K BEFORE PULLING BACK?
BTC is trading around 59,875 USD, with intraday high/low around 60,632 / 58,988.
View over the next 24h: prioritize a scenario where price sweeps lower first and then bounces; do not prioritize going Long right at 59.8k–60.0k. Reason: price is currently in the middle of the M30/H1 range. Above, there was a test of the 60.6k area, but it hasn’t been held yet. Meanwhile below, there is a clear cluster of liquidity at 59.25k 58.85k 58.30k. This is an area where BTC is likely to be hammered down to take out Long stops, create a deep wick, tempt retail to Short on a breakdown, and then pull back—unless there is no acceptance below 58.3k.
BTC is ranging around 59.6k–60.2k, then there is a downward push to 59.25k; deeper would be 58.85k–58.30k. If wicks appear there but M15/M30 reclaim 59.10k, the likelihood of a rebound to 59.85k 60.65k 61.20k will be higher.
Guys, don’t Long right now. Wait for BTC to sweep wicks down to 58.85k–58.30k, then only consider Long after reclaiming 59.10k.
Entry 58.85k–58.30k, or safer: retest 59.05k–59.25k after reclaim.
SL: 57.45k
TP1: 59.85k
TP2: 60.65k
TP3: 61.20k
Invalidate the Long setup if H1 closes below 58.30k and the retest fails.
ASSESSMENT #BTC DATE 30/06: CAN MM PUSH DOWN TO 58K BEFORE PULLING BACK?
BTC is trading around 59,875 USD, with intraday high/low around 60,632 / 58,988.
View over the next 24h: prioritize a scenario where price sweeps lower first and then bounces; do not prioritize going Long right at 59.8k–60.0k. Reason: price is currently in the middle of the M30/H1 range. Above, there was a test of the 60.6k area, but it hasn’t been held yet. Meanwhile below, there is a clear cluster of liquidity at 59.25k 58.85k 58.30k. This is an area where BTC is likely to be hammered down to take out Long stops, create a deep wick, tempt retail to Short on a breakdown, and then pull back—unless there is no acceptance below 58.3k.
BTC is ranging around 59.6k–60.2k, then there is a downward push to 59.25k; deeper would be 58.85k–58.30k. If wicks appear there but M15/M30 reclaim 59.10k, the likelihood of a rebound to 59.85k 60.65k 61.20k will be higher.
Guys, don’t Long right now. Wait for BTC to sweep wicks down to 58.85k–58.30k, then only consider Long after reclaiming 59.10k.
Entry 58.85k–58.30k, or safer: retest 59.05k–59.25k after reclaim.
SL: 57.45k
TP1: 59.85k
TP2: 60.65k
TP3: 61.20k
Invalidate the Long setup if H1 closes below 58.30k and the retest fails.
BTC is trading around 59,875 USD, with intraday high/low around 60,632 / 58,988.
View over the next 24h: prioritize a scenario where price sweeps lower first and then bounces; do not prioritize going Long right at 59.8k–60.0k. Reason: price is currently in the middle of the M30/H1 range. Above, there was a test of the 60.6k area, but it hasn’t been held yet. Meanwhile below, there is a clear cluster of liquidity at 59.25k 58.85k 58.30k. This is an area where BTC is likely to be hammered down to take out Long stops, create a deep wick, tempt retail to Short on a breakdown, and then pull back—unless there is no acceptance below 58.3k.
BTC is ranging around 59.6k–60.2k, then there is a downward push to 59.25k; deeper would be 58.85k–58.30k. If wicks appear there but M15/M30 reclaim 59.10k, the likelihood of a rebound to 59.85k 60.65k 61.20k will be higher.
Guys, don’t Long right now. Wait for BTC to sweep wicks down to 58.85k–58.30k, then only consider Long after reclaiming 59.10k.
Entry 58.85k–58.30k, or safer: retest 59.05k–59.25k after reclaim.
SL: 57.45k
TP1: 59.85k
TP2: 60.65k
TP3: 61.20k
Invalidate the Long setup if H1 closes below 58.30k and the retest fails.
1
4
1.4k
·
--
Bearish
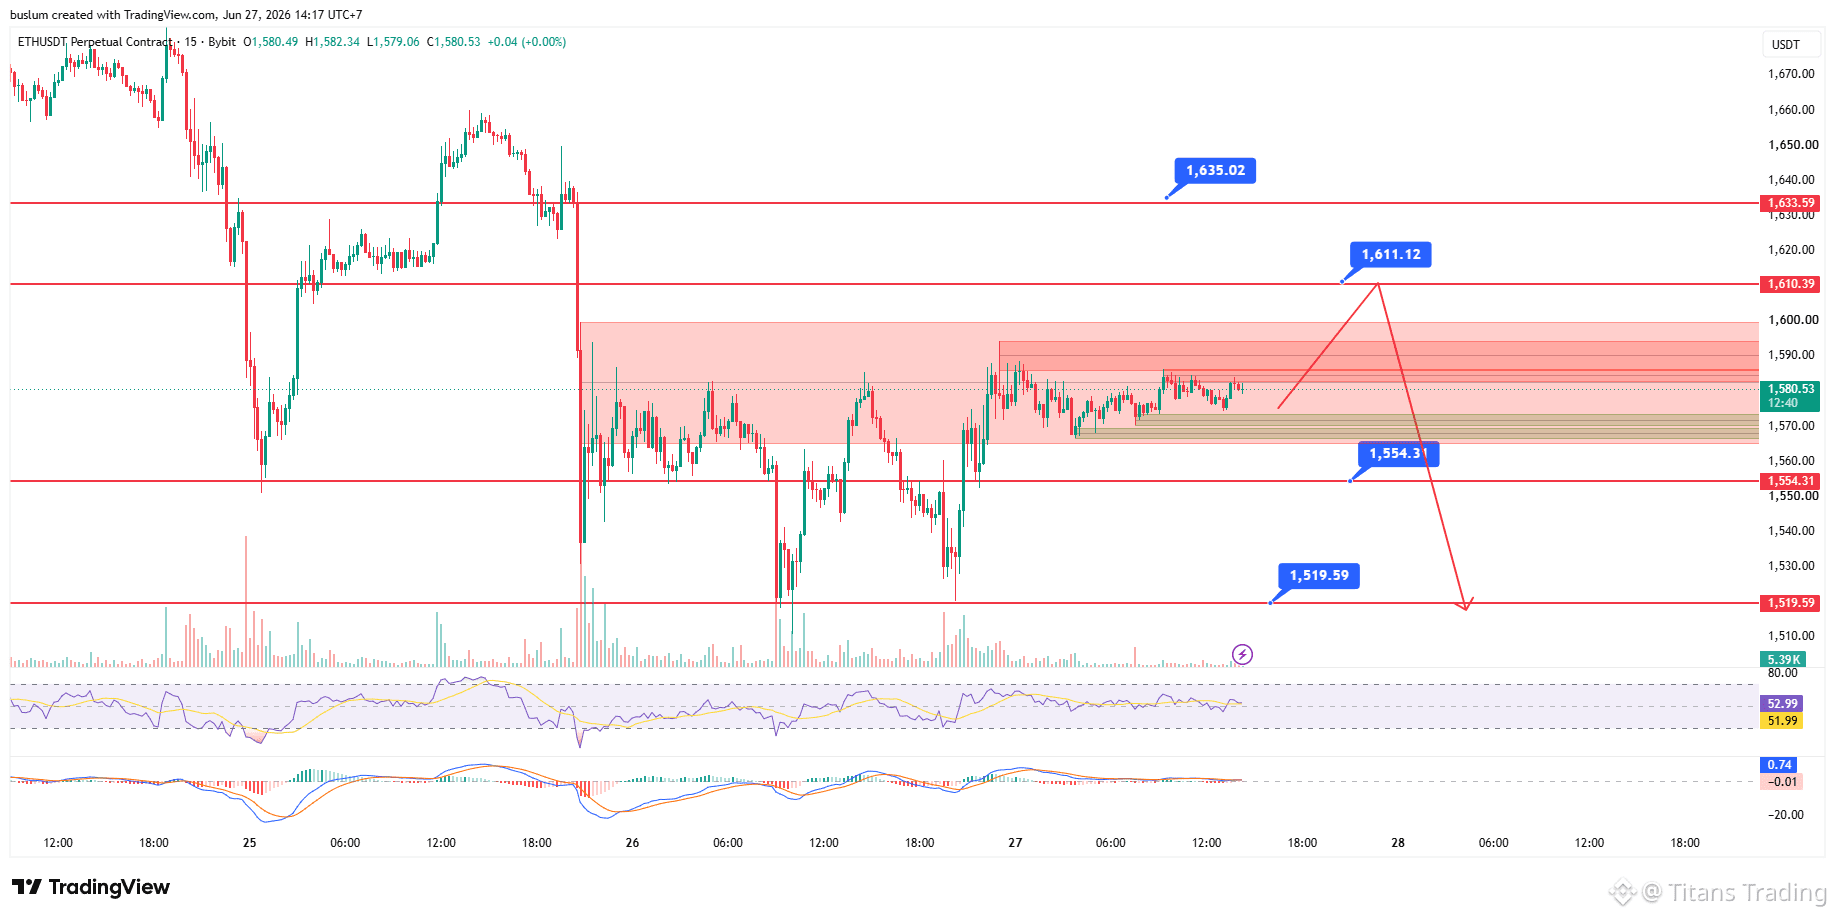
ASSESSMENT #ETH DATED 27/06: ETH MAY “DRAG UP” LIQUIDITY BEFORE THE DROP
Short-term view: prioritize a range-bearish bias; don’t go Long/Short immediately in the middle of the noise zone. The highest-probability scenario: ETH sweeps up into the 1,595–1,625 area first, then takes a stop-short + lures retail into a Long breakout. After that, if 1,625 isn’t held, price is likely to be pushed back down to 1,566 and then 1,535–1,515.
On M30–H4, ETH is still below multiple supply/FVG red zones. The 1,595–1,625 area is where the above liquidity sits, and it also overlaps with the short-term Fib retracement zone. If price only wicks up and then closes M15/M30 below 1,590–1,595, that’s a Long trap signal—prefer Short below.
Brothers, wait for ETH to retrace/sweep up into 1,595–1,625. If a wick/rejection candle appears and M15/M30 closes back below 1,590–1,595, you can look for a Short at 1,590 –1,618.
SL 1650
TP1: 1,566.
TP2: 1,535.
TP3: 1,515
No Short if H1 closes above 1,625 and the retest holds.
If ETH doesn’t sweep up but instead drops straight into 1,535–1,515, don’t grab the falling knife
ASSESSMENT #ETH DATED 27/06: ETH MAY “DRAG UP” LIQUIDITY BEFORE THE DROP
Short-term view: prioritize a range-bearish bias; don’t go Long/Short immediately in the middle of the noise zone. The highest-probability scenario: ETH sweeps up into the 1,595–1,625 area first, then takes a stop-short + lures retail into a Long breakout. After that, if 1,625 isn’t held, price is likely to be pushed back down to 1,566 and then 1,535–1,515.
On M30–H4, ETH is still below multiple supply/FVG red zones. The 1,595–1,625 area is where the above liquidity sits, and it also overlaps with the short-term Fib retracement zone. If price only wicks up and then closes M15/M30 below 1,590–1,595, that’s a Long trap signal—prefer Short below.
Brothers, wait for ETH to retrace/sweep up into 1,595–1,625. If a wick/rejection candle appears and M15/M30 closes back below 1,590–1,595, you can look for a Short at 1,590 –1,618.
SL 1650
TP1: 1,566.
TP2: 1,535.
TP3: 1,515
No Short if H1 closes above 1,625 and the retest holds.
If ETH doesn’t sweep up but instead drops straight into 1,535–1,515, don’t grab the falling knife
Short-term view: prioritize a range-bearish bias; don’t go Long/Short immediately in the middle of the noise zone. The highest-probability scenario: ETH sweeps up into the 1,595–1,625 area first, then takes a stop-short + lures retail into a Long breakout. After that, if 1,625 isn’t held, price is likely to be pushed back down to 1,566 and then 1,535–1,515.
On M30–H4, ETH is still below multiple supply/FVG red zones. The 1,595–1,625 area is where the above liquidity sits, and it also overlaps with the short-term Fib retracement zone. If price only wicks up and then closes M15/M30 below 1,590–1,595, that’s a Long trap signal—prefer Short below.
Brothers, wait for ETH to retrace/sweep up into 1,595–1,625. If a wick/rejection candle appears and M15/M30 closes back below 1,590–1,595, you can look for a Short at 1,590 –1,618.
SL 1650
TP1: 1,566.
TP2: 1,535.
TP3: 1,515
No Short if H1 closes above 1,625 and the retest holds.
If ETH doesn’t sweep up but instead drops straight into 1,535–1,515, don’t grab the falling knife
1
7
2.7k
·
--
Bearish
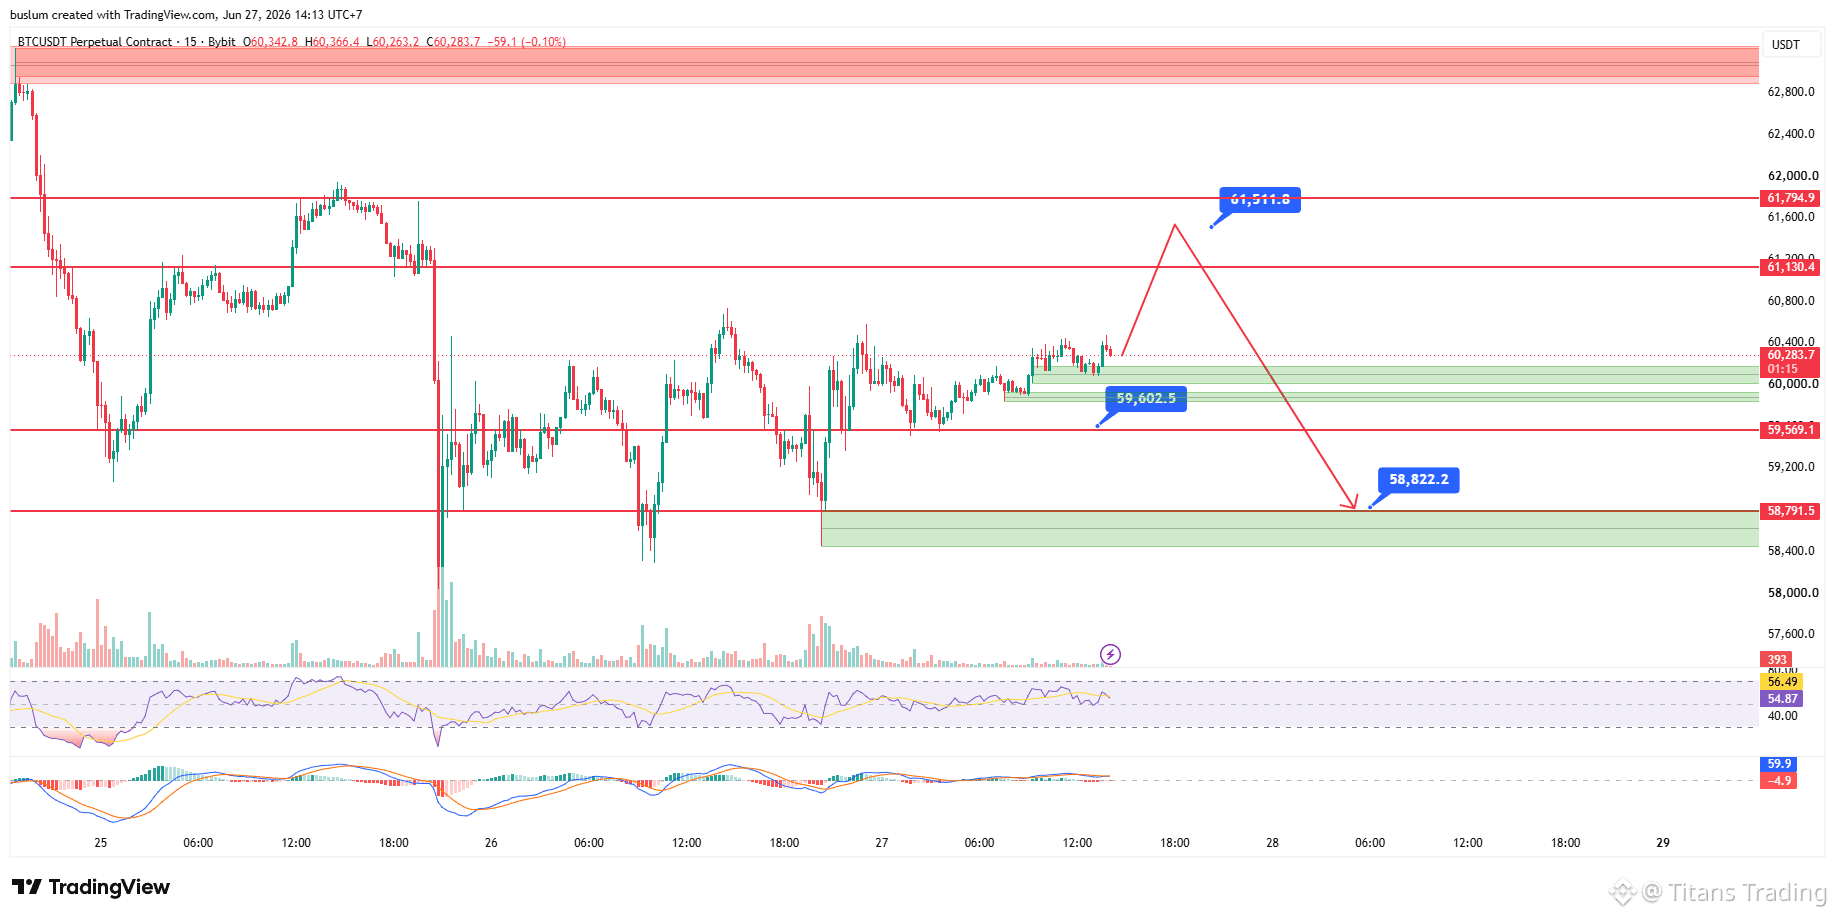
ASSESSMENT #BTC DATE 27/06: THE 61.9K SWEEP COULD BE A FINAL TRAP BEFORE THE DROP?
BTC is currently hovering around 60.2k–60.4k, right in the middle of the short-term range 58.3k–61.95k. This is not a good area to open a trade immediately, because price is sitting in the mid-range, making it very likely that MM will pull wicks on both ends before choosing the true direction.
In my view, BTC is more likely to be pulled back up to 60.7k–61.15k, even wick deeper to 61.5k–61.95k to sweep short stops and lure a long breakout. Above, there’s plenty of buy-side liquidity, and this zone also coincides with an FVG plus the 0.382–0.5 retracement (fib) of the downswing from 65.5k down to 58.3k. If price sweeps up but H1 fails to close and hold above 61.95k, it’s likely a UT / long trap, after which price can easily be pushed back down to 59.6k - 58.8k - 58.3k.
Brothers, wait for BTC to rally to 61.15k–61.95k, then only look for Short setups; don’t short the market at 60.2k.
Entry 61.15k–61.95k
SL: 62.85k
TP1: 59.6k
TP2: 58.8k
TP3: 58.3k
If 58.3k breaks and the retest fails: hold the runner for 56k–54.8k. If within 24h price doesn’t rise to 61.15k and instead turns down after losing 59.6k first, don’t chase a low short; wait for a retest at 59.6k–60.2k.
:::
ASSESSMENT #BTC DATE 27/06: THE 61.9K SWEEP COULD BE A FINAL TRAP BEFORE THE DROP?
BTC is currently hovering around 60.2k–60.4k, right in the middle of the short-term range 58.3k–61.95k. This is not a good area to open a trade immediately, because price is sitting in the mid-range, making it very likely that MM will pull wicks on both ends before choosing the true direction.
In my view, BTC is more likely to be pulled back up to 60.7k–61.15k, even wick deeper to 61.5k–61.95k to sweep short stops and lure a long breakout. Above, there’s plenty of buy-side liquidity, and this zone also coincides with an FVG plus the 0.382–0.5 retracement (fib) of the downswing from 65.5k down to 58.3k. If price sweeps up but H1 fails to close and hold above 61.95k, it’s likely a UT / long trap, after which price can easily be pushed back down to 59.6k - 58.8k - 58.3k.
Brothers, wait for BTC to rally to 61.15k–61.95k, then only look for Short setups; don’t short the market at 60.2k.
Entry 61.15k–61.95k
SL: 62.85k
TP1: 59.6k
TP2: 58.8k
TP3: 58.3k
If 58.3k breaks and the retest fails: hold the runner for 56k–54.8k. If within 24h price doesn’t rise to 61.15k and instead turns down after losing 59.6k first, don’t chase a low short; wait for a retest at 59.6k–60.2k.
:::
BTC is currently hovering around 60.2k–60.4k, right in the middle of the short-term range 58.3k–61.95k. This is not a good area to open a trade immediately, because price is sitting in the mid-range, making it very likely that MM will pull wicks on both ends before choosing the true direction.
In my view, BTC is more likely to be pulled back up to 60.7k–61.15k, even wick deeper to 61.5k–61.95k to sweep short stops and lure a long breakout. Above, there’s plenty of buy-side liquidity, and this zone also coincides with an FVG plus the 0.382–0.5 retracement (fib) of the downswing from 65.5k down to 58.3k. If price sweeps up but H1 fails to close and hold above 61.95k, it’s likely a UT / long trap, after which price can easily be pushed back down to 59.6k - 58.8k - 58.3k.
Brothers, wait for BTC to rally to 61.15k–61.95k, then only look for Short setups; don’t short the market at 60.2k.
Entry 61.15k–61.95k
SL: 62.85k
TP1: 59.6k
TP2: 58.8k
TP3: 58.3k
If 58.3k breaks and the retest fails: hold the runner for 56k–54.8k. If within 24h price doesn’t rise to 61.15k and instead turns down after losing 59.6k first, don’t chase a low short; wait for a retest at 59.6k–60.2k.
:::
2
6
1.9k
·
--
Bearish
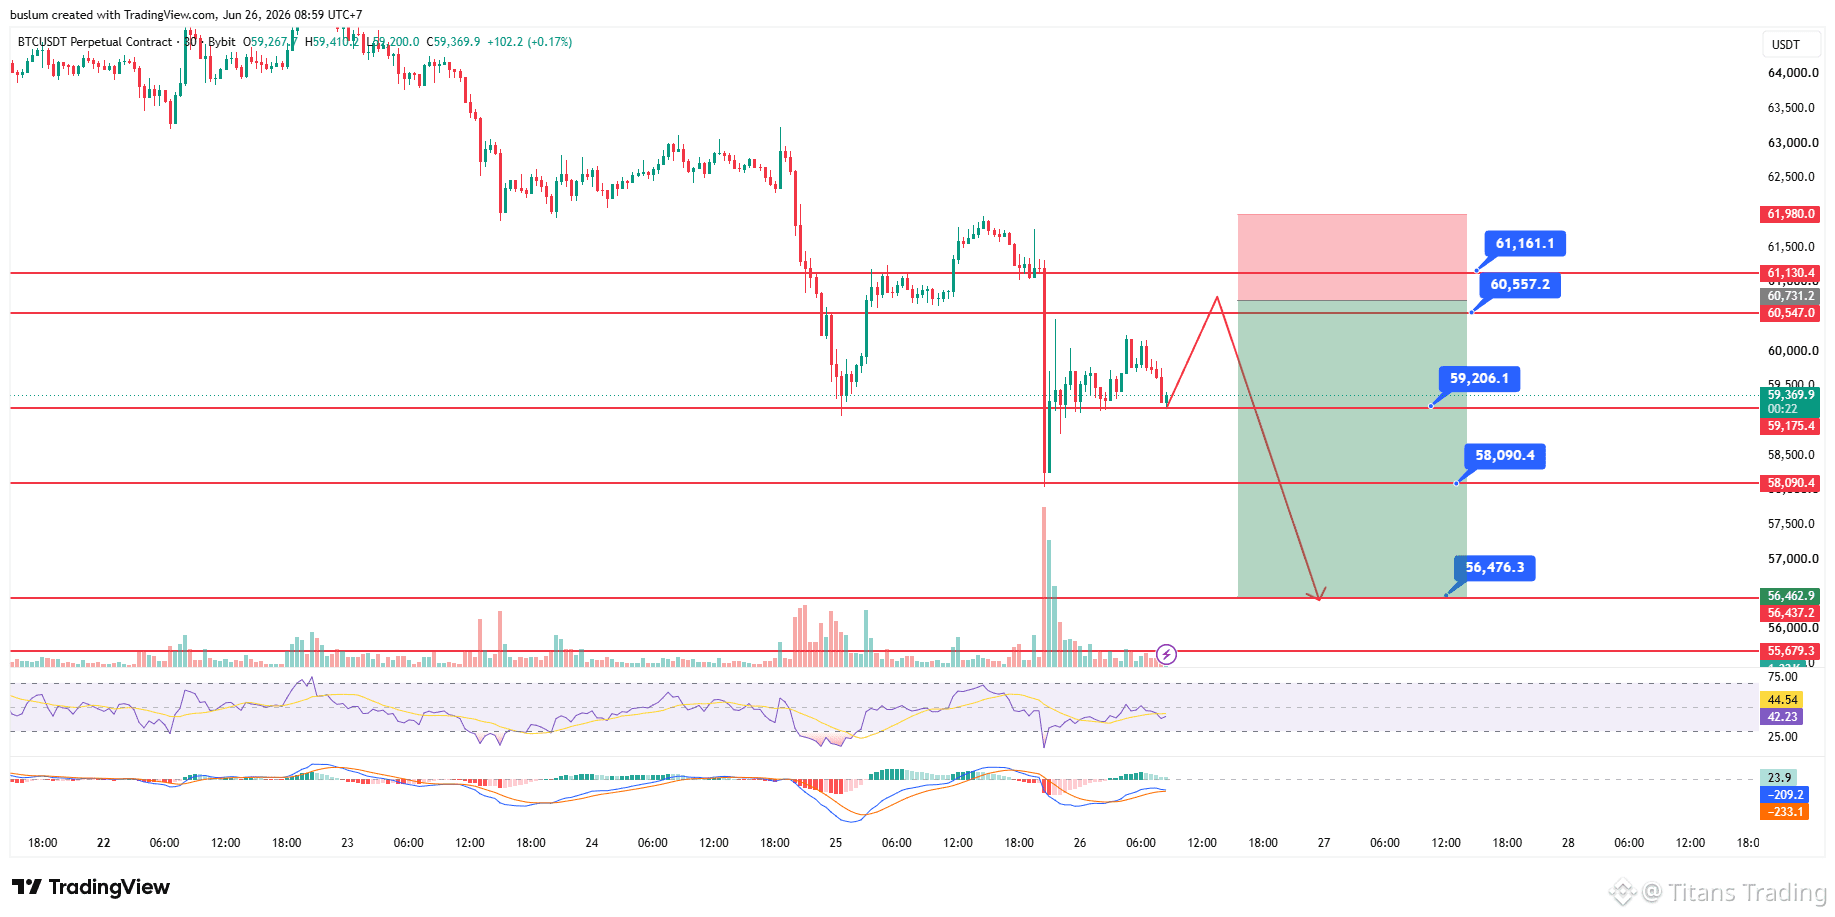
ASSESSMENT #BTC DATE 26/06: MM CAN PULL UP TO 61K TO LIQUIDATE, THEN DUMP
BTC is currently hovering around 59.3k–59.7k, after a strong dump to 58.1k. The main 24h outlook is that it’s not likely to go Long/Short immediately, because the price is sitting in the noise range 59.3k–60.0k. The easiest move for BTC would be to push the rebound up to 60.45k–61.15k, sweep the stops of shorts late, lure retail into a Long breakout, and then—if it can’t hold—sell off again back to the bottom.
Brothers, wait for BTC to rebound to 60,450 – 60,800 – 61,150, then watch for SHORT, but only enter after wicks sweep up and M15/H1 closes weakly below 60.2k.
SL includes deep wicks: above 61,950.
TP: 59,200 58,100 56,200 – 55,600
If BTC doesn’t rebound and breaks cleanly below 58.1k, don’t chase shorts. Wait for a retest at 58.4k–58.8k to fail, then short again, TP 56.2k.
Longer-term view: below 63.9k–65.5k, BTC remains in markdown/re-distribution. The zone 56.2k–55.6k, and deeper 52k–50k, is where a bottom could form like a big SC. Only if the Daily closes above 65.5k and the retest holds would it be considered a shift into a larger rebound phase.
ASSESSMENT #BTC DATE 26/06: MM CAN PULL UP TO 61K TO LIQUIDATE, THEN DUMP
BTC is currently hovering around 59.3k–59.7k, after a strong dump to 58.1k. The main 24h outlook is that it’s not likely to go Long/Short immediately, because the price is sitting in the noise range 59.3k–60.0k. The easiest move for BTC would be to push the rebound up to 60.45k–61.15k, sweep the stops of shorts late, lure retail into a Long breakout, and then—if it can’t hold—sell off again back to the bottom.
Brothers, wait for BTC to rebound to 60,450 – 60,800 – 61,150, then watch for SHORT, but only enter after wicks sweep up and M15/H1 closes weakly below 60.2k.
SL includes deep wicks: above 61,950.
TP: 59,200 58,100 56,200 – 55,600
If BTC doesn’t rebound and breaks cleanly below 58.1k, don’t chase shorts. Wait for a retest at 58.4k–58.8k to fail, then short again, TP 56.2k.
Longer-term view: below 63.9k–65.5k, BTC remains in markdown/re-distribution. The zone 56.2k–55.6k, and deeper 52k–50k, is where a bottom could form like a big SC. Only if the Daily closes above 65.5k and the retest holds would it be considered a shift into a larger rebound phase.
BTC is currently hovering around 59.3k–59.7k, after a strong dump to 58.1k. The main 24h outlook is that it’s not likely to go Long/Short immediately, because the price is sitting in the noise range 59.3k–60.0k. The easiest move for BTC would be to push the rebound up to 60.45k–61.15k, sweep the stops of shorts late, lure retail into a Long breakout, and then—if it can’t hold—sell off again back to the bottom.
Brothers, wait for BTC to rebound to 60,450 – 60,800 – 61,150, then watch for SHORT, but only enter after wicks sweep up and M15/H1 closes weakly below 60.2k.
SL includes deep wicks: above 61,950.
TP: 59,200 58,100 56,200 – 55,600
If BTC doesn’t rebound and breaks cleanly below 58.1k, don’t chase shorts. Wait for a retest at 58.4k–58.8k to fail, then short again, TP 56.2k.
Longer-term view: below 63.9k–65.5k, BTC remains in markdown/re-distribution. The zone 56.2k–55.6k, and deeper 52k–50k, is where a bottom could form like a big SC. Only if the Daily closes above 65.5k and the retest holds would it be considered a shift into a larger rebound phase.
3
3
1.8k
Log in to explore more content
Join global crypto users on Binance Square
⚡️ Get latest and useful information about crypto.
💬 Trusted by the world’s largest crypto exchange.
👍 Discover real insights from verified creators.
Email / Phone number
Trending Topics
NvidiaEarningsTonight:AIStocks’NextMove?
62,826 views
902 Discussing
Nvidia Earnings Day: Interim CEO's First Appearance — Can the AI Story Hold?
Binance News
·17 Likes
·7.8k views
A Packed Week of Earnings and Data Tests Markets
121,578 views
608 Discussing
AnthropicIPOTestsInvestorAppetiteForAI
267,522 views
2,609 Discussing