
Trade Saidul
20 Posts

Trade Saidul
Report
Block User
Open Trade
Occasional Trader
2.2 Years
12 Following
7 Followers
1 Liked
Posts
Portfolio
·
--
⚖️ US Justice Department and Wall Street back the challenge to Illinois's crypto tax
The US Justice Department, the US Chamber of Commerce and SIFMA have filed court papers supporting crypto industry groups that are suing to strike down Illinois's 0.2% tax on digital asset transactions, Cointelegraph reported on November 12.
➡️ What the tax does
🟡 The law puts a 0.2% levy on the value of digital assets exchanged, transferred or stored through a broker for an Illinois customer — even when there is no profit. It was due to start on January 1, 2027, but the state has agreed to pause it until July 1, 2027.
➡️ Who is backing the challenge
🟡 The DOJ filed a statement of interest arguing the tax conflicts with federal digital asset policy. The Chamber and SIFMA warned it would hit banks, broker-dealers, custodians and asset managers. A DeFi coalition including a16z, Paradigm and Uniswap filed a separate brief.
➡️ What happens next
🟡 The case was brought by the Crypto Council for Innovation and the Blockchain Association. The plaintiffs are asking for a ruling by March 1, 2027.
Federal support does not decide the case, but it shows the fight is no longer a crypto-only issue.
#brakingnews #cryptouniverseofficial #nwe #HuangExitNvidiaStrategyInFocus $BTC $XRP $DOGE
⚖️ US Justice Department and Wall Street back the challenge to Illinois's crypto tax
The US Justice Department, the US Chamber of Commerce and SIFMA have filed court papers supporting crypto industry groups that are suing to strike down Illinois's 0.2% tax on digital asset transactions, Cointelegraph reported on November 12.
➡️ What the tax does
🟡 The law puts a 0.2% levy on the value of digital assets exchanged, transferred or stored through a broker for an Illinois customer — even when there is no profit. It was due to start on January 1, 2027, but the state has agreed to pause it until July 1, 2027.
➡️ Who is backing the challenge
🟡 The DOJ filed a statement of interest arguing the tax conflicts with federal digital asset policy. The Chamber and SIFMA warned it would hit banks, broker-dealers, custodians and asset managers. A DeFi coalition including a16z, Paradigm and Uniswap filed a separate brief.
➡️ What happens next
🟡 The case was brought by the Crypto Council for Innovation and the Blockchain Association. The plaintiffs are asking for a ruling by March 1, 2027.
Federal support does not decide the case, but it shows the fight is no longer a crypto-only issue.
#brakingnews #cryptouniverseofficial #nwe #HuangExitNvidiaStrategyInFocus $BTC $XRP $DOGE
The US Justice Department, the US Chamber of Commerce and SIFMA have filed court papers supporting crypto industry groups that are suing to strike down Illinois's 0.2% tax on digital asset transactions, Cointelegraph reported on November 12.
➡️ What the tax does
🟡 The law puts a 0.2% levy on the value of digital assets exchanged, transferred or stored through a broker for an Illinois customer — even when there is no profit. It was due to start on January 1, 2027, but the state has agreed to pause it until July 1, 2027.
➡️ Who is backing the challenge
🟡 The DOJ filed a statement of interest arguing the tax conflicts with federal digital asset policy. The Chamber and SIFMA warned it would hit banks, broker-dealers, custodians and asset managers. A DeFi coalition including a16z, Paradigm and Uniswap filed a separate brief.
➡️ What happens next
🟡 The case was brought by the Crypto Council for Innovation and the Blockchain Association. The plaintiffs are asking for a ruling by March 1, 2027.
Federal support does not decide the case, but it shows the fight is no longer a crypto-only issue.
#brakingnews #cryptouniverseofficial #nwe #HuangExitNvidiaStrategyInFocus $BTC $XRP $DOGE

51
·
--
Article
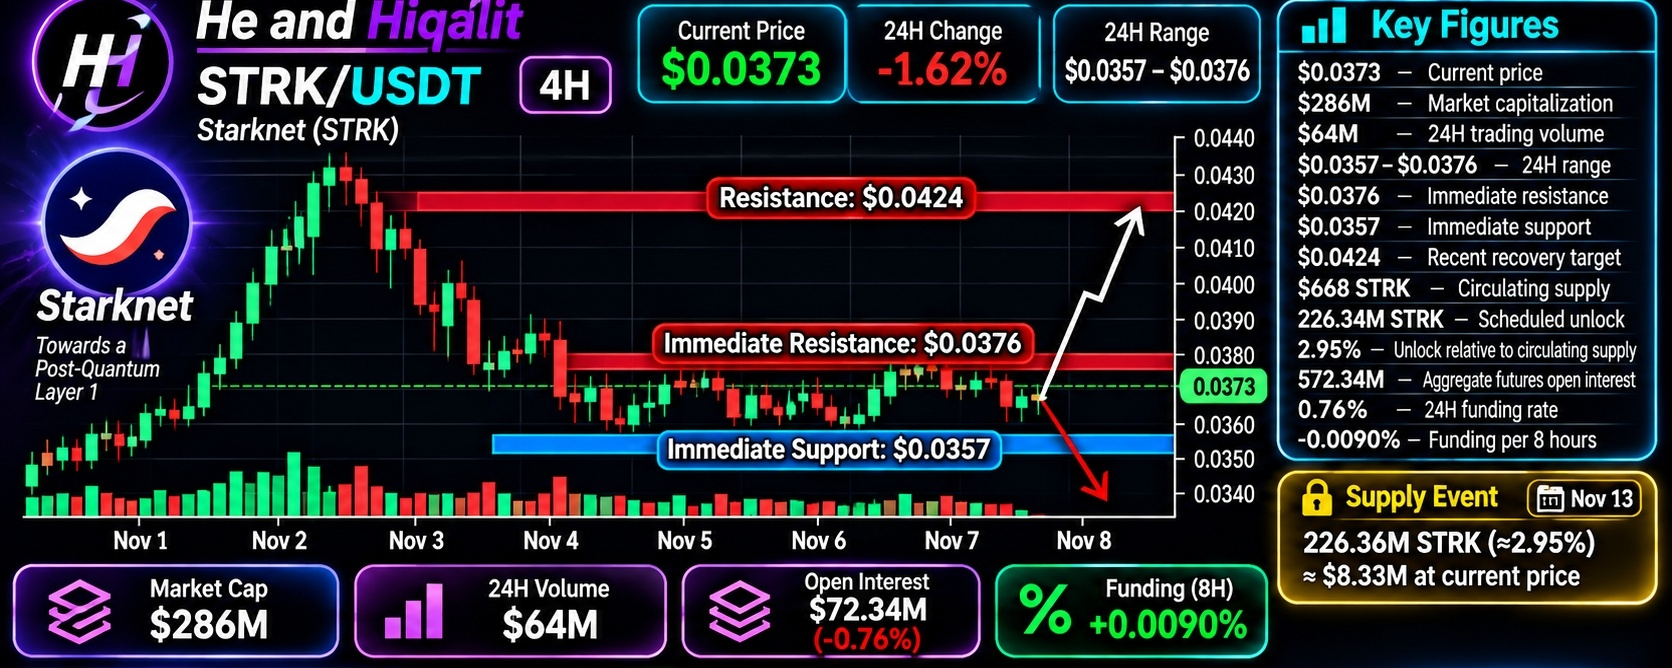
STRK is approaching a supply event while its long-term technology narrative is gaining attention$STRK is approaching a supply event while its long-term technology narrative is gaining attention. The important question is whether buyers can absorb fresh tokens before Starknet's next development milestone creates meaningful demand. STRK is trading near $0.0373, with a market capitalization around $286M and daily volume near $64M. Price is holding close to the $0.0357–$0.0376 range after a weak weekly performance. The immediate challenge is reclaiming $0.0376, while the $0.0424 area remains the next important resistance. The strongest development is Starknet's exploration of becoming an independent, post-quantum Layer 1. A community poll received 93.52% support for further research into the transition. This could give Starknet a stronger long-term technological position, particularly as quantum-resistant cryptography becomes increasingly relevant. However, community support for research is not approval of a completed migration. Technical implementation and governance decisions remain ahead. The token-demand question is less straightforward. STRK supports transaction fees, governance and staking, but network activity must grow enough to create meaningful economic demand. Technology improvements alone do not guarantee higher token value. The market needs measurable increases in users, transactions, fees and ecosystem liquidity. Supply is the immediate concern. Approximately 226.36M STRK is scheduled for release on November 13, representing around 2.95% of circulating supply. At the reference price, this is worth approximately $8.33M. For a token with a market capitalization below $300M, the market's ability to absorb this additional supply matters. Derivatives add another layer of caution. Aggregate futures open interest is approximately $72.34M, down 0.76% over 24 hours, while funding remains positive near 0.0090% per eight hours. Futures volume is considerably higher than spot volume, suggesting speculative activity is still dominating price discovery. A recovery supported by spot buying would be more convincing. Key figures $0.0373 — Current price $286M — Market capitalization $64M — 24H trading volume $0.0357–$0.0376 — 24H range $0.0376 — Immediate resistance $0.0357 — Immediate support $0.0424 — Recent recovery target 7.66B STRK — Circulating supply 226.36M STRK — Scheduled unlock 2.95% — Unlock relative to circulating supply $72.34M — Aggregate futures open interest -0.76% — 24H OI change +0.0090% — Funding per 8 hours Bullish confirmation: STRK needs to defend $0.0357, reclaim $0.0376 and establish a sustained breakout. Stronger spot volume could open the way toward $0.0390 and $0.0424. Bearish confirmation: Losing $0.0357 after the supply release would weaken the recovery and expose further downside, particularly if spot demand remains weak. Starknet has an interesting technological opportunity, but the market needs execution rather than research headlines. The immediate test is whether buyers can absorb the unlock; the bigger test is whether network development translates into sustainable demand for STRK. $STRK #ByXIMPACT #AnthropicRejectsIPODelayValuationinQuestion #TradFiForBeginners
STRK is approaching a supply event while its long-term technology narrative is gaining attention
$STRK is approaching a supply event while its long-term technology narrative is gaining attention. The important question is whether buyers can absorb fresh tokens before Starknet's next development milestone creates meaningful demand. STRK is trading near $0.0373, with a market capitalization around $286M and daily volume near $64M. Price is holding close to the $0.0357–$0.0376 range after a weak weekly performance. The immediate challenge is reclaiming $0.0376, while the $0.0424 area remains the next important resistance. The strongest development is Starknet's exploration of becoming an independent, post-quantum Layer 1. A community poll received 93.52% support for further research into the transition. This could give Starknet a stronger long-term technological position, particularly as quantum-resistant cryptography becomes increasingly relevant. However, community support for research is not approval of a completed migration. Technical implementation and governance decisions remain ahead. The token-demand question is less straightforward. STRK supports transaction fees, governance and staking, but network activity must grow enough to create meaningful economic demand. Technology improvements alone do not guarantee higher token value. The market needs measurable increases in users, transactions, fees and ecosystem liquidity. Supply is the immediate concern. Approximately 226.36M STRK is scheduled for release on November 13, representing around 2.95% of circulating supply. At the reference price, this is worth approximately $8.33M. For a token with a market capitalization below $300M, the market's ability to absorb this additional supply matters. Derivatives add another layer of caution. Aggregate futures open interest is approximately $72.34M, down 0.76% over 24 hours, while funding remains positive near 0.0090% per eight hours. Futures volume is considerably higher than spot volume, suggesting speculative activity is still dominating price discovery. A recovery supported by spot buying would be more convincing. Key figures $0.0373 — Current price $286M — Market capitalization $64M — 24H trading volume $0.0357–$0.0376 — 24H range $0.0376 — Immediate resistance $0.0357 — Immediate support $0.0424 — Recent recovery target 7.66B STRK — Circulating supply 226.36M STRK — Scheduled unlock 2.95% — Unlock relative to circulating supply $72.34M — Aggregate futures open interest -0.76% — 24H OI change +0.0090% — Funding per 8 hours Bullish confirmation: STRK needs to defend $0.0357, reclaim $0.0376 and establish a sustained breakout. Stronger spot volume could open the way toward $0.0390 and $0.0424. Bearish confirmation: Losing $0.0357 after the supply release would weaken the recovery and expose further downside, particularly if spot demand remains weak. Starknet has an interesting technological opportunity, but the market needs execution rather than research headlines. The immediate test is whether buyers can absorb the unlock; the bigger test is whether network development translates into sustainable demand for STRK. $STRK #ByXIMPACT #AnthropicRejectsIPODelayValuationinQuestion #TradFiForBeginners
1
366
·
--
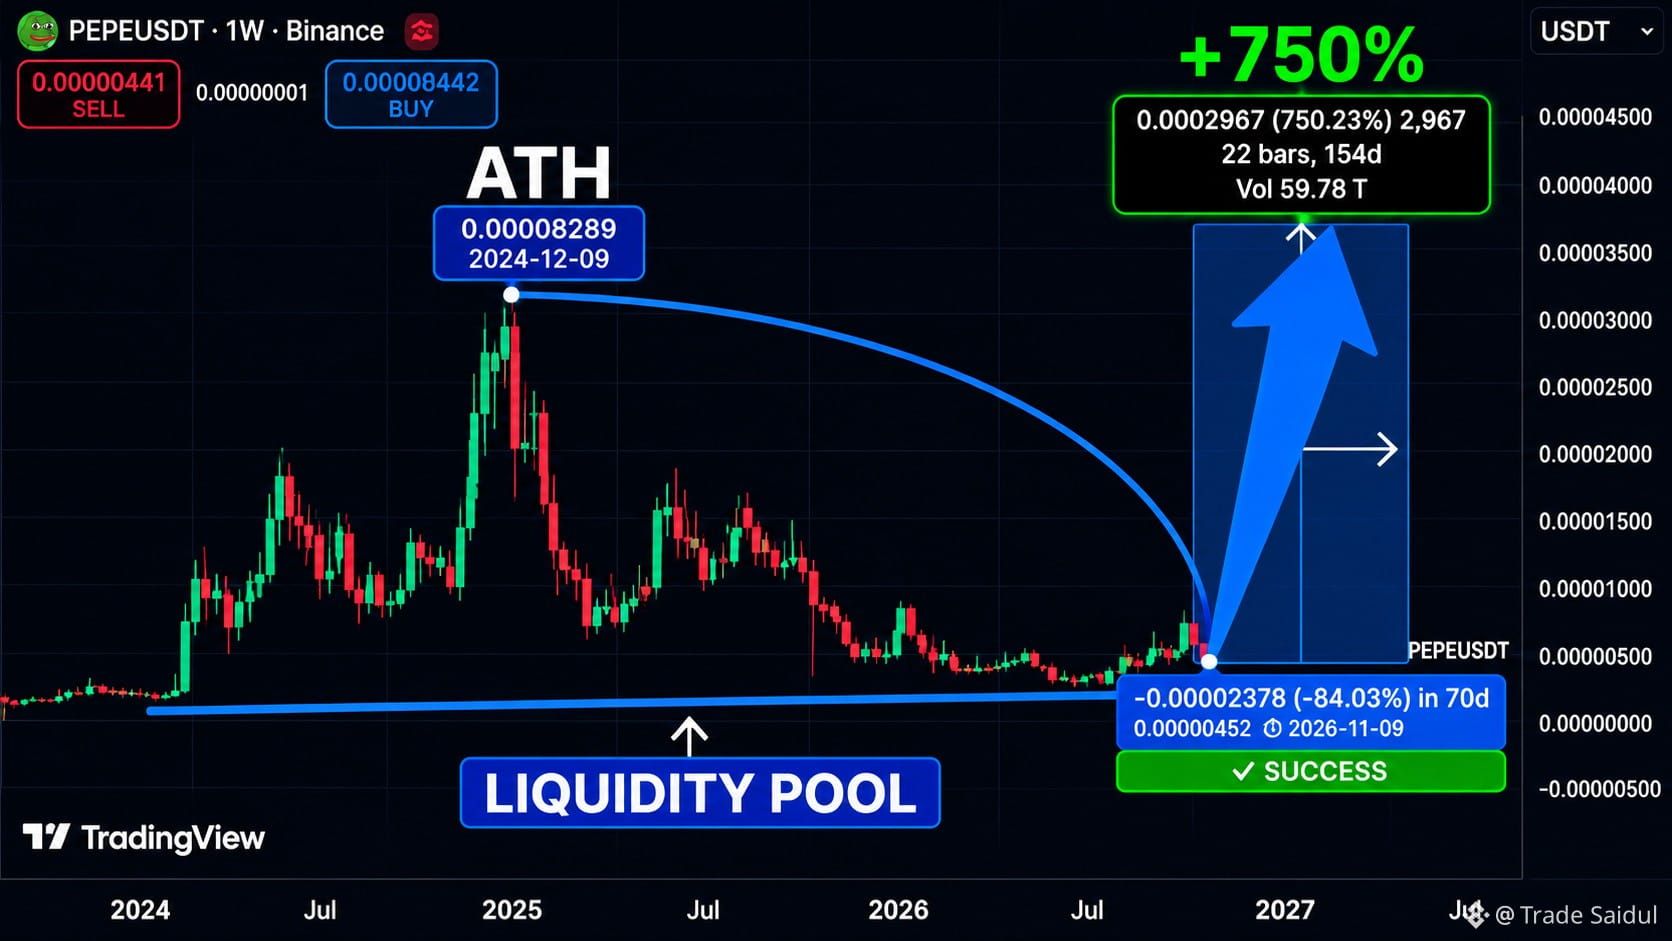
And this weekly chart is showing a setup that could become very interesting. Remember when $PEPE reached its all-time high near $0.0000283 in December 2024? Since then, it's been a brutal correction. Lower highs. Failed recoveries. Months of persistent selling pressure. Now price is down more than 84% from its previous peak. But look at where we're sitting. $PEPE has returned to a major long-term liquidity zone, near the same historical price region that preceded its earlier explosive rallies. And that's what caught my attention. After months of declining prices, the market is beginning to stabilize near its lows. Could this be the foundation for another major expansion? Possibly. But buyers still need to confirm it. Here's my roadmap. $0.000007 — First resistance to reclaim. $0.000010 — Important psychological level. $0.000016 — Major historical resistance. $0.0000283 — Previous ATH. And $0.000034? That's my aggressive bull scenario. The chart illustrates a potential 750% rally from its marked historical reference point. But here's the important part. A return to historical support doesn't automatically mean the bottom is in. I want to see pepe establish higher lows, reclaim $0.000007, and eventually break above $0.000010 with sustained buying volume. That would provide stronger evidence that the weekly structure is shifting. Without those confirmations, the broader downtrend remains intact. Still, the psychology is fascinating. When $PEPE was trading near its all-time high, everyone wanted exposure. Now it's more than 80% below that peak, and sentiment looks very different. But meme coins can remain depressed for much longer than traders expect. The 750% projection is a speculative scenario, not a guaranteed outcome. For now, I'm watching whether buyers can defend this historical base. If the weekly structure finally reverses, pepe could become one of the more interesting recovery setups to follow.
#HuangExitNvidiaStrategyInFocus #bitcoin #BTC走势分析 #PEPE创历史新高
And this weekly chart is showing a setup that could become very interesting. Remember when $PEPE reached its all-time high near $0.0000283 in December 2024? Since then, it's been a brutal correction. Lower highs. Failed recoveries. Months of persistent selling pressure. Now price is down more than 84% from its previous peak. But look at where we're sitting. $PEPE has returned to a major long-term liquidity zone, near the same historical price region that preceded its earlier explosive rallies. And that's what caught my attention. After months of declining prices, the market is beginning to stabilize near its lows. Could this be the foundation for another major expansion? Possibly. But buyers still need to confirm it. Here's my roadmap. $0.000007 — First resistance to reclaim. $0.000010 — Important psychological level. $0.000016 — Major historical resistance. $0.0000283 — Previous ATH. And $0.000034? That's my aggressive bull scenario. The chart illustrates a potential 750% rally from its marked historical reference point. But here's the important part. A return to historical support doesn't automatically mean the bottom is in. I want to see pepe establish higher lows, reclaim $0.000007, and eventually break above $0.000010 with sustained buying volume. That would provide stronger evidence that the weekly structure is shifting. Without those confirmations, the broader downtrend remains intact. Still, the psychology is fascinating. When $PEPE was trading near its all-time high, everyone wanted exposure. Now it's more than 80% below that peak, and sentiment looks very different. But meme coins can remain depressed for much longer than traders expect. The 750% projection is a speculative scenario, not a guaranteed outcome. For now, I'm watching whether buyers can defend this historical base. If the weekly structure finally reverses, pepe could become one of the more interesting recovery setups to follow.
#HuangExitNvidiaStrategyInFocus #bitcoin #BTC走势分析 #PEPE创历史新高
#HuangExitNvidiaStrategyInFocus #bitcoin #BTC走势分析 #PEPE创历史新高
54
·
--
Verified
Article
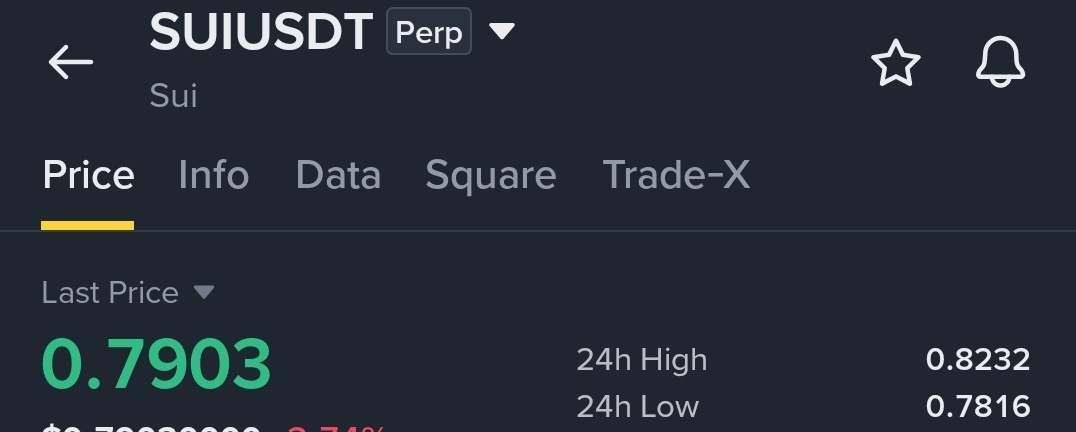
SUI is facing a difficult testSUI is facing a difficult test: institutional adoption is expanding, but ecosystem liquidity is weakening. The market needs to see whether new financial infrastructure can reverse that divergence. SUI is attracting institutional access in Brazil, but weakening DeFi liquidity is creating a contradiction the market cannot ignore. SUI is trading near $0.7953, down approximately 3.38% over 24 hours and 8.37% over seven days. Market capitalization is around $3.29B, with spot volume near $71.25M. The daily range is $0.7816–$0.8245, placing price close to support. Buyers need to reclaim $0.8245 before the short-term structure can improve. The strongest adoption development is Mercado Bitcoin's integration of SUI, USDC and Sui Dollar into its Brazilian platform. The exchange serves approximately 4.5 million clients and will also accept USDsui as collateral in its lending product. More importantly, its tokenized real-world asset platform, which has issued over 800 assets, is expected to expand onto Sui. This creates a regulated distribution channel for payments and tokenized finance. Hashi adds another potential catalyst. Mercado Bitcoin is exploring integration of Sui's native Bitcoin-finance infrastructure into its lending products. However, this remains an exploration, not a live lending service. The important distinction is that institutional access is expanding, but the actual capital and transaction demand still need to materialize. There is a weaker signal beneath the adoption headlines. Sui's DeFi TVL fell from approximately $510.9M on October 14 to $411.4M on November 12, a decline of more than 19%. Suiet, a self-custodial Sui wallet, has also announced that it will end development and API services after November 14. This does not mean Sui's network is shutting down, but it raises questions about ecosystem retention while liquidity is contracting. Supply pressure is another consideration. Approximately 4.14B SUI is circulating against a maximum supply of 10B. Around 19.2M SUI is scheduled for release on November 30, worth approximately $15.3M at current prices. That represents roughly 0.46% of circulating supply and adds another test for buyers. Derivatives are showing weakness rather than a convincing accumulation phase. Aggregate futures open interest is around $478.72M, down 3.44% over 24 hours. Funding remains positive at 0.0058% per eight hours, while futures volume is approximately 6.2 times spot volume. Around $1.94M in positions were liquidated, with 97% coming from longs. Spot markets also recorded approximately $5.2M in net outflows. Key figures $0.7953 — Current price $3.29B — Market capitalization $71.25M — 24H spot volume $0.7816–$0.8245 — 24H range $0.7816 — Immediate support $0.8245 — Immediate resistance $0.85 — Next recovery reference 4.14B SUI — Circulating supply 10B SUI — Maximum supply $411.4M — Current reported DeFi TVL $510.9M — DeFi TVL on October 14 19.2M SUI — Scheduled November 30 release $478.72M — Aggregate futures open interest -3.44% — 24H OI change +0.0058% — Funding per 8 hours $1.94M — 24H liquidations -$5.2M — 24H spot net outflow Bullish confirmation: SUI needs to defend $0.7816, reclaim $0.8245 and hold above it with stronger spot volume. A sustained recovery could bring $0.85 into focus, especially if DeFi liquidity begins stabilizing. Bearish confirmation: A decisive break below $0.7816 would expose further downside. Continued spot outflows, declining TVL and the approaching supply release could keep sellers in control. Sui has a credible institutional expansion story, particularly through Brazilian payments, lending and tokenized assets. But the market needs more than access announcements. Growing on-chain liquidity, actual product usage and stronger spot demand must confirm that adoption is translating into value for SUI. Until then, the institutional narrative and weakening market structure remain in conflict. $SUI #ByXIMPACT
SUI is facing a difficult test
SUI is facing a difficult test: institutional adoption is expanding, but ecosystem liquidity is weakening. The market needs to see whether new financial infrastructure can reverse that divergence. SUI is attracting institutional access in Brazil, but weakening DeFi liquidity is creating a contradiction the market cannot ignore. SUI is trading near $0.7953, down approximately 3.38% over 24 hours and 8.37% over seven days. Market capitalization is around $3.29B, with spot volume near $71.25M. The daily range is $0.7816–$0.8245, placing price close to support. Buyers need to reclaim $0.8245 before the short-term structure can improve. The strongest adoption development is Mercado Bitcoin's integration of SUI, USDC and Sui Dollar into its Brazilian platform. The exchange serves approximately 4.5 million clients and will also accept USDsui as collateral in its lending product. More importantly, its tokenized real-world asset platform, which has issued over 800 assets, is expected to expand onto Sui. This creates a regulated distribution channel for payments and tokenized finance. Hashi adds another potential catalyst. Mercado Bitcoin is exploring integration of Sui's native Bitcoin-finance infrastructure into its lending products. However, this remains an exploration, not a live lending service. The important distinction is that institutional access is expanding, but the actual capital and transaction demand still need to materialize. There is a weaker signal beneath the adoption headlines. Sui's DeFi TVL fell from approximately $510.9M on October 14 to $411.4M on November 12, a decline of more than 19%. Suiet, a self-custodial Sui wallet, has also announced that it will end development and API services after November 14. This does not mean Sui's network is shutting down, but it raises questions about ecosystem retention while liquidity is contracting. Supply pressure is another consideration. Approximately 4.14B SUI is circulating against a maximum supply of 10B. Around 19.2M SUI is scheduled for release on November 30, worth approximately $15.3M at current prices. That represents roughly 0.46% of circulating supply and adds another test for buyers. Derivatives are showing weakness rather than a convincing accumulation phase. Aggregate futures open interest is around $478.72M, down 3.44% over 24 hours. Funding remains positive at 0.0058% per eight hours, while futures volume is approximately 6.2 times spot volume. Around $1.94M in positions were liquidated, with 97% coming from longs. Spot markets also recorded approximately $5.2M in net outflows. Key figures $0.7953 — Current price $3.29B — Market capitalization $71.25M — 24H spot volume $0.7816–$0.8245 — 24H range $0.7816 — Immediate support $0.8245 — Immediate resistance $0.85 — Next recovery reference 4.14B SUI — Circulating supply 10B SUI — Maximum supply $411.4M — Current reported DeFi TVL $510.9M — DeFi TVL on October 14 19.2M SUI — Scheduled November 30 release $478.72M — Aggregate futures open interest -3.44% — 24H OI change +0.0058% — Funding per 8 hours $1.94M — 24H liquidations -$5.2M — 24H spot net outflow Bullish confirmation: SUI needs to defend $0.7816, reclaim $0.8245 and hold above it with stronger spot volume. A sustained recovery could bring $0.85 into focus, especially if DeFi liquidity begins stabilizing. Bearish confirmation: A decisive break below $0.7816 would expose further downside. Continued spot outflows, declining TVL and the approaching supply release could keep sellers in control. Sui has a credible institutional expansion story, particularly through Brazilian payments, lending and tokenized assets. But the market needs more than access announcements. Growing on-chain liquidity, actual product usage and stronger spot demand must confirm that adoption is translating into value for SUI. Until then, the institutional narrative and weakening market structure remain in conflict. $SUI #ByXIMPACT
686
·
--
Article
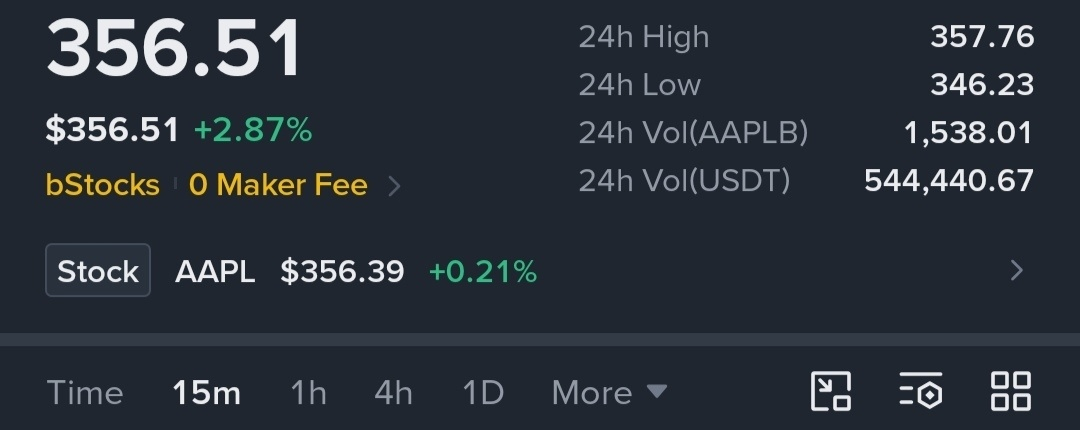
AAPLX is approaching its recent high, but today's dividend adjustment makes one distinction criticalAAPLX is approaching its recent high, but today's dividend adjustment makes one distinction critical: a higher token balance is not the same as new market demand. Apple xStock is trading near $355.40, with a market capitalization around $12.34M and 24-hour volume near $4.41M. It is up approximately 1.6% over 24 hours and 0.1% over seven days. The latest 24-hour range is $346.76–$356.09, while the seven-day range extends from $340.55 to $356.18. Price is testing the upper end of its recent range, with the previous high at $356.18 acting as immediate resistance. Today's main development is Apple's $0.27 per-share cash dividend, declared on November 2, with November 12 as the record date and November 16 as the payment date. The corresponding AAPLX corporate action required a token balance adjustment. Trading and transfers were temporarily suspended during processing, and the reported completion notice scheduled spot trading to resume at 10:00 UTC. This adjustment matters because the token's displayed quantity and unit price can change without representing a conventional market gain or loss. The relevant question is whether AAPLX maintains its value relative to Apple shares once normal trading resumes. Apple's underlying share price is around $354.99, providing an important reference for tracking any premium or discount. AAPLX is designed to provide tokenized exposure to Apple shares, with the xStocks structure using underlying share backing. However, holding the token is not identical to owning Apple shares directly. Token holders do not automatically receive shareholder voting rights, and dividend treatment depends on the issuer's adjustment mechanism rather than assuming a direct cash payment. Derivatives show moderate speculative activity. Aggregate perpetual open interest is around $3.22M, with funding positive near 0.0148% per eight hours. Perpetual volume is approximately 0.9 times spot volume. Positive funding means longs are paying shorts, but the available figures do not establish an extreme leverage imbalance. Spot liquidity and the relationship with Apple's underlying share price remain more important signals. Key figures $355.40 — Current price $12.34M — Market capitalization $4.41M — 24H trading volume +1.6% — 24H performance +0.1% — 7D performance $346.76–$356.09 — 24H range $340.55–$356.18 — 7D range $356.18 — Recent all-time high $354.99 — Apple share reference price $0.27 — Declared dividend per Apple share $3.22M — Perpetual open interest +0.0148% — Funding per 8 hours Bullish confirmation: AAPLX breaks above $356.18 and holds that level while maintaining close alignment with Apple's underlying share price. Stronger spot volume would support a genuine breakout. Bearish confirmation: A rejection near $356.18 followed by a break below $346.76 would weaken the current recovery and expose the $340.55 area. AAPLX has a clear underlying valuation reference, unlike a typical speculative crypto token. Today's dividend adjustment is a corporate-action event, not automatically a bullish catalyst. The next signal is whether buyers can sustain a breakout near the recent high without the token developing a meaningful premium or discount to Apple shares. $AAPLXUSDT #ByXIMPACT
AAPLXUSDT
2.83%
AAPLX is approaching its recent high, but today's dividend adjustment makes one distinction critical
AAPLX is approaching its recent high, but today's dividend adjustment makes one distinction critical: a higher token balance is not the same as new market demand. Apple xStock is trading near $355.40, with a market capitalization around $12.34M and 24-hour volume near $4.41M. It is up approximately 1.6% over 24 hours and 0.1% over seven days. The latest 24-hour range is $346.76–$356.09, while the seven-day range extends from $340.55 to $356.18. Price is testing the upper end of its recent range, with the previous high at $356.18 acting as immediate resistance. Today's main development is Apple's $0.27 per-share cash dividend, declared on November 2, with November 12 as the record date and November 16 as the payment date. The corresponding AAPLX corporate action required a token balance adjustment. Trading and transfers were temporarily suspended during processing, and the reported completion notice scheduled spot trading to resume at 10:00 UTC. This adjustment matters because the token's displayed quantity and unit price can change without representing a conventional market gain or loss. The relevant question is whether AAPLX maintains its value relative to Apple shares once normal trading resumes. Apple's underlying share price is around $354.99, providing an important reference for tracking any premium or discount. AAPLX is designed to provide tokenized exposure to Apple shares, with the xStocks structure using underlying share backing. However, holding the token is not identical to owning Apple shares directly. Token holders do not automatically receive shareholder voting rights, and dividend treatment depends on the issuer's adjustment mechanism rather than assuming a direct cash payment. Derivatives show moderate speculative activity. Aggregate perpetual open interest is around $3.22M, with funding positive near 0.0148% per eight hours. Perpetual volume is approximately 0.9 times spot volume. Positive funding means longs are paying shorts, but the available figures do not establish an extreme leverage imbalance. Spot liquidity and the relationship with Apple's underlying share price remain more important signals. Key figures $355.40 — Current price $12.34M — Market capitalization $4.41M — 24H trading volume +1.6% — 24H performance +0.1% — 7D performance $346.76–$356.09 — 24H range $340.55–$356.18 — 7D range $356.18 — Recent all-time high $354.99 — Apple share reference price $0.27 — Declared dividend per Apple share $3.22M — Perpetual open interest +0.0148% — Funding per 8 hours Bullish confirmation: AAPLX breaks above $356.18 and holds that level while maintaining close alignment with Apple's underlying share price. Stronger spot volume would support a genuine breakout. Bearish confirmation: A rejection near $356.18 followed by a break below $346.76 would weaken the current recovery and expose the $340.55 area. AAPLX has a clear underlying valuation reference, unlike a typical speculative crypto token. Today's dividend adjustment is a corporate-action event, not automatically a bullish catalyst. The next signal is whether buyers can sustain a breakout near the recent high without the token developing a meaningful premium or discount to Apple shares. $AAPLXUSDT #ByXIMPACT
AAPLXUSDT
2.83%
AAPLXUSDT
2.83%
293
·
--
Article
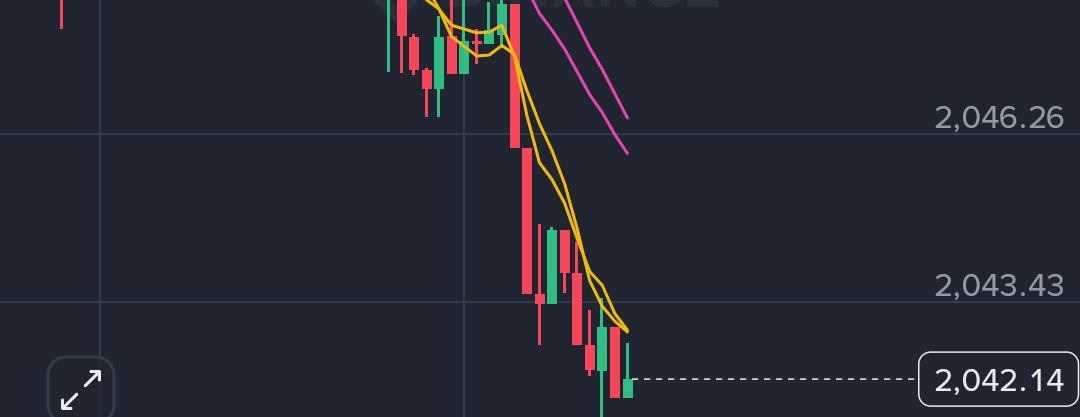
Ethereum is holding above $2,000, but institutional outflows and weak spotEthereum is holding above $2,000, but institutional outflows and weak spot participation are preventing a convincing recovery. ETH is trading near $2,052, down approximately 0.04% over 24 hours and 8.17% over seven days. Price has moved between $2,034 and $2,103, leaving buyers close to an important support zone. The weekly structure remains bearish, with ETH still nearly 59% below its all-time high. The institutional picture is showing a small improvement, but not a reversal. US spot Ethereum ETFs recorded approximately $4.8M in net outflows on November 11, marking the fifth consecutive session of withdrawals. However, this is significantly smaller than the $184.6M outflow recorded on November 9. Selling pressure is cooling, but institutional demand has not returned convincingly. Ethereum's longer-term fundamental case remains relevant. Its role in stablecoin settlement, tokenized assets and DeFi continues to support its position as a major financial infrastructure network. The challenge is that network adoption does not always translate directly into ETH price appreciation. Transaction demand, staking economics, fee generation and ETH's role as collateral must strengthen together. Derivatives show a market that is still heavily active despite limited price movement. Futures volume is approximately 15 times spot volume, while open interest remains near $24.87B. Funding is slightly positive at 0.0065%, and approximately $41.63M in positions were liquidated over 24 hours, with longs accounting for 54%. Open interest is declining slightly, suggesting some leverage is being removed rather than fresh conviction entering. Key figures $2,051.9 — Current price $2,034.6 — Immediate support $2,103.6 — Immediate resistance $2,150 — Next recovery reference $250.31B — Market capitalization $1.86B — 24H spot volume $27.68B — 24H futures volume $24.87B — Open interest -0.51% — 24H OI change 0.0065% — Funding rate $41.63M — 24H liquidations -$4.8M — November 11 ETF net flow Bullish confirmation: ETH needs to defend $2,034 and reclaim $2,103 with stronger spot participation. A sustained move above $2,150, combined with ETF inflows returning, would provide stronger evidence of a recovery. Bearish confirmation: A decisive breakdown below $2,034 would weaken the current support structure. Continued ETF withdrawals and futures-heavy trading without spot accumulation would increase the risk of another downside move. Ethereum's immediate challenge is not a lack of institutional infrastructure or ecosystem utility. It is the absence of convincing new capital entering the market. Until spot demand and ETF flows improve together, holding $2,000 is defensive strength, not yet a confirmed bullish reversal. $ETHUSDT #ByXIMPACT
ETHUSDT
-1.16%
Ethereum is holding above $2,000, but institutional outflows and weak spot
Ethereum is holding above $2,000, but institutional outflows and weak spot participation are preventing a convincing recovery. ETH is trading near $2,052, down approximately 0.04% over 24 hours and 8.17% over seven days. Price has moved between $2,034 and $2,103, leaving buyers close to an important support zone. The weekly structure remains bearish, with ETH still nearly 59% below its all-time high. The institutional picture is showing a small improvement, but not a reversal. US spot Ethereum ETFs recorded approximately $4.8M in net outflows on November 11, marking the fifth consecutive session of withdrawals. However, this is significantly smaller than the $184.6M outflow recorded on November 9. Selling pressure is cooling, but institutional demand has not returned convincingly. Ethereum's longer-term fundamental case remains relevant. Its role in stablecoin settlement, tokenized assets and DeFi continues to support its position as a major financial infrastructure network. The challenge is that network adoption does not always translate directly into ETH price appreciation. Transaction demand, staking economics, fee generation and ETH's role as collateral must strengthen together. Derivatives show a market that is still heavily active despite limited price movement. Futures volume is approximately 15 times spot volume, while open interest remains near $24.87B. Funding is slightly positive at 0.0065%, and approximately $41.63M in positions were liquidated over 24 hours, with longs accounting for 54%. Open interest is declining slightly, suggesting some leverage is being removed rather than fresh conviction entering. Key figures $2,051.9 — Current price $2,034.6 — Immediate support $2,103.6 — Immediate resistance $2,150 — Next recovery reference $250.31B — Market capitalization $1.86B — 24H spot volume $27.68B — 24H futures volume $24.87B — Open interest -0.51% — 24H OI change 0.0065% — Funding rate $41.63M — 24H liquidations -$4.8M — November 11 ETF net flow Bullish confirmation: ETH needs to defend $2,034 and reclaim $2,103 with stronger spot participation. A sustained move above $2,150, combined with ETF inflows returning, would provide stronger evidence of a recovery. Bearish confirmation: A decisive breakdown below $2,034 would weaken the current support structure. Continued ETF withdrawals and futures-heavy trading without spot accumulation would increase the risk of another downside move. Ethereum's immediate challenge is not a lack of institutional infrastructure or ecosystem utility. It is the absence of convincing new capital entering the market. Until spot demand and ETF flows improve together, holding $2,000 is defensive strength, not yet a confirmed bullish reversal. $ETHUSDT #ByXIMPACT
ETHUSDT
-1.16%
ETHUSDT
-1.16%
638
·
--
🔔🇷🇺 OPENS THE DOOR TO BITCOIN & CRYPTO TRADING!
Russia is taking another major step toward crypto adoption! The Bank of Russia has approved Bitcoin ($BTC ), Ethereum (ETH), and USDT for public trading through regulated intermediaries.
17 KEY DATES
- November 17: New rules officially take effect.
- December 1: Moscow Exchange plans to begin its crypto trading rollout.
Retail investors will face an annual purchase limit of 300,000 rubles per intermediary and must complete a risk assessment before trading. Qualified investors will have broader access to crypto assets.
This is a significant move for Russia's crypto market and could encourage wider institutional participation.
While the US debates crypto legislation,
Russia is moving ahead with regulated access. Could this increase global crypto adoption?👀
#BybitAIEvolving $BTC
{future}(BTCUSDT)
$ETH
🔔🇷🇺 OPENS THE DOOR TO BITCOIN & CRYPTO TRADING!
Russia is taking another major step toward crypto adoption! The Bank of Russia has approved Bitcoin ($BTC ), Ethereum (ETH), and USDT for public trading through regulated intermediaries.
17 KEY DATES
- November 17: New rules officially take effect.
- December 1: Moscow Exchange plans to begin its crypto trading rollout.
Retail investors will face an annual purchase limit of 300,000 rubles per intermediary and must complete a risk assessment before trading. Qualified investors will have broader access to crypto assets.
This is a significant move for Russia's crypto market and could encourage wider institutional participation.
While the US debates crypto legislation,
Russia is moving ahead with regulated access. Could this increase global crypto adoption?👀
#BybitAIEvolving $BTC
$ETH
Russia is taking another major step toward crypto adoption! The Bank of Russia has approved Bitcoin ($BTC ), Ethereum (ETH), and USDT for public trading through regulated intermediaries.
17 KEY DATES
- November 17: New rules officially take effect.
- December 1: Moscow Exchange plans to begin its crypto trading rollout.
Retail investors will face an annual purchase limit of 300,000 rubles per intermediary and must complete a risk assessment before trading. Qualified investors will have broader access to crypto assets.
This is a significant move for Russia's crypto market and could encourage wider institutional participation.
While the US debates crypto legislation,
Russia is moving ahead with regulated access. Could this increase global crypto adoption?👀
#BybitAIEvolving $BTC
$ETH

45
·
--
CAN $TRUMP MAKE A MASSIVE COMEBACK TO ITS PREVIOUS HIGH?
Is this just a temporary dip before the next big rally, or will investors have to wait longer for recovery?
I'm watching $TRUMP closely. Are you buying this dip or waiting for confirmation?
What’s your target for $TRUMP in the next bull run?
Share your prediction in the comments and let's discuss.
TRUMP
1.141
+0.26%
#TRUMP #trumpcoin #Crypto #BinanceSquareFamilyy #US-IranTalksFuelStrongStockMarketRebound
CAN $TRUMP MAKE A MASSIVE COMEBACK TO ITS PREVIOUS HIGH?
Is this just a temporary dip before the next big rally, or will investors have to wait longer for recovery?
I'm watching $TRUMP closely. Are you buying this dip or waiting for confirmation?
What’s your target for $TRUMP in the next bull run?
Share your prediction in the comments and let's discuss.
TRUMP
1.141
+0.26%
#TRUMP #trumpcoin #Crypto #BinanceSquareFamilyy #US-IranTalksFuelStrongStockMarketRebound
Is this just a temporary dip before the next big rally, or will investors have to wait longer for recovery?
I'm watching $TRUMP closely. Are you buying this dip or waiting for confirmation?
What’s your target for $TRUMP in the next bull run?
Share your prediction in the comments and let's discuss.
TRUMP
1.141
+0.26%
#TRUMP #trumpcoin #Crypto #BinanceSquareFamilyy #US-IranTalksFuelStrongStockMarketRebound
86
·
--
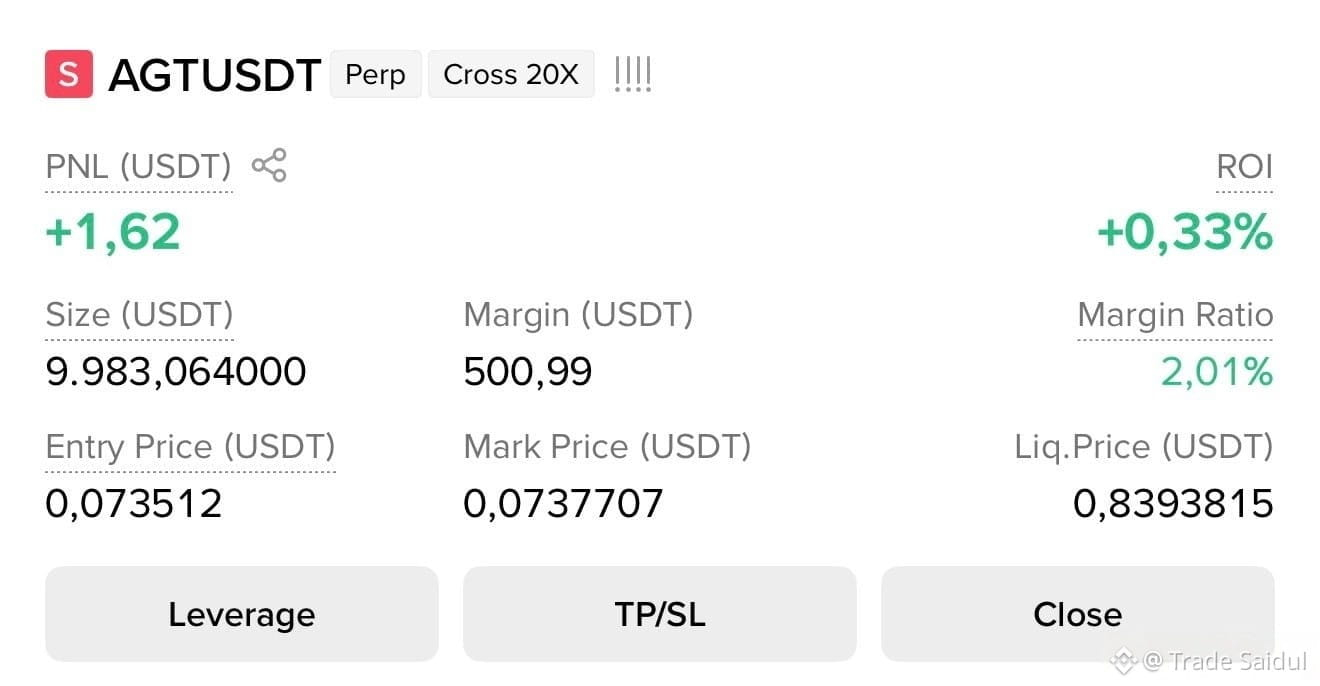
Setup short $AGT
ン
entry: 0.07620- 0.09588
sl: 0.1280
TP 1: 0.05801
TP 2: 0.02377
TP 3: 0.01655
Trade $AGT 👇#HotCPIDecemberHikePriced #CoreWeaveJumps10%On168%RevenueGrowth $AMZNB $SPCXB
Setup short $AGT
ン
entry: 0.07620- 0.09588
sl: 0.1280
TP 1: 0.05801
TP 2: 0.02377
TP 3: 0.01655
Trade $AGT 👇#HotCPIDecemberHikePriced #CoreWeaveJumps10%On168%RevenueGrowth $AMZNB $SPCXB
ン
entry: 0.07620- 0.09588
sl: 0.1280
TP 1: 0.05801
TP 2: 0.02377
TP 3: 0.01655
Trade $AGT 👇#HotCPIDecemberHikePriced #CoreWeaveJumps10%On168%RevenueGrowth $AMZNB $SPCXB
89
·
--
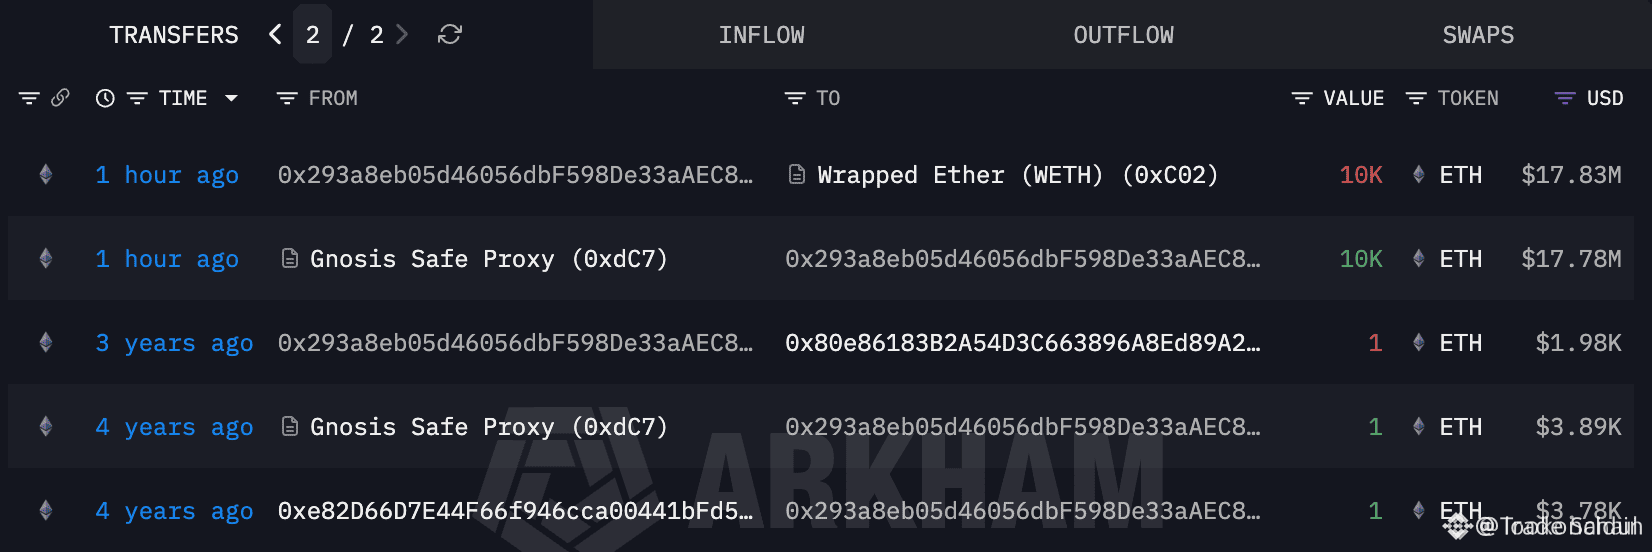
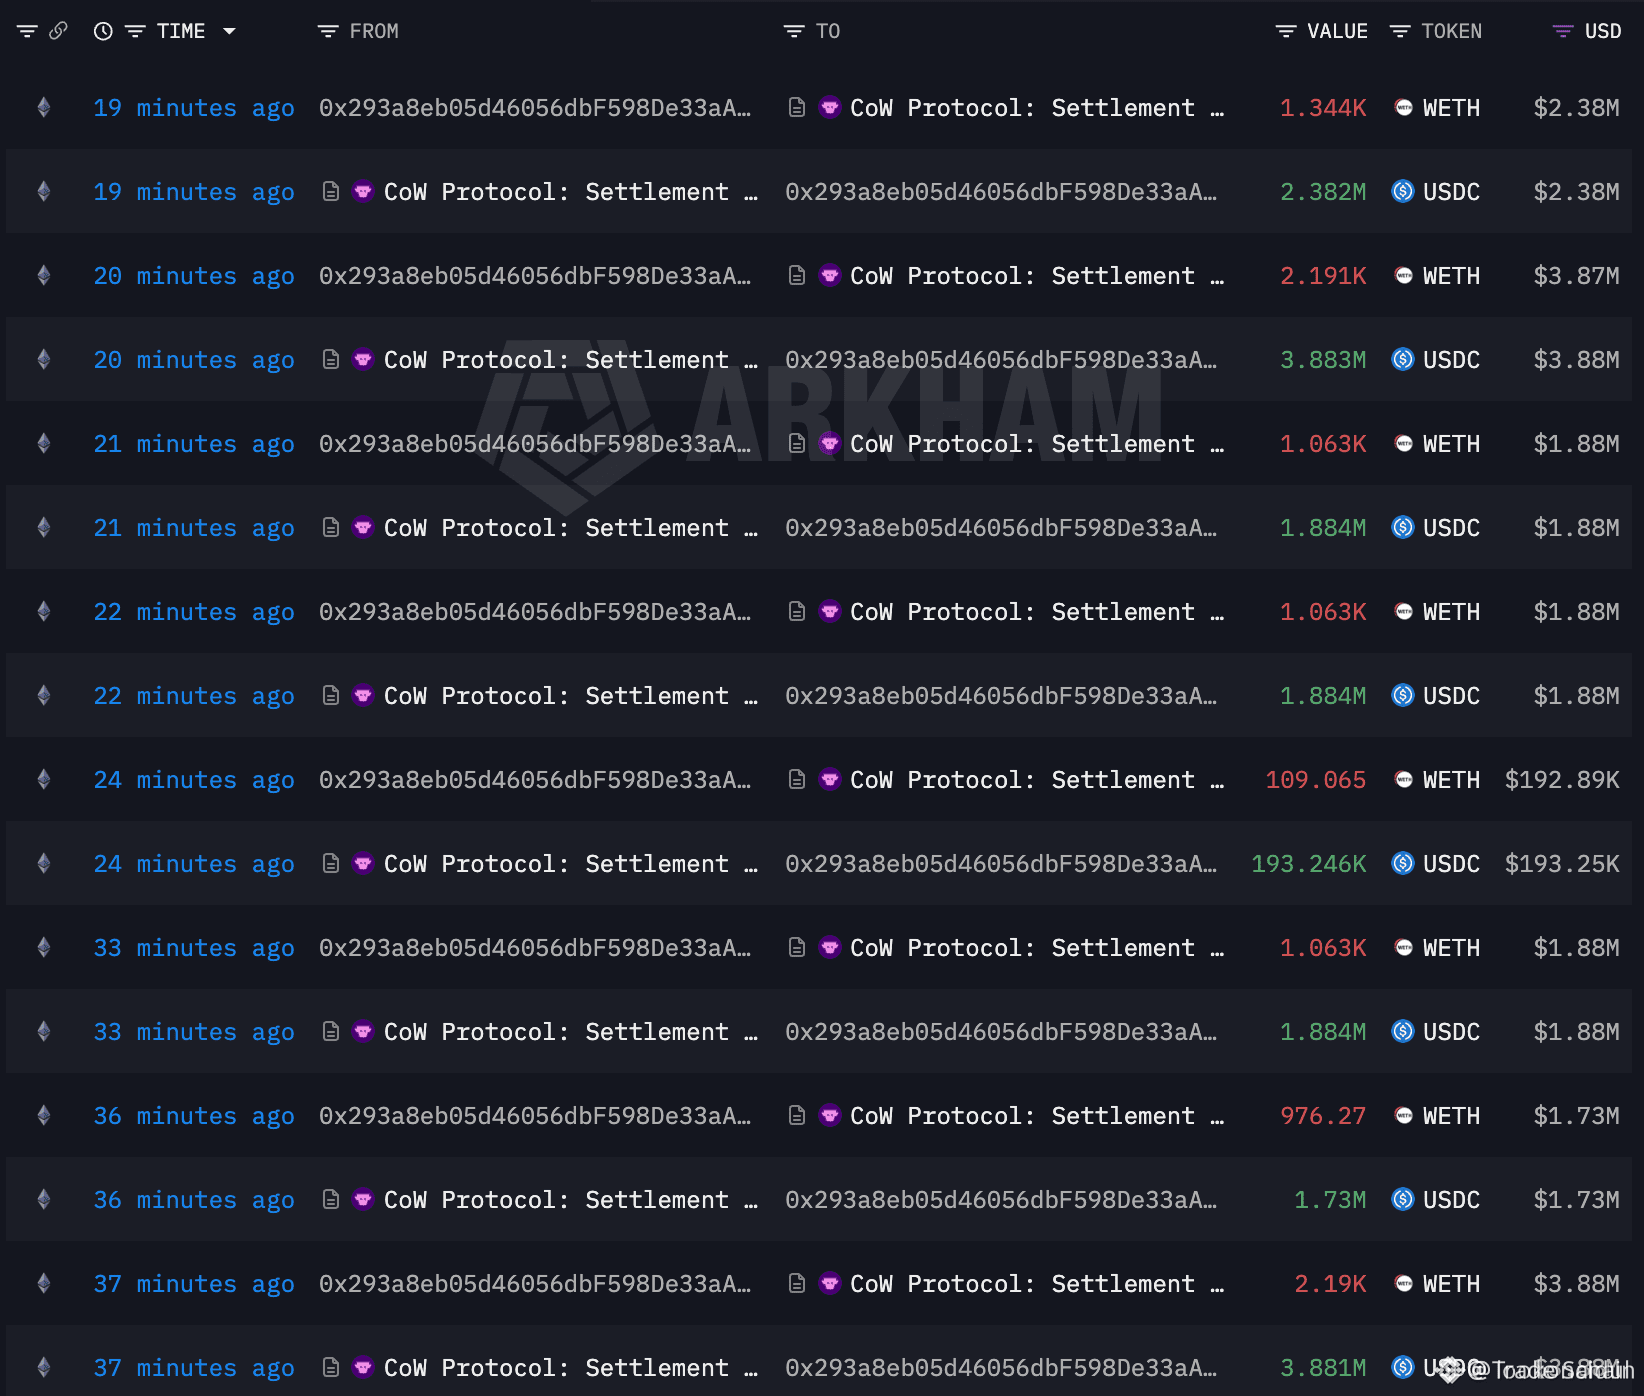
A wallet(0x293a) that had been dormant for 3 years received 10,000 $ETH an hour ago and sold it for 17.72M $USDC at an average price of $1,772.
https://arkm.com/explorer/address/0x293a8eb05d46056dbF598De33aAEC8eb052a9b9a
$BTC
A wallet(0x293a) that had been dormant for 3 years received 10,000 $ETH an hour ago and sold it for 17.72M $USDC at an average price of $1,772.
https://arkm.com/explorer/address/0x293a8eb05d46056dbF598De33aAEC8eb052a9b9a
$BTC
https://arkm.com/explorer/address/0x293a8eb05d46056dbF598De33aAEC8eb052a9b9a
$BTC
64
·
--
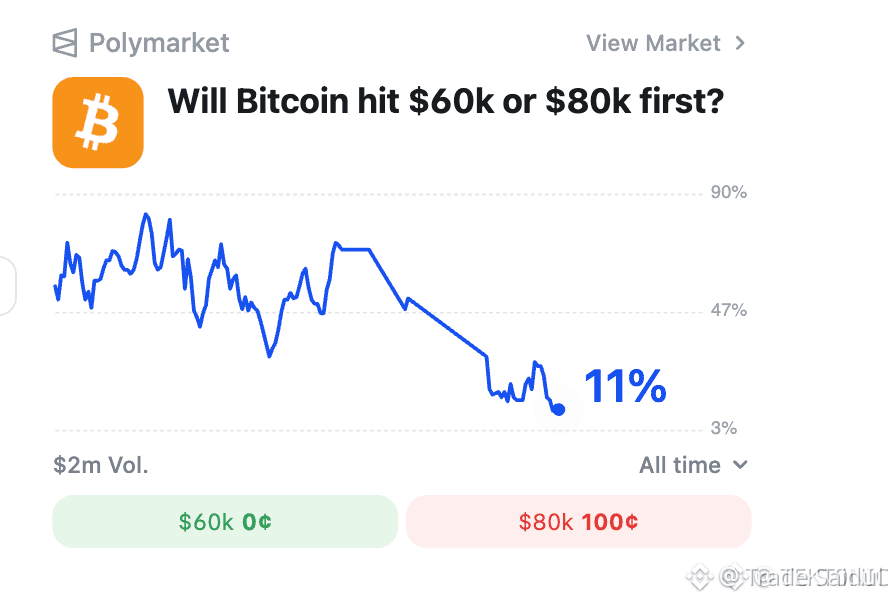
🚨BREAKING: Prediction Markets Price 80% Chance Bitcoin Falls Below $60,000.
Prediction markets are flashing strong bearish sentiment, with traders now assigning roughly an 80% probability that $BTC will drop below $60,000 at some point in the coming period (specific timeframe varies by market — often by year-end or within defined windows).
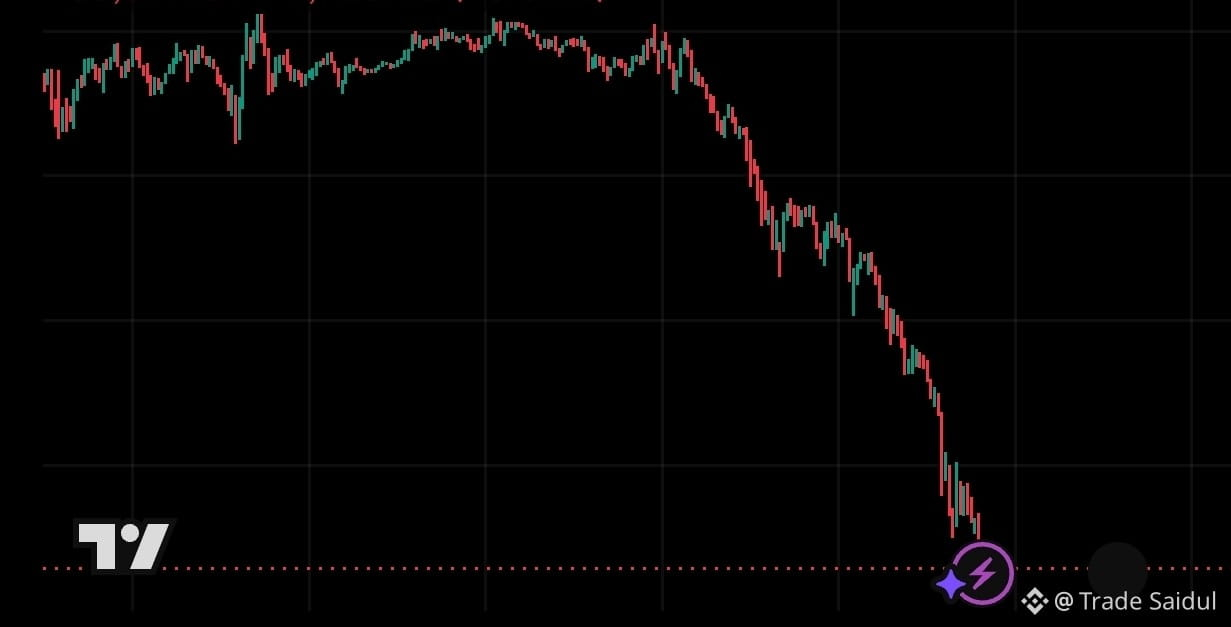
This spike in odds comes amid the current bleed below $70K, heavy ETF outflows, Mt. Gox movements, miner margin pressure, and renewed geopolitical risks from Iran halting talks.
Quick Context:
Long-term holders are feeling pain but not yet at full capitulation levels.
Key supports sit at $65K–$68K, with $60K acting as a major psychological and historical zone.
Corporate treasuries (Strategy, Strive, Bitmine, etc.) continue providing a counter-balance through accumulation.
While prediction markets have been accurate on short-term volatility before, they can swing rapidly with sentiment. A break below $60K would likely trigger deeper capitulation and strong buying interest from dip accumulators.
80% Market Odds: Bitcoin to Drop Below $60K
🚨BREAKING: Prediction Markets Price 80% Chance Bitcoin Falls Below $60,000.
Prediction markets are flashing strong bearish sentiment, with traders now assigning roughly an 80% probability that $BTC will drop below $60,000 at some point in the coming period (specific timeframe varies by market — often by year-end or within defined windows).
This spike in odds comes amid the current bleed below $70K, heavy ETF outflows, Mt. Gox movements, miner margin pressure, and renewed geopolitical risks from Iran halting talks.
Quick Context:
Long-term holders are feeling pain but not yet at full capitulation levels.
Key supports sit at $65K–$68K, with $60K acting as a major psychological and historical zone.
Corporate treasuries (Strategy, Strive, Bitmine, etc.) continue providing a counter-balance through accumulation.
While prediction markets have been accurate on short-term volatility before, they can swing rapidly with sentiment. A break below $60K would likely trigger deeper capitulation and strong buying interest from dip accumulators.
80% Market Odds: Bitcoin to Drop Below $60K
Prediction markets are flashing strong bearish sentiment, with traders now assigning roughly an 80% probability that $BTC will drop below $60,000 at some point in the coming period (specific timeframe varies by market — often by year-end or within defined windows).
This spike in odds comes amid the current bleed below $70K, heavy ETF outflows, Mt. Gox movements, miner margin pressure, and renewed geopolitical risks from Iran halting talks.
Quick Context:
Long-term holders are feeling pain but not yet at full capitulation levels.
Key supports sit at $65K–$68K, with $60K acting as a major psychological and historical zone.
Corporate treasuries (Strategy, Strive, Bitmine, etc.) continue providing a counter-balance through accumulation.
While prediction markets have been accurate on short-term volatility before, they can swing rapidly with sentiment. A break below $60K would likely trigger deeper capitulation and strong buying interest from dip accumulators.
80% Market Odds: Bitcoin to Drop Below $60K
68
·
--
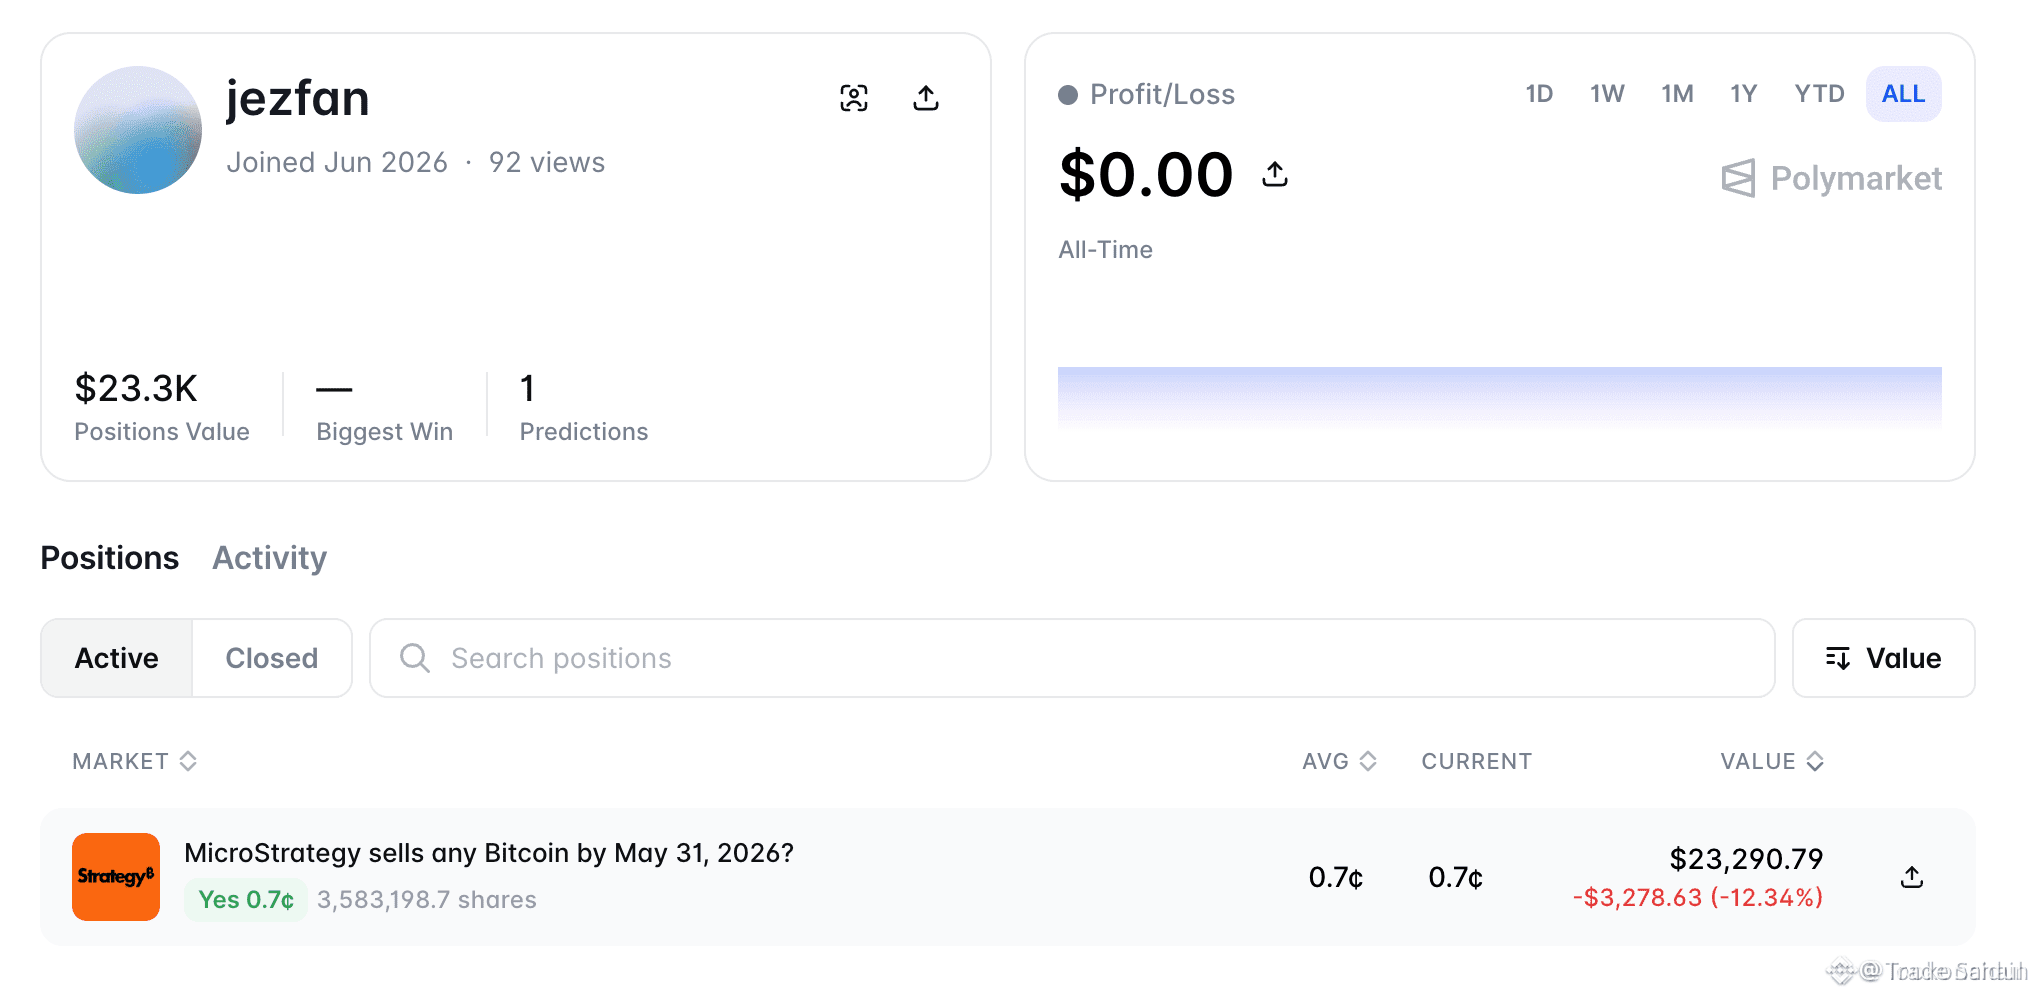
A $ETH $26.6K bet for a potential $3.55M profit. That's an incredible risk-reward trade!
A new wallet, "jezfan", spent $26.6K on Polymarket betting the ruling on "MicroStrategy sells any $BTC by May 31, 2026" will be changed.
If the outcome is changed to YES, he could make a profit of $3.55M.
https://polymarket.com/0x5676e1472ccc662791dc08691ef8d5b267ea6f1d
A $ETH $26.6K bet for a potential $3.55M profit. That's an incredible risk-reward trade!
A new wallet, "jezfan", spent $26.6K on Polymarket betting the ruling on "MicroStrategy sells any $BTC by May 31, 2026" will be changed.
If the outcome is changed to YES, he could make a profit of $3.55M.
https://polymarket.com/0x5676e1472ccc662791dc08691ef8d5b267ea6f1d
A new wallet, "jezfan", spent $26.6K on Polymarket betting the ruling on "MicroStrategy sells any $BTC by May 31, 2026" will be changed.
If the outcome is changed to YES, he could make a profit of $3.55M.
https://polymarket.com/0x5676e1472ccc662791dc08691ef8d5b267ea6f1d
133
·
--
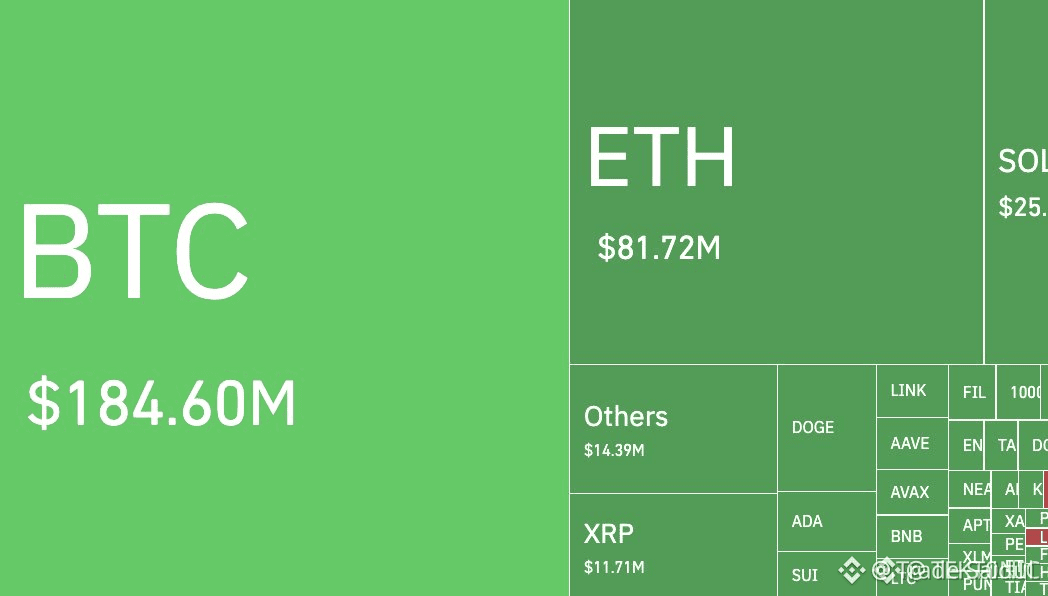
🚨 JUST IN: Over $329 Million in Crypto Longs Liquidated in the Past Hour.
The market selloff has triggered a sharp wave of liquidations, with roughly $329 million worth of leveraged long positions wiped out across major exchanges in just the last hour.
Bitcoin dropping below $69,000, combined with renewed geopolitical tension from Iran halting US talks, has accelerated the cascade. Ethereum and major altcoins also saw heavy long liquidations as risk appetite evaporated.
This brings the 24-hour total liquidation figure well above $800 million, with longs bearing the brunt of the pain.
Such rapid wipes often mark local capitulation points but also fuel further volatility in the short term.
$329M Crypto Longs Liquidated in 1 Hour Amid Sharp $BTC
{spot}(BTCUSDT)
$ETH $BNB Selloff
🚨 JUST IN: Over $329 Million in Crypto Longs Liquidated in the Past Hour.
The market selloff has triggered a sharp wave of liquidations, with roughly $329 million worth of leveraged long positions wiped out across major exchanges in just the last hour.
Bitcoin dropping below $69,000, combined with renewed geopolitical tension from Iran halting US talks, has accelerated the cascade. Ethereum and major altcoins also saw heavy long liquidations as risk appetite evaporated.
This brings the 24-hour total liquidation figure well above $800 million, with longs bearing the brunt of the pain.
Such rapid wipes often mark local capitulation points but also fuel further volatility in the short term.
$329M Crypto Longs Liquidated in 1 Hour Amid Sharp $BTC
$ETH $BNB Selloff
The market selloff has triggered a sharp wave of liquidations, with roughly $329 million worth of leveraged long positions wiped out across major exchanges in just the last hour.
Bitcoin dropping below $69,000, combined with renewed geopolitical tension from Iran halting US talks, has accelerated the cascade. Ethereum and major altcoins also saw heavy long liquidations as risk appetite evaporated.
This brings the 24-hour total liquidation figure well above $800 million, with longs bearing the brunt of the pain.
Such rapid wipes often mark local capitulation points but also fuel further volatility in the short term.
$329M Crypto Longs Liquidated in 1 Hour Amid Sharp $BTC
$ETH $BNB Selloff
72
·
--
Bullish
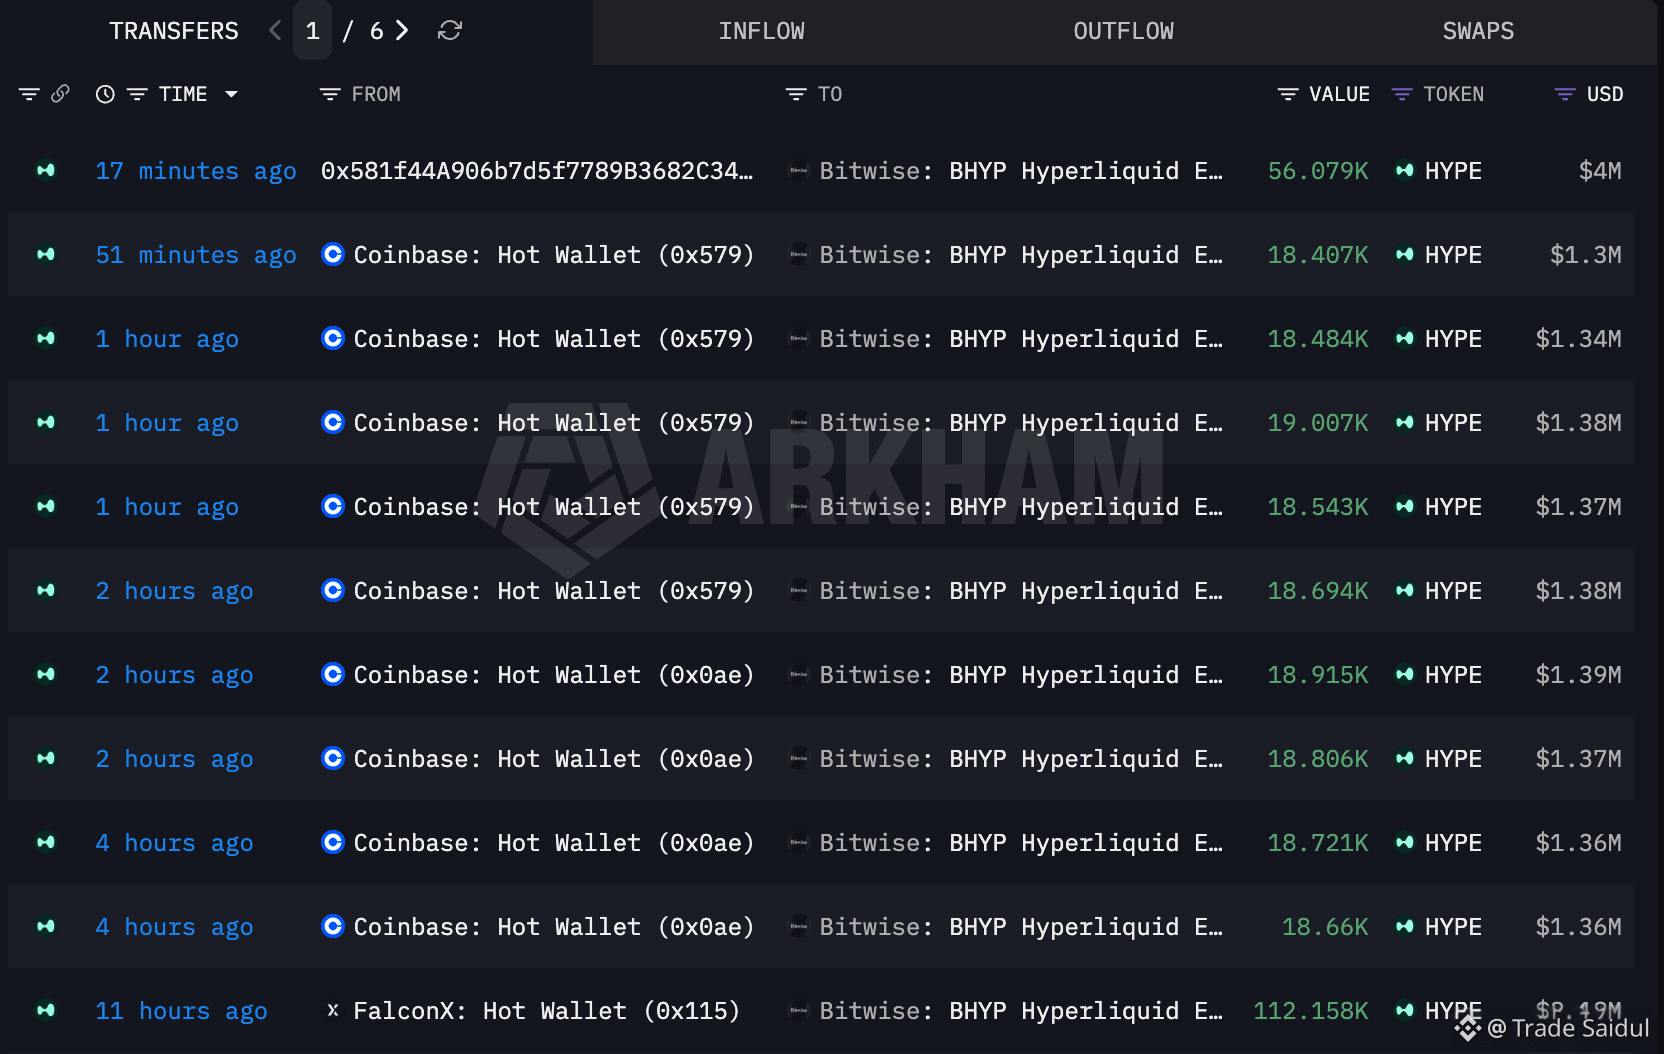
Bitwise bought another 336,474 $HYPE ($24.43M) in the past 12 hours.
https://intel.arkm.com/explorer/entity/bitwise
Bitwise bought another 336,474 $HYPE ($24.43M) in the past 12 hours.
https://intel.arkm.com/explorer/entity/bitwise
https://intel.arkm.com/explorer/entity/bitwise
29
·
--
Bearish
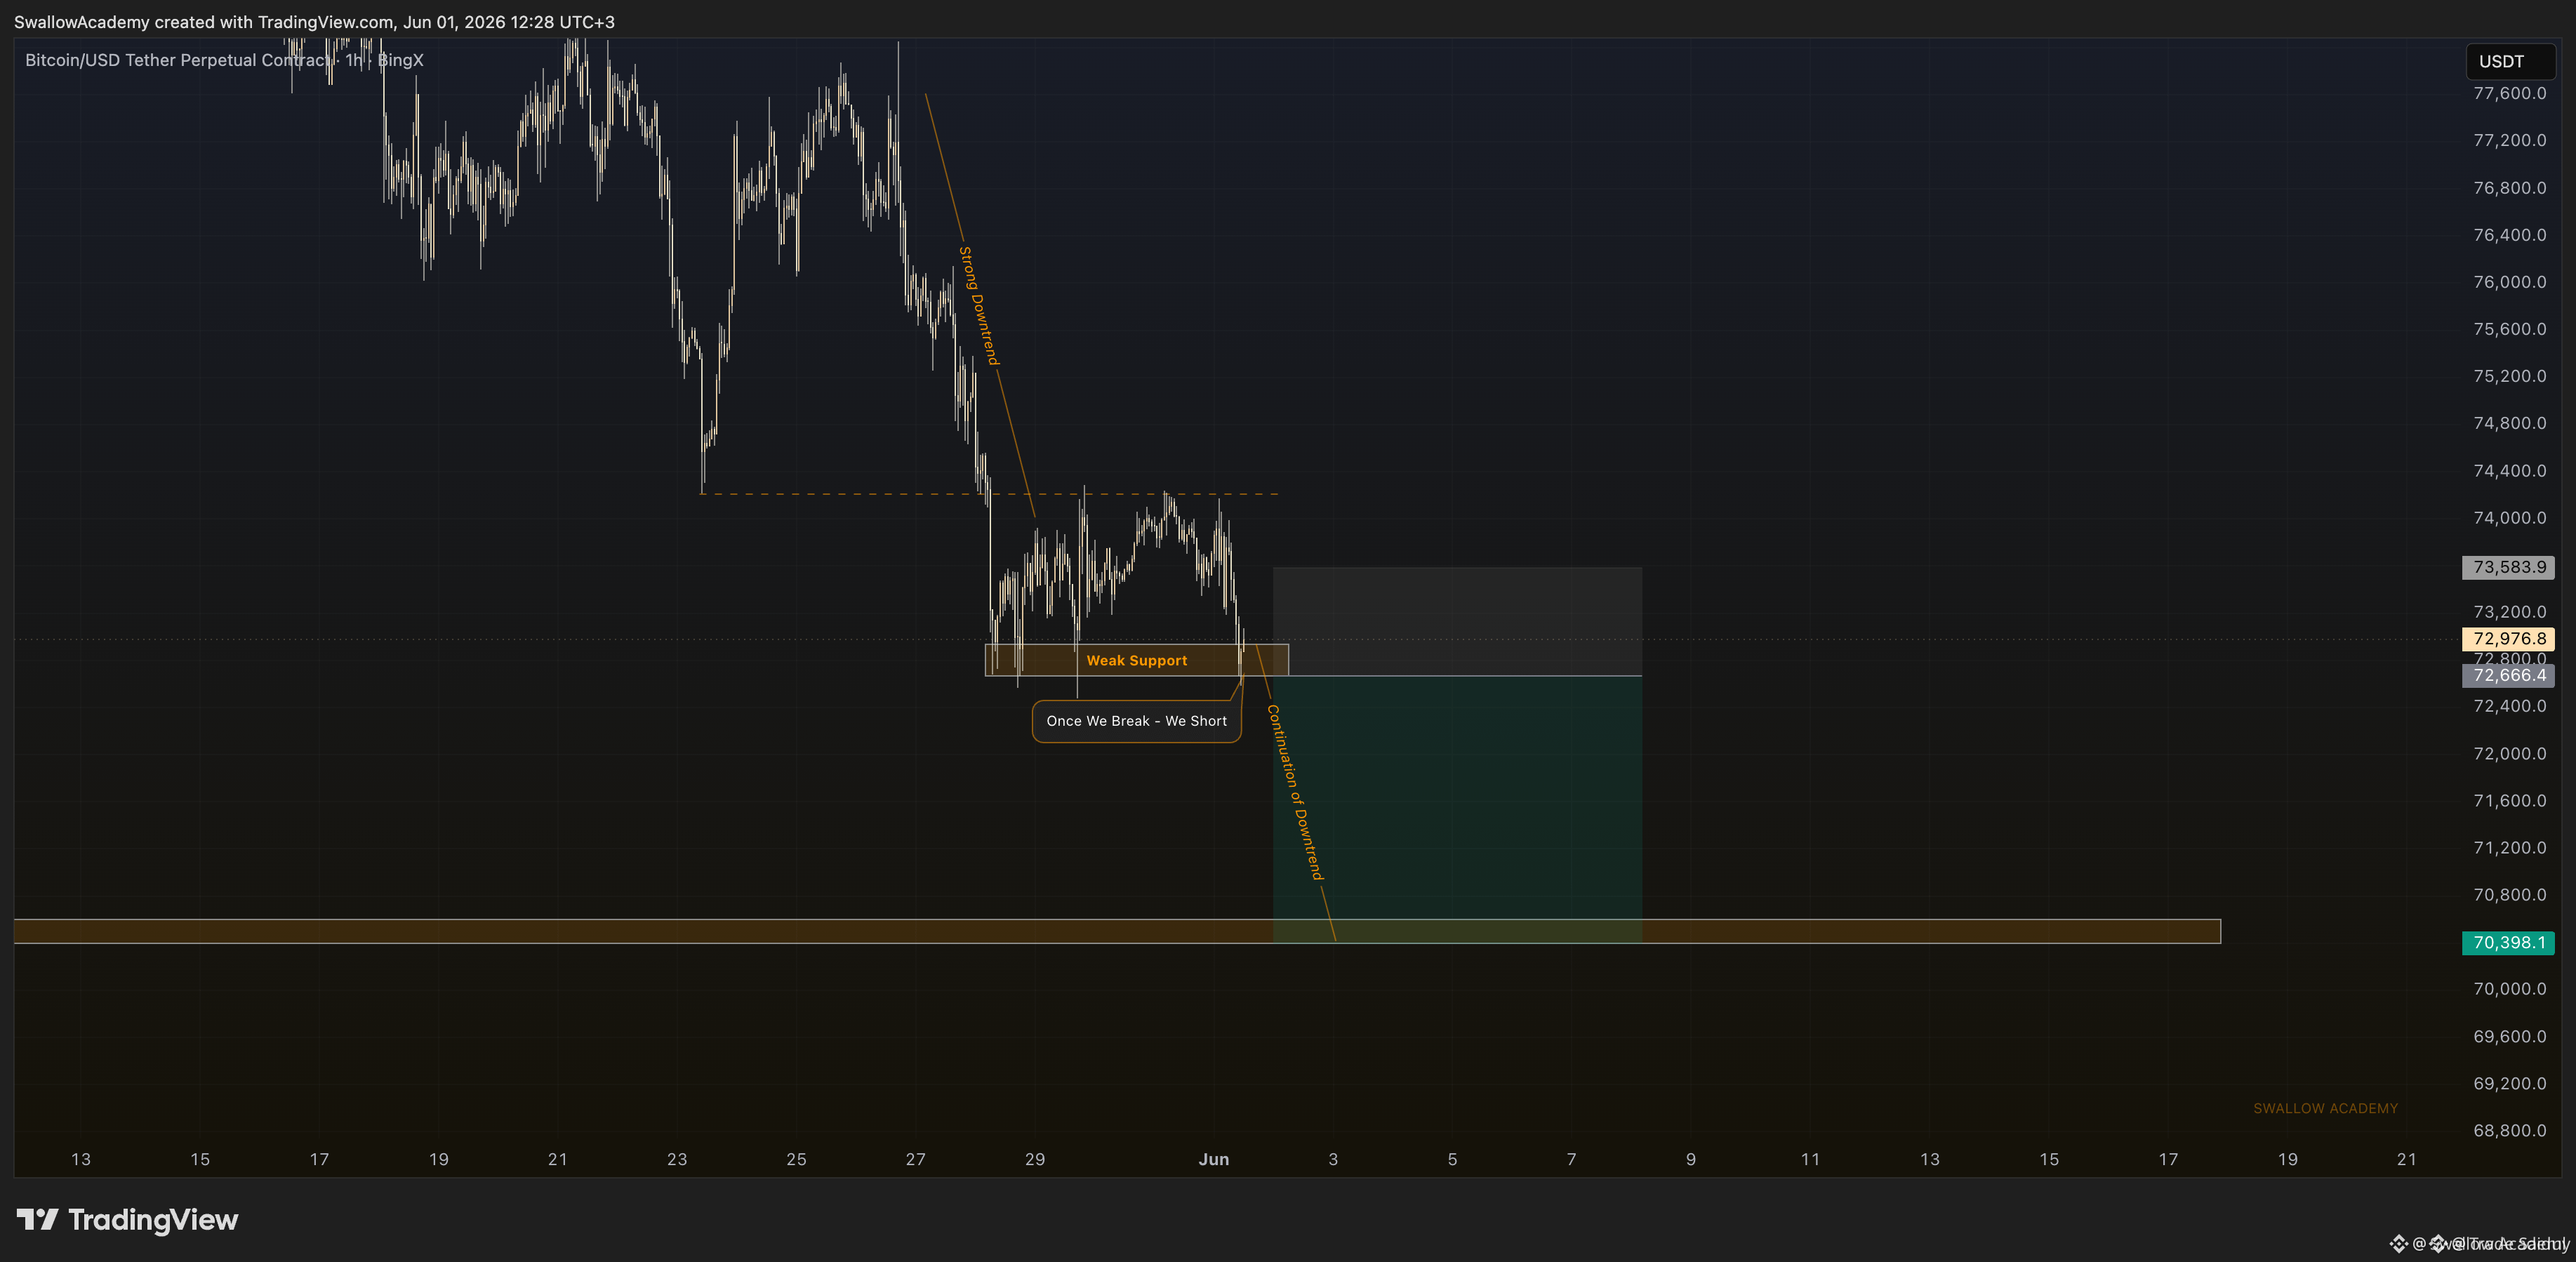
$BTC started the week with sharp downside pressure which is about to open a good momentum for us.
After the first wave of drop, price decided to have a small correction — and what we see forming now is possibly our favourite failed double bottom pattern.
Looking for a break of that support, and once it breaks, we short!#EthereumStakingRatioRecordHigh
$BTC started the week with sharp downside pressure which is about to open a good momentum for us.
After the first wave of drop, price decided to have a small correction — and what we see forming now is possibly our favourite failed double bottom pattern.
Looking for a break of that support, and once it breaks, we short!#EthereumStakingRatioRecordHigh
After the first wave of drop, price decided to have a small correction — and what we see forming now is possibly our favourite failed double bottom pattern.
Looking for a break of that support, and once it breaks, we short!#EthereumStakingRatioRecordHigh
30
·
--
Bullish
🚨 BREAKING: Iran Suspends Peace Talks with US in Protest Over Israel.
Iran has announced it is halting negotiations with the United States, citing Israel’s ongoing military actions in Lebanon as a violation of the ceasefire.
According to Iranian state media (Tasnim) and Foreign Ministry sources, the negotiation team will stop “talks and exchange of texts through intermediaries” until the situation is addressed. Tehran views Israel’s operations as undermining the fragile truce framework.
This development comes amid recent progress on a potential deal involving the Strait of Hormuz reopening and nuclear issues, but highlights how regional tensions (particularly involving Israel) continue to complicate U.S.-Iran diplomacy.
Markets are likely to react with renewed volatility in oil and risk assets.
Iran Halts US Peace Talks Over Israel’s Actions in Lebanon $CL $BZ #IranHaltsCommunicationWithUS
🚨 BREAKING: Iran Suspends Peace Talks with US in Protest Over Israel.
Iran has announced it is halting negotiations with the United States, citing Israel’s ongoing military actions in Lebanon as a violation of the ceasefire.
According to Iranian state media (Tasnim) and Foreign Ministry sources, the negotiation team will stop “talks and exchange of texts through intermediaries” until the situation is addressed. Tehran views Israel’s operations as undermining the fragile truce framework.
This development comes amid recent progress on a potential deal involving the Strait of Hormuz reopening and nuclear issues, but highlights how regional tensions (particularly involving Israel) continue to complicate U.S.-Iran diplomacy.
Markets are likely to react with renewed volatility in oil and risk assets.
Iran Halts US Peace Talks Over Israel’s Actions in Lebanon $CL $BZ #IranHaltsCommunicationWithUS
Iran has announced it is halting negotiations with the United States, citing Israel’s ongoing military actions in Lebanon as a violation of the ceasefire.
According to Iranian state media (Tasnim) and Foreign Ministry sources, the negotiation team will stop “talks and exchange of texts through intermediaries” until the situation is addressed. Tehran views Israel’s operations as undermining the fragile truce framework.
This development comes amid recent progress on a potential deal involving the Strait of Hormuz reopening and nuclear issues, but highlights how regional tensions (particularly involving Israel) continue to complicate U.S.-Iran diplomacy.
Markets are likely to react with renewed volatility in oil and risk assets.
Iran Halts US Peace Talks Over Israel’s Actions in Lebanon $CL $BZ #IranHaltsCommunicationWithUS

46
·
--
This is a general Binance Exchange Notice. Products and services referred to here may not be availabThis is a general Binance Exchange Notice. Products and services referred to here may not be available in your region.
Fellow Binancians,$ETH
To expand the list of trading choices offered on Binance Futures and enhance users’ trading experience, Binance Futures will launch the following perpetual contract(s) as below:
2026-06-02 03:00 (UTC): SKHYNIXUSDT Perpetual Contract
2026-06-02 03:10 (UTC): SAMSUNGUSDT Perpetual Contract
2026-06-02 03:20 (UTC): HYUNDAIUSDT Perpetual Contract
More details on the aforementioned perpetual contract(s) can be found in the table below:
USDⓈ-M Perpetual Contract
SKHYNIXUSDT
SAMSUNGUSDT
HYUNDAIUSDT
Launch Time
2026-06-02 03:00 (UTC)
2026-06-02 03:10 (UTC)
2026-06-02 03:20 (UTC)
Underlying Equity/Index
SK Hynix Inc.
Samsung Electronics Co., Ltd.
Hyundai Motor Company
Underlying Equity/Index Info
SKHYNIXUSDT Perpetual Contract tracks the stock price of SK Hynix Inc.
SAMSUNGUSDT Perpetual Contract tracks the stock price of Samsung Electronics Co., Ltd.
HYUNDAIUSDT Perpetual Contract tracks the stock price of Hyundai Motor Company.
Settlement Asset
USDT$BTC
Tick Size
0.01
0.01
0.01
Min Trade Amount
0.01 SKHYNIX
0.01 SAMSUNG
0.01 HYUNDAI
Min Notional Value
5 USDT
5 USDT
5 USDT
Capped Funding Rate
+2.00% / -2.00%
+2.00% / -2.00%
+2.00% / -2.00%
Funding Fee Settlement Frequency
Every Eight Hours
Every Eight Hours
Every Eight Hours
Interest Rate of Funding Rate
0%
0%
0%
Maximum Leverage
20x
20x
20x
Trading Hours
24/7
24/7
24/7
Multi-Assets Mode
Supported
Supported
Supported
Please Note:
This information is released as a Notice under Binance Exchange Rule 17.
The aforementioned perpetual contract(s) are exempted from 8.1 Adjustment of Funding Interval rules. The funding interval will not be adjusted from every eight hours to every one hour when the previous funding rate settlement of the aforementioned perpetual contract(s) reach the funding rate cap or floor.
Based on market risk conditions, Binance may adjust the specifications of the aforementioned Futures contract(s) from time to time, which include the funding fee, tick size, maximum leverage, initial margin, and/or maintenance margin requirements.
In case there is a discrepancy between this notice and any Futures FAQ, please refer to this notice for the most accurate and updated information.
There may be discrepancies between this original content in English and any translated versions. Please refer to the original English version for the most accurate information, in case any discrepancies arise.
Further Information:
Perpetual Futures on Traditional Assets
Trading Rules to Trading Parameter
Leverage and Margin of USDⓈ-M Futures Contracts
Binance Futures Fee Structure
How to Select Trading Pairs
Funding Rate History
Mark Price and Price Index
Multi-Assets Mode
Binance Futures Contract Specification
Thank you for your support!
Binance Team
2026-06-02
This is a general Binance Exchange Notice. Products and services referred to here may not be availab
This is a general Binance Exchange Notice. Products and services referred to here may not be available in your region.
Fellow Binancians,$ETH
To expand the list of trading choices offered on Binance Futures and enhance users’ trading experience, Binance Futures will launch the following perpetual contract(s) as below:
2026-06-02 03:00 (UTC): SKHYNIXUSDT Perpetual Contract
2026-06-02 03:10 (UTC): SAMSUNGUSDT Perpetual Contract
2026-06-02 03:20 (UTC): HYUNDAIUSDT Perpetual Contract
More details on the aforementioned perpetual contract(s) can be found in the table below:
USDⓈ-M Perpetual Contract
SKHYNIXUSDT
SAMSUNGUSDT
HYUNDAIUSDT
Launch Time
2026-06-02 03:00 (UTC)
2026-06-02 03:10 (UTC)
2026-06-02 03:20 (UTC)
Underlying Equity/Index
SK Hynix Inc.
Samsung Electronics Co., Ltd.
Hyundai Motor Company
Underlying Equity/Index Info
SKHYNIXUSDT Perpetual Contract tracks the stock price of SK Hynix Inc.
SAMSUNGUSDT Perpetual Contract tracks the stock price of Samsung Electronics Co., Ltd.
HYUNDAIUSDT Perpetual Contract tracks the stock price of Hyundai Motor Company.
Settlement Asset
USDT$BTC
Tick Size
0.01
0.01
0.01
Min Trade Amount
0.01 SKHYNIX
0.01 SAMSUNG
0.01 HYUNDAI
Min Notional Value
5 USDT
5 USDT
5 USDT
Capped Funding Rate
+2.00% / -2.00%
+2.00% / -2.00%
+2.00% / -2.00%
Funding Fee Settlement Frequency
Every Eight Hours
Every Eight Hours
Every Eight Hours
Interest Rate of Funding Rate
0%
0%
0%
Maximum Leverage
20x
20x
20x
Trading Hours
24/7
24/7
24/7
Multi-Assets Mode
Supported
Supported
Supported
Please Note:
This information is released as a Notice under Binance Exchange Rule 17.
The aforementioned perpetual contract(s) are exempted from 8.1 Adjustment of Funding Interval rules. The funding interval will not be adjusted from every eight hours to every one hour when the previous funding rate settlement of the aforementioned perpetual contract(s) reach the funding rate cap or floor.
Based on market risk conditions, Binance may adjust the specifications of the aforementioned Futures contract(s) from time to time, which include the funding fee, tick size, maximum leverage, initial margin, and/or maintenance margin requirements.
In case there is a discrepancy between this notice and any Futures FAQ, please refer to this notice for the most accurate and updated information.
There may be discrepancies between this original content in English and any translated versions. Please refer to the original English version for the most accurate information, in case any discrepancies arise.
Further Information:
Perpetual Futures on Traditional Assets
Trading Rules to Trading Parameter
Leverage and Margin of USDⓈ-M Futures Contracts
Binance Futures Fee Structure
How to Select Trading Pairs
Funding Rate History
Mark Price and Price Index
Multi-Assets Mode
Binance Futures Contract Specification
Thank you for your support!
Binance Team
2026-06-02
Fellow Binancians,$ETH
To expand the list of trading choices offered on Binance Futures and enhance users’ trading experience, Binance Futures will launch the following perpetual contract(s) as below:
2026-06-02 03:00 (UTC): SKHYNIXUSDT Perpetual Contract
2026-06-02 03:10 (UTC): SAMSUNGUSDT Perpetual Contract
2026-06-02 03:20 (UTC): HYUNDAIUSDT Perpetual Contract
More details on the aforementioned perpetual contract(s) can be found in the table below:
USDⓈ-M Perpetual Contract
SKHYNIXUSDT
SAMSUNGUSDT
HYUNDAIUSDT
Launch Time
2026-06-02 03:00 (UTC)
2026-06-02 03:10 (UTC)
2026-06-02 03:20 (UTC)
Underlying Equity/Index
SK Hynix Inc.
Samsung Electronics Co., Ltd.
Hyundai Motor Company
Underlying Equity/Index Info
SKHYNIXUSDT Perpetual Contract tracks the stock price of SK Hynix Inc.
SAMSUNGUSDT Perpetual Contract tracks the stock price of Samsung Electronics Co., Ltd.
HYUNDAIUSDT Perpetual Contract tracks the stock price of Hyundai Motor Company.
Settlement Asset
USDT$BTC
Tick Size
0.01
0.01
0.01
Min Trade Amount
0.01 SKHYNIX
0.01 SAMSUNG
0.01 HYUNDAI
Min Notional Value
5 USDT
5 USDT
5 USDT
Capped Funding Rate
+2.00% / -2.00%
+2.00% / -2.00%
+2.00% / -2.00%
Funding Fee Settlement Frequency
Every Eight Hours
Every Eight Hours
Every Eight Hours
Interest Rate of Funding Rate
0%
0%
0%
Maximum Leverage
20x
20x
20x
Trading Hours
24/7
24/7
24/7
Multi-Assets Mode
Supported
Supported
Supported
Please Note:
This information is released as a Notice under Binance Exchange Rule 17.
The aforementioned perpetual contract(s) are exempted from 8.1 Adjustment of Funding Interval rules. The funding interval will not be adjusted from every eight hours to every one hour when the previous funding rate settlement of the aforementioned perpetual contract(s) reach the funding rate cap or floor.
Based on market risk conditions, Binance may adjust the specifications of the aforementioned Futures contract(s) from time to time, which include the funding fee, tick size, maximum leverage, initial margin, and/or maintenance margin requirements.
In case there is a discrepancy between this notice and any Futures FAQ, please refer to this notice for the most accurate and updated information.
There may be discrepancies between this original content in English and any translated versions. Please refer to the original English version for the most accurate information, in case any discrepancies arise.
Further Information:
Perpetual Futures on Traditional Assets
Trading Rules to Trading Parameter
Leverage and Margin of USDⓈ-M Futures Contracts
Binance Futures Fee Structure
How to Select Trading Pairs
Funding Rate History
Mark Price and Price Index
Multi-Assets Mode
Binance Futures Contract Specification
Thank you for your support!
Binance Team
2026-06-02
54
·
--
Bearish
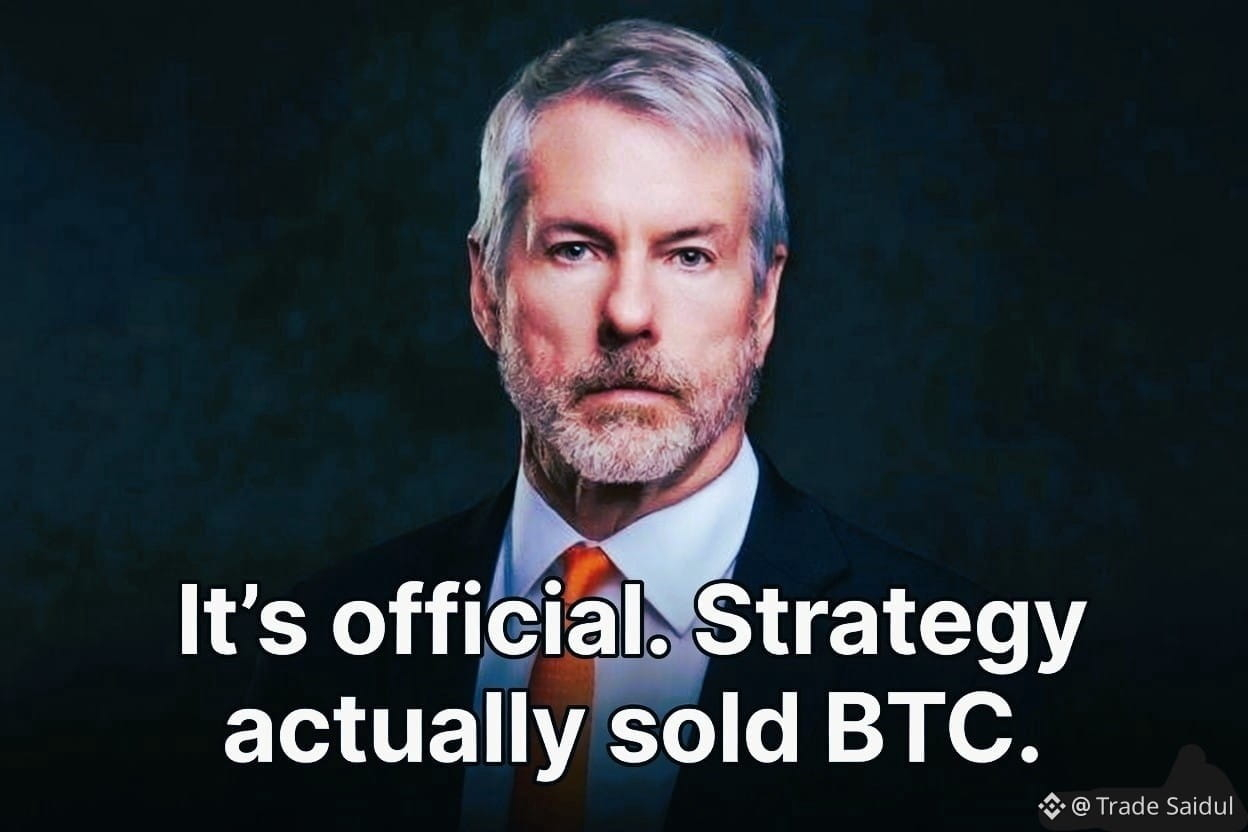
Well… it’s official. Strategy actually sold BTC🥶.
Last week, Strategy sold 32 $BTC , worth roughly $2.47M, at an average price of around $77,135 , marking the company’s first Bitcoin sale in more than 3 years.
That alone is enough to turn heads, because Strategy’s entire brand has basically been “buy BTC, never sell.”
The last time they reduced holdings was back on Dec. 22, 2022, when they sold 704 #BTC at ~$16,776. But that move turned out to be short-lived ... just two days later, they bought back 810 BTC at ~$16,845, ending up with even more Bitcoin than before.
So the real question isn’t just “did Strategy sell?” ... it’s why.
Was this a small treasury adjustment? Liquidity management? A symbolic trim? Or just another repeat of 2022 where they sell a little… then reload even harder? For context, 32 BTC is tiny relative to Strategy’s overall stack, which makes this feel more like a signal people are overanalyzing than a genuine change in conviction.$BTC $ETH #EthereumStakingRatioRecordHigh
Well… it’s official. Strategy actually sold BTC🥶.
Last week, Strategy sold 32 $BTC , worth roughly $2.47M, at an average price of around $77,135 , marking the company’s first Bitcoin sale in more than 3 years.
That alone is enough to turn heads, because Strategy’s entire brand has basically been “buy BTC, never sell.”
The last time they reduced holdings was back on Dec. 22, 2022, when they sold 704 #BTC at ~$16,776. But that move turned out to be short-lived ... just two days later, they bought back 810 BTC at ~$16,845, ending up with even more Bitcoin than before.
So the real question isn’t just “did Strategy sell?” ... it’s why.
Was this a small treasury adjustment? Liquidity management? A symbolic trim? Or just another repeat of 2022 where they sell a little… then reload even harder? For context, 32 BTC is tiny relative to Strategy’s overall stack, which makes this feel more like a signal people are overanalyzing than a genuine change in conviction.$BTC $ETH #EthereumStakingRatioRecordHigh
Last week, Strategy sold 32 $BTC , worth roughly $2.47M, at an average price of around $77,135 , marking the company’s first Bitcoin sale in more than 3 years.
That alone is enough to turn heads, because Strategy’s entire brand has basically been “buy BTC, never sell.”
The last time they reduced holdings was back on Dec. 22, 2022, when they sold 704 #BTC at ~$16,776. But that move turned out to be short-lived ... just two days later, they bought back 810 BTC at ~$16,845, ending up with even more Bitcoin than before.
So the real question isn’t just “did Strategy sell?” ... it’s why.
Was this a small treasury adjustment? Liquidity management? A symbolic trim? Or just another repeat of 2022 where they sell a little… then reload even harder? For context, 32 BTC is tiny relative to Strategy’s overall stack, which makes this feel more like a signal people are overanalyzing than a genuine change in conviction.$BTC $ETH #EthereumStakingRatioRecordHigh
66
·
--
$HMSTR listen carefully and prepare for the next season
comment your earnings in season 1 hope your coin value is enough for your recruitment,
It's not a loss project 😞
#hamsterkombat24 #Hamstercombo #Hamsterkombat
#Hamster #Hamstercoin
$HMSTR listen carefully and prepare for the next season
comment your earnings in season 1 hope your coin value is enough for your recruitment,
It's not a loss project 😞
#hamsterkombat24 #Hamstercombo #Hamsterkombat
#Hamster #Hamstercoin
comment your earnings in season 1 hope your coin value is enough for your recruitment,
It's not a loss project 😞
#hamsterkombat24 #Hamstercombo #Hamsterkombat
#Hamster #Hamstercoin

90
Log in to explore more content
Join global crypto users on Binance Square
⚡️ Get latest and useful information about crypto.
💬 Trusted by the world’s largest crypto exchange.
👍 Discover real insights from verified creators.
Email / Phone number
Trending Topics
WhatWillDriveCryptoandStocks’NextRebound?
71,543 views
969 Discussing
Bitcoin Slips Below $70,000 as Dollar Index Hits 19-Month High
Binance News
·19 Likes
·38.9k views
BitcoinBreaksBelow200WeekMovingAverage
1,447 views
51 Discussing
SpaceXTeslaMergerTalksWouldCombine30220BTC
2 views
4 Discussing