

torbido 01
1.2k Posts

torbido 01
Report
Block User
Open Trade
High-Frequency Trader
8.8 Years
620 Following
164 Followers
94 Liked
Posts
Portfolio
All
Quotes


·
--
Bearish
Gold ended the week’s trading near $3,999.98 per ounce, down 0.70%, testing the psychological $4,000 level for the first time since July. On the four-hour time frame, the metal continues its downward trend from its August peak near $4,700, after breaking below the consolidation range around $4,100 in late October. Options data reinforce the bearish pressure#xausdt
Gold ended the week’s trading near $3,999.98 per ounce, down 0.70%, testing the psychological $4,000 level for the first time since July. On the four-hour time frame, the metal continues its downward trend from its August peak near $4,700, after breaking below the consolidation range around $4,100 in late October. Options data reinforce the bearish pressure#xausdt
134
·
--
Binance Pick has launched a new predictions section titled [Financial Earnings]. Use points to predict how leading companies will perform in their earnings reports, and earn more points by posting daily on Binance Square. Join now, share the reasons behind your predictions, and tell us which companies you expect to see their stock prices rise or fall—and make the most of #EarningsSeason on Square!#BinancePick
$BTC
$BTC
433
·
--
Bullish
$PEPE
I’m paying attention to it
. Levels of Resistance and Support:
Current Resistance: The price is currently testing the peak area near 0.00000431. If it manages to break above it and stabilize above it, it may continue rising toward levels 0.00000440 and then 0.00000460.
Near Support: If a correction or profit-taking occurs, the first support level is at 0.00000412, followed by a stronger support zone around 0.00000397 - 0.00000394.
{spot}(PEPEUSDT)
$PEPE
I’m paying attention to it
. Levels of Resistance and Support:
Current Resistance: The price is currently testing the peak area near 0.00000431. If it manages to break above it and stabilize above it, it may continue rising toward levels 0.00000440 and then 0.00000460.
Near Support: If a correction or profit-taking occurs, the first support level is at 0.00000412, followed by a stronger support zone around 0.00000397 - 0.00000394.
2
1.1k
·
--
1
127
·
--
The most important things Wares said:
Inflation remains high
The decision comes at a time when the U.S. economy appears to be strengthening
The key indicators improved over the past few months
The Federal Reserve is seeking price stability
The inflation reading suggests there has been no improvement, citing the latest CPI reading above 3.6%
Unemployment rates remain low, while available jobs and working hours are increasing
The Federal Reserve is prepared to deal with high inflation
Inflation is high, and it will remain so for a very long time
We must trust that inflation is moving toward the 2% target, and the committee decided that inflation has not yet reached that level
25
·
--
$
- The Federal Reserve raised its benchmark interest rate on Wednesday as widely expected, in its first tightening of monetary policy since July 2023.
{spot}(BTCUSDT)
$
- The Federal Reserve raised its benchmark interest rate on Wednesday as widely expected, in its first tightening of monetary policy since July 2023.
- The Federal Reserve raised its benchmark interest rate on Wednesday as widely expected, in its first tightening of monetary policy since July 2023.
67
·
--
{future}(LSKUSDT)
Seize the opportunity while it’s profitable
Seize the opportunity while it’s profitable
137
·
--
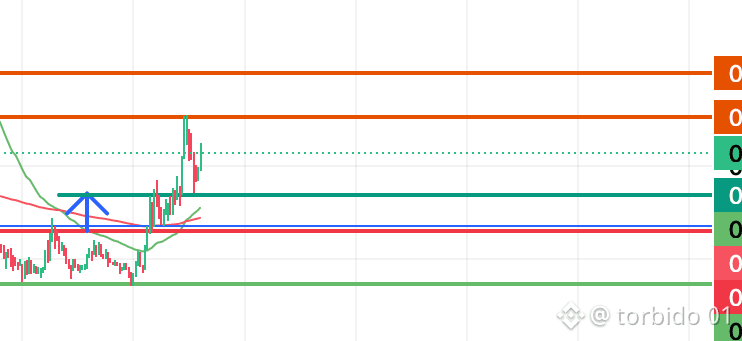
Expected LSK Scenarios
Continued Upside: Stability above the level of $0.5381 supports a bullish bias, and a break above $0.7064 directly opens the way to $0.8000.
Retest Opportunity: Any minor pullback toward $0.5381 represents a typical retest zone, and requires confirmation from buying liquidity.
Invalidation of the Bullish View: A break below $0.4870 ends the current bullish momentum and pushes the price to retest the key support zones between $0.3470 and 0.
{spot}(LSKUSDT)
Expected LSK Scenarios
Continued Upside: Stability above the level of $0.5381 supports a bullish bias, and a break above $0.7064 directly opens the way to $0.8000.
Retest Opportunity: Any minor pullback toward $0.5381 represents a typical retest zone, and requires confirmation from buying liquidity.
Invalidation of the Bullish View: A break below $0.4870 ends the current bullish momentum and pushes the price to retest the key support zones between $0.3470 and 0.
1
163
·
--
$LSK
{future}(LSKUSDT)
A stable breakthrough and a close above the resistance level 0.5381 will open the door to further gains toward the levels \bm{0.60} then \bm{0.80}.
The bearish scenario (correction): Failure to break through \bm{0.5381} may lead to a correction to retest the support level at 0.4709 - 0.4593. Holding this support is required to maintain a positive outlook in the near term.
$LSK
A stable breakthrough and a close above the resistance level 0.5381 will open the door to further gains toward the levels \bm{0.60} then \bm{0.80}.
The bearish scenario (correction): Failure to break through \bm{0.5381} may lead to a correction to retest the support level at 0.4709 - 0.4593. Holding this support is required to maintain a positive outlook in the near term.
2
350
·
--
The Federal… Challenges—Why Gold Could Reach 5,400$ Despite Rate Hikes?
As the Federal Reserve prepares to raise interest rates and gold faces pressure from rising inflation, bond yields, and oil prices, ANZ’s outlook presents a completely different scenario: the current pullback in gold may be only a temporary phase, not the end of the uptrend.
{future}(XAUUSDT)
The Federal… Challenges—Why Gold Could Reach 5,400$ Despite Rate Hikes?
As the Federal Reserve prepares to raise interest rates and gold faces pressure from rising inflation, bond yields, and oil prices, ANZ’s outlook presents a completely different scenario: the current pullback in gold may be only a temporary phase, not the end of the uptrend.
As the Federal Reserve prepares to raise interest rates and gold faces pressure from rising inflation, bond yields, and oil prices, ANZ’s outlook presents a completely different scenario: the current pullback in gold may be only a temporary phase, not the end of the uptrend.
103
·
--
Bullish
1
107
·
--
Open a deal$
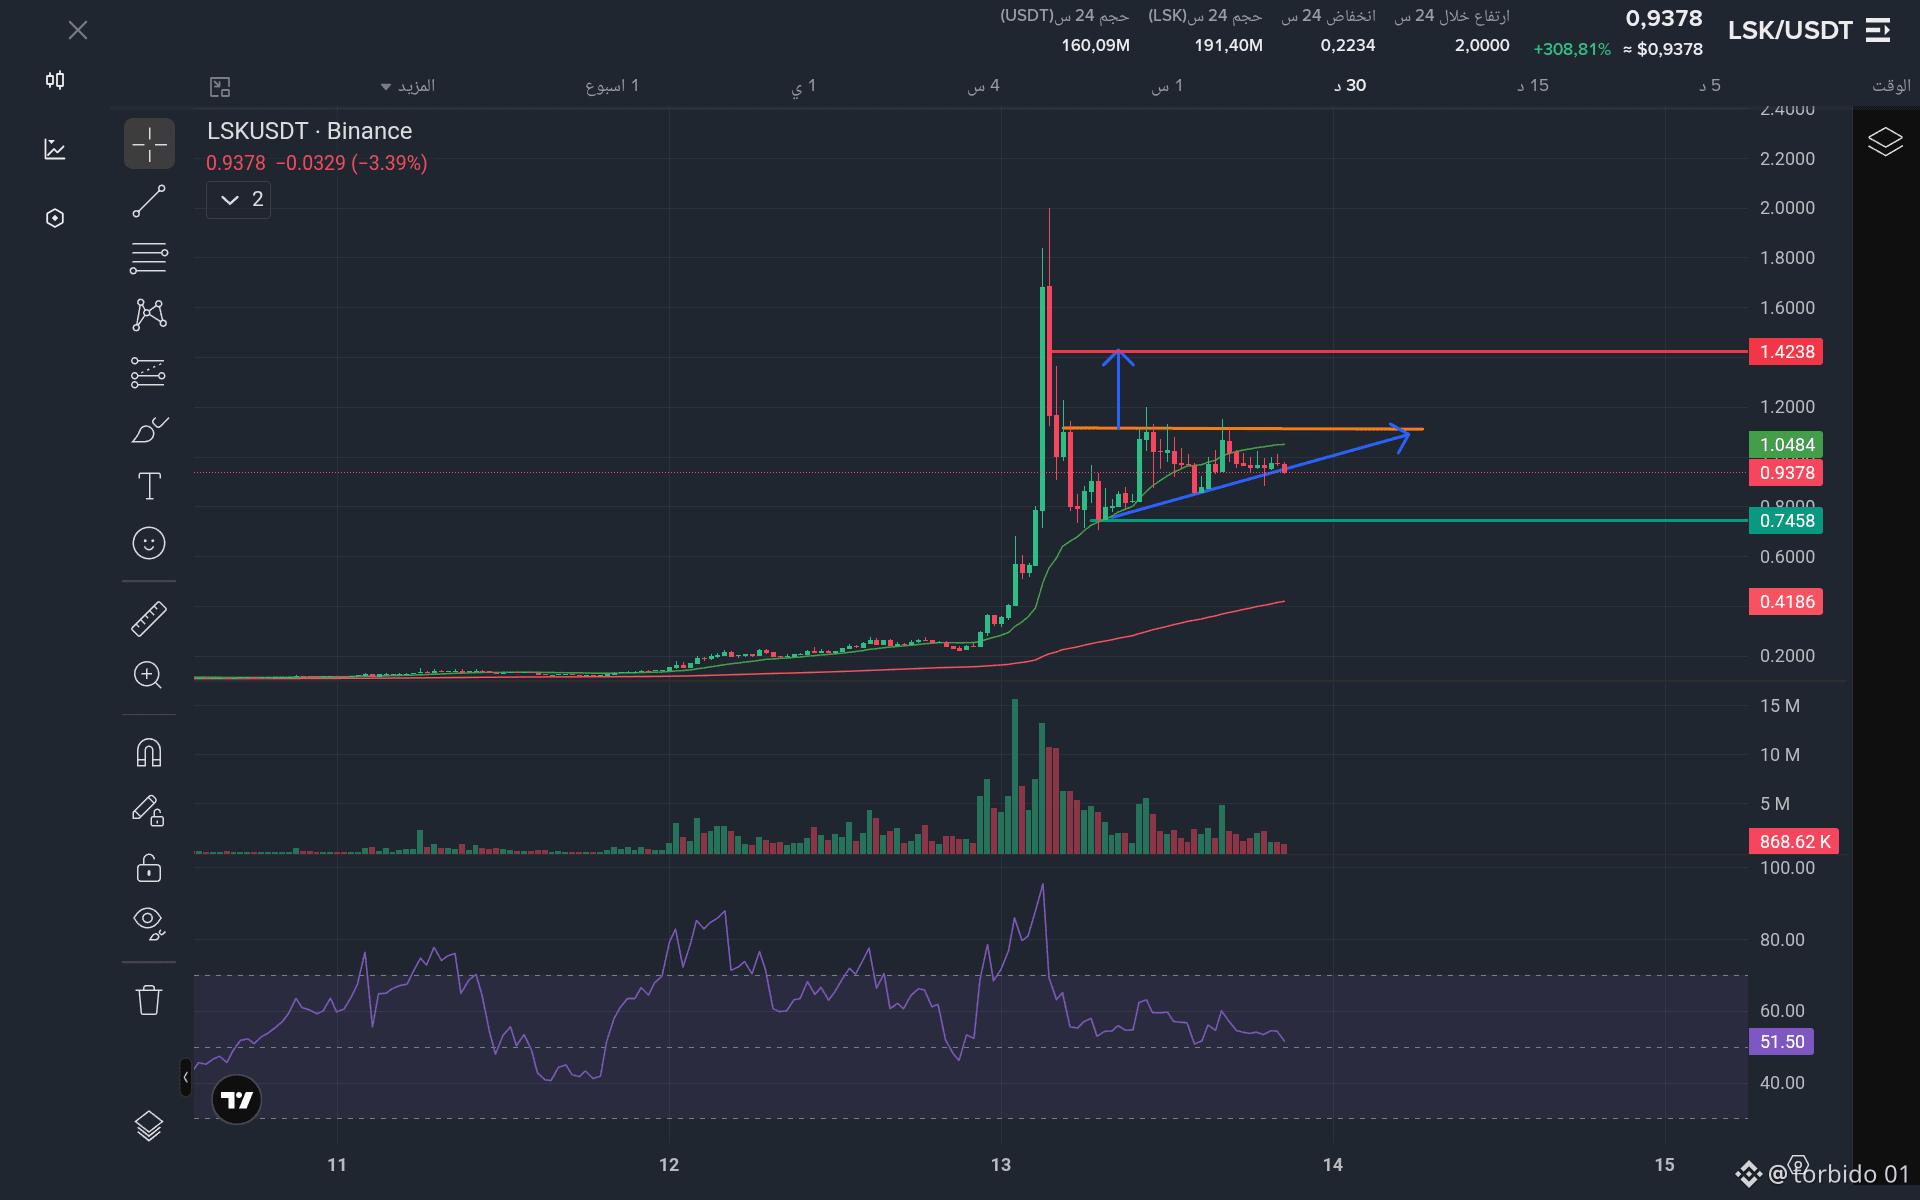
Positive scenario (continued uptrend):
If the price holds above 1.0000 and maintains trading above support 0.7923, the price may move to retest nearby resistance levels at 1.5000, then the previous peak at 1.8354 - 2.0000.
{future}(LSKUSDT)
Open a deal$
Positive scenario (continued uptrend):
If the price holds above 1.0000 and maintains trading above support 0.7923, the price may move to retest nearby resistance levels at 1.5000, then the previous peak at 1.8354 - 2.0000.
Positive scenario (continued uptrend):
If the price holds above 1.0000 and maintains trading above support 0.7923, the price may move to retest nearby resistance levels at 1.5000, then the previous peak at 1.8354 - 2.0000.
1
145
·
--
{future}(LSKUSDT)
$LSK
Current support: The price is currently trading above the moving averages in the 0.80 - 0.88 USDT zone, which is a potential accumulation area in the near term.
Lower support levels: Strong support levels appear at 0.4929 USDT and then at 0.2480 USDT if the current zone is broken to the downside.
3. Relative Strength Index (RSI)
The RSI is holding at 57.52. It is in the neutral zone after pulling back from overbought areas. This indicates the bullish momentum is cooling and the price is entering a phase of temporary consolidation.
General technical read:
Positive scenario: A retest of the resistance at 1.80 USDT is possible, which requires maintaining the current support at 0.80 USDT and the entry of new buying liquidity.
Negative scenario: If the price breaks the 0.80 USDT level and closes below it, it may move to test the next support at 0.4929 USDT.
1
146
·
--
Believe me, the tut coin won’t come back$TUT To test the bottom of 0.097, there will then be a bounce—so wait for the catch
Believe me, the tut coin won’t come back
$TUT To test the bottom of 0.097, there will then be a bounce—so wait for the catch
123
·
--
Technical Analysis for TUT/USDT
1
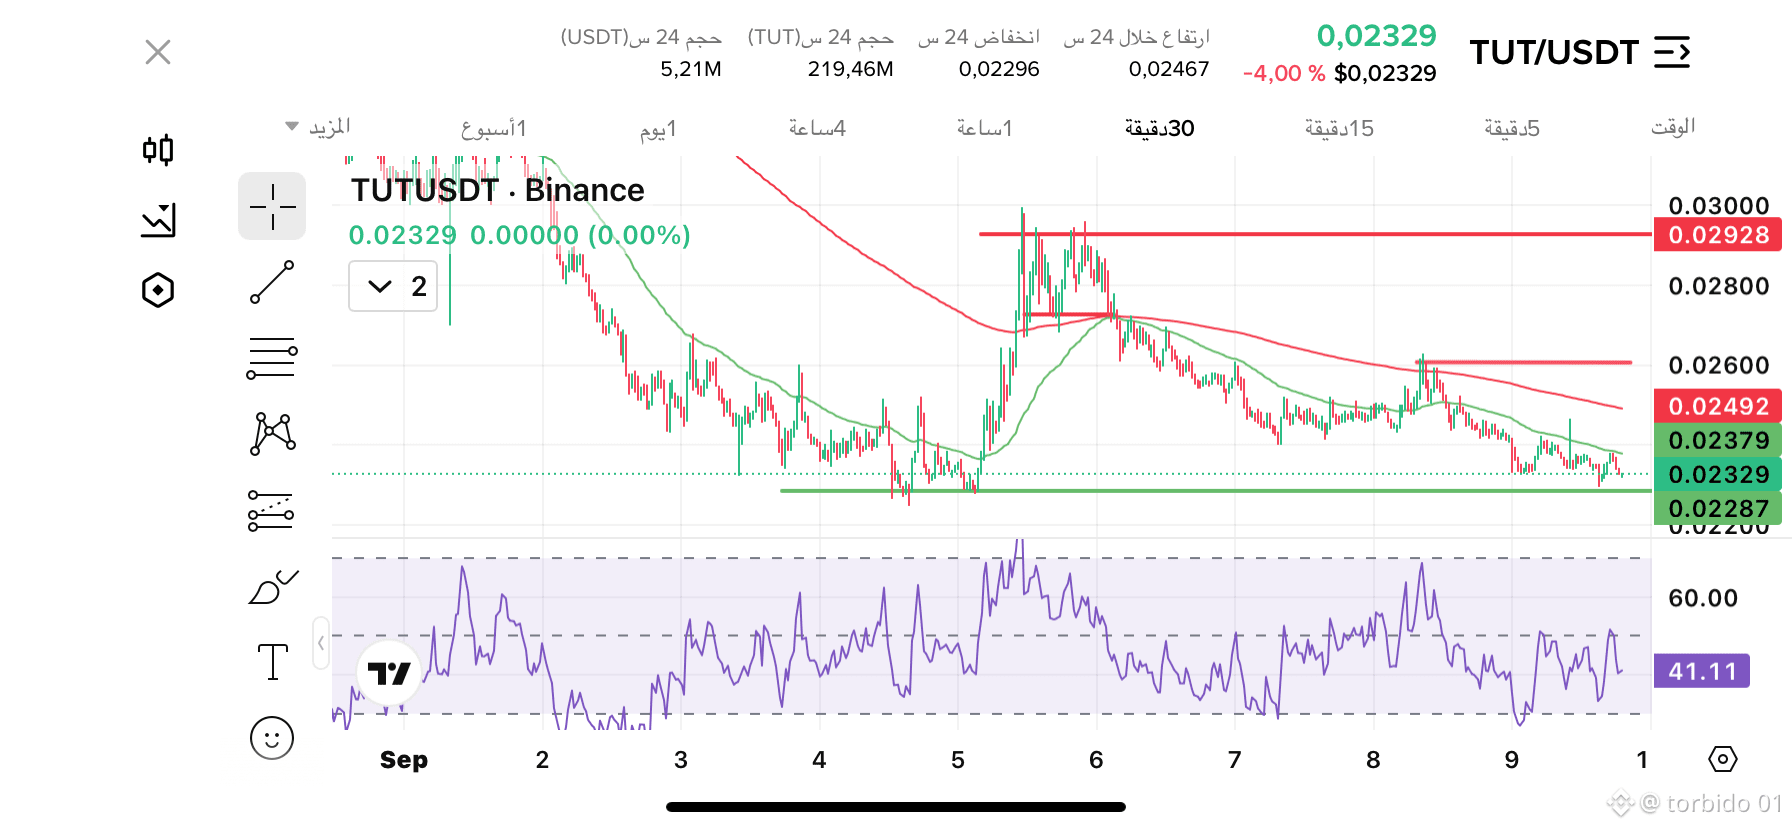
General Trend: Sideways-to-bearish trading, where the coin experienced a sharp collapse (Spike/Drop) down to the 0.01600 level before bouncing back and entering a consolidation/range between 0.01970 and 0.02120.
Current Price: 0.02023 USDT.
Moving Averages: The price is moving confined below the main moving average (red line), reflecting negative pressure and weak oscillation.
2. Technical Indicators
Relative Strength Index (RSI): At 44.55 (in the neutral zone), indicating a relative balance between buying and selling power, with a slight advantage for sellers due to its inability to steadily break above 50.
3. Pivot Levels (Key Levels)
2
1
81
·
--
A morning that shines with goodness and joys, carrying the fragrance of hope and peace of mind, so that every moment in your day is filled with success and achievement.
A morning that shines with goodness and joys, carrying the fragrance of hope and peace of mind, so that every moment in your day is filled with success and achievement.
1
1
4
·
--
Good morning and light! I hope you have a beautiful day that begins with a smile, filled with hope and comfort, and where everything you wish comes true.
$BTC
Good morning and light! I hope you have a beautiful day that begins with a smile, filled with hope and comfort, and where everything you wish comes true.
$BTC
$BTC

1
1
32
Log in to explore more content
Join global crypto users on Binance Square
⚡️ Get latest and useful information about crypto.
💬 Trusted by the world’s largest crypto exchange.
👍 Discover real insights from verified creators.
Email / Phone number