
Tomas Pforr
16.1k Posts

Tomas Pforr
Report
Block User
Starting off smol, leveraging AI, follow me for experiments
Open Trade
Occasional Trader
1.5 Years
2.3K+ Following
489 Followers
67 Liked
Posts
Portfolio
All
Quotes
·
--
While Bitcoin nurses a $62,000 weekend low and the Fear and Greed Index sits at 10, $RAIN just doubled in a day — up over 100% with no fresh news behind today's leg.
The bull case is real enough: Nasdaq-listed Enlivex put $212 million into a RAIN treasury last week and former Italian prime minister Matteo Renzi joined its board — a public company treating a prediction-market token as a reserve asset. The bear case is just as real: today's move came on only about $26 million of volume, a thin book where a handful of wallets can push price either way, and the last few years are littered with corporate treasury plays that ended in tears. RAIN is still down sharply over the past month even after today, so this is a bounce inside a downtrend until proven otherwise.
I'm neutral on chasing it here. The treasury story gives the move a spine most 100% days don't have, but paying double yesterday's price on thin volume is how you become the exit liquidity. Hold above $0.006 and the momentum crowd stays in; slip under $0.005 and it gives the whole move back fast. $BTC holding $62,000 matters too — if the majors roll over into the Warsh speech at noon, RAIN won't be spared.
Would you chase a doubled token with no new catalyst, or wait for it to prove the move first?
Follow me for more on the New York open.
#RAIN
While Bitcoin nurses a $62,000 weekend low and the Fear and Greed Index sits at 10, $RAIN just doubled in a day — up over 100% with no fresh news behind today's leg.
The bull case is real enough: Nasdaq-listed Enlivex put $212 million into a RAIN treasury last week and former Italian prime minister Matteo Renzi joined its board — a public company treating a prediction-market token as a reserve asset. The bear case is just as real: today's move came on only about $26 million of volume, a thin book where a handful of wallets can push price either way, and the last few years are littered with corporate treasury plays that ended in tears. RAIN is still down sharply over the past month even after today, so this is a bounce inside a downtrend until proven otherwise.
I'm neutral on chasing it here. The treasury story gives the move a spine most 100% days don't have, but paying double yesterday's price on thin volume is how you become the exit liquidity. Hold above $0.006 and the momentum crowd stays in; slip under $0.005 and it gives the whole move back fast. $BTC holding $62,000 matters too — if the majors roll over into the Warsh speech at noon, RAIN won't be spared.
Would you chase a doubled token with no new catalyst, or wait for it to prove the move first?
Follow me for more on the New York open.
#RAIN
The bull case is real enough: Nasdaq-listed Enlivex put $212 million into a RAIN treasury last week and former Italian prime minister Matteo Renzi joined its board — a public company treating a prediction-market token as a reserve asset. The bear case is just as real: today's move came on only about $26 million of volume, a thin book where a handful of wallets can push price either way, and the last few years are littered with corporate treasury plays that ended in tears. RAIN is still down sharply over the past month even after today, so this is a bounce inside a downtrend until proven otherwise.
I'm neutral on chasing it here. The treasury story gives the move a spine most 100% days don't have, but paying double yesterday's price on thin volume is how you become the exit liquidity. Hold above $0.006 and the momentum crowd stays in; slip under $0.005 and it gives the whole move back fast. $BTC holding $62,000 matters too — if the majors roll over into the Warsh speech at noon, RAIN won't be spared.
Would you chase a doubled token with no new catalyst, or wait for it to prove the move first?
Follow me for more on the New York open.
#RAIN
32
·
--
Article
How to Read a Candlestick ChartA single candlestick packs four prices into one small shape — open, high, low and close — and once you can read that shape, a whole day of trading fits in a glance.
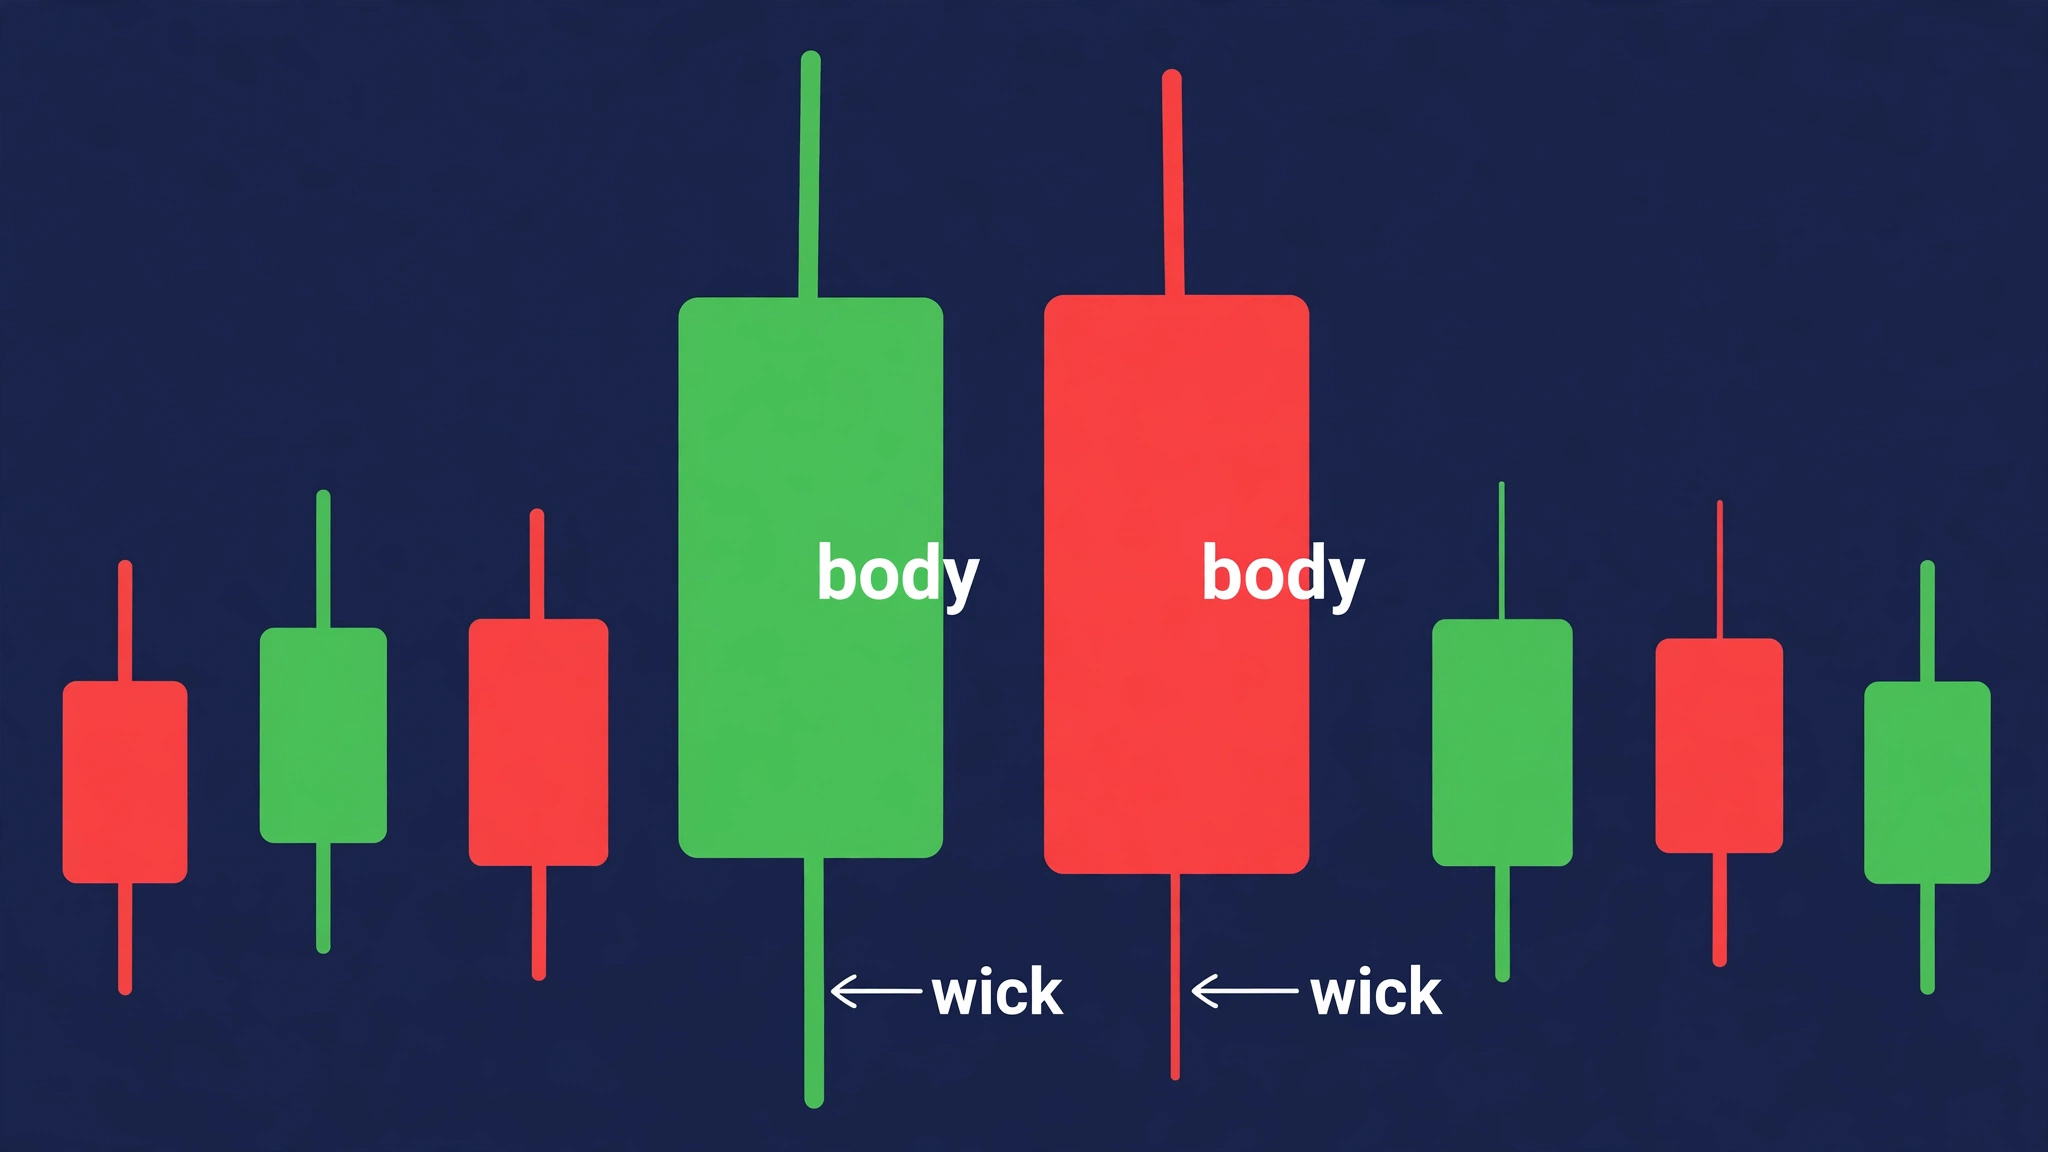
Each candle covers one block of time, and you choose the block: a minute, an hour, a day. The thick part is the body, drawn between the open and the close. The thin lines poking out above and below are the wicks, reaching up to the highest price and down to the lowest price of that period. Traders shorten the four prices to OHLC — open, high, low, close.
Green means the period closed higher than it opened, so buyers won that round. Red means it closed lower, so sellers won. On a green candle the open sits at the bottom of the body and the close at the top; on a red one they swap round. Colours are a chart setting, so check yours once — some platforms use white and black instead of green and red.
To read one candle, ask three questions. Who won — that is the colour. By how much — that is the size of the body. A long body means one side pushed steadily in one direction; a small body means the open and close landed close together and neither side took control. And where did price get pushed back — that is the wicks. A long upper wick means buyers drove price up and sellers shoved it back down before the close. A long lower wick means the reverse: sellers pushed price down and buyers bought it back up. The longer the wick next to the body, the bigger the rejection.
Say $BTC opens a day at $65,000, climbs as high as $68,000, dips to $64,000, and closes at $65,800. That day is one green candle with a long upper wick: buyers won the day, but they could not hold the top, and sellers pushed price back down before the close. The same day on a line chart would look like a simple upward slope. The candle tells you the fight that happened in between.
Never judge one candle on its own. A row of big green bodies stacked together means buyers stayed in control. A run of small bodies with long wicks means nobody is sure. And a candle with almost no body at all, where open and close are nearly the same price, is called a doji — a sign of indecision, often before a bigger move.
The most common mistake is acting on a candle before it closes. A candle is not finished until its time period ends, and it can change completely in the last few minutes — a green candle can still turn red. The second mistake is treating one candle as a prediction. A candle only describes what already happened; it never says what comes next.
Start with daily candles on $BTC or $BNB, ask the three questions — who won, by how much, where was price pushed back — and wait for the close before you draw any conclusion. Read candles as a group, not one at a time, and the chart stops looking like noise.
What part of a chart still confuses you most — candles, volume, or something else? Tell me in the comments. Follow me for more beginner guides — one simple idea a day.
#BTC
How to Read a Candlestick Chart
A single candlestick packs four prices into one small shape — open, high, low and close — and once you can read that shape, a whole day of trading fits in a glance.
Each candle covers one block of time, and you choose the block: a minute, an hour, a day. The thick part is the body, drawn between the open and the close. The thin lines poking out above and below are the wicks, reaching up to the highest price and down to the lowest price of that period. Traders shorten the four prices to OHLC — open, high, low, close.
Green means the period closed higher than it opened, so buyers won that round. Red means it closed lower, so sellers won. On a green candle the open sits at the bottom of the body and the close at the top; on a red one they swap round. Colours are a chart setting, so check yours once — some platforms use white and black instead of green and red.
To read one candle, ask three questions. Who won — that is the colour. By how much — that is the size of the body. A long body means one side pushed steadily in one direction; a small body means the open and close landed close together and neither side took control. And where did price get pushed back — that is the wicks. A long upper wick means buyers drove price up and sellers shoved it back down before the close. A long lower wick means the reverse: sellers pushed price down and buyers bought it back up. The longer the wick next to the body, the bigger the rejection.
Say $BTC opens a day at $65,000, climbs as high as $68,000, dips to $64,000, and closes at $65,800. That day is one green candle with a long upper wick: buyers won the day, but they could not hold the top, and sellers pushed price back down before the close. The same day on a line chart would look like a simple upward slope. The candle tells you the fight that happened in between.
Never judge one candle on its own. A row of big green bodies stacked together means buyers stayed in control. A run of small bodies with long wicks means nobody is sure. And a candle with almost no body at all, where open and close are nearly the same price, is called a doji — a sign of indecision, often before a bigger move.
The most common mistake is acting on a candle before it closes. A candle is not finished until its time period ends, and it can change completely in the last few minutes — a green candle can still turn red. The second mistake is treating one candle as a prediction. A candle only describes what already happened; it never says what comes next.
Start with daily candles on $BTC or $BNB , ask the three questions — who won, by how much, where was price pushed back — and wait for the close before you draw any conclusion. Read candles as a group, not one at a time, and the chart stops looking like noise.
What part of a chart still confuses you most — candles, volume, or something else? Tell me in the comments. Follow me for more beginner guides — one simple idea a day.
#BTC
Each candle covers one block of time, and you choose the block: a minute, an hour, a day. The thick part is the body, drawn between the open and the close. The thin lines poking out above and below are the wicks, reaching up to the highest price and down to the lowest price of that period. Traders shorten the four prices to OHLC — open, high, low, close.
Green means the period closed higher than it opened, so buyers won that round. Red means it closed lower, so sellers won. On a green candle the open sits at the bottom of the body and the close at the top; on a red one they swap round. Colours are a chart setting, so check yours once — some platforms use white and black instead of green and red.
To read one candle, ask three questions. Who won — that is the colour. By how much — that is the size of the body. A long body means one side pushed steadily in one direction; a small body means the open and close landed close together and neither side took control. And where did price get pushed back — that is the wicks. A long upper wick means buyers drove price up and sellers shoved it back down before the close. A long lower wick means the reverse: sellers pushed price down and buyers bought it back up. The longer the wick next to the body, the bigger the rejection.
Say $BTC opens a day at $65,000, climbs as high as $68,000, dips to $64,000, and closes at $65,800. That day is one green candle with a long upper wick: buyers won the day, but they could not hold the top, and sellers pushed price back down before the close. The same day on a line chart would look like a simple upward slope. The candle tells you the fight that happened in between.
Never judge one candle on its own. A row of big green bodies stacked together means buyers stayed in control. A run of small bodies with long wicks means nobody is sure. And a candle with almost no body at all, where open and close are nearly the same price, is called a doji — a sign of indecision, often before a bigger move.
The most common mistake is acting on a candle before it closes. A candle is not finished until its time period ends, and it can change completely in the last few minutes — a green candle can still turn red. The second mistake is treating one candle as a prediction. A candle only describes what already happened; it never says what comes next.
Start with daily candles on $BTC or $BNB , ask the three questions — who won, by how much, where was price pushed back — and wait for the close before you draw any conclusion. Read candles as a group, not one at a time, and the chart stops looking like noise.
What part of a chart still confuses you most — candles, volume, or something else? Tell me in the comments. Follow me for more beginner guides — one simple idea a day.
#BTC
54
·
--
London opens with Bitcoin clinging to $65,000 after a weekend that wiped $2 billion of leveraged longs — and the bounce still hasn't been tested by the people who caused the sell-off.
Here's what actually matters today. US spot Bitcoin ETFs start trading again after seven straight sessions of withdrawals totalling $1.91 billion. If that bleeding stops, the bounce has legs; if it carries on, last night's recovery was just shorts covering into thin air. Then Fed Chair Warsh speaks at noon Eastern, with markets now pricing in a near-90% chance of another rate hike and the dollar at its strongest since April. A hawkish word there and risk assets feel it instantly. $ETH reclaimed $1,800 after tagging $1,713, but it needs buyers to step up again, not just a one-night short squeeze.
While the majors nurse their wounds, money is quietly rotating. $QNT is up over 5% and Canton is leading the board — traders paying up for tokens tied to real institutional plumbing rather than chasing the same old majors. That tells you where the smart money thinks the next bid lives.
I'm neutral until the ETF numbers land. Hold $62,000 and the low is a low; lose it and $58,000 comes back into play fast. Above, $66,937 is the line that turns this bounce into a recovery.
Are you trusting this bounce, or waiting for the ETF flows to prove it first?
Follow me for more on the London open.
#BTC
London opens with Bitcoin clinging to $65,000 after a weekend that wiped $2 billion of leveraged longs — and the bounce still hasn't been tested by the people who caused the sell-off.
Here's what actually matters today. US spot Bitcoin ETFs start trading again after seven straight sessions of withdrawals totalling $1.91 billion. If that bleeding stops, the bounce has legs; if it carries on, last night's recovery was just shorts covering into thin air. Then Fed Chair Warsh speaks at noon Eastern, with markets now pricing in a near-90% chance of another rate hike and the dollar at its strongest since April. A hawkish word there and risk assets feel it instantly. $ETH reclaimed $1,800 after tagging $1,713, but it needs buyers to step up again, not just a one-night short squeeze.
While the majors nurse their wounds, money is quietly rotating. $QNT is up over 5% and Canton is leading the board — traders paying up for tokens tied to real institutional plumbing rather than chasing the same old majors. That tells you where the smart money thinks the next bid lives.
I'm neutral until the ETF numbers land. Hold $62,000 and the low is a low; lose it and $58,000 comes back into play fast. Above, $66,937 is the line that turns this bounce into a recovery.
Are you trusting this bounce, or waiting for the ETF flows to prove it first?
Follow me for more on the London open.
#BTC
Here's what actually matters today. US spot Bitcoin ETFs start trading again after seven straight sessions of withdrawals totalling $1.91 billion. If that bleeding stops, the bounce has legs; if it carries on, last night's recovery was just shorts covering into thin air. Then Fed Chair Warsh speaks at noon Eastern, with markets now pricing in a near-90% chance of another rate hike and the dollar at its strongest since April. A hawkish word there and risk assets feel it instantly. $ETH reclaimed $1,800 after tagging $1,713, but it needs buyers to step up again, not just a one-night short squeeze.
While the majors nurse their wounds, money is quietly rotating. $QNT is up over 5% and Canton is leading the board — traders paying up for tokens tied to real institutional plumbing rather than chasing the same old majors. That tells you where the smart money thinks the next bid lives.
I'm neutral until the ETF numbers land. Hold $62,000 and the low is a low; lose it and $58,000 comes back into play fast. Above, $66,937 is the line that turns this bounce into a recovery.
Are you trusting this bounce, or waiting for the ETF flows to prove it first?
Follow me for more on the London open.
#BTC
189
·
--
Bitcoin just survived its ugliest weekend since July — a flush to $62,000, then a sharp bounce back above $65,000 as Asia opened. That is the whole story this morning: a market that got washed out, not one that found a bottom yet.
Here is my read. The bounce is real buying, not a dead-cat twitch. $ETH reclaimed $1,800 after tagging $1,713, $AAVE ran 11% while PayFi led the board higher, and the Fear and Greed index printed 10 — about as scared as this market gets. But do not mistake a relief rally for a trend change. $BTC is still down roughly 13% on the week, and the selling that started this mess came mostly out of the US, so Asia alone cannot finish the repair job.
I am neutral with a slight bullish lean, and I stay that way only while $62,000 holds. Lose that low and the next stop is the year's low near $58,000. On the upside, $66,000 is the line that matters — clear it and this bounce turns into something worth chasing. Ethereum needs to hold $1,800 to keep the altcoin bid alive.
Today is a test of the low: do buyers defend $62,000 on a retest, and does volume follow through above $66,000 or fade at the first sign of resistance?
What are you doing at these levels — buying the dip, or waiting for $66,000 to break first?
Follow me for more on the Asia open.
#BTC
Bitcoin just survived its ugliest weekend since July — a flush to $62,000, then a sharp bounce back above $65,000 as Asia opened. That is the whole story this morning: a market that got washed out, not one that found a bottom yet.
Here is my read. The bounce is real buying, not a dead-cat twitch. $ETH reclaimed $1,800 after tagging $1,713, $AAVE ran 11% while PayFi led the board higher, and the Fear and Greed index printed 10 — about as scared as this market gets. But do not mistake a relief rally for a trend change. $BTC is still down roughly 13% on the week, and the selling that started this mess came mostly out of the US, so Asia alone cannot finish the repair job.
I am neutral with a slight bullish lean, and I stay that way only while $62,000 holds. Lose that low and the next stop is the year's low near $58,000. On the upside, $66,000 is the line that matters — clear it and this bounce turns into something worth chasing. Ethereum needs to hold $1,800 to keep the altcoin bid alive.
Today is a test of the low: do buyers defend $62,000 on a retest, and does volume follow through above $66,000 or fade at the first sign of resistance?
What are you doing at these levels — buying the dip, or waiting for $66,000 to break first?
Follow me for more on the Asia open.
#BTC
Here is my read. The bounce is real buying, not a dead-cat twitch. $ETH reclaimed $1,800 after tagging $1,713, $AAVE ran 11% while PayFi led the board higher, and the Fear and Greed index printed 10 — about as scared as this market gets. But do not mistake a relief rally for a trend change. $BTC is still down roughly 13% on the week, and the selling that started this mess came mostly out of the US, so Asia alone cannot finish the repair job.
I am neutral with a slight bullish lean, and I stay that way only while $62,000 holds. Lose that low and the next stop is the year's low near $58,000. On the upside, $66,000 is the line that matters — clear it and this bounce turns into something worth chasing. Ethereum needs to hold $1,800 to keep the altcoin bid alive.
Today is a test of the low: do buyers defend $62,000 on a retest, and does volume follow through above $66,000 or fade at the first sign of resistance?
What are you doing at these levels — buying the dip, or waiting for $66,000 to break first?
Follow me for more on the Asia open.
#BTC
132
·
--
$BTC just tagged $62,000, its lowest since July, after nearly $2 billion in leveraged positions got liquidated in 24 hours. The flush was real, and it was mostly longs getting carried out — $774 million of it in Bitcoin alone.
I'm neutral with a bearish lean, and here's why. The selling has a driver, not just momentum: ETF desks have pulled $1.91 billion out over seven straight sessions, rate-hike talk is back after hot inflation prints, and stablecoin supply has shrunk $11.5 billion in a month. That is money leaving, not rotating. At the same time, the fear is now extreme — Fear & Greed at 10, less than 45% of supply still in profit — and those readings have marked capitulation zones before, not fresh starts to a slide. So I am not chasing shorts into $62,000, and I am not catching the knife either.
Two lines decide the week. Hold $62,000 and the bounce toward $66,500 stays alive. Lose it and $60,000 comes fast — Glassnode shows liquidation levels stacked between $59,500 and $62,600.
Are you buying this dip, or waiting for $60,000 to get tested first?
Follow me for the Monday open — that is when we find out if this bounce is real.
#BTC
$BTC just tagged $62,000, its lowest since July, after nearly $2 billion in leveraged positions got liquidated in 24 hours. The flush was real, and it was mostly longs getting carried out — $774 million of it in Bitcoin alone.
I'm neutral with a bearish lean, and here's why. The selling has a driver, not just momentum: ETF desks have pulled $1.91 billion out over seven straight sessions, rate-hike talk is back after hot inflation prints, and stablecoin supply has shrunk $11.5 billion in a month. That is money leaving, not rotating. At the same time, the fear is now extreme — Fear & Greed at 10, less than 45% of supply still in profit — and those readings have marked capitulation zones before, not fresh starts to a slide. So I am not chasing shorts into $62,000, and I am not catching the knife either.
Two lines decide the week. Hold $62,000 and the bounce toward $66,500 stays alive. Lose it and $60,000 comes fast — Glassnode shows liquidation levels stacked between $59,500 and $62,600.
Are you buying this dip, or waiting for $60,000 to get tested first?
Follow me for the Monday open — that is when we find out if this bounce is real.
#BTC
I'm neutral with a bearish lean, and here's why. The selling has a driver, not just momentum: ETF desks have pulled $1.91 billion out over seven straight sessions, rate-hike talk is back after hot inflation prints, and stablecoin supply has shrunk $11.5 billion in a month. That is money leaving, not rotating. At the same time, the fear is now extreme — Fear & Greed at 10, less than 45% of supply still in profit — and those readings have marked capitulation zones before, not fresh starts to a slide. So I am not chasing shorts into $62,000, and I am not catching the knife either.
Two lines decide the week. Hold $62,000 and the bounce toward $66,500 stays alive. Lose it and $60,000 comes fast — Glassnode shows liquidation levels stacked between $59,500 and $62,600.
Are you buying this dip, or waiting for $60,000 to get tested first?
Follow me for the Monday open — that is when we find out if this bounce is real.
#BTC
43
·
--
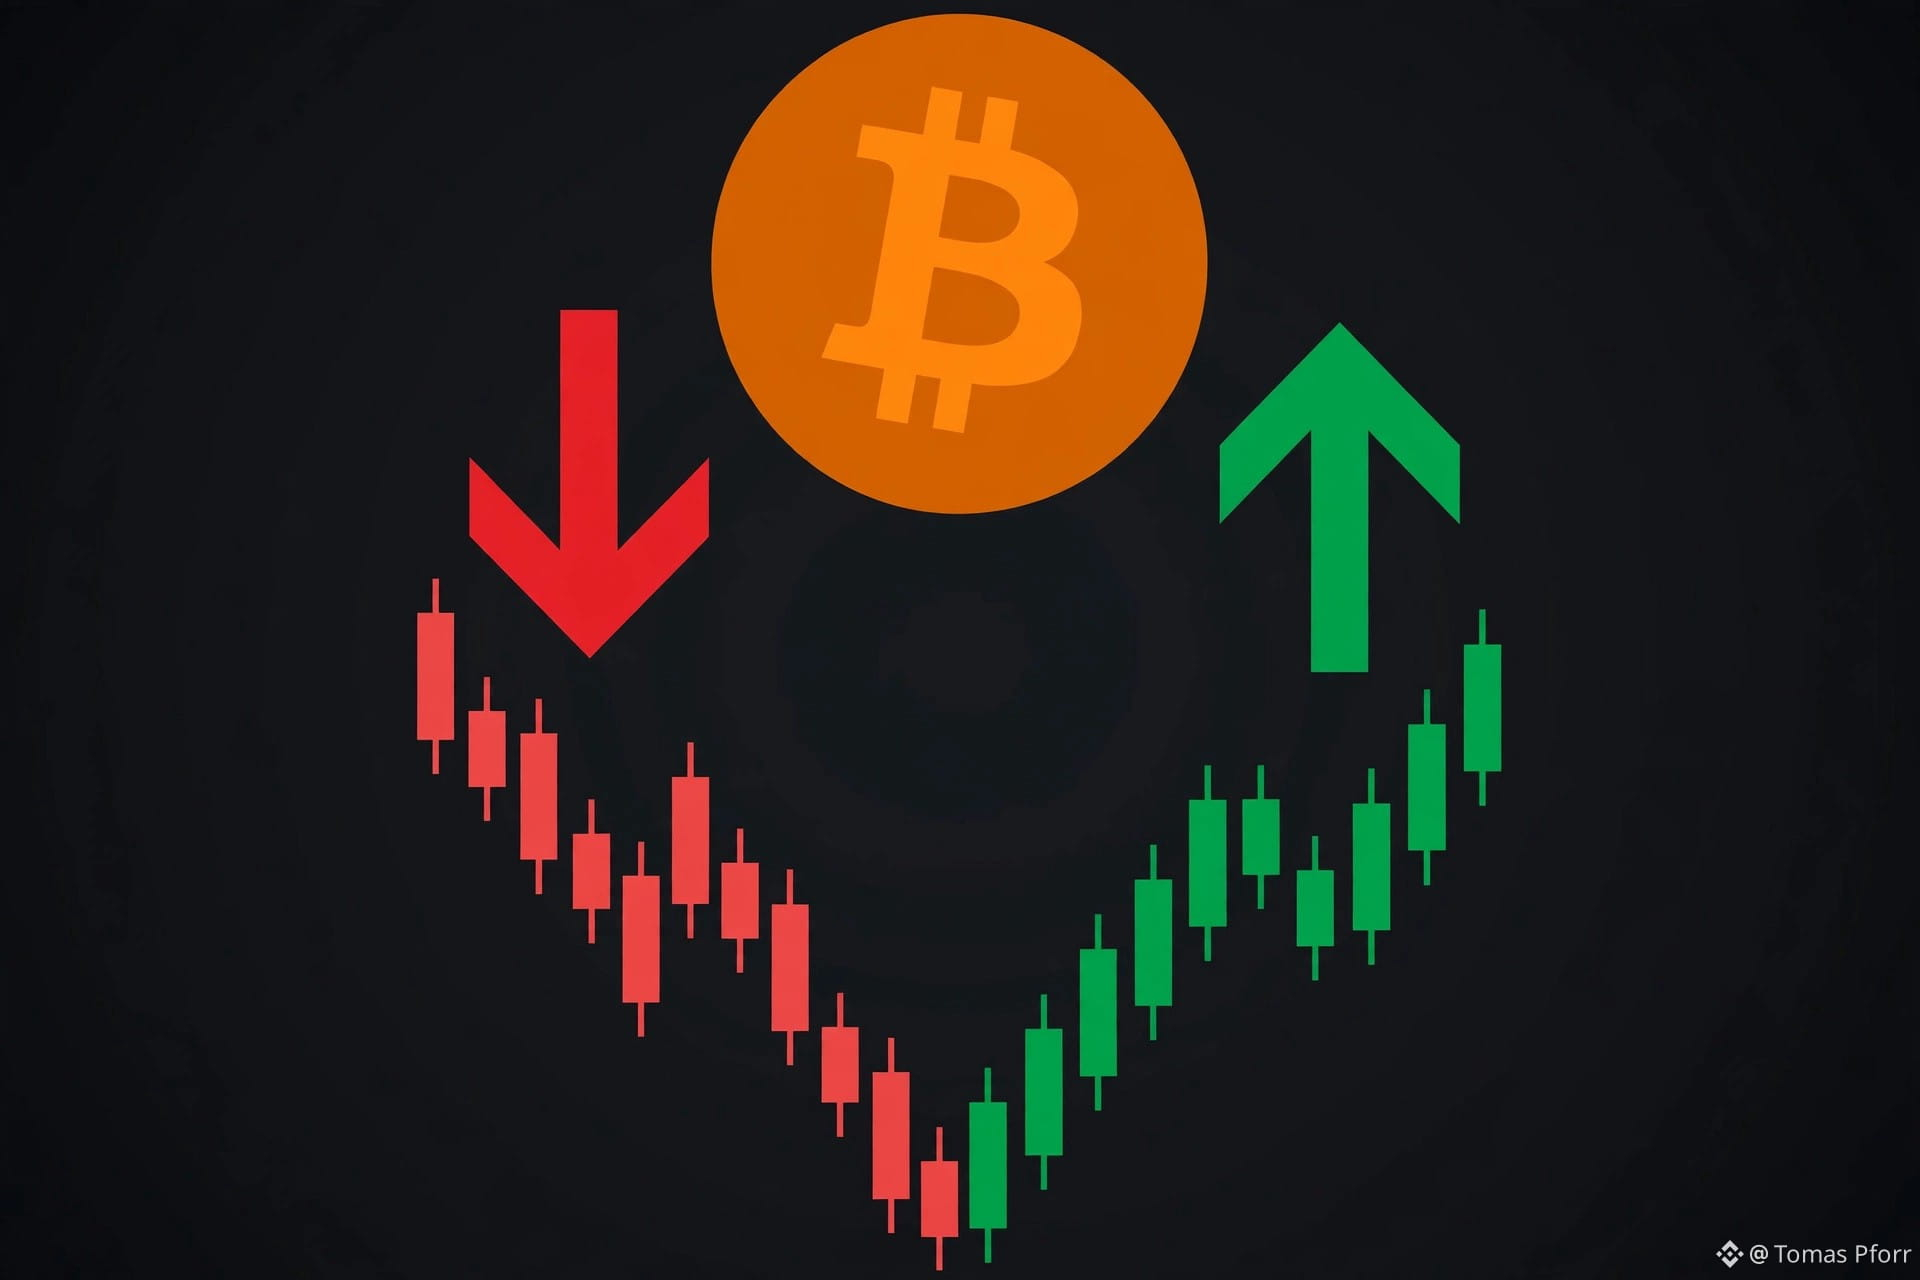
$BTC flushed to $62,000, wiped out $1.31 billion in longs, then clawed back to $65,500. That's not a recovery, that's a bounce in thin air — US stocks are shut, liquidity is thin, and the weekly close tonight decides whether this is a sixth straight red week.
Here's the honest read, and I'm neutral-to-cautious here: the sellers are tired, not beaten. ETF desks pulled $1.07 billion out last week, fear is at 10, and the daily RSI is sitting at 25. Oversold can stay oversold longer than your patience lasts. The one coin refusing to play along is $ZEC, up around 7% near $925 while everything else bled — privacy money is moving while the rest of the board hides.
Two lines matter into Monday. Hold $62,000 and the bounce has legs toward $66,500. Lose it and $60,000 is next, fast. Watch the New York open Monday for the real verdict — Sunday moves lie more often than they tell the truth.
Is $BTC holding $62,000 into the weekly close, or is this bounce just a breather before the next leg down?
Follow me for more on the New York open.
#BTC
$BTC flushed to $62,000, wiped out $1.31 billion in longs, then clawed back to $65,500. That's not a recovery, that's a bounce in thin air — US stocks are shut, liquidity is thin, and the weekly close tonight decides whether this is a sixth straight red week.
Here's the honest read, and I'm neutral-to-cautious here: the sellers are tired, not beaten. ETF desks pulled $1.07 billion out last week, fear is at 10, and the daily RSI is sitting at 25. Oversold can stay oversold longer than your patience lasts. The one coin refusing to play along is $ZEC , up around 7% near $925 while everything else bled — privacy money is moving while the rest of the board hides.
Two lines matter into Monday. Hold $62,000 and the bounce has legs toward $66,500. Lose it and $60,000 is next, fast. Watch the New York open Monday for the real verdict — Sunday moves lie more often than they tell the truth.
Is $BTC holding $62,000 into the weekly close, or is this bounce just a breather before the next leg down?
Follow me for more on the New York open.
#BTC
Here's the honest read, and I'm neutral-to-cautious here: the sellers are tired, not beaten. ETF desks pulled $1.07 billion out last week, fear is at 10, and the daily RSI is sitting at 25. Oversold can stay oversold longer than your patience lasts. The one coin refusing to play along is $ZEC , up around 7% near $925 while everything else bled — privacy money is moving while the rest of the board hides.
Two lines matter into Monday. Hold $62,000 and the bounce has legs toward $66,500. Lose it and $60,000 is next, fast. Watch the New York open Monday for the real verdict — Sunday moves lie more often than they tell the truth.
Is $BTC holding $62,000 into the weekly close, or is this bounce just a breather before the next leg down?
Follow me for more on the New York open.
#BTC
1
224
·
--
Article
What Is a Stop-Loss and How to Set OneA stop-loss is an order you set in advance that tells the exchange to sell your coin if the price falls to a level you choose. It is there to cap a loss before a small dip turns into a big one. You decide the exit while you are calm, so you do not have to make the call while the price is falling and your emotions are doing the thinking.
Once you buy, you pick a trigger price below what you paid. If the market reaches that price, the order switches on and the exchange sells your coins at the best price it can get. There are two common types. A stop-market order sells at the market price once the trigger is hit, so it almost always gets you out, though the final price can be worse than the trigger in a fast move, and much worse if the price gaps down. A stop-limit order only sells at or above a price you set, so you control the price but the sale may not happen at all if the market drops past it too quickly. Most beginners start with a stop-market order because getting out matters more than getting the perfect price. The same setup works on $BNB or any other coin you trade.
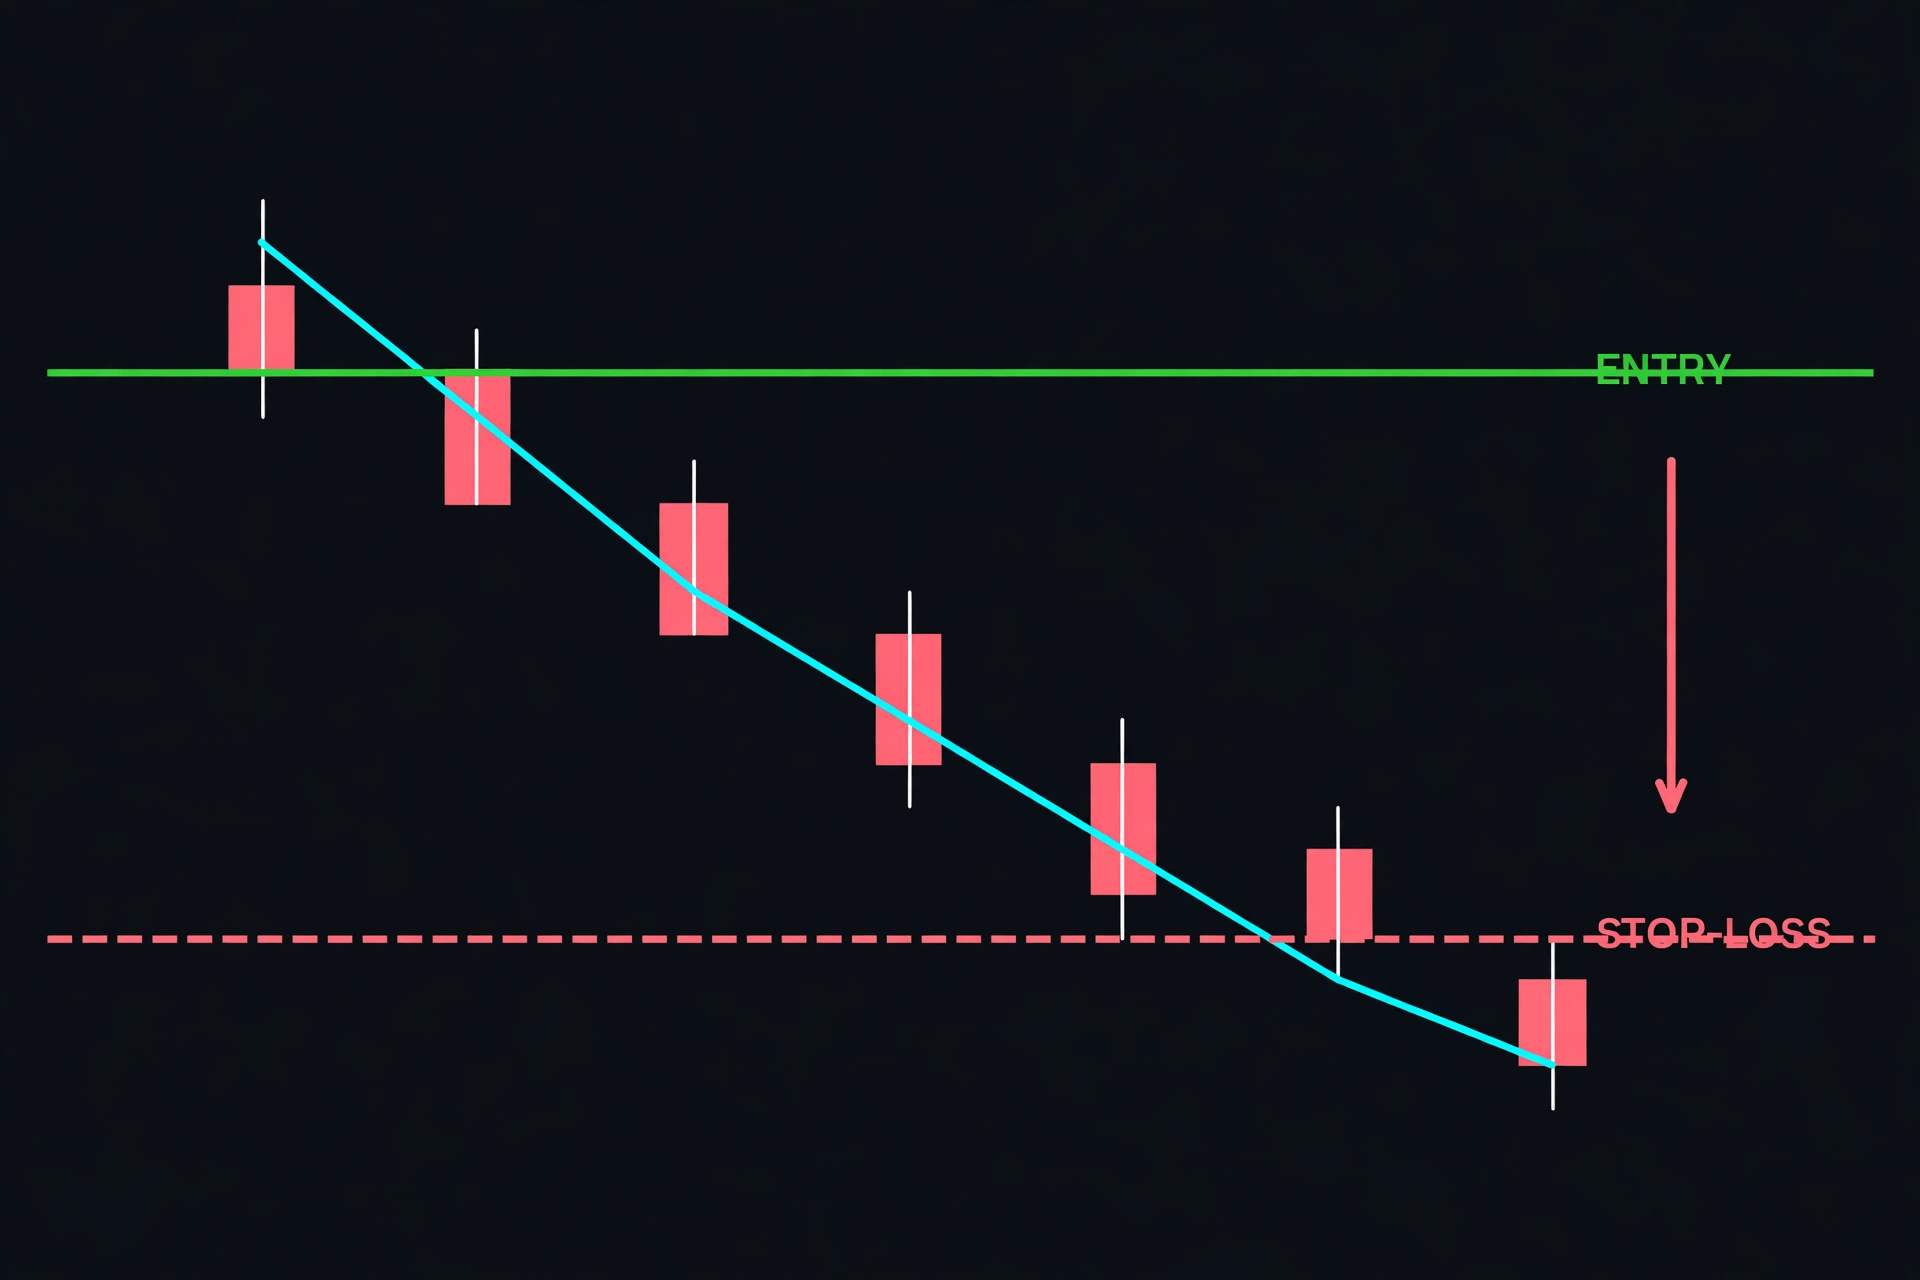
Say you buy $BTC at $100,000 and set a stop-loss at $95,000, five percent below your entry. If the price falls to $95,000, your coins are sold and your loss is about five percent, before fees. Without the stop, the same coin could fall to $80,000 while you wait and hope, and the loss would be four times as large. The stop does not predict the market or stop prices from falling. It limits how much one trade can usually cost you.
A good stop sits where your reason for buying no longer holds. If you bought because the price held above a certain support level, set the stop just below that level. If the price breaks below it, the idea was wrong and it is time to leave. Give the trade room to breathe, too. Crypto moves a lot in a normal day, so a stop placed too close to the current price can be hit by ordinary swings that mean nothing. Many traders also risk only one or two percent of their total funds on a single trade, and use the stop distance to work out how much they can buy.
The most common mistake is setting a stop and then moving it lower when the price gets close to it. That defeats the whole point. The stop was your plan. Moving it because you hope the price will turn around turns a planned small loss into an open-ended one. If the trade hits your stop, accept the loss, step back, and look for the next setup with a clear head.
A stop-loss will not make you money on its own, but it keeps one bad trade from wiping out weeks of good ones. Decide your exit before you enter, place the stop where the idea stops being true, and let it do its job.
What Is a Stop-Loss and How to Set One
A stop-loss is an order you set in advance that tells the exchange to sell your coin if the price falls to a level you choose. It is there to cap a loss before a small dip turns into a big one. You decide the exit while you are calm, so you do not have to make the call while the price is falling and your emotions are doing the thinking.
Once you buy, you pick a trigger price below what you paid. If the market reaches that price, the order switches on and the exchange sells your coins at the best price it can get. There are two common types. A stop-market order sells at the market price once the trigger is hit, so it almost always gets you out, though the final price can be worse than the trigger in a fast move, and much worse if the price gaps down. A stop-limit order only sells at or above a price you set, so you control the price but the sale may not happen at all if the market drops past it too quickly. Most beginners start with a stop-market order because getting out matters more than getting the perfect price. The same setup works on $BNB or any other coin you trade.
Say you buy $BTC at $100,000 and set a stop-loss at $95,000, five percent below your entry. If the price falls to $95,000, your coins are sold and your loss is about five percent, before fees. Without the stop, the same coin could fall to $80,000 while you wait and hope, and the loss would be four times as large. The stop does not predict the market or stop prices from falling. It limits how much one trade can usually cost you.
A good stop sits where your reason for buying no longer holds. If you bought because the price held above a certain support level, set the stop just below that level. If the price breaks below it, the idea was wrong and it is time to leave. Give the trade room to breathe, too. Crypto moves a lot in a normal day, so a stop placed too close to the current price can be hit by ordinary swings that mean nothing. Many traders also risk only one or two percent of their total funds on a single trade, and use the stop distance to work out how much they can buy.
The most common mistake is setting a stop and then moving it lower when the price gets close to it. That defeats the whole point. The stop was your plan. Moving it because you hope the price will turn around turns a planned small loss into an open-ended one. If the trade hits your stop, accept the loss, step back, and look for the next setup with a clear head.
A stop-loss will not make you money on its own, but it keeps one bad trade from wiping out weeks of good ones. Decide your exit before you enter, place the stop where the idea stops being true, and let it do its job.
Once you buy, you pick a trigger price below what you paid. If the market reaches that price, the order switches on and the exchange sells your coins at the best price it can get. There are two common types. A stop-market order sells at the market price once the trigger is hit, so it almost always gets you out, though the final price can be worse than the trigger in a fast move, and much worse if the price gaps down. A stop-limit order only sells at or above a price you set, so you control the price but the sale may not happen at all if the market drops past it too quickly. Most beginners start with a stop-market order because getting out matters more than getting the perfect price. The same setup works on $BNB or any other coin you trade.
Say you buy $BTC at $100,000 and set a stop-loss at $95,000, five percent below your entry. If the price falls to $95,000, your coins are sold and your loss is about five percent, before fees. Without the stop, the same coin could fall to $80,000 while you wait and hope, and the loss would be four times as large. The stop does not predict the market or stop prices from falling. It limits how much one trade can usually cost you.
A good stop sits where your reason for buying no longer holds. If you bought because the price held above a certain support level, set the stop just below that level. If the price breaks below it, the idea was wrong and it is time to leave. Give the trade room to breathe, too. Crypto moves a lot in a normal day, so a stop placed too close to the current price can be hit by ordinary swings that mean nothing. Many traders also risk only one or two percent of their total funds on a single trade, and use the stop distance to work out how much they can buy.
The most common mistake is setting a stop and then moving it lower when the price gets close to it. That defeats the whole point. The stop was your plan. Moving it because you hope the price will turn around turns a planned small loss into an open-ended one. If the trade hits your stop, accept the loss, step back, and look for the next setup with a clear head.
A stop-loss will not make you money on its own, but it keeps one bad trade from wiping out weeks of good ones. Decide your exit before you enter, place the stop where the idea stops being true, and let it do its job.
72
·
--
Another red day, but the tape is trying to tell a different story underneath. $BTC touched a three-month low near $62,000, then bounced about 4.5% off the bottom. It is still down roughly 8% on the day and 15% on the week, so nobody should call this a recovery yet. $BNB is stuck under $600 near $585, and the whole market is swimming in red. The washout is the real story. Nearly $2 billion in liquidations in 24 hours, around 319,000 traders forced out, almost all of them long. That is what happens when everyone is leaning the same way. Fear and Greed is sitting at 10 to 13, deep in extreme fear, and $BTC daily RSI is down near 19.7, which is about as oversold as it gets. The pressure has a source. Spot $BTC ETFs lost about $1.07 billion between 9 and 13 November, the market is pricing an 88.5% chance of a December rate rise, and stablecoin supply is down $11.5 billion in a month. Money is walking out the door. Nothing here says buy the dip with both hands. But a bounce off a three-month low with RSI this stretched is worth watching. If $BTC holds the low 60s and $BNB takes back $600, the tone changes fast. Until then, let the market prove it first.
Another red day, but the tape is trying to tell a different story underneath. $BTC touched a three-month low near $62,000, then bounced about 4.5% off the bottom. It is still down roughly 8% on the day and 15% on the week, so nobody should call this a recovery yet. $BNB is stuck under $600 near $585, and the whole market is swimming in red. The washout is the real story. Nearly $2 billion in liquidations in 24 hours, around 319,000 traders forced out, almost all of them long. That is what happens when everyone is leaning the same way. Fear and Greed is sitting at 10 to 13, deep in extreme fear, and $BTC daily RSI is down near 19.7, which is about as oversold as it gets. The pressure has a source. Spot $BTC ETFs lost about $1.07 billion between 9 and 13 November, the market is pricing an 88.5% chance of a December rate rise, and stablecoin supply is down $11.5 billion in a month. Money is walking out the door. Nothing here says buy the dip with both hands. But a bounce off a three-month low with RSI this stretched is worth watching. If $BTC holds the low 60s and $BNB takes back $600, the tone changes fast. Until then, let the market prove it first.
99
·
--
Red day across the board and nobody got spared. $BTC slid to around $62,600, its lowest since mid-August, down about 8% in a day. $BNB lost the $600 band and is sitting near $570, with $569 as the line to hold and $601 as the ceiling to win back. ETH is under $1,800, SOL down 12%, and the whole market is down close to 6% at $2.3 trillion. The damage is in the liquidations. Over $1.9 billion got wiped out in 24 hours and 93% of it was longs. That is what a crowded long trade looks like when it unwinds. The Fear and Greed index is at 13, deep in extreme fear, and the dollar staying strong with rate-hike talk is doing the pushing. Nothing here says catch the knife. The bounce, if it comes, needs $BTC to hold the low 60s and $BNB to take back $600. Until then the trade is simple: wait for the tape to stop falling, watch the $569 floor on $BNB, and do not chase the first green candle. Red days like this are where patience pays and revenge trading burns accounts.
Red day across the board and nobody got spared. $BTC slid to around $62,600, its lowest since mid-August, down about 8% in a day. $BNB lost the $600 band and is sitting near $570, with $569 as the line to hold and $601 as the ceiling to win back. ETH is under $1,800, SOL down 12%, and the whole market is down close to 6% at $2.3 trillion. The damage is in the liquidations. Over $1.9 billion got wiped out in 24 hours and 93% of it was longs. That is what a crowded long trade looks like when it unwinds. The Fear and Greed index is at 13, deep in extreme fear, and the dollar staying strong with rate-hike talk is doing the pushing. Nothing here says catch the knife. The bounce, if it comes, needs $BTC to hold the low 60s and $BNB to take back $600. Until then the trade is simple: wait for the tape to stop falling, watch the $569 floor on $BNB , and do not chase the first green candle. Red days like this are where patience pays and revenge trading burns accounts.
144
·
--
Horse
Horse

耀元
·
--
#红包 🧧#红包大派送
Good fortune is coming soon, and wealth is coming soon!
The Black Horse Community reports, asking everyone to pay attention!
Distributed USDT red envelopes, wishing everyone success at once and a prosperous Year of the Horse!
Good fortune is coming soon, and wealth is coming soon!
The Black Horse Community reports, asking everyone to pay attention!
Distributed USDT red envelopes, wishing everyone success at once and a prosperous Year of the Horse!


2
·
--
BTC
BTC

熊大Crypto
·
--
$BTC Revealing the core developers behind Satoshi Nakamoto, the 'network plumber' who builds a trillion-dollar ecological bridge with technology
Complete details have been updated to the homepage, looking forward to your review
#BTC #ETH #Web3
Complete details have been updated to the homepage, looking forward to your review
#BTC #ETH #Web3

·
--
btc
btc

Web3-良子
·
--
The Lantern Festival concludes, and red envelopes add to the excitement! Liangzi is giving everyone a 500u red envelope of $BTC ! In 2026, seize the trend and achieve success swiftly. Red envelope pinned, act fast, the account is thriving! 📈
#BTC
#BTC

1
Log in to explore more content
Join global crypto users on Binance Square
⚡️ Get latest and useful information about crypto.
💬 Trusted by the world’s largest crypto exchange.
👍 Discover real insights from verified creators.
Email / Phone number
Trending Topics
A Packed Week of Earnings and Data Tests Markets
53,698 views
362 Discussing
🚨🇺🇸 BIG WEEK AHEAD FOR THE MARKETS!
Markets are pricing in a Fed rate hike in December and $BTC could see some big moves next week.
Here's what's coming:
• Monday: Fed Chair Warsh speaks
• Tuesday: US Retail Sales + $NVDA earnings
• Wednesday: FOMC Minutes
• Thursday: Jobless Claims + Philly Fed Index
• Friday: Consumer Sentiment + Fed speeches
All eyes on $BTC as another important week begins.
#bitcoin
Mookie
·15 Likes
·6.1k views
AnthropicIPOTestsInvestorAppetiteForAI
93,283 views
1,243 Discussing
BitcoinExtendsLosingStreakToSixWeeks
57,329 views
599 Discussing